Attached files
| file | filename |
|---|---|
| 8-K - 8-K - PERDOCEO EDUCATION Corp | d815466d8k.htm |
| EX-99.1 - EX-99.1 - PERDOCEO EDUCATION Corp | d815466dex991.htm |
 CAREER EDUCATION CORPORATION
THIRD QUARTER 2014
INVESTOR CONFERENCE CALL
NOVEMBER 6, 2014
Reid Simpson
Senior Vice President & Chief Financial Officer
Scott Steffey
President & Chief Executive Officer
Exhibit 99.2 |
 Cautionary Statements & Disclosures
2
This presentation contains “forward-looking statements,”
as defined in Section 21E of the Securities Exchange Act of 1934,
as amended, that reflect our current expectations regarding our future
growth, results of operations, cash flows, performance and
business prospects and opportunities, as well as assumptions made by, and information currently
available to, our management. We have tried to identify
forward-looking statements by using words such as “projected,”
“believe,” “anticipate,” “will,”
“expect,” “estimate,” “continue to” and similar expressions, but these words are not the
exclusive means of identifying forward-looking statements. These
statements are based on information currently available to us
and are subject to various risks, uncertainties, and other factors, including, but not limited to, those discussed in Item
1A,“Risk Factors” of our Annual Report on Form 10-K for
the year ended December 31, 2013 that could cause our actual
growth, results of operations, financial condition, cash flows,
performance and business prospects and opportunities to differ
materially from those expressed in, or implied by, these statements. Except as expressly required by the federal
securities laws, we undertake no obligation to update such factors or
any of the forward-looking statements to reflect future
events, developments, or changed circumstances or for any other
reason. Certain financial information is presented on a
non-GAAP basis. The Company believes it is useful to present non-GAAP
financial measures which exclude certain significant items as a means
to understand the performance of its ongoing operations.
As a general matter, the Company uses non-GAAP financial measures in conjunction with results presented in
accordance with GAAP to help analyze the performance of its core
business, assist with preparing the annual operating plan, and
measure performance for some forms of compensation. In addition, the Company believes that non-GAAP
financial information is used by analysts and others in the investment
community to analyze the Company's historical results and to
provide estimates of future performance and that failure to report non-GAAP measures could result in a
misplaced perception that the Company's results have
underperformed or exceeded expectations. The most directly
comparable GAAP information and a reconciliation between the
non-GAAP and GAAP figures are provided at the end of this
presentation, and this presentation (including the reconciliation) has been posted to our website.
|
 3
Strengthen Academic Outcomes, Enhance Regulatory
Compliance and Simplify Business Model
Strengthen Academic Outcomes
•
Intellipath
adaptive learning tool is driving students to engage more in their
learning.
•
Significant increase in student pass rates.
Enhance Regulatory Compliance
•
Higher Learning Commission continued the regional accreditation of CTU and
AIU.
•
160 basis point improvement in 2011 consolidated cohort default rate (vs.
2010).
•
All of our 32 ACICS-accredited campuses not in teach-out reported placement
rates greater than the compliance threshold of 60 percent; 26 met or exceeded
the higher benchmark rate of 70 percent.
Simplify Business Model
•
Divested International Schools and consolidated Career College brands.
•
Opportunities to better integrate operations. |
 Sequential Improvement in Decline of Total Student
Enrollments -
University
4
Q3
‘13
Q4
‘13
Q1
‘14
Q2
’14
Q3
‘14 |
 5
Total Student Enrollments -
University
31,300
32,500
32,400
33,900
30,600
(1) AIU had three start dates in 1Q 2014 and two start dates in 2Q 2014 which explains why
there is a spike in total enrollments in 1Q 2014 and a corresponding decrease in 2Q
2014. All other periods each had two AIU start dates.
|
 6
Total Student Enrollments –
University (Online Only)
28,300
28,700
28,600
30,200
28,600
(1) AIU had three start dates in 1Q 2014 and two start dates in 2Q 2014 which explains why
there is a spike in total enrollments in 1Q 2014 and a corresponding decrease in 2Q
2014. All other periods each had two AIU start dates.
|
 7
Total Student Enrollments –
Career Schools
19,200
17,900
19,100
16,600
20,100
(1) Culinary Arts had a shift in start dates as compared to the prior year, therefore Q3 2014
had an additional start which was reflected in Q4 2013 in the prior year.
|
 8
Reduce Organizational Cost Structure –
Progress Underway
$1,542
$1,272
Reduced by
$212 million
Operating Expenses ($ millions)
FY 2012 & FY 2013 data as reported in the Company’s 2013 10-K and based on
schools that were in continuing operations at 12/31/13. YTD 3Q 2013 and YTD 3Q
2014 data as reported in the Company’s 3Q 2014 10-Q and based on schools that were in continuing operations
at 9/30/14.
$899
$814
Reduced by
$80 million |
 9
Phase Down of Transitional School Campuses
(1) Taught out 3 campuses and announced 3 additional campuses for teach-out during 3Q
2014 |
 10
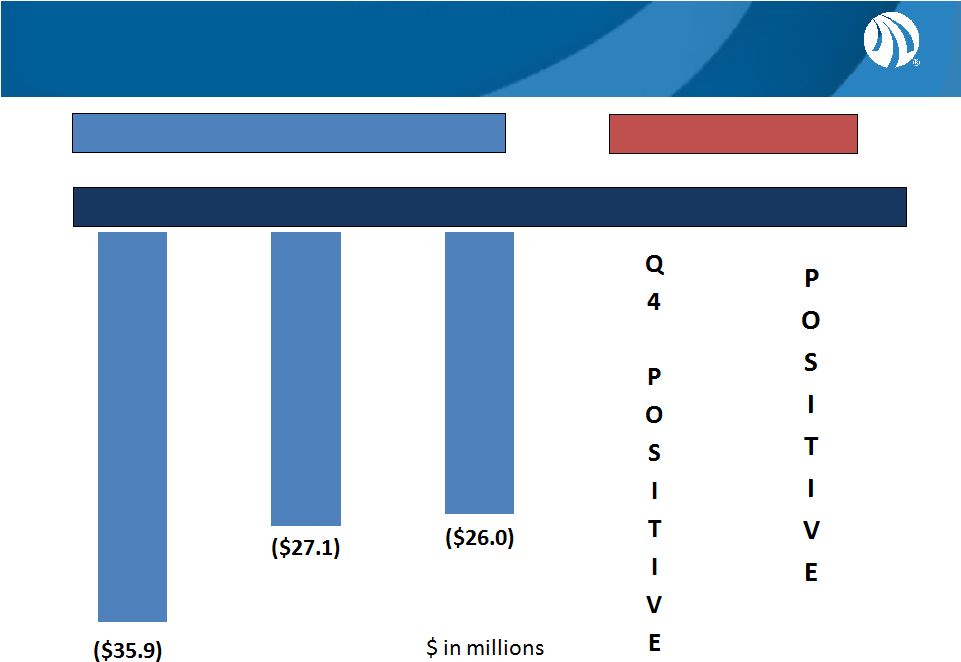
Adjusted EBITDA –
Ongoing Operations
Q1
‘14
Q2
‘14
Q3
‘14
Q4
’14
FY
‘15
ACTUALS
PROJECTED
Trailing Twelve Months Adjusted EBITDA
Numbers exclude significant items (including Transitional Schools) as disclosed in the
Non-GAAP reconciliation at the end of these slides. |
 11
Adjusted EBITDA –
Transitional & Discontinued Operations
Q1
‘14
Q2
‘14
Q3
‘14
Q4
’14
FY
‘15
ACTUALS
PROJECTED
Numbers exclude significant items (including International segment) as disclosed in the
Non-GAAP reconciliation at the end of these slides. |
 12
Future Lease Obligations are Declining
(1)
Lease obligations are inclusive of rent payments but exclude operating expenses.
(2)
Amounts provided are for the full year of 2014.
(3)
Amounts provided are for executed sublease agreements.
2014
(2)
2015
2016
2017
2018
2019
2020
&
Thereafter
Total
Gross operating lease obligations
(1)
Ongoing operations
61,024
$
60,148
$
55,194
$
46,199
$
45,203
$
35,389
$
43,985
$
347,142
$
Transitional & Discontinued operations
38,024
$
31,541
$
24,045
$
21,357
$
14,122
$
6,516
$
2,863
$
138,468
$
Total gross operating lease obligations
99,048
$
91,689
$
79,239
$
67,556
$
59,325
$
41,905
$
46,848
$
485,610
$
Sublease income
Ongoing operations
2,245
$
4,227
$
2,936
$
2,812
$
2,466
$
1,821
$
1,068
$
17,575
$
Transitional & Discontinued operations
1,145
$
4,737
$
4,510
$
4,190
$
145
$
-
$
-
$
14,727
$
Total sublease income
3,390
$
8,964
$
7,446
$
7,002
$
2,611
$
1,821
$
1,068
$
32,302
$
Net operating lease obligations
Ongoing operations
58,779
$
55,921
$
52,258
$
43,387
$
42,737
$
33,568
$
42,917
$
329,567
$
Transitional & Discontinued operations
36,879
$
26,804
$
19,535
$
17,167
$
13,977
$
6,516
$
2,863
$
123,741
$
Total net contractual lease obligations
95,658
$
82,725
$
71,793
$
60,554
$
56,714
$
40,084
$
45,780
$
453,308
$
(3) |
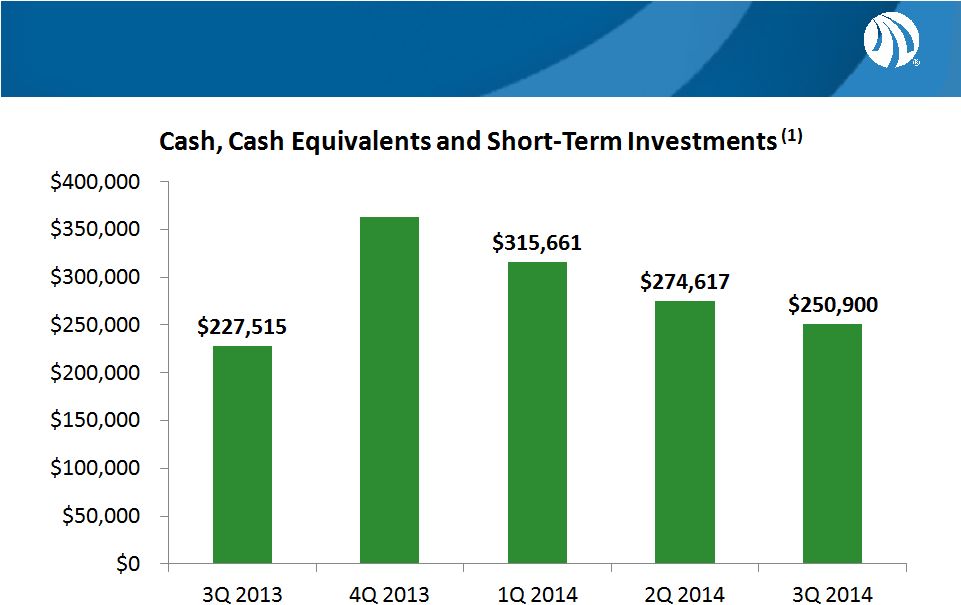 13
Strong Cash Position
(1) Balances presented above are quarter end balances and include both Continuing and
Discontinued Operations. In (000’s)
(2) The increase in 4Q 2013 is attributed to proceeds from the sale of the
Company’s International segment. $363,099
(2) |
 14
Reconciliation of GAAP to Non-GAAP Items
Adjusted EBITDA
Q3 2014
Q2 2014
Q1 2014
Q4 2013
Q3 2013
Ongoing Operations:
Pre-tax loss from continuing operations
(44,787)
$
(31,984)
$
(39,930)
$
(43,458)
$
(54,989)
$
Transitional Schools operating loss
11,390
9,642
8,259
12,944
10,099
Interest (income) expense, net
(120)
(177)
(25)
65
15
Loss (gain) on sale of business
-
-
-
(68)
39
Depreciation and amortization
(3)
11,950
12,554
13,029
13,661
13,990
Stock-based compensation
(3)
950
1,020
1,341
1,580
1,713
Legal settlements
(3) (4)
-
1,600
5,850
17,000
300
14,396
7,403
74
3,050
11,513
(226)
(879)
(606)
(2,924)
1,184
(8,588)
-
-
-
-
Adjusted EBITDA--Ongoing Operations
(2)
(15,035)
$
(821)
$
(12,008)
$
1,850
$
(16,136)
$
Adjusted EBITDA per diluted share
(0.22)
$
(0.01)
$
(0.18)
$
0.03
$
(0.24)
$
Memo: Advertising Expenses
(3)
69,875
$
56,224
$
69,379
$
56,077
$
70,936
$
Pre-tax (loss) income from discontinued operations
(2,065)
$
(12,726)
$
(17,993)
$
117,272
$
(21,712)
$
Transitional Schools operating loss
(11,390)
(9,642)
(8,259)
(12,944)
(10,099)
Loss (gain) on sale of business
(8)
-
311
-
(130,109)
-
International Schools operating (income) loss
(7)
-
-
-
(11,434)
7,608
Interest (income) expense, net
-
-
-
(51)
(21)
Depreciation and amortization
(8)
1,191
1,840
2,402
2,765
2,961
Legal settlements
(8)
225
-
-
-
-
89
51
(7)
3,933
72
(3,485)
1,436
3,099
5,766
(3,092)
Adjusted EBITDA--Transitional and Discontinued Operations
(2)
(15,435)
$
(18,730)
$
(20,758)
$
(24,802)
$
(24,283)
$
Adjusted EBITDA per diluted share
(0.23)
$
(0.28)
$
(0.31)
$
(0.37)
$
(0.36)
$
CAREER EDUCATION CORPORATION AND SUBSIDIARIES
UNAUDITED RECONCILIATION OF GAAP TO NON-GAAP ITEMS
(1)
(In thousands, except per share amounts)
Insurance recovery
Asset impairments
(3) (5)
Unused space charges
(3) (6)
Asset impairments
(8)
Unused space charges
(6) (8)
Transitional Schools and Discontinued Operations:
|
 15
Reconciliation of GAAP to Non-GAAP Items –
con’t
(1)
(2)
(3)
(4)
Q3 2014
Q2 2014
Q1 2014
Q4 2013
Q3 2013
CTU
-
$
-
$
(900)
$
1,300
$
-
$
Career Colleges
-
-
-
200
300
Culinary Arts
-
2,000
3,000
15,500
-
Corporate & Other
-
(400)
3,750
-
-
Total
-
$
1,600
$
5,850
$
17,000
$
300
$
(5)
(6)
(7)
(8)
The Company believes it is useful to present non-GAAP financial
measures which exclude certain significant items as a means to understand the performance of its ongoing operations. As a general matter, the
Company uses non-GAAP financial measures in conjunction with
results presented in accordance with GAAP to help analyze the performance of its ongoing operations, assist with preparing the annual operating
plan, and measure performance for some forms of compensation. In
addition, the Company believes that non-GAAP financial information is used by analysts and others in the investment community to analyze the
Company's historical results and to provide estimates of future
performance and that failure to report non-GAAP measures could result in a misplaced perception that the Company's results have underperformed or
exceeded expectations.
We believe Adjusted EBITDA allows us to compare our current operating
results with corresponding historical periods and with the operational performance of other companies in our industry because it does not
give effect to potential differences caused by items we do not consider
reflective of underlying operating performance. We also present Adjusted EBITDA because we believe it is frequently used by securities
analysts, investors and other interested parties as a measure of
performance. In evaluating Adjusted EBITDA, investors should be aware that in the future we may incur expenses similar to the adjustments presented
above. Our presentation of Adjusted EBITDA should not be construed as
an inference that our future results will be unaffected by expenses that are unusual, non-routine or non-recurring. Adjusted EBITDA has
limitations as an analytical tool, and you should not consider it in
isolation, or as a substitute for net income (loss), operating income (loss), or any other performance measure derived in accordance and reported
under GAAP or as an alternative to cash flow from operating activities
or as a measure of our liquidity. Non-GAAP financial
measures when viewed in a reconciliation to corresponding GAAP financial measures, provides an additional way of viewing the Company's results of operations and the factors and trends
affecting the Company's business. Non-GAAP financial measures
should be considered as a supplement to, and not as a substitute for, or superior to, the corresponding financial results presented in accordance with
GAAP.
Management assesses results of operations for ongoing operations, which
excludes Transitional Schools, separately from Transitional Schools. As schools within the Transitional Schools segment are fully taught-out,
these schools will be recast as components of Discontinued Operations.
As a result, management views adjusted EBITDA from ongoing operations separately from Transitional Schools and Discontinued Operations
to assess results and make decisions. Accordingly, Transitional
Schools operating loss is added back to pre-tax loss from continuing operations and subtracted from pre-tax loss from discontinued operations.
Quarterly amounts relate to ongoing operations, which excludes
Transitional Schools. Legal settlement amounts are net of
insurance recoveries and are recorded within the following segments:
Asset impairments primarily relate to impairment charges within
Culinary Arts of $1.5 million, $7.4 million and $10.7 million which were recorded during the third quarter of 2014, second quarter of
2014 and third quarter of 2013, respectively, and within Career
Colleges of $12.8 million and $2.9 million recorded during the third quarter of 2014 and the fourth quarter of 2013, respectively.
Unused space charges represent the net present value of remaining lease
obligations less an estimated amount for sublease income as well as the subsequent accretion of these charges.
The International Schools segment was sold during the fourth quarter of
2013. As such, management excludes operations from the International Schools when assessing results and trends of Transitional Schools and
Discontinued Operations.
Quarterly amounts relate to Transitional Schools and Discontinued
Operations, excluding International. |
 16
End of Presentation |