Attached files
| file | filename |
|---|---|
| EX-21 - EX-21 - PERDOCEO EDUCATION Corp | d824438dex21.htm |
| EX-4.4 - EX-4.4 - PERDOCEO EDUCATION Corp | d824438dex44.htm |
| EX-32.2 - EX-32.2 - PERDOCEO EDUCATION Corp | d824438dex322.htm |
| EX-23.1 - EX-23.1 - PERDOCEO EDUCATION Corp | d824438dex231.htm |
| EX-31.1 - EX-31.1 - PERDOCEO EDUCATION Corp | d824438dex311.htm |
| EX-32.1 - EX-32.1 - PERDOCEO EDUCATION Corp | d824438dex321.htm |
| EX-31.2 - EX-31.2 - PERDOCEO EDUCATION Corp | d824438dex312.htm |
| EX-10.12 - EX-10.12 - PERDOCEO EDUCATION Corp | d824438dex1012.htm |
| EX-10.13 - EX-10.13 - PERDOCEO EDUCATION Corp | d824438dex1013.htm |
| EXCEL - IDEA: XBRL DOCUMENT - PERDOCEO EDUCATION Corp | Financial_Report.xls |
Table of Contents
SECURITIES AND EXCHANGE COMMISSION
Washington, D.C. 20549
FORM 10-K
(Mark One)
| x | ANNUAL REPORT PURSUANT TO SECTION 13 OR 15(D) OF THE SECURITIES EXCHANGE ACT OF 1934 |
For the fiscal year ended December 31, 2014
or
| ¨ | TRANSITION REPORT PURSUANT TO SECTION 13 OR 15(D) OF THE SECURITIES EXCHANGE ACT OF 1934 |
For the transition period from to
Commission File Number 0-23245
CAREER EDUCATION CORPORATION
(Exact name of Registrant as specified in its charter)
| Delaware | 36-3932190 | |
| (State of or other jurisdiction of incorporation or organization) |
(I.R.S. Employer Identification No.) | |
| 231 N. Martingale Road Schaumburg, Illinois |
60173 | |
| (Address of principal executive offices) | (zip code) |
Registrant’s telephone number, including area code: (847) 781-3600
Securities registered pursuant to Section 12(b) of the Act:
| Common Stock, $0.01 par value | Nasdaq Global Select Market | |
| (Title of Class) | (Name of Exchange on which Registered) |
Securities registered pursuant to Section 12(g) of the Act: None
Indicate by check mark whether the Registrant is a well-known seasoned issuer, as defined in Rule 405 of the Securities Act of 1933. Yes ¨ No x
Indicate by check mark if the Registrant is not required to file reports pursuant to Section 13 or 15(d) of the Securities Exchange Act of 1934. Yes ¨ No x
Indicate by check mark whether the Registrant (1) has filed all reports required to be filed by Section 13 or 15(d) of the Securities Exchange Act of 1934 during the preceding 12 months (or for such shorter period that the Registrant was required to file such reports), and (2) has been subject to such filing requirements for the past 90 days. Yes x No ¨
Indicate by check mark whether the registrant has submitted electronically and posted on its corporate website, if any, every Interactive Data File required to be submitted and posted pursuant to Rule 405 of Regulation S-T during the preceding 12 months (or for such shorter period that the registrant was required to submit and post such files). Yes x No ¨
Indicate by check mark if disclosure of delinquent filers pursuant to Item 405 of Regulation S-K is not contained herein, and will not be contained, to the best of Registrant’s knowledge, in definitive proxy or information statements incorporated by reference in Part III of this Form 10-K or any amendment to this Form 10-K. x
Indicate by check mark whether the registrant is a large accelerated filer, an accelerated filer, a non-accelerated filer or a smaller reporting company. See the definitions of “large accelerated filer,” “accelerated filer” and “smaller reporting company” in Rule 12b-2 of the Exchange Act.
| Large accelerated filer ¨ | Accelerated filer x | Non-accelerated filer ¨ | Smaller reporting company ¨ | |||
| (Do not check if a smaller reporting company) |
Indicate by check mark whether the Registrant is a shell company, as defined in Rule 12b-2 of the Securities Exchange Act of 1934. Yes ¨ No x
The aggregate market value of the Registrant’s voting common stock held by non-affiliates of the Registrant, based upon the $4.68 per share closing sale price of the Registrant’s common stock on June 30, 2014 (the last business day of the Registrant’s most recently completed second quarter), was approximately $277,781,000. For purposes of this calculation, the Registrant’s directors, executive officers and 10% or greater stockholders have been assumed to be affiliates. This assumption of affiliate status is not necessarily a conclusive determination for other purposes. As of February 20, 2015, the number of outstanding shares of Registrant’s common stock was 67,519,701.
Portions of the Registrant’s Notice of Annual Meeting and Proxy Statement for the Registrant’s 2015 Annual Meeting of Stockholders are incorporated by reference into Part III of this Report.
Table of Contents
CAREER EDUCATION CORPORATION
FORM 10-K
| Page | ||||||
| PART I |
||||||
| ITEM 1. |
1 | |||||
| ITEM 1A. |
37 | |||||
| ITEM 1B. |
53 | |||||
| ITEM 2. |
53 | |||||
| ITEM 3. |
54 | |||||
| ITEM 4. |
54 | |||||
| PART II |
||||||
| ITEM 5. |
55 | |||||
| ITEM 6. |
58 | |||||
| ITEM 7. |
MANAGEMENT’S DISCUSSION AND ANALYSIS OF FINANCIAL CONDITION AND RESULTS OF OPERATIONS |
60 | ||||
| ITEM 7A. |
85 | |||||
| ITEM 8. |
85 | |||||
| ITEM 9. |
CHANGES IN AND DISAGREEMENTS WITH ACCOUNTANTS ON ACCOUNTING AND FINANCIAL DISCLOSURE |
85 | ||||
| ITEM 9A. |
86 | |||||
| ITEM 9B. |
87 | |||||
| PART III |
||||||
| ITEM 10. |
88 | |||||
| ITEM 11. |
88 | |||||
| ITEM 12. |
SECURITY OWNERSHIP OF CERTAIN BENEFICIAL OWNERS AND MANAGEMENT AND RELATED STOCKHOLDER MATTERS |
89 | ||||
| ITEM 13. |
CERTAIN RELATIONSHIPS AND RELATED TRANSACTIONS, AND DIRECTOR INDEPENDENCE |
89 | ||||
| ITEM 14. |
89 | |||||
| PART IV |
||||||
| ITEM 15. |
90 | |||||
| 91 | ||||||
Table of Contents
PART I
Cautionary Note Regarding Forward-Looking Statements
This Annual Report on Form 10-K contains “forward-looking statements,” as defined in Section 21E of the Securities Exchange Act of 1934, as amended, that reflect our current expectations regarding our future growth, results of operations, cash flows, performance and business prospects and opportunities, as well as assumptions made by, and information currently available to, our management. We have tried to identify forward-looking statements by using words such as “anticipate,” “believe,” “expect,” “estimate,” “trend,” “will,” “continue to” and similar expressions, but these words are not the exclusive means of identifying forward-looking statements. These statements are based on information currently available to us and are subject to various risks, uncertainties, and other factors, including, but not limited to, those discussed herein under the caption “Risk Factors” that could cause our actual growth, results of operations, financial condition, cash flows, performance, business prospects and opportunities to differ materially from those expressed in, or implied by, these statements. Except as expressly required by the federal securities laws, we undertake no obligation to update such factors or to publicly announce the results of any of the forward-looking statements contained herein to reflect future events, developments, or changed circumstances or for any other reason.
| ITEM 1. | BUSINESS |
Career Education Corporation (“CEC”) was incorporated in Delaware in 1994. When used in this Annual Report on Form 10-K, the terms “we,” “us,” “our,” “the Company” and “CEC” refer to Career Education Corporation and our wholly-owned subsidiaries. The terms “college,” “institution,” and “university” each refer to an individual, branded, proprietary educational institution owned by us and includes its campus locations. The term “campus” refers to an individual main or branch campus operated by one of our colleges, institutions or universities.
BUSINESS OVERVIEW
The colleges, institutions and universities that are part of the CEC family offer high-quality education to a diverse student population in a variety of career-oriented disciplines through online, on-ground and hybrid learning program offerings. In addition to its online offerings, Career Education serves students from campuses throughout the United States, offering programs that lead to doctoral, master’s, bachelor’s and associate degrees, as well as to diplomas and certificates.
Our institutions include both universities that provide degree programs through the master or doctoral level and colleges that provide programs through the associate and bachelor level. The University group includes American InterContinental University (“AIU”) and Colorado Technical University (“CTU”) – predominantly serving students online with career-focused degree programs that meet the educational demands of today’s busy adults. Our Career Colleges offer career-centered education primarily through ground-based campuses and includes Briarcliffe College, Brooks Institute, Harrington College of Design, Missouri College and Sanford-Brown Institutes and Colleges (“SBI” and “SBC,” respectively). Through our colleges, institutions and universities, we are committed to providing high-quality education, enabling students to graduate and pursue rewarding career opportunities.
Our website address is www.careered.com. The website includes a detailed listing of individual campus locations and web links to our colleges, institutions and universities.
Our segments are determined in accordance with Financial Accounting Standards Board (“FASB”) Accounting Standards Codification (“ASC”) Topic 280 – Segment Reporting and are based upon how the Company analyzes performance and makes decisions. Each segment represents a group of postsecondary education providers that offer a variety of degree and non-degree academic programs. These segments are organized by key market segments to enhance brand focus and operational alignment within each segment to more effectively execute our strategic plan.
1
Table of Contents
During the fourth quarter of 2014, we made the decision to commit to a plan to sell our Culinary Arts campuses (“LCB”). Accordingly, the results of operations for the LCB campuses are now reported within discontinued operations as of December 31, 2014. All prior period results have been recast to reflect our reporting segments on a comparable basis.
Our four reporting segments are described below.
University Group:
Colorado Technical University (CTU) places a strong focus on providing industry-relevant degree programs to meet the needs of our students for employment and of employers for a well-educated workforce and collectively offers academic programs in the career-oriented disciplines of business studies, information systems and technologies, criminal justice, computer science and engineering, and health sciences. Students pursue their degrees through local campuses, fully-online programs through CTU Online and blended formats, which combine campus-based and online education. As of December 31, 2014, students enrolled at CTU represented approximately 49% of our total enrollments. Approximately 90% of CTU’s enrollments are fully online.
American InterContinental University (AIU) focuses on helping busy professionals get the degree they need to move forward in their career as efficiently as possible and collectively offers academic programs in the career-oriented disciplines of business studies, information technologies, criminal justice and design technologies. Students pursue their degrees through local campuses, fully-online programs through AIU Online and blended formats, which combine campus-based and online education. As of December 31, 2014, students enrolled at AIU represented approximately 28% of our total enrollments. Approximately 90% of AIU’s enrollments are fully online.
Career Colleges Group includes Briarcliffe College, Brooks Institute, Harrington College of Design, Missouri College and our Sanford-Brown institutions. The Career Colleges group collectively offers academic programs primarily in the career-oriented discipline of health education complemented by certain programs in business studies and information technology, as well as visual communications, fashion design, photography, interior design, graphic design and video production. Students pursue their degrees through local campuses, fully-online programs through SBC Online and blended formats, which combine campus-based and online education. As of December 31, 2014, students enrolled within our Career Colleges represented approximately 21% of our total enrollments. Approximately 15% of Career Colleges’ enrollments are fully online.
Transitional Group includes our campuses that are currently being taught out. See the “Campus Locations” table below for a listing of campuses that comprise this segment. These campuses employ a gradual teach-out process, enabling them to continue to operate while current students complete their course of study; they no longer enroll new students. The 12 remaining campuses within the Transitional Group as of December 31, 2014 will complete their teach-outs with varying dates through 2017.
During 2014, we announced the teach-out of three additional campuses within our Career Colleges segment. These campuses are now included within our Transitional Group segment. In addition, during 2014 we completed the teach-out of 21 campuses, and accordingly, the results of operations for these campuses are now reported within discontinued operations. All prior period results have been recast to reflect our reporting segments on a comparable basis.
Revenues, operating income (loss) and total assets by reporting segment for each of the past three fiscal years are included in Note 17 “Segment Reporting” of the notes to our consolidated financial statements.
2
Table of Contents
CAMPUS LOCATIONS
Our operating segments, colleges and universities are summarized in the following table:
| Colleges and Universities Campus Locations |
Website | |||
| AMERICAN INTERCONTINENTAL UNIVERSITY (“AIU”): |
www.aiuniv.edu | |||
| AIU Atlanta, Atlanta, GA |
||||
| AIU Houston, Houston, TX |
||||
| AIU Online, Schaumburg, IL |
||||
| AIU South Florida, Weston, FL |
||||
| COLORADO TECHNICAL UNIVERSITY (“CTU”): |
www.coloradotech.edu | |||
| CTU Colorado Springs, Colorado Springs, CO |
||||
| CTU Denver, Denver, CO |
||||
| CTU Online, Colorado Springs, CO |
||||
| CAREER COLLEGES: |
||||
| Briarcliffe College |
www.briarcliffe.edu | |||
| Briarcliffe College, Bethpage, NY (includes Online) |
||||
| Briarcliffe College, Patchogue, NY |
||||
| Brooks Institute, Ventura and Santa Barbara, CA |
www.brooks.edu | |||
| Harrington College of Design, Chicago, IL |
www.harrington.edu | |||
| Missouri College, Brentwood, MO |
www.missouricollege.edu | |||
| Sanford-Brown College and Institute (“SBC” and “SBI”): |
www.sanfordbrown.edu | |||
| SBC Atlanta, Atlanta, GA |
||||
| SBC Brooklyn Center, Brooklyn Center, MN |
||||
| SBC Dallas, Dallas, TX |
||||
| SBC Fort Lauderdale, Fort Lauderdale, FL |
||||
| SBC Houston, Houston, TX |
||||
| SBC Jacksonville, Jacksonville, FL |
||||
| SBC Mendota Heights, Mendota Heights, MN |
||||
| SBC Online, Tampa, FL |
||||
| SBC San Antonio, San Antonio, TX |
||||
| SBC Seattle, Seattle, WA |
||||
| SBC Tampa, Tampa, FL |
||||
| SBI Garden City, Garden City, NJ |
||||
| SBI Iselin, Iselin, NJ |
||||
| SBI New York, New York City, NY |
||||
| SBI Campus—an affiliate of Sanford-Brown, Melville, NY |
www.sbmelville.edu | |||
| TRANSITIONAL GROUP: |
||||
| Collins College, Phoenix, AZ |
www.collinscollege.edu | |||
| Colorado Technical University (“CTU”) |
www.coloradotech.edu | |||
| CTU Sioux Falls, Sioux Falls, SD |
||||
3
Table of Contents
| Colleges and Universities Campus Locations |
Website | |||
| International Academy of Design & Technology (“IADT) |
www.iadt.edu | |||
| IADT Detroit, Troy, MI |
||||
| IADT Nashville, Nashville, TN |
||||
| IADT Sacramento, Sacramento, CA |
||||
| Sanford-Brown College and Institute (“SBC” and “SBI”) |
www.sanford-brown.edu | |||
| SBC Chicago, Chicago, IL |
||||
| SBC Cleveland, Middleburg Heights, OH |
||||
| SBC Fenton, Fenton, MO |
||||
| SBC Las Vegas, Henderson, NV |
||||
| SBC Orlando, Orlando, FL |
||||
| SBC Tysons Corner, McLean, VA |
||||
| SBI White Plains, White Plains, NY |
||||
| ASSETS HELD FOR SALE: |
||||
| Le Cordon Bleu of Culinary Arts (“LCB”) |
www.chefs.edu | |||
| LCB Atlanta, Tucker, GA |
||||
| LCB Austin, Austin, TX |
||||
| LCB Boston, Cambridge, MA |
||||
| LCB Chicago, Chicago, IL |
||||
| LCB Dallas, Dallas, TX |
||||
| LCB Las Vegas, Las Vegas, NV |
||||
| LCB Los Angeles, Pasadena, CA |
||||
| LCB Miami, Miramar, FL |
||||
| LCB Minneapolis/St. Paul, Mendota Heights, MN |
||||
| LCB Orlando, Orlando, FL |
||||
| LCB Portland, Portland, OR |
||||
| LCB Sacramento, Sacramento, CA |
||||
| LCB San Francisco, San Francisco, CA |
||||
| LCB Scottsdale (includes Online), Scottsdale, AZ |
||||
| LCB Seattle, Tukwila, WA |
||||
| LCB St. Louis, St. Peters, MO |
||||
INDUSTRY BACKGROUND AND COMPETITION
The postsecondary education industry is highly fragmented and increasingly competitive, with no one provider controlling a significant market share. Students choose among providers based on programs and degrees offered, program flexibility and convenience, quality of instruction, placement rates, reputation, recruiting effectiveness and cost. Such multi-faceted market fragmentation results in significant differentiation among various education providers.
According to the National Center for Education Statistics (“NCES”), there were approximately 7,400 Title IV eligible postsecondary education institutions in the United States for the academic year 2013-14, including approximately 3,500 private, proprietary schools; approximately 2,000 public, non-profit schools; and approximately 1,900 private, non-profit schools. According to the U.S. Department of Education, in the fall of 2013 approximately 28 million students were attending institutions that participate in the various financial aid programs under Title IV of the Higher Education Act.
Our primary competitors in the proprietary postsecondary education industry are: Apollo Education Group, Inc., Bridgepoint Education, Inc., Capella Education Company, Corinthian Colleges, Inc., DeVry Education Group Inc., Education Management Corporation, Grand Canyon Education, Inc., ITT Educational Services, Inc.,
4
Table of Contents
Kaplan, Inc (a division of the Graham Holdings Company) and Strayer Education, Inc. We also compete with a number of privately held, proprietary and non-profit postsecondary institutions, including community colleges, in the markets in which we operate campuses. In addition, there is growing competition from online programs across postsecondary education institutions, including proprietary publicly traded and privately held institutions, as well as non-profit institutions.
Our postsecondary institutions are subject to significant regulations. The Higher Education Act of 1965, as amended and reauthorized (“HEA”), and the related regulations govern all higher education institutions participating in federal student aid and loan programs under Title IV of the HEA (“Title IV Programs”), and provide for a regulatory triad by mandating specific regulatory responsibilities for each of the following:
| • | The accrediting agencies recognized by the U.S. Department of Education (“ED” or “the Department”); |
| • | The federal government through ED; and |
| • | State higher education regulatory bodies. |
Recently, extensive and more complex ED regulations governing our institutions as well as others in the postsecondary education industry have been enacted. These new regulations, coupled with the increased focus by the U.S. Congress on the role that proprietary educational institutions play in higher education, may cause increased competition across the industry as well as contribute to changes in business operating strategies. See “Student Financial Aid and Related Federal Regulation – Legislative Action and Recent ED Regulatory Initiatives” later in this Item 1 for further discussion.
Although competition exists, proprietary educators serve a segment of the market for postsecondary education that we believe has not been fully addressed by traditional public and private universities. Non-profit public and private institutions can face limited financial resources to expand their offerings in response to growth or changes in the demand for education, due to a combination of state funding challenges, significant expenditures required for research and the professor tenure system. Certain private institutions also may control enrollments to preserve the perceived prestige and exclusivity of their degree offerings. In contrast, proprietary providers of postsecondary education offer potential students the greater flexibility and convenience of their institutions’ programmatic offerings and learning structure and an emphasis on applied content. At the same time, the share of the postsecondary education market that has been captured by proprietary providers remains relatively small. As a result, we believe that in spite of recent regulatory changes and other challenges facing the industry, proprietary, postsecondary education providers continue to have significant opportunities to address the demand for postsecondary education.
Our Competitive Strengths
We believe that the following strengths differentiate our business:
Commitment to Enroll, Educate and Place our students into a better position to succeed professionally and to close the gap between students and employers. Our focus remains on strengthening academic outcomes, enhancing regulatory compliance and simplifying our business model. As an education company, academic outcomes are the most relevant and critical measure of our success. We have been focused on putting the right leaders in our institutions to further our priority of strengthening our academic outcomes. Our campuses are dedicated to recruiting and retaining quality faculty and instructors with relevant industry experience and appropriate academic credentials. We seek to identify emerging industry trends in order to understand the evolving educational needs of our students and graduates and we continue to work with our accreditors to expand our program offerings to provide students with increased offerings.
We continue to show improvements in our reported job placement rates. Placements are a key indicator of the quality of our programs and serve as evidence that we are achieving our mission to Enroll, Educate, and Place our students in a better professional position than when they started with us. Additionally, the consolidation of several of our brands allows us to focus our attention, improve standardization where appropriate and create
5
Table of Contents
management efficiencies. It also improves our opportunity to share best practices across the organization. We continue to explore additional options to simplify our organization and streamline our operations.
Innovative adaptive learning technology. Through our equity investment in CCKF, a Dublin-based educational technology company that provides intelligent, adaptive systems to power the delivery of individualized and personalized learning, we have strengthened our leadership position as an innovator in higher education and as a company dedicated to student success. Our adaptive learning content was developed by teams of our own instructors and has been integrated across many of our curricula. We have a perpetual license to this technology, which we refer to as intellipathTM. Intellipath has been successfully integrated into dozens of courses as well as the Master’s of Business Administration Program at AIU. This academic and technological breakthrough has the potential to advance our understanding of the learning process and support improved student outcomes. Adaptive learning, supported by intellipath technology, allows us to visualize how each student learns through their interaction with the material.
Intellipath serves as a powerful platform to help our students learn. It identifies and gives more time in areas where students need more help, while moving past areas they already know. In many respects, adaptive learning serves as an excellent way to facilitate and demonstrate mastery in a competency-based learning environment. Adaptive learning is changing the nature of higher education by measuring real-time knowledge growth minute-by-minute and understanding of the material on a student-by-student basis.
The success of this personalized learning platform lies in the abundance of data it collects, which in turn helps our instructors determine how to structure courses, deliver material to students, predict and mitigate individual student challenges and identify teaching practices that yield the strongest results. A major difference between our platform and others is that it focuses on student learning achievements rather than solely on student satisfaction, or how fast it facilitates a student to complete assignments.
Award-winning online instructional platform. Construction of a virtual classroom that engages online students with their instructor, their peers and the content is critical to the achievement of student learning outcomes. CEC’s online instructional delivery is accomplished utilizing an innovative, student-focused learning management system. While online content delivery is very common today, CEC’s course content delivery system, M.U.S.E. (My Unique Student Experience), has several features that make it distinctive in the education marketplace. Designed around the students, M.U.S.E. is a rich, engaging student experience that represents an innovative online method of delivering content that includes the following capabilities:
| • | supports multiple learning styles, allowing students to choose their preferred method of engaging with the content; |
| • | enables students to choose the order of topics to study within a predetermined framework of learning objectives; and |
| • | provides search capability that allows students to interact with the content more efficiently and effectively. |
Strong capital structure. The proceeds of the sale of our International business during 2013 provided us with substantial cash that added flexibility to help execute on our strategy, enabling us to be in a strong position to be part of the solution to the obstacles facing the proprietary postsecondary education industry. As a result of our strong cash position and improved operating performance, we have the capability to explore various options available to us to meet the challenges posed by various regulatory requirements that have been introduced within the industry.
Seasonality
Our quarterly net revenues and income fluctuate primarily as a result of the pattern of student enrollments. The seasonality of our business has decreased over the last several years due to an increased percentage of
6
Table of Contents
students enrolling in online programs, which generally experience less seasonal fluctuations than campus-based programs. However, we typically experience our lowest revenue levels during our third fiscal quarter as a result of those students who do follow a typical institution calendar and take summer breaks. While operating costs for our institutions generally do not fluctuate significantly on a quarterly basis, we do traditionally increase our advertising investments during the first and third fiscal quarters in relation to the back to school seasons. Revenues, operating loss and net loss by quarter for each of the past two fiscal years are included in Note 18 “Quarterly Financial Summary” of the notes to our consolidated financial statements.
BUSINESS AND OPERATING STRATEGY
To compete successfully in today’s demanding economy, people benefit from a solid education that provides them a foundation of knowledge and skills they can use in the workplace and to build meaningful careers. We aim to provide effective, career-focused postsecondary education to a diverse population, providing our students the opportunity to use their education to advance personally and professionally.
Our strategic plan is aimed at addressing near-term demands for education with a career focus, while ensuring we continue to build the capabilities necessary to deliver sustainable long-term growth for our organization and its institutions. We are focused on gaining efficiencies and continuously improving operations that support the three key areas of focus – Enroll, Educate and Place – for our organization overall and our individual campuses across the United States.
Enroll
Promoting interest with prospective students and building excitement about our institutions and a career path that they can follow is key to the future success of our institutions. We continue to refine and reinvent the ways in which we identify, attract and enroll students. We have begun using enhanced new student orientation courses, which are conducted online for both students planning to take courses online, as well as those enrolling at ground campuses. The online orientation courses, which include our innovative intellipath™ adaptive learning platform, aim to improve our incoming students’ experiences as they adjust to higher education, giving them resources and offering tips to help them hit the ground running so they have the right tools and are confident they can succeed. By offering a more enhanced and engaging orientation, this new approach offers students a better opportunity to become acclimated with their new school and determine whether it’s the right fit for them. This is in keeping with our desire to make sure students are confident they are making the right decision by enrolling in one of our institutions.
Educate
The importance of quality education at our institutions cannot be overstated. The quality of the education we provide and the manner in which we provide it can directly lead to better student outcomes. We will strive to offer new programs at institutions and particular campuses as there is both student demand for the education, as well as workplace demand for graduates in that field of study. Known as an innovator in online education, we will continue to build upon that history and continue developing new education technologies that enhance the learning experience for students. We believe our intellipath™ adaptive learning platform provides our national organization and its institutions a strategic advantage by providing a more customized student experience and we will continue to expand its use as a key differentiator.
Place
Our institutions tend to serve career-focused students who are driven to attain education to improve their personal and professional standing. At our nationally-accredited schools in particular, this means providing robust Career Services support. We have enhanced our job placement processes and procedures over the past two years, which, along with an improved economy, has resulted in increased placement rates reported to our national accreditors. We intend to continue improving our job placement outcomes, through student resources and proper program mixes that meet the current and future demands of employers.
7
Table of Contents
We believe that strong performance in these three key phases of the student lifecycle inherently leads to improved results for the organization as a whole. As we evaluate our operations and consider ways in which we can invest our financial and personnel resources, we will continue to determine what impact that may have against these imperatives.
Student Recruitment and Marketing, Admissions, Student Retention and Student Employment and Graduation
Student Recruitment and Marketing
Our institutions seek highly motivated, career-oriented students with both the desire and ability to complete their academic programs of choice. To promote interest among potential students, each of our institutions engages in a wide variety of marketing activities. We are concentrated on enhancing our brand perception by continuing to focus on building strong brand recognition for our education groups. We also seek to differentiate our online institutions and brands through our award-winning information technology architecture. Through our proprietary virtual campus, we have the ability to provide unique online and blended learning environments.
We seek to increase enrollment at each of our institutions through marketing programs designed to differentiate our brands in the marketplace and maximize each campus’ opportunity to serve a targeted section of the potential student population. The geographic scope of the marketing programs as well as the media deployed varies by institution and location.
Within our University group, we have expanded our team and focus on strategic partnerships with corporate partners. During 2014, the University group established more than 60 new partnerships with key accounts. We expect these relationships to result in new student interest through increased awareness of our brands for the employees of our Corporate partners. Additionally, we work with our Corporate partners in assisting with job placement opportunities for our graduates.
Admissions
CEC has historically served a diverse student population. Our students represent a broad range of educational and employment experiences, contributing to their college-level readiness. Each of our campuses has an admissions office whose staff is responsible for interacting with individuals interested in enrolling at the campuses. Admissions representatives serve as prospective students’ primary contacts, providing information to help them make informed enrollment decisions and assisting them with the completion of the enrollment process. As of December 31, 2014, our institutions employed approximately 1,100 admissions representatives serving both current and potential students.
The admissions and entrance processes of each of our institutions are intended to identify students who are equipped to meet the requirements of their chosen program of study. We believe that a success-oriented student body ultimately results in higher student retention and post-graduation employment rates, increased student and employer satisfaction, and lower default rates on government loans utilized by the student. Generally, to be qualified for admission to one of our institutions, an applicant must have received a high school diploma or a recognized equivalent, such as a General Education Development certificate. Some of our programs may also require applicants to meet other admissions requirements, such as obtaining certain minimum scores on assessment examinations.
University orientation encourages students to engage actively in preparatory activities which can include an adaptive learning module, a discussion board assignment and individual project. This orientation program also provides the opportunity for students to understand our academic and support services. We believe completion of these activities will better prepare a student to make an informed decision about pursuing their education as well as to be more successful as it simulates their classroom experience. Campus students have the opportunity to engage with faculty, staff and current students during orientation which builds confidence and a comfort level in their new learning environment. Orientation is free of charge and offered to all students prior to the start of the
8
Table of Contents
first course. Completion of orientation does not financially obligate students nor does it require students to continue their education with the university. Students have the opportunity to cancel their enrollment at any time during orientation without incurring a financial obligation and they will also have the opportunity to cancel from the university without taking on debt during the regular right to cancel period.
Our ground-based campuses offer students both an on-campus orientation and an online orientation, which utilizes adaptive learning components to better prepare students for the program they are about to enter. Campuses allow new students the ability to use computer labs on campus to access the orientation, and campuses also hold group sessions to enable new students who need more help navigating an online course to do so with faculty or staff facilitation. Topics covered in the orientation include: institution and program overviews, interactive elements on learning styles and study strategies and how to receive assistance from various departments. As with our university programs, campus-based students who cancel their enrollment or withdraw from a course or program during the orientation process and prior to the end of the drop/add period incur no charges.
Student Retention
CEC continually emphasizes the importance of student retention at each of our institutions. As is the case at any postsecondary educational institution, a portion of our students fail to complete their academic programs for a variety of academic, financial or personal reasons. We seek to improve retention rates by building a strong connection between our faculty and students and promoting instructional innovation. These efforts, as well as our implementation of adaptive learning, are designed to assist our students to remain in school and succeed.
Student Employment and Graduation
The employment of our students in their field of study is an important element of our educational mission and is an important measure of student achievement to many of our schools’ accreditors. To this end, each of our institutions has a career services department whose primary responsibility is to help prepare students to conduct a successful job search and to help identify job opportunities with employers. In addition, our career services staff assists students in identifying part-time employment to assist with financial support while our students pursue their education. Many of our Career Colleges programs contain internship or externship requirements, which our career services and academics teams work to procure so that students can meet the requirements of their programs. Internships, part-time employment opportunities, and employer relationship development are important parts of our overall employment placement success strategy, as these opportunities lead to future opportunities for our students and graduates in their chosen profession.
As of December 31, 2014, we employed approximately 190 individuals in the career services departments of our campuses. In addition, we employ a Director of Employer Development in our Career Colleges group whose primary responsibility is developing partnerships with large national and regional employers who are interested in hosting our students as interns and/or in hiring our graduates. Local campuses also build relationships with smaller local employers through their career services and academics staff.
9
Table of Contents
Student Enrollment
Our total student enrollment for our continuing operations as of December 31, 2014 and 2013 was approximately 41,400 students and 45,000 students, respectively. Included in total student enrollment for our continuing operations as of December 31, 2014 and 2013 were approximately 30,200 students and 30,100 students, respectively, enrolled in our fully-online academic programs. Related student enrollment demographic information as of December 31, 2014 and 2013 was as follows:
Student Enrollment by Age Group
| As a Percentage of Total Student Enrollment as of |
||||||||
| December 31, | ||||||||
| 2014 | 2013 | |||||||
| Under 21 |
9 | % | 10 | % | ||||
| 21 to 30 |
40 | % | 40 | % | ||||
| Over 30 |
51 | % | 50 | % | ||||
Student Enrollment by Core Curricula
| As a Percentage of Total Student Enrollment as of |
||||||||
| December 31, | ||||||||
| 2014 | 2013 | |||||||
| Business Studies |
50 | % | 47 | % | ||||
| Health Education |
17 | % | 19 | % | ||||
| Visual Communications and Design Technologies |
6 | % | 9 | % | ||||
| Culinary Arts |
17 | % | 15 | % | ||||
| Information Technology |
10 | % | 10 | % | ||||
Student Enrollment by Degree Granting Program
| As a Percentage of Total Student Enrollment as of |
||||||||
| December 31, | ||||||||
| 2014 | 2013 | |||||||
| Doctoral, Master’s, Bachelor’s Degree |
58 | % | 58 | % | ||||
| Associate Degree |
32 | % | 29 | % | ||||
| Certificate |
10 | % | 13 | % | ||||
Student Academics
We believe learning outcomes and career readiness are attained by our students as a result of the quality learning experience they are provided. Those learning experiences are facilitated by career-oriented curriculum, engaging instructional delivery, qualified faculty and accessible student support services. As a result, approximately 651,000 students have graduated from CEC colleges, institutions and universities as of December 31, 2014.
Curriculum
Our colleges, institutions and universities develop and deliver a variety of programs resulting in the award of credentials ranging from certificates and diplomas to master’s and doctoral degrees in career-oriented programs of study including visual communication and design technologies, business studies, culinary arts, health education and information technology.
10
Table of Contents
CEC’s curricula, instructional delivery tools, and experienced faculty comprise the learning experience that appeals to our student population and provides them with a unique opportunity to develop the knowledge, skills and competencies required for specific career outcomes. The curriculum development process focuses on desired career outcomes, while considering relative competencies necessary to achieve these career outcomes, as well as recommendations set forth by advisory boards, programmatic accrediting agencies and industry standards. Subsequently, learning objectives are identified and courses are developed which foster student engagement in activities and optimally result in the attainment of program learning outcomes and employment readiness.
Instructional Delivery
CEC’s instructional delivery is based upon the belief that learning is dependent upon instructional methodologies that facilitate student engagement with the instructor, with other students and with the course content. This engagement is fundamental to student learning outcomes, regardless of whether instruction occurs within a physical or virtual classroom.
Construction of a virtual classroom that engages online students with their instructor, their peers and the content is critical to the achievement of student learning outcomes. CEC’s online instructional delivery is accomplished utilizing an innovative, student-focused learning management system. While online content delivery is very common today, CEC’s course content delivery system, M.U.S.E. (My Unique Student Experience), has several features that make it distinctive in the education marketplace. Designed around the students, M.U.S.E. is a rich, engaging student experience that represents an innovative online method of delivering content that includes the following capabilities:
| • | supports multiple learning styles, allowing students to choose their preferred method of engaging with the content; |
| • | enables students to choose the order of topics to study within a predetermined framework of learning objectives; and |
| • | provides search capability that allows students to interact with the content more efficiently and effectively. |
CEC continues to invest in its methods for delivering online education. CEC has implemented the use of sophisticated adaptive learning technologies, primarily within our University institutions. Our roll-out of these technological tools is coupled with extensive faculty training. Continuous assessment facilitates the development of individualized, dynamic learning maps that both illustrate where student mastery has been achieved and where additional work is needed. Both the student and the instructor can see in real time where learning has taken place and where effort still needs to be applied.
Library Services
Ground and online students have access to the Cybrary, a collection of electronic resources that has been developed to support the curricula offered by each CEC institution. All ground and online students have access to a team of reference librarians and students may request assistance through instant messaging, telephone or email. The online library resources and services exist to extend and enhance those resources and services that are provided on physical campuses as well as to support fully online students.
Faculty
CEC employs more than 3,650 credentialed, geographically disbursed, full-time and adjunct faculty who facilitate learning in our classrooms, kitchens, labs, studios and virtual classrooms. Our faculty are hired, assigned, developed and evaluated in compliance with current accepted higher education practice and in compliance with state, institutional accreditation and programmatic accreditation standards. Generally, all colleges and universities require the instructor to have a degree at least one level higher than the level of course
11
Table of Contents
being taught (with the exception of faculty in our doctoral programs) plus teaching and/or industry experience. General education faculty members must possess at least a master’s degree. The average tenure of a CEC faculty member is greater than four years. The longevity of our instructors is a testament to the focus we place on student learning and the consistent quality we strive for in our classrooms. Given our significant investment in faculty selection and development, retention and development of this pivotal group of employees is extremely important to the organization, and to our students.
Although faculty members will always serve as the primary point of contact, students may also engage the assistance of tutors and academic advisors. Students have access to technical support 24 hours a day, seven days a week.
Faculty Competencies
With the input of faculty and academic leadership across each of our education groups, we have developed a set of instructor competencies that are critical to student success and institutional effectiveness. These competencies provide the basis for faculty recruitment, hiring, orientation, evaluation and development. The competencies apply to all instructors, regardless of content area, instructional platform (ground or online) and employment status (full-time, part-time, adjunct). Faculty hired by any CEC institution must demonstrate proficiency in each of the following competencies:
| • | communication; |
| • | assessment of student learning; |
| • | instructional methodology (pedagogy); |
| • | subject matter expertise; |
| • | utilization of technology to enhance teaching and learning; |
| • | acknowledgement and accommodation of diversity in learners; |
| • | student engagement; |
| • | promotion of active student learning; |
| • | compliance with policy; and |
| • | demonstration of scholarship. |
Faculty Development
Instructors are required to participate in faculty development activities each year as part of the continuous improvement process. The objective of faculty development is to increase proficiency in each of the instructor competencies. Performance strength and opportunities guide the selection of faculty development activities. Campuses typically provide locally developed in-service professional development activities for their own faculty. We also provide faculty with interactive content, available in an asynchronous format, in areas such as teaching methodology, instructional practice, classroom management, outcomes assessment and student retention.
The Educator of the Year program celebrated its 14th year in 2014. The Educator of the Year program is designed to recognize teaching as the essence of CEC’s mission and celebrates the impact that CEC faculty have had upon their students through innovation and accomplishment in four specific categories:
| • | instruction; |
| • | student success; |
| • | academic leadership; and |
| • | community service or partnership. |
12
Table of Contents
A rigorous internal review process culminates in the identification of an Educator of the Year and Distinguished Educator in each of the four categories. CEC’s recognition of outstanding faculty acknowledges our belief that the quality of the interaction between the instructor and the student is central to providing our student with a high quality learning experience.
Employees
As of December 31, 2014, we had a total of 8,127 employees, including 744 students employed on a part-time basis at certain of our institutions, as follows:
| Full-time Non-student Employees |
Part-time Non-student Employees |
Part-time Student Employees |
Full-time Faculty |
Part-time Faculty |
Total | |||||||||||||||||||
| CTU |
746 | 5 | 58 | 41 | 1,245 | 2,095 | ||||||||||||||||||
| AIU |
650 | 9 | 65 | 52 | 505 | 1,281 | ||||||||||||||||||
|
|
|
|
|
|
|
|
|
|
|
|
|
|||||||||||||
| Total University Group |
1,396 | 14 | 123 | 93 | 1,750 | 3,376 | ||||||||||||||||||
|
|
|
|
|
|
|
|
|
|
|
|
|
|||||||||||||
| Career Colleges |
1,113 | 44 | 537 | 454 | 1,134 | 3,282 | ||||||||||||||||||
| Corporate |
1,015 | 26 | — | — | — | 1,041 | ||||||||||||||||||
|
|
|
|
|
|
|
|
|
|
|
|
|
|||||||||||||
| Subtotal |
3,524 | 84 | 660 | 547 | 2,884 | 7,699 | ||||||||||||||||||
|
|
|
|
|
|
|
|
|
|
|
|
|
|||||||||||||
| Transitional Group |
111 | 11 | 84 | 32 | 190 | 428 | ||||||||||||||||||
|
|
|
|
|
|
|
|
|
|
|
|
|
|||||||||||||
| Total employees |
3,635 | 95 | 744 | 579 | 3,074 | 8,127 | ||||||||||||||||||
|
|
|
|
|
|
|
|
|
|
|
|
|
|||||||||||||
ACCREDITATION AND JURSIDICTIONAL AUTHORIZATIONS
Institutional Accreditation
In the United States, accreditation is a process through which an institution subjects itself to qualitative review by an organization of peer institutions. Accrediting agencies primarily examine the academic quality of the instructional programs of an institution, and a grant of accreditation is generally viewed as confirmation that an institution’s programs meet generally accepted academic standards. Accrediting agencies also review the administrative and financial operations of the institutions they accredit to ensure that each institution has the resources to meet its educational mission.
Pursuant to provisions of the HEA, ED relies on accrediting agencies to determine whether institutions’ educational programs qualify the institutions to participate in Title IV Programs. The HEA and its implementing regulations specify certain standards that all recognized accrediting agencies must adopt in connection with their review of postsecondary institutions. All of our campuses are accredited by accrediting agencies recognized by ED.
13
Table of Contents
A listing of our accredited institutions, including all main and additional (branch) campus locations for regulatory purposes and relevant accreditation information is provided in the following table:
ACCREDITATION TABLE
| Institution, Main Campus Location |
Accreditor (1) |
Year of Accreditation Expiration (2) |
||||
| American InterContinental University (3) |
||||||
| Schaumburg, IL (Online) (Atlanta, GA; Weston, FL; and Houston, TX) |
HLC | 2024 | ||||
| Briarcliffe College |
||||||
| Bethpage, NY (includes Online) (Patchogue, NY) |
MSCHE | 2022 | ||||
| Brooks Institute (4) |
||||||
| Ventura, CA |
ACICS | 2016 | ||||
| Colorado Technical University (5) |
||||||
| Colorado Springs, CO (Denver, CO; Sioux Falls, SD; and Online) |
HLC | 2022 | ||||
| Harrington College of Design |
||||||
| Chicago, IL |
HLC | 2015 | ||||
| Le Cordon Bleu College of Culinary Arts |
||||||
| Austin, TX (Dallas, TX; Sacramento, CA; Seattle, WA; and St. Peters, MO) |
ACICS | 2017 | ||||
| Pasadena, CA |
ACICS | 2017 | ||||
| Portland, OR (Tucker, GA and Mendota Heights, MN) |
ACICS | 2020 | ||||
| San Francisco, CA |
ACCSC/ACICS | 2015 | ||||
| Scottsdale, AZ (includes Online) (Cambridge, MA (6); Las Vegas, NV; |
ACCSC/ | 2015 | ||||
| Miramar, FL (7); and Orlando, FL (8)) |
ACICS | 2019 | ||||
| Le Cordon Bleu College of Culinary Arts in Chicago |
||||||
| Chicago, IL |
HLC | 2018 | ||||
| Missouri College |
||||||
| Brentwood, MO |
ACICS | 2019 | ||||
| Sanford-Brown College |
||||||
| Atlanta, GA (9) (Ft. Lauderdale, FL (9); Houston, TX; Middleburg Heights, OH; and Sanford-Brown Institute, New York, NY (9)) |
ACICS | 2020 | ||||
| Chicago, IL (IADT Detroit, Troy, MI (10); IADT Nashville, Nashville, TN (10); and Collins College, Phoenix, AZ (10)) |
ACICS | 2019 | ||||
| Dallas, TX (Sanford-Brown Institute, Garden City, NY) |
ACICS | 2017 | ||||
| Fenton, MO |
ACICS | 2017 | ||||
| Jacksonville, FL (Sanford-Brown Institute, Iselin, NJ) |
ACICS | 2015 | ||||
| McLean, VA |
ACICS | 2015 | ||||
| Mendota Heights, MN (Brooklyn Center, MN (9)) |
ACICS | 2020 | ||||
| Tampa, FL (Orlando, FL; Henderson, NV; San Antonio, TX; Seattle, WA (11); Online; and IADT Sacramento, Sacramento, CA) |
ACICS | 2019 | ||||
| White Plains, NY |
ACICS | 2017 | ||||
| SBI Campus – an Affiliate of Sanford-Brown |
||||||
| Melville, NY |
ACICS | 2019 | ||||
| (1) | Below is a key to the accreditation abbreviations used in the above table: |
| a. | ACCSC – Accrediting Commission of Career Schools and Colleges |
| b. | ACICS – Accrediting Council for Independent Colleges and Schools |
| c. | MSCHE – Middle States Association of Colleges and Schools, Commission on Higher Education |
| d. | HLC – North Central Association of Colleges and Schools, Higher Learning Commission |
| (2) | Status as of January 31, 2015. Institutions seek renewal of accreditation during the year noted. |
| (3) | HLC’s next comprehensive evaluation for AIU is scheduled for 2017-18. |
14
Table of Contents
| (4) | Brooks Institute is a candidate for Western Association of Schools and Colleges (“WASC”) accreditation. |
| (5) | HLC’s next comprehensive evaluation for CTU is scheduled for 2016-17. |
| (6) | ACCSC accreditation for the Cambridge campus is awaiting a new grant. |
| (7) | ACCSC accreditation for the Miramar branch campus expires in 2016. |
| (8) | LCB Orlando’s accreditation was approved to be reassigned from the SBC Tampa main campus to LCB Scottsdale during the fourth quarter of 2014. Final approval from ED is pending. |
| (9) | ACICS accreditation for the Atlanta, Brooklyn Center, Ft. Lauderdale and New York campuses expires in 2019. |
| (10) | ACICS accreditation for IADT Detroit, IADT Nashville and Collins College expires in 2020. |
| (11) | ACICS accreditation for the Seattle campus is on deferral through April 30, 2015. |
Programmatic Accreditation
In addition to the institutional accreditations described above, a number of our institutions have specialized programmatic accreditation for particular educational programs. Many states and professional associations require professional programs to be accredited, and require individuals who must pass professional license exams to have graduated from accredited programs. Programmatic accreditation, while not a sufficient basis for institutional Title IV Program certification by ED, provides additional quality review by peers in a given field and may enable or assist graduates to practice, sit for licensing or certification exams (in some cases) or otherwise secure appropriate employment in their chosen field. In addition to programmatic accreditation, some states have licensing boards which regulate who in a state is licensed to practice in a given profession.
Career Education pursues programmatic accreditation if said accreditation is required by employers or licensing bodies in order for a graduate to practice the profession or if it is required in order for a graduate to sit for a licensing or certification exam in order to practice or advance in the profession. In some cases, programmatic accreditation is sought because it is desired by employers and may enhance the ability of our graduates to compete for employment in their field.
Programmatic accreditation has been granted by the following accrediting agencies with respect to the following individual programs taught at certain of our campuses:
PROGRAMMATIC ACCREDITATION TABLE (1)
| Accreditor |
Campus |
Program Accredited | ||
| Accreditation Council for Business Schools and Programs |
American InterContinental University: Atlanta, Houston, Online and South Florida; Colorado Technical University: Colorado Springs, Denver and Sioux Falls | Business programs | ||
| Accreditation Board for Engineering and Technology |
Colorado Technical University, Colorado Springs | Electrical engineering and computer engineering | ||
| Accrediting Bureau of Health Education Schools |
Sanford-Brown: Houston, Iselin and New York | Surgical technology | ||
| American Culinary Federation Education Foundation Accrediting Commission |
Le Cordon Bleu College of Culinary Arts: Atlanta, Austin, Chicago, Las Vegas, Los Angeles, Miami, Minneapolis/St. Paul, Orlando, Portland, San Francisco and Scottsdale | Culinary arts | ||
15
Table of Contents
| Accreditor |
Campus |
Program Accredited | ||
| American Culinary Federation Education Foundation Accrediting Commission |
Le Cordon Bleu College of Culinary Arts: Atlanta, Austin, Chicago, Las Vegas, Los Angeles, Miami, Minneapolis/St. Paul, Orlando, Portland, Scottsdale, Seattle and St. Louis | Pastry and baking | ||
| American Dental Association Commission on Dental Accreditation |
Missouri College | Dental assisting | ||
| American Dental Association Commission on Dental Accreditation |
Briarcliffe College; Missouri College; Sanford-Brown: Dallas, Ft. Lauderdale and Jacksonville | Dental hygiene | ||
| American Society of Health Systems Pharmacists |
Sanford-Brown: Dallas, Ft. Lauderdale, Garden City, Houston, Iselin, Jacksonville, New York and Tampa | Pharmacy technician | ||
| American Veterinary Medical Association |
Sanford-Brown: Ft. Lauderdale and Jacksonville | Veterinary technology | ||
| CAAHEP-Accreditation Review Council on Education in Surgical Technology and Surgical Assisting |
Sanford-Brown, Iselin | Surgical technology | ||
| CAAHEP—Joint Review Committee on Education in Cardiovascular Technology |
Sanford-Brown: Atlanta, Dallas, Ft. Lauderdale, Garden City, Houston, Jacksonville, San Antonio and Tampa | Cardiovascular sonography | ||
| CAAHEP-Joint Review Committee on Education in Diagnostic Medical Sonography |
Sanford-Brown: Atlanta, Cleveland, Dallas, Ft. Lauderdale, Garden City, Houston, Iselin, New York and White Plains | Diagnostic medical sonography | ||
| CAEP (TEAC)- Council for the Accreditation of Educator Preparation |
American InterContinental University Online | Master of Education | ||
| Council for Interior Design Accreditation |
American InterContinental University, Atlanta; Harrington College of Design; International Academy of Design & Technology: Detroit, Nashville and Sanford-Brown College Tampa | Interior design | ||
| National Accrediting Agency for Clinical Laboratory Sciences |
Sanford-Brown, Houston | Medical laboratory technician | ||
| Project Management Institute Global Accreditation Center |
Colorado Technical University: Colorado Springs (2), Denver (2) and Sioux Falls (2) | Project Management | ||
16
Table of Contents
| (1) | Status as of January 15, 2015. |
| (2) | Accreditation is granted only for programs that are completed fully online. |
Compliance Monitoring by Accrediting Agencies
Accrediting agencies monitor many aspects of an institution’s operations in order to ensure that the education or training offered is of sufficient quality to achieve, for the duration of the accreditation period, the stated objectives of the education or training offered. In addition to periodic accreditation reviews, institutions undergoing substantive changes, including a change of ownership, may be required to be reviewed by their accrediting agency. Accrediting agencies also monitor institutions’ compliance during the term of their accreditation, including through required annual self-reporting by an institution and periodic site visits by representatives of the accrediting agency. If an accrediting agency believes that an institution may be out of compliance with accrediting standards, it may place the institution or particular programs on probation or a similar warning status or direct the institution to show cause as to why its accreditation should not be revoked. An accrediting agency may also require the institution to provide it with supplemental reports in order for the agency to monitor one or more specific areas of the institution’s performance, which is commonly referred to as being on “reporting” status. Failure to demonstrate compliance with accrediting standards in any of these instances could result in loss of accreditation. Being on probation, show cause, or reporting status may cause an accreditor to deny an institution permission, or otherwise delay approval, to open and commence instruction at new locations or to add new programs.
Employment Placement Rate Standards and Other Student Achievement Outcomes
One aspect of an institution’s operations monitored by accrediting agencies is student achievement, including employment placement rates of our graduates. Our national accreditors, some programmatic accreditors and some state licensing bodies require our campuses and/or programs to achieve minimum placement rates within specific time periods after students have graduated. Retention rates are another measure of student outcomes monitored by some of these bodies. Many agencies have increased standards for these outcome measurements over recent years. For example, ACICS (which accredits 32 of our non-Transitional campuses) transitioned from institutional placement rates to institutional and program-level placement rates for the 2011- 2012 reporting year. In addition, it has adjusted its placement rate standards for each of the 2011, 2012 and 2013 ACICS reporting years. For the period from July 1, 2012 through June 30, 2013 (the ACICS 2013 reporting year), the benchmark placement rate standard for programs and campuses was 70%, up from 64% for the 2012 reporting year, and remains at 70% for 2014. Similarly, in 2013 ACICS increased its minimum compliance standard from 47% to 60%, and the standard remains at 60% for 2014.
ACICS will determine which of our ACICS-accredited institutions with placement rates less than 70% due to reasons beyond their control are eligible to apply for a waiver of the student outcome standard. Examples of mitigating circumstances that may lead to such a waiver include having more than 30% of the graduates in the placement reporting year cohort either have completed their program or have earned their license to practice less than 6 months prior to the reporting deadline. If granted a waiver, those institutions are provided additional time to place graduates and report those placements to the accreditor. Institutions or programs that fail to meet the benchmark rate are required to develop programmatic or institutional improvement plans (depending upon whether the deficiency was at the program or institutional level), may be subject to additional reporting requirements, may be placed on hold for new program approval and may potentially face negative actions. In January 2013, ACICS modified its definition of a placement to take into account the expansion of job opportunities available to students who graduate from career colleges, as well as to take into account the fact that many adult learners pursue a credential to improve their performance in their current job or to prepare for future career advancement, rather than to begin a new career or start a new job immediately upon graduation. The data reported for the 2014 reporting period include placements that meet the criteria of this modified definition.
17
Table of Contents
ACICS’ retention rate standards for institutions are similarly applied and also increased for each of the 2011, 2012 and 2013 reporting years. For the 2013 reporting year, the minimum compliance standard for retention was 60% and the benchmark rate was 65% or 70% (depending on program length), an increase from the 2012 reporting year compliance and benchmark rates of 52% and 62%, respectively. The 2014 compliance and benchmark rates have not changed from 2013. In 2013, ACICS created a process by which institutions may request a waiver of accreditation standards if they fail to meet the retention rate benchmark for reasons beyond their control. For 2014, ACICS will determine which of our ACICS-accredited institutions with retention rates less than the compliance threshold due to reasons beyond their control are eligible to apply for a waiver of the student outcome standard. For example, if the students who withdrew before June 30th and returned to the institution or program by November 1st would have put the institution or program at or above the compliance threshold, then the institution may apply for a waiver. Similarly, if 50% or more of an institution’s students exhibit three or more of the Department of Education higher education risk factors (delayed enrollment, part-time status, working full-time, single parent, financially independent, has dependents or does not have a GED or high school diploma), the institution or program may qualify for a waiver of accreditation standards for retention rates.
On November 3, 2014, eight of our 32 ACICS-accredited campuses that are not in teach-out reported institutional placement or retention rates below the ACICS benchmark standards of 70% for placement or 65% / 70% for retention (depending on the campus’ longest program length) for the ACICS 2014 reporting year. No campus reported an institutional placement rate below the minimum compliance standard. One campus reported an institutional retention rate below the minimum compliance standard. We anticipate these institutions will remain subject to increased levels of accreditation oversight. This oversight includes, depending on the extent to which each campus fell below the ACICS benchmark standards, more detailed or frequent reporting requirements, the submission of an improvement plan, attendance at a workshop, participation in a consultation or additional requirements for new program and location approvals.
ACICS began evaluating placement and retention rates at the program level and applying associated remedial actions in 2012 using a tiered rate similar to that developed for institutional retention and placement rates. Of the 154 programs with 10 or more graduates in the 2013-14 reporting year:
Placement
37 will be required to complete Placement Improvement Plans. Of these:
| • | six have failed to come into compliance within the required timeframe from the 2012 or 2013 reporting standards and are therefore subject to additional remediation requirements |
| • | 12 programs are required to come into compliance by May 2015 |
| • | eight programs are required to come into compliance by November 2015 |
| • | 11 programs have longer periods of time to come into compliance |
Retention
33 will be required to complete Retention Improvement Plans. Of these:
| • | none have failed to come into compliance within the required timeframe from the 2012 or 2013 reporting standards |
| • | three programs are required to come into compliance by May 2015 |
| • | four programs are required to come into compliance by November 2015 |
| • | 26 programs have longer periods of time to come into compliance |
In October 2014, our five campuses currently accredited by ACCSC filed annual reports with the accreditor for the 2014 reporting year. Eight of the 23 programs with data to report for the requested periods fell below the
18
Table of Contents
ACCSC benchmark for either placement rate or graduation rate, including two that fell below for the second consecutive year and two that fell below for the third consecutive year. We anticipate that these eight programs will remain subject to additional monitoring and reporting requirements relating to placement and graduation rates and other student achievement outcomes.
We continue to remain focused on improving the placement of our graduates using the tools and outreach resources made available to career services advisors. Through increased interactions with local businesses, our campuses have enhanced their efforts to identify job opportunities and forge partnerships that improve employment outcomes for our students; however, the national unemployment trend and challenging local employment environment, while improving, remains a challenge. To the extent that we cannot place a sufficient percentage of students in the future to meet various requirements, including our institutional and programmatic accreditors’ minimum compliance standards, we may take further measures, including the teach out of programs.
Financial Reporting
Because our Career Colleges and Culinary Arts campuses continue to operate at a loss, we received notice from ACICS in September 2014 that we would be required to submit an additional financial report for each campus it accredits for the nine months ended September 30, 2014. This financial report required us to submit a statement of the current financial position, a break-even plan for each institution and evidence that Career Education can continue to operate our ACICS-accredited campuses while those campuses remain in a loss position. In December 2014, ACICS reviewed the reports we submitted and in January 2015 notified us that ACICS is requesting that we submit similarly focused, updated financial reports and plans for each of the campuses it accredits for the twelve months ended December 31, 2014. In addition, several Career Colleges and Culinary Arts campuses are subject to financial reporting requirements to their applicable state licensing agencies.
The Higher Learning Commission acted on June 30, 2014 to continue the accreditation of AIU. A condition of this action was the submission of two interim monitoring reports. The first interim report was filed on November 10, 2014, for the quarter ending September 30, 2014. AIU must submit its second interim report to HLC on or about March 17, 2015. These interim reports contain quarterly financial updates for AIU.
State Authorization
State licensing agencies are responsible for the oversight of educational institutions, and continued approval by such agencies is necessary for an institution to operate and grant degrees, diplomas, or certificates to its students. Moreover, under the HEA, approval by such agencies is necessary to maintain eligibility to participate in Title IV Programs. As a result, we are subject to extensive regulation in each state in which our institutions are located, and in certain other states in which our institutions operate or recruit students. Currently, each of our campuses is authorized by the states in which it is located.
The level of regulatory oversight varies substantially from state to state. In certain states in which we operate, our campuses are subject to licensure by an agency that regulates proprietary institutions and also by a separate higher education agency. State laws establish standards for, among other things, student instruction, qualifications of faculty, location and nature of facilities, and financial policies. State laws and regulations may limit our campuses’ ability to operate or to award degrees or diplomas or offer new degree programs.
On October 29, 2010, ED issued final regulations pertaining to certain aspects of the administration of the Title IV Programs, including, but not limited to, state authorization. The October 29, 2010 regulations require, among other things, that an institution offering distance learning or online programs secure the approval of those states which require such approval and provide evidence of such approval to ED upon request. In addition, the regulations included certain mandates for states to modify their licensure requirements for online institutions. On July 12, 2011, the U.S. District Court for the District of Columbia struck down those portions of the October 29,
19
Table of Contents
2010 regulations requiring proof of state approval for online education programs. On June 12, 2012, the United States Court of Appeals for the District of Columbia Circuit affirmed this portion of the District Court decision related to these state authorization requirements for distance education.
In 2014, ED embarked upon program integrity negotiated rulemaking that included, among other issues, state authorization of distance education programs. In June 2014, ED announced that the state authorization rulemaking would be put on hold. In addition, ED also delayed the implementation of its final rule on state authorization of institutions that have a presence in different states. Regardless, our institutions offering distance learning have submitted additional applications for licensures or exemptions for their distance learning programs and have received approval from those states. Some of our institutions have elected to discontinue enrollment of students from certain states or in certain programs in lieu of obtaining licensure. State regulatory requirements for online education are inconsistent between states, change frequently and, in some instances, are not clear, and the interpretation of such regulations is generally left to the discretion of state employees or agents. In response to the proposed ED rules, certain states that did not regulate delivery of online courses and programs have enacted legislation or issued regulations that specifically address online educational programs, such as those offered by our institutions, and may enact or issue regulations impacting the availability of exemptions from licensure in certain states or otherwise affect our institutions’ operations.
In 2014, in order to make it easier for students to take online courses offered by postsecondary institutions in another state, a National Council for State Authorizing Reciprocity Agreements (SARA) was formed. The State Authorization Reciprocity Agreement is an agreement among member states, districts and territories that establishes comparable national standards for interstate offering of postsecondary distance education courses and programs. SARA is overseen by a national council and administered by four regional education compacts. States, districts and territories apply to become members of SARA (which, in many cases, requires action by state legislators) and institutions apply to their “home” state to become participants in the SARA compact. Current SARA states include: Washington, Alaska, Oregon, Idaho, Montana, Nevada, Arizona, Colorado, North Dakota, South Dakota, Nebraska, Kansas, Missouri, Minnesota, Louisiana, Indiana, West Virginia, Virginia and New Hampshire. Illinois, Iowa, Utah and Vermont have passed the necessary legislation to enable them to apply to participate in SARA. CTU has applied to the state of Colorado to become a SARA participant and as other states join the consortium, our other institutions will seek participation in SARA as well.
Additional State Regulatory Matters
Over the past several years, states have increased their focus on the private, postsecondary education sector. This includes increased activity by state attorneys general in their review of the sector. In this regard, we have several pending inquiries by state attorneys general. See Note 12 “Contingencies – State Investigations” to our consolidated financial statements for more information about these inquiries.
Additionally, on August 19, 2013, the Company entered into an Assurance of Discontinuance with the New York Attorney General. Under the terms of this agreement, without admitting or denying any findings by the New York Attorney General, the Company agreed to, among other things: calculate and disclose placement rates according to agreed upon procedures and retain an independent consultant or audit firm to independently verify and report on such placement rates and to teach out programs going forward that do not achieve a 47.5% minimum placement rate. The Company’s campuses in New York as well as AIU and CTU Online have each reported and published this additional agreed upon placement rate which, in the case of AIU and CTU Online, only includes New York resident graduates. For the 2014 reporting year, 12 of 47 reporting programs at our New York campuses calculated rates below the minimum threshold required by the Assurance of Discontinuance. These programs must improve their placement rates in subsequent periods or teach-out the program. None of the rates required to be calculated for AIU and CTU online were below the minimum threshold.
On June 20, 2014, the Attorney General of Massachusetts issued regulations, for immediate implementation, that limit the means by which proprietary institutions, including out-of-state online institutions, may serve
20
Table of Contents
students in the State of Massachusetts. The regulations apply only to proprietary institutions and significantly limit the contact schools may have with prospective students. They also include advance disclosure obligations with definitions and calculations that deviate materially from other defined measures historically applied in higher education by ED, state education regulatory agencies and ED recognized accreditors. Schools that do not follow these regulations will be considered to have engaged in unfair or deceptive acts or practices and be subject to enforcement action and potential fines under the Regulation of Business Practices for Consumer Protection law in Massachusetts. These regulations have adversely impacted our enrollment of prospective students in Massachusetts. We currently have ceased enrolling new online students from Massachusetts. Our current Massachusetts student enrollment is less than 1.0% of our total student enrollment as of December 31, 2014. Our LCB Boston campus is our only campus located in the state of Massachusetts and is reported as a component of discontinued operations as held for sale within our consolidated financial statements.
STUDENT FINANCIAL AID AND RELATED FEDERAL REGULATION
Many of our students require assistance in financing their education. Our institutions are approved to participate in the U.S. Department of Education’s Title IV federal aid programs. Our institutions also participate in a number of state financial aid programs, tuition assistance programs of the United States Armed Forces, education benefits administered by the Department of Veterans Affairs and other alternative funding sources. Our institutions that participate in federal and state financial aid programs are subject to extensive regulatory requirements imposed by federal and state government agencies, and other standards imposed by educational accrediting bodies.
Nature of Federal Support for Postsecondary Education in the United States
The U.S. government provides a substantial portion of its support for postsecondary education in the form of Title IV Program grants, loans and work-study programs to students who can use those funds to finance certain education related expenses at any institution that has been approved to participate by ED. These federal programs are authorized by the HEA. While most students are eligible for a Title IV loan, more generally, financial aid administered under Title IV is awarded on the basis of financial need, which is generally defined under the HEA as the difference between the costs associated with attending an institution and the amount a student’s family can reasonably be expected to contribute based on a federally determined formula. Among other things, recipients of Title IV Program funds must maintain a satisfactory grade point average and progress in a timely manner toward completion of their program of study.
Students at our institutions may receive grants, loans and work-study opportunities to fund their education under the Title IV Programs described in the sections below. In addition, some students at our institutions receive education related benefits pursuant to certain programs for veterans and military personnel, the most significant of which are described further below.
Federal Student and Parent Loans
ED’s major form of aid includes loans to students and parents through the William D. Ford Federal Direct Loan (“Direct Loan”) Program. Direct Loans are loans made directly by the U.S. Government to students or their parents. The Direct Loan program offers Federal Direct Stafford, Federal Direct PLUS (which provides loans to parents of dependent students and to graduate or professional students, known as Parent PLUS and Grad PLUS), and Federal Direct Consolidation Loans. Prior to July 1, 2010, students attending CEC institutions utilized loans made under the Federal Family Education Loan Program (“FFELP”) in addition to Direct Loans. Under the Health Care and Education Reconciliation Act of 2010, new FFELP loans were no longer originated as of July 1, 2010. The law provided that after June 30, 2010 all federal student and parent loans may only be made through the Direct Loan program.
Direct Loans are loans made to our students directly from the federal government. Students who have demonstrated financial need may be eligible to receive a Direct Subsidized Loan, with ED paying the interest on
21
Table of Contents
this loan while the student is enrolled at least half-time in school. Students who do not demonstrate financial need may be eligible to receive a Direct Unsubsidized Loan. As part of the Budget Control Act of 2011, beginning July 1, 2012, graduate/professional students are no longer eligible for Direct Subsidized Loans and may only receive Direct Unsubsidized Loans. With Direct Unsubsidized Loans the student is responsible for the interest while in school and after leaving school, although actual interest payments generally may be deferred by the student until after he or she has left school. Students who are eligible for a Direct Subsidized Loan may also be eligible to receive a Direct Unsubsidized Loan.
A student is not required to meet any specific credit scoring criteria to receive a Direct Loan, but any student with a default on a prior loan made under any Title IV Program or who has been convicted under federal or state law of selling or possessing drugs while receiving federal aid may not be eligible. ED has established maximum annual and aggregate borrowing limits for Direct Subsidized / Unsubsidized Loans.
The Direct PLUS Loan Program, provides loans to either the parents of dependent students (Direct Parent PLUS) or to graduate students (Direct Grad PLUS). Parents and graduate students who have an acceptable credit history may borrow a Direct PLUS Loan to pay the education related expenses of a child who is a dependent (Direct Parent PLUS) or a graduate student (Direct Grad PLUS) enrolled at least half-time at our eligible institutions. The amount of a Direct PLUS Loan cannot exceed the student’s cost of attendance less all other financial aid received.
The Federal Perkins Loan Program (“Perkins Loans”) is made from a revolving institutional Federal Perkins Fund account. The federal and institutional percentages of that account were determined by legislation in place at the time the institution received federal allocations. In 1993-94 and succeeding years, the educational institution’s contribution was at least one-third of the Federal Capital Contribution from ED. Each institution is responsible for award determination, disbursements, collections and servicing of the Federal Perkins Loans. Currently, only CTU participates in the Federal Perkins Loan program.
Federal Pell Grant and Federal Supplemental Education Opportunity Grant
Title IV Program grants are generally made to our students under the Federal Pell Grant (“Pell Grant”) program and the Federal Supplemental Educational Opportunity Grant (“FSEOG”) program. The 2014-15 maximum annual Pell Grant is $5,730. The FSEOG program awards are designed to supplement Pell Grants up to a maximum amount of $4,000 per academic year for the neediest students. Our institutions are required to provide matching funding for FSEOG awards that represent not less than 25% of the total FSEOG award to be received by eligible students. The matching may be accomplished through institutional, private and/or state funds.
Federal Work-Study (“FWS”) Program
Generally, under the FWS program, federal funds are used to pay 75% of the cost of part-time employment of eligible students to perform work for the institution or certain off-campus organizations. The remaining 25% is paid by the institution or the student’s employer. In select cases, these federal funds under the FWS program are used to pay up to 100% of the cost of part-time employment of eligible students.
Veteran’s Benefits Programs
Some of our students who are veterans use their benefits under the Montgomery GI Bill or the Post-9/11 Veterans Educational Assistance Act of 2008, as amended (“Post-9/11 GI Bill”), to cover their tuition. A certain number of our students are also eligible to receive funds from other education assistance programs administered by the Department of Veterans Affairs.
The Post-9/11 GI Bill Yellow Ribbon expanded education benefits for veterans who have served on active duty on or after September 11, 2001, including reservists and members of the National Guard. As originally
22
Table of Contents
passed, the Post-9/11 GI Bill provided that eligible veterans could receive benefits for tuition purposes up to the cost of in-state tuition at the most expensive public institution of higher education in the state where the veteran was enrolled. In addition, veterans who were enrolled in classroom-based programs or “blended programs” (programs that combine classroom learning and distance learning) could receive monthly housing stipends, while veterans enrolled in wholly distance-based programs were not entitled to a monthly housing stipend. The provisions regarding education benefits for post-9/11 veterans took effect August 1, 2009. The Post-9/11 GI Bill also increased the amount of education benefits available to eligible veterans under the pre-existing Montgomery GI Bill. The legislation also authorized expansion of service members’ ability to transfer veterans’ education benefits to family members.
On January 4, 2011, President Obama signed the Post-9/11 Veterans Educational Assistance Improvements Act of 2010 (“Improvements Act”) which amends the Post-9/11 GI Bill in several pertinent respects. The Improvements Act alters the way benefits related to tuition and fees are calculated. For nonpublic U.S. institutions, the Improvements Act bases the benefits related to tuition and fees on the net cost to the student (after accounting for state and federal aid, scholarships, institutional aid, fee waivers, and similar assistance paid directly to the institution for the sole purpose of defraying tuition cost) rather than the charges established by the institution, and it replaces the state-dependent benefit cap with a single national cap which is adjusted annually and as of August 1, 2014 is $20,235. In addition, veterans pursuing a program of education solely through distance learning on a more than half-time basis are eligible to receive up to 50% of the national average of the basic housing allowance available to service members who are at military pay grade E-5 and have dependents. Most “Improvements Act” changes took effect on August 1 or October 1, 2011, though changes to rules regarding eligibility for benefits were effective immediately or retroactively to the effective date of the Post-9/11 GI Bill. The Improvements Act did not change the Post-9/11 GI Bill’s provision that allows veterans to receive up to $1,000 per academic year for books, supplies, equipment, and other education costs. In March 2012, the Department of Veteran Affairs changed the Yellow Ribbon Agreement to an open ended agreement.
U.S. Military Tuition Assistance
Service members of the United States Armed Forces are eligible to receive tuition assistance from their branch of service through the Uniform Tuition Assistance Program of the Department of Defense (“DoD”). Service members may use this tuition assistance to pursue postsecondary degrees at postsecondary institutions that are accredited by accrediting agencies that are recognized by ED. Each branch of the armed forces has established its own rules for the tuition assistance programs of DoD.
In 2010, both the U.S. Congress and DoD increased their focus on DoD tuition assistance that is used for distance education and programs at proprietary institutions. The DoD Voluntary Education Partnership Memorandum of Understanding (MOU) was established as part of the revised DoD Instruction (DoDI) 1322.25, Voluntary Education Programs dated March 15, 2011. The MOU increases oversight of educational programs offered to active duty service members and conveys the commitments and agreements between the educational institution and DoD prior to accepting funds under the tuition assistance program. For example, the MOU requires an institution to agree to support DoD regulatory guidance, adhere to a bill of rights that is specified in the regulations, and participate in the proposed Military Voluntary Education Review program. Under the MOU, institutions must also agree to adhere to the principles and criteria established by the Service Members Opportunity Colleges Degree Network System regarding the transferability of credit and the awarding of credit for military training and experience. Institutions were required to sign the MOU by March 30, 2012. After March 1, 2013 institutions without a signed DoD MOU cannot enroll service members under the tuition assistance program until they have signed the MOU. Our institutions utilizing tuition assistance have signed DoD’s standard MOU.
In August 2013, DoD began incorporating the Principles of Excellence outlined in the President’s 2012 Executive Order into their current MOU. Refer to the section below for more information on the Principles of Excellence.
23
Table of Contents
In May 2014, the Department of Defense released a final version of its revised Memorandum of Understanding and its changes includes efforts to enhance departmental oversight of voluntary education programs as well as incorporate the remaining requirements as stated in the President’s Executive Order 13607. The new provisions apply to all educational institutions providing education programs through the DoD Tuition Assistance (TA) program. Among other things, the MOU requests that participating institutions provide meaningful information to students about the financial cost and attendance at an institution so military students can make informed decisions on where to attend school, will not use unfair, deceptive, and abusive recruiting practices and will provide academic and student support services to service members and their families. The revised MOU also implemented rules to strengthen existing procedures for access to DoD installations by educational institutions, a DoD Postsecondary Education Complaint System for service members, spouses, and adult family members to register student complaints and established authorization for the military departments to establish service-specific TA eligibility criteria and management controls. In September 2014, our institutions utilizing tuition assistance signed DoD’s standard MOU.
2012 Executive Order Regarding Military and Veterans Education Benefits
On April 27, 2012, President Obama issued an executive order regarding the establishment of Principles of Excellence for educational institutions receiving funding from federal military and veterans educational benefits programs, including those provided by the Post-9/11 GI Bill and Uniform Tuition Assistance Program of the DoD. The executive order requires DoD, the Department of Veterans Affairs and ED to establish and implement “Principles of Excellence” to apply to educational institutions receiving such funding. The goals of the Principles are broadly stated in the order and relate to disclosures of costs and amounts of costs covered by federal educational benefits, marketing standards, state authorization, accreditation approvals, standard institutional refund policies, educational plans and academic and financial advising. Various implementation mechanisms are included, along with the development and implementation of the “VA Shopping Sheet,” a standardized cost form with federal aid information. While additional administrative support has been required to comply with the executive order, the overall impact to the Company has not been material.
Alternative Student Financial Aid Sources
A financial institution providing a non-recourse loan assumes 100% of the credit risk on the loan. The student, or the student and a co-borrower, must meet the credit criteria established by the financial institution to receive these loans. Each financial institution establishes its own credit criteria and loan limits. Students and co-borrowers generally can borrow an amount equal to the student’s cost of attendance less all other financial aid received. Currently, with the exception of a few regional markets, non-recourse loans are not available to students attending our institutions. In addition, CEC does not participate in any recourse loan programs. In November of 2012, Sallie Mae discontinued offering new non-recourse private student loans to students attending our institutions. Sallie Mae has committed, however, to providing access to private loans for students actively attending such that they could continue to receive funding through the remainder of their program. Less than 1% of our 2014 cash receipts came from private lending sources. We anticipate a similar amount of our 2015 cash receipts will come from these sources.
Due to tightening lending standards, in 2008 we started offering funding alternatives for eligible students in place of a recourse program that had previously been provided by Sallie Mae. We decided to provide extended payment plans directly to certain students to ensure that they could finish their current educational programs with us and to allow new students the opportunity to attend our institutions. In early 2011, we discontinued our internal extended financing program. As of 12/31/2014, we have approximately $3.5 million outstanding related to our extended payment plan programs as reflected in our current and non-current student receivables, net of allowance for doubtful accounts, on our consolidated balance sheet.
24
Table of Contents
Eligibility and Certification by ED
Under the provisions of the HEA, an institution must apply to ED for continued certification to participate in Title IV Programs at least every six years or when it undergoes a change of control. In addition, an institution must obtain ED approval for certain substantial changes in its operations, including changes in an institution’s accrediting agency or state authorizing agency or changes to an institution’s structure or certain basic educational features.
Institutions approved to participate in Title IV sign a program participation agreement provided by ED that describes the terms of participation and includes a number of certifications and assurances made by the chief executive officer. As long as an institution has submitted an application for re-certification prior to the expiration of its current program participation agreement, the institution’s eligibility to participate in Title IV Programs continues on a month-to-month basis until ED completes its review. ED may issue full certification to an institution, it may deny certification or it may elect to issue provisional certification, in which case the program participation agreement outlines additional requirements that the institution must meet, such as seeking ED approval for new programs.
ED may place an institution on provisional certification status if it finds that the institution does not fully satisfy all required eligibility and certification standards. Provisional certification does not generally limit an institution’s access to Title IV Program funds. ED may withdraw an institution’s provisional certification without advance notice if ED determines that the institution is not fulfilling all material requirements.
A number of our institutions are in the recertification process and are, therefore, operating on month-to-month continuing program participation agreements. In addition, several of our institutions are currently on provisional certification. See Item 1A, “Risk Factors – Risks Related to the Highly Regulated Field in Which We Operate – If ED denies, or significantly conditions, recertification of any of our institutions to participate in Title IV Programs, that institution could not conduct its business as it is currently conducted,” and other risk factors in Item 1A for additional information about the risks surrounding continued participation in Title IV Programs.
The table below indicates the status of the program participation agreement (“PPA”) for each of our institutions, including the scheduled date of expiration, the date of application for currently pending recertifications and any provisional certification.
| Institution, Main Campus Location (Additional locations as defined by accreditors are in parentheses) |
Date PPA scheduled to expire (1) |
Date Recertification Application Submitted |
||||||
| American InterContinental University |
||||||||
| Schaumburg, IL (Online) (Atlanta, GA; Weston, FL; and Houston, TX) |
3/31/2013 | 9/26/2012 | ||||||
| Briarcliffe College (2) |
||||||||
| Bethpage, NY (includes Online) (Patchogue, NY) |
6/30/2013 | 3/26/2013 | ||||||
| Brooks Institute |
||||||||
| Ventura, CA |
3/31/2012 | 2/24/2012 | ||||||
| Colorado Technical University |
||||||||
| Colorado Springs, CO (Denver, CO; Sioux Falls, SD; and Online) |
9/30/2011 | 5/26/2011 | ||||||
| Harrington College of Design |
||||||||
| Chicago, IL |
12/31/2013 | 9/26/2013 | ||||||
| Le Cordon Bleu College of Culinary Arts |
||||||||
| Austin, TX (Dallas, TX; Sacramento, CA; Seattle, WA; and St. Peters, MO) |
9/30/2012 | 6/20/2012 | ||||||
| Pasadena, CA |
12/31/2011 | 8/10/2012 | ||||||
| Portland, OR (Tucker, GA and Mendota Heights, MN) |
3/31/2014 | 12/30/2013 | ||||||
| San Francisco, CA |
9/30/2013 | 6/27/2013 | ||||||
| Scottsdale, AZ (includes Online) (Cambridge, MA; Las Vegas, NV; and Miramar, FL) (3) |
6/30/2015 | N/A | ||||||
25
Table of Contents
| Institution, Main Campus Location (Additional locations as defined by accreditors are in parentheses) |
Date PPA scheduled to expire (1) |
Date Recertification Application Submitted |
||||||
| Le Cordon Bleu College of Culinary Arts in Chicago |
||||||||
| Chicago, IL |
12/31/2015 | N/A | ||||||
| Missouri College (4) |
||||||||
| Brentwood, MO |
12/31/2013 | 9/24/2013 | ||||||
| Sanford-Brown College |
||||||||
| Atlanta, GA (Ft. Lauderdale, FL; Houston, TX; Middleburg Heights, OH; and Sanford-Brown Institute, New York, NY) (4) |
12/31/2013 | 12/17/2013 | ||||||
| Chicago, IL (IADT Detroit, Troy, MI; IADT Nashville, Nashville, TN; and Collins College, Phoenix, AZ) |
6/30/2014 | 3/20/2014 | ||||||
| Dallas, TX (Sanford-Brown Institute, Garden City, NY) |
12/31/2013 | 9/27/2013 | ||||||
| Fenton, MO (4) |
9/30/2013 | 6/28/2013 | ||||||
| Jacksonville, FL (Sanford-Brown Institute, Iselin, NJ) |
12/31/2015 | N/A | ||||||
| McLean, VA (4) |
9/30/2013 | 6/27/2013 | ||||||
| Mendota Heights, MN (Brooklyn Center, MN) |
6/30/2014 | 3/21/2014 | ||||||
| Tampa, FL (Orlando, FL; Henderson, NV; San Antonio, TX; Seattle, WA; Online; IADT Sacramento, Sacramento, CA; and Le Cordon Bleu College of Culinary Arts, Orlando, FL) |
3/31/2014 | 12/31/2013 | ||||||
| White Plains, NY |
6/30/2013 | 3/15/2013 | ||||||
| SBI Campus—an Affiliate of Sanford-Brown |
||||||||
| Melville, NY |
12/31/2014 | 9/10/2014 | ||||||
| (1) | For PPA dates listed that have expired prior to December 31, 2014, applications for recertification were timely submitted and are pending approval by ED. |
| (2) | Briarcliffe College and its additional locations are currently on provisional certification due to open ED program reviews. |
| (3) | LCB Scottsdale and its additional locations are currently on provisional certification due to administrative capability. |
| (4) | Missouri College, SBC Atlanta, SBC Fenton and SBC McLean and their additional locations are currently on provisional certification due to rates reported pursuant to the 90-10 Rule. |
Increased Scrutiny of the Private, Postsecondary Education Sector
Over the past several years, Congress, ED, states, accrediting agencies, attorneys general and the media have increased their scrutiny of the private, postsecondary education sector. This includes a focus on issues surrounding student debt as well as publicly reported student outcomes that may be used as part of an institution’s recruiting and admissions practices.
Various Congressional hearings and roundtable discussions have been held, beginning in June 2010, by the U.S. Senate Committee on Health, Education, Labor and Pensions (“HELP Committee”) and other Congressional members and committees regarding various aspects of the education industry. In July 2012, the majority staff of the Senate HELP Committee released a report analyzing information requested from 30 companies operating proprietary institutions (including us and other publicly traded companies providing proprietary postsecondary education services). The report contended that these institutions have a high cost of attendance, engage in aggressive and deceptive recruiting, have high drop-out rates, provide insufficient student support services and are responsible for high levels of student debt and loan defaults, among other things, and called for increased disclosure of information about student outcomes at for-profit colleges and universities, as well as prohibiting institutions from using federal financial aid funding to market, advertise and recruit, among other things. In July 2014, the majority staff of the Senate HELP committee released a report claiming that eight of the ten top recipients of post-9/11 GI Bill funds are for-profit companies.
In addition, during the 113th Congress, various members of Congress proposed legislation that if adopted would have an affect on our business. The 114th Congress was inaugurated in January 2015 changing the
26
Table of Contents
majority part of the Senate to the Republican Party and ushering in leadership changes for both the Senate HELP Committee and the House Education and Workforce Committee. We anticipate that reauthorization of the Higher Education Act will be a priority for the relevant committees. Any actions that limit our participation in Title IV Programs or the amount of student financial aid for which our students are eligible would negatively impact our business. See Item 1A, “Risk Factors – Risks Related to the Highly Regulated Field in Which We Operate – Increased scrutiny of the for-profit postsecondary education sector by Congress, the President and various state and federal governmental agencies have resulted in adverse publicity and increased regulatory burdens and costs, and this trend may continue or intensify.”
Legislative Action and Recent ED Regulatory Initiatives
The U.S. Congress must periodically reauthorize the HEA and other laws governing Title IV Programs and annually determines the funding level for each Title IV Program.
The Higher Education Opportunity Act (“HEOA”) was the most recent reauthorization of the HEA and was signed into law on August 14, 2008. It was immediately effective for many items with others effective in subsequent years. The HEOA authorized increases in the Federal Pell Grants, changed certain grant eligibility requirements, expanded Stafford Loan deferment options, provided changes to needs analysis, changed treatment of Veterans Administration benefits effective with the 2010-11 award year and revised many of the regulations governing an institution’s eligibility to participate in Title IV Programs.
By law, the HEA must be reauthorized by Congress every five years. The last full reauthorization took place in 2008, which means that the next reauthorization was due in 2013. Congress failed to pass an on-time reauthorization bill; therefore an automatic one-year extension to December 2014 was established. In late 2014, Congress passed an extension to further delay reauthorization. Congress must continue to pass legislation to extend the Act until a reauthorization can occur. We anticipate that Congress will work to either reauthorize the HEA in its entirety or pass a series of smaller bills that focus on individual parts of the HEA, primarily Title IV federal student aid programs. Already we have seen legislation introduced that is focused on simplifying both access to and repayment of Title IV funds. Simplifying the federal student aid programs and reducing the complexity of repayment should be of benefit to our students.
In April 2013, ED announced its intention to establish one or more committees to negotiate and prepare proposed regulations under the HEA. ED held four public hearings in May and June 2013, at which interested parties suggested issues that should be considered for action by negotiated rulemaking committees. Following the public hearings, ED established three committees: one to address gainful employment in a recognized occupation, one to address campus safety and security reporting and disclosure based on the reauthorization of the Violence Against Women Act of 2013, and one to address program integrity and improvement issues for the federal student aid programs. The outcomes of these negotiated rulemaking committees are discussed further below.
Gainful Employment
CEC institutions, and most other proprietary institutions, qualify for Title IV program participation on the basis that they offer programs that, in addition to meeting other requirements, “prepare students for gainful employment in a recognized occupation.” As mentioned above, during 2013 ED established negotiated rulemaking committees, one specifically to address gainful employment in a recognized occupation and on October 30, 2014, ED published a new complex final regulation to define “gainful employment,” a term used in the Higher Education Act which historically has not been defined by Congress or ED. The new definition establishes a formula by which ED will determine if a program is eligible to participate in Title IV federal aid programs. The regulation requires graduates of programs within three years (or less) beyond graduation to, on average, have debt that is less than 8% of their annual earnings or 20% of their discretionary income. Programs whose graduates have debt that accounts for between 8% and 12% of their annual earnings, or between 20% and
27
Table of Contents
30% of their discretionary income, will be considered to be in the “zone” for meeting the gainful employment standard. Programs whose graduates have debt that is greater than 12% of annual earnings or 30% of discretionary income will fail the gainful employment test. Institutions with a program that fails to meet the gainful employment test for two out of three years, or that either fail or are in the zone for three out of four years, lose eligibility for that program to participate in Title IV for at least three years. Institutions with a program that is within a year of potentially disqualifying for participation must notify current and prospective students of the program of its potential loss of access to Title IV funds and the plan for continuation of the program or refunding tuition to students should the program fail to pass the gainful employment threshold in the subsequent year.
Under the new regulation, debt is calculated based on the lesser of actual median or mean debt, or the cost of tuition, fees, books, supplies and equipment. For the first five to seven years after the Secretary of Education begins to report gainful employment results, depending upon the length of the academic program, the Secretary will substitute for the average debt of the measurement cohort the average debt of the most recent graduating cohort. Earnings are based on data to be provided by the Social Security Administration (“SSA”). Institutions will have an opportunity to review and correct the list of students who will be submitted to SSA for the earnings query, but will not have an opportunity to inspect, review, question or appeal the results provided by SSA.
The gainful employment regulation includes a requirement that institutions report program level cohort default rates if directed to do so by the Secretary of Education.
The new regulation includes significant new disclosure requirements and creates additional certifications to which the chief executive officer must attest, including that the programs offered by the institution meet the requirements of states or professional licensing bodies in order for graduates to practice in the field.
We believe that certain of our Culinary Arts and Art & Design programs have the greatest risk of losing Title IV eligibility under the new gainful employment eligibility test, and that our programs within our University segments are more likely to pass. On December 18, 2014, our Board of Director’s approved a plan to sell the Company’s 16 Culinary Arts campuses. We are de-emphasizing certain Art & Design programs which have not produced positive operating results and are not positioned well under the new gainful employment regulations, and we are working to launch new programs that we believe are likely to have better gainful employment outcomes. There can be no assurance that our actions will result in compliance and the regulation could adversely affect the eligibility of the programs we offer. See Item 1A, “Risk Factors – Risks Related to the Highly Regulated Field in Which We Operate – ED’s gainful employment regulations may limit the programs we can offer students and increase our cost of operations,” for more information about risks associated with the gainful employment regulation.
In November 2014, two organizations filed separate lawsuits against ED in federal courts seeking to have the new regulation invalidated. Both suits allege that ED exceeded its statutory authority in promulgating the regulation, that the regulation violates the institution’s constitutional rights and that the regulation is arbitrary and capricious. We cannot predict when or how the courts may rule on these lawsuits.
Violence Against Women Act
As mentioned above, during 2013 ED established negotiated rulemaking committees, one to address campus safety and security reporting and disclosure based on the reauthorization of the Violence Against Women Act of 2013 and on June 24, 2014, ED published proposed rules to implement the changes made to the Clery Act, a federal law requiring colleges and universities to disclose information about crimes around and on a campus, by the Violence Against Women Reauthorization Act of 2013. Final rules were published on October 20, 2014. These new rules contain additional disclosure requirements which we anticipate will increase our administrative burden.
28
Table of Contents
Program Integrity and Improvement
The negotiated rulemaking committee established to address program integrity and improvement issues for the federal student aid programs met four times from February through May 2014. Topics for discussion included clock-to-credit-hour conversion, state authorization (distance education and foreign institutions), cash management, retaking coursework and the definition of adverse credit for Direct PLUS loan eligibility. At their final meeting in May of 2014, the taskforce agreed on only four out of six topics negotiated. Because the team failed to reach consensus on all items, ED is free to develop their own regulatory language for comment.
On August 8, 2014, ED published proposed regulations to update eligibility standards and improve access for student and parent borrowers under the Federal Direct PLUS Loan Program. Final rules were published on October 23, 2014 updating the standard for determining if a potential parent or student borrower has an adverse credit history for purposes of eligibility for a Direct PLUS Loan. These regulations also require parents and students who have an adverse credit history, but who are approved for a Direct PLUS loan on the basis that extenuating circumstances exist or by obtaining an endorser for the loan, to receive loan counseling before receiving the loan. Although these rules do not go into effect until July 1, 2015, ED is permitting early implementation of the new criteria by institutions commencing March 29, 2015. The increase in administrative burden under these new regulations is not expected to have a material effect on our business.
Neither proposed nor final rules have been issued for the other program integrity and improvement topics. Therefore, we cannot predict the outcome or any related impact of these remaining items.
Compliance with Federal Regulatory Standards and Effect of Federal Regulatory Violations
To be eligible to participate in Title IV Programs, an institution must comply with the HEA and regulations thereunder that are administered by ED. We and our institutions are subject to audits, compliance reviews, inquiries, investigations, claims of non-compliance, and lawsuits by ED and federal and state regulatory agencies, accrediting agencies, present and former students and employees, and others that may allege violations of statutes, regulations, accreditation standards, or other regulatory requirements applicable to us or our institutions. If the results of any such audits, reviews, investigations, claims, or actions are unfavorable to us, we may be required to pay monetary damages or be subject to fines, operational limitations, loss of federal funding, injunctions, additional oversight and reporting, provisional certification or other civil or criminal penalties. In addition, if ED or another regulatory agency determined that one of our institutions improperly disbursed Title IV Program funds or violated a provision of the HEA or ED’s regulations, that institution could be required to repay such funds, and could be assessed an administrative fine.
We have several such matters pending against us at one or more of our institutions. See Note 12 “Contingencies” to our consolidated financial statements for further discussion of certain of these matters, including that in December 2011 ED moved all of our institutions from what is called the Advance Method of Payment of Title IV funds to what is called Heightened Cash Monitoring 1, or HCM1, status. Although our prior practices substantially conformed to the requirements of this more restrictive method of drawing down students’ Title IV Program funds, if ED finds violations of the HEA or related regulations, ED may impose monetary or program level sanctions, or transfer our institutions to the “reimbursement” or Heightened Cash Monitoring 2 (“HCM2”) methods of payment of Title IV Program funds, which would result in a significant delay in receiving those funds.
The HEA also requires that an institution’s administration of Title IV Program funds be audited annually by an independent accounting firm and that the resulting audit report be submitted to ED for review.
“90-10 Rule”
Under a provision of the HEA commonly referred to as the “90-10 Rule,” any of our institutions or OPEIDs that, on modified cash basis accounting, derives more than 90% of its cash receipts from Title IV sources for a fiscal year will be placed on provisional participation status for its next two fiscal years. If an OPEID does not
29
Table of Contents
satisfy the 90-10 Rule for two consecutive fiscal years, it will lose its eligibility to participate in the Title IV Programs for at least two fiscal years. We have substantially no control over the amount of Title IV student loans and grants sought by or awarded to our students. If the OPEID violates the 90-10 Rule and becomes ineligible to participate in Title IV Programs but continues to disburse Title IV Program funds, ED would require repayment of all Title IV Program funds received by it after the effective date of the loss of eligibility.
Effective July 1, 2008, the annual unsubsidized Stafford loans available for undergraduate students was increased by $2,000. The HEOA provided temporary 90-10 Rule relief from this increase by permitting institutions to count the additional $2,000 in Stafford loans dispersed before July 1, 2011 as revenue not derived from Title IV Programs. The expiration of the temporary relief in the HEOA with respect to unsubsidized Stafford loans as of July 1, 2011 and several other factors have adversely affected our institutions’ 90-10 Rule percentages since 2012, including the increase in Title IV Program aid availability, budget-related reductions in state grant and workforce training programs and other alternative funding sources that have historically helped institutions in our industry to comply with the 90-10 Rule.
We have implemented various measures intended to reduce the percentage of our institution’s cash basis revenue attributable to Title IV Program funds, including emphasizing employer-paid and other direct-pay education programs; the use of externally funded scholarships and grants; increased emphasis on programs supported under the Workforce Investment Act and other employment-based programs administered by ED; counseling students to carefully evaluate the amount of necessary Title IV Program borrowing; and, for certain campuses, increasing the level of accredited non-Title IV Programs in our institutions.
The ability of our institutions to maintain 90-10 rates below 90% will depend on the impact of future changes in our enrollment mix, and regulatory and other factors outside of our control, including any reduction in government assistance for military personnel, including veterans, or changes in the treatment of such funding for purposes of the 90-10 rate calculation. Changes in, or new interpretations of, the technical aspects of the calculation methodology or other industry practices under the 90-10 Rule could further significantly impact our compliance with the 90-10 Rule.
Because of the increases in Title IV Program student loan limits and grants in recent years, we believe that many proprietary institutions are experiencing difficulty with respect to 90-10 Rule compliance. In our view, one potential unintended consequence of this pressure is higher tuition rates. This is because one of the only methods under the control of the institution that can reduce the 90-10 Rule percentage is to increase tuition prices above the applicable maximums for Title IV Program student loans and grants, requiring students to seek other sources of funding to pay eligible tuition and fees in order to reduce the percentage of revenue from Title IV sources. However, this consequence directly undermines the shared interest in promoting affordable postsecondary education. Although employer-paid tuition programs can reduce a student’s reliance on Title IV funds, in most cases the student must pre-pay the educational cost and be reimbursed directly by the employer after successful completion of the class(es). This means that many students who take advantage of tuition benefits provided by their employer remain reliant on Title IV funds to pay tuition for which they later will be reimbursed, and employer-paid tuition benefits may not have the anticipated positive impact on the 90-10 ratio. Although modification of the 90-10 rule could limit this undesirable impact on tuition, there is no assurance that Congress will address this problem by modifying the rule or will address it in a manner that timely and favorably impacts compliance by our institutions. We have adjusted tuition at several of our campuses and programs that are under pressure to comply with the 90-10 Rule, which could adversely affect our enrollment and our cohort default rates. For our 2014 fiscal year, our preliminary review of our institutions’ 90-10 Rule percentages results in none of our OPEIDs exceeding the 90% limit.
See Item 1A, “Risk Factors – Risks Related to the Highly Regulated Field in Which We Operate – Our institutions could lose their eligibility to participate in federal student financial aid programs if the percentage of their revenues derived from those programs is too high,” for additional information regarding risks relating to the 90-10 Rule.
30
Table of Contents
Student Loan Default Rates
An institution may lose eligibility to participate in some or all Title IV Programs if the rates at which its former students default on the repayment of their federally-guaranteed or federally-funded student loans exceed specified percentages. This is determined by an institution’s cohort default rate which is calculated on an annual basis as a measure of administrative capability. Each cohort is the group of students who first enter into student loan repayment during a federal fiscal year (ending September 30). Previously the cohort default rate was measured on a two year period. The 2011 cohort was the last cohort to be measured under the two-year period and was published in September of 2013. As discussed below, the measurement period for the cohort default rate has transitioned to three years starting with the 2009 cohort. The three-year cohort default rates for the 2009 and 2010 cohorts were also published by ED in September 2012 and 2013, respectively.
Under both the former two year and current three year measurement periods, if an educational institution’s cohort default rate exceeds 10% for any one of the three preceding years, it must delay for 30 days the release of the first disbursement of U.S. federal student loan proceeds to first time borrowers enrolled in the first year of an undergraduate program. As a matter of regular practice, all of our institutions have implemented a 30-day delay for such disbursements.
As mentioned above, the cohort default rate requirements were modified by the HEOA enacted in August 2008 to increase by one year the measuring period for each cohort. In September 2014, ED published the official three-year cohort default rates for the 2011 cohort. This was the third year of official rates under the three year measurement period. Beginning with the 2009 cohort, if an institution’s three-year cohort default rate exceeds 30% for any given year, it must establish a default prevention task force and develop a default prevention plan with measurable objectives for improving the cohort default rate. We believe that our current repayment management efforts meet these requirements. For the 2011 cohort, no CEC institution had official rates in excess of the 30% threshold. As we disclosed previously, LCB Austin’s 2011 draft rates did initially exceed 30%, however through the ED challenge and appeals processes, LCB Austin’s 2011 official cohort default rate was adjusted to 29.5%. As a result of the challenge and appeal process, LCB Austin’s 2010 official rates were revised from 28.9% to 30.8%.
Beginning with the three-year cohort default rate for the 2011 cohort published in September 2014, only the three-year rates will be applied for purposes of measuring compliance with the requirements and imposing sanctions, as follows:
| • | Annual test. If the three-year cohort default rate for any given year exceeds 40%, the institution will cease to be eligible to participate in Title IV Programs; and |
| • | Three consecutive years test. If the institution’s three-year cohort default rate exceeds 30% (an increase from the 25% threshold that was applicable to the two-year cohort default rates) for three consecutive years, beginning with the 2009 cohort, the institution will cease to be eligible to participate in Title IV Programs. |
We have student loan default management initiatives at all of our institutions that participate in Title IV Programs aimed at reducing the likelihood of our students’ failure to repay their loans in a timely manner. These initiatives emphasize the importance of students’ compliance with loan repayment requirements and provide for extensive loan counseling and proactive communication with students after they cease enrollment.
See Item 1A, “Risk Factors – Risks Related to the Highly Regulated Field in Which We Operate – Our institutions could lose their eligibility to participate in federal student financial aid programs or have other limitations placed upon them if their student loan cohort default rates are greater than the standards set by ED,” for additional information regarding risks relating to cohort default rates.
31
Table of Contents
In September 2014, ED released the third official three-year cohort default rates for the 2011 cohort. A listing of the official 2011, 2010 and 2009 three-year cohort default rates, for each of our main and additional (branch) campus locations for regulatory purposes is provided in the table below.
COHORT DEFAULT RATE TABLE
| Cohort Default Rates | ||||||||||||
| 3-year rate | ||||||||||||
| School, Main Campus Location (Additional locations as defined by accreditors are in parentheses) |
2011 | 2010 | 2009 | |||||||||
| American InterContinental University |
||||||||||||
| Schaumburg, IL (Online) (Atlanta, GA; Weston, FL; and Houston, TX) |
21.0 | % | 23.2 | % | 27.4 | % | ||||||
| Briarcliffe College |
||||||||||||
| Bethpage, NY (includes Online) (Patchogue, NY) |
15.1 | % | 20.0 | % | 21.5 | % | ||||||
| Brooks Institute |
||||||||||||
| Ventura, CA |
12.6 | % | 11.6 | % | 16.1 | % | ||||||
| Colorado Technical University |
||||||||||||
| Colorado Springs, CO (Denver, CO; Sioux Falls, SD; and Online) |
19.4 | % | 22.8 | % | 25.0 | % | ||||||
| Harrington College of Design |
||||||||||||
| Chicago, IL |
13.2 | % | 13.6 | % | 12.2 | % | ||||||
| Le Cordon Bleu College of Culinary Arts |
||||||||||||
| Austin, TX (Dallas, TX; Sacramento, CA; Seattle, WA; and St. Peters, MO) |
29.5 | % | 30.8 | % | 28.8 | % | ||||||
| Pasadena, CA |
26.0 | % | 26.7 | % | 20.7 | % | ||||||
| Portland, OR (Tucker, GA and Mendota Heights, MN) |
22.7 | % | 24.0 | % | 23.9 | % | ||||||
| San Francisco, CA |
25.0 | % | 25.1 | % | 19.8 | % | ||||||
| Scottsdale, AZ (includes Online) (Cambridge, MA; Las Vegas, NV; and |
26.3 | % | 28.5 | % | 26.4 | % | ||||||
| Le Cordon Bleu College of Culinary Arts in Chicago |
||||||||||||
| Chicago, IL |
26.7 | % | 23.2 | % | 28.3 | % | ||||||
| Missouri College |
||||||||||||
| Brentwood, MO |
18.4 | % | 19.0 | % | 22.2 | % | ||||||
| Sanford-Brown College |
||||||||||||
| Atlanta, GA (Ft. Lauderdale, FL; Houston, TX; Middleburg Heights, OH; and Sanford-Brown Institute, New York, NY) |
20.3 | % | 22.6 | % | 28.4 | % | ||||||
| Chicago, IL (IADT Detroit, Troy, MI; IADT Nashville, Nashville, TN; and Collins College, Phoenix, AZ) |
25.6 | % | 26.8 | % | 28.6 | % | ||||||
| Dallas, TX (Sanford-Brown Institute, Garden City, NY) |
19.7 | % | 19.4 | % | 23.9 | % | ||||||
| Fenton, MO |
21.1 | % | 23.5 | % | 26.9 | % | ||||||
| Jacksonville, FL (Sanford-Brown Institute, Iselin, NJ) |
22.1 | % | 24.2 | % | 27.5 | % | ||||||
| McLean, VA |
26.2 | % | 31.6 | % | 31.5 | % | ||||||
| Mendota Heights, MN (Brooklyn Center, MN) |
19.5 | % | 15.4 | % | 21.4 | % | ||||||
| Tampa, FL (Orlando, FL; Henderson, NV; San Antonio, TX; Seattle, WA; Online; IADT Sacramento, Sacramento, CA; and Le Cordon Bleu College of Culinary Arts, Orlando, FL) |
26.7 | % | 26.8 | % | 26.9 | % | ||||||
| White Plains, NY |
19.0 | % | 27.1 | % | 27.7 | % | ||||||
| SBI Campus—an Affiliate of Sanford-Brown |
||||||||||||
| Melville, NY |
21.4 | % | 26.2 | % | 26.6 | % | ||||||
Financial Responsibility Standards
To participate in Title IV Programs, our institutions must either satisfy standards of financial responsibility prescribed by ED, or post a letter of credit in favor of ED and possibly accept other conditions on its participation
32
Table of Contents
in Title IV Programs. Pursuant to the Title IV Program regulations, each eligible higher education institution must, among other things, satisfy a quantitative standard of financial responsibility that is based on a weighted average of three annual tests which assess the financial condition of the institution. The three tests measure primary reserve, equity and net income ratios. The Primary Reserve Ratio is a measure of an institution’s financial viability and liquidity. The Equity Ratio is a measure of an institution’s capital resources and its ability to borrow. The Net Income Ratio is a measure of an institution’s profitability. These tests provide three individual scores that are converted into a single composite score. The maximum composite score is 3.0. If the institution achieves a composite score of at least 1.5, it is considered financially responsible without conditions or additional oversight. A composite score from 1.0 to 1.4 is considered to be in “the zone” of financial responsibility, and a composite score of less than 1.0 is not considered to be financially responsible. If an institution is in “the zone” of financial responsibility, the institution may establish eligibility to continue to participate in Title IV Programs on the following alternative bases:
| • | Zone Alternative. Under what is referred to as the “zone alternative,” an institution may continue to participate in Title IV Programs for up to three years under additional monitoring and reporting procedures but without having to post a letter of credit in favor of ED. These additional monitoring and reporting procedures include being transferred from the “advance” method of payment of Title IV Program funds to cash monitoring status (referred to as Heightened Cash Monitoring 1, or HCM1, status) or to the “reimbursement” or Heightened Cash Monitoring 2 (“HCM2”) methods of payment. If an institution does not achieve a composite score of at least 1.0 in one of the three subsequent years or does not improve its financial condition to attain a composite score of at least 1.5 by the end of the three-year period, the institution must satisfy another alternative standard to continue participating in Title IV Programs. |
| • | Letter of Credit Alternative. An institution that fails to meet one of the standards of financial responsibility, including by having a composite score less than 1.5, may demonstrate financial responsibility by submitting an irrevocable letter of credit to ED in an amount equal to at least 50% of the Title IV Program funds that the institution received during its most recently completed fiscal year. |
| • | Provisional Certification. If an institution fails to meet one of the standards of financial responsibility, including by having a composite score less than 1.5, ED may permit the institution to participate under provisional certification for up to three years. If ED permits an institution to participate under provisional certification, an institution must comply with the requirements of the “zone alternative,” including being transferred to the HCM1, HCM2 or “reimbursement” method of payment of Title IV Program funds, and must submit a letter of credit to ED in an amount determined by ED which can range from 10%-100% of the Title IV Program funds that the institution received during its most recently completed fiscal year. If an institution is still not financially responsible at the end of the period of provisional certification, including because it has a composite score of less than 1.0, ED may again permit provisional certification subject to the terms ED determines appropriate. |
ED applies its quantitative financial responsibility tests annually based on an institution’s audited financial statements and may apply the tests if an institution undergoes a change in control or under other circumstances. ED also may apply the tests to the parent company of our institutions, and to other related entities. Recent profitability declines and the write down of the carrying value of non-financial assets, such as deferred tax assets and goodwill, have negatively impacted our financial responsibility composite scores. Our composite score for the consolidated entity for the year ended December 31, 2013 was 1.5, and our preliminary calculation for the year ended December 31, 2014 is 1.5, which are considered financially responsible without conditions or additional oversight. See Item 7, “Management’s Discussion and Analysis of Financial Condition and Results of Operation – Liquidity, Financial Position and Capital Resources,” for more information regarding our efforts to comply with ED’s standards of financial responsibility. If in the future we are required to satisfy ED’s standards of financial responsibility on an alternative basis, including potentially by posting irrevocable letters of credit, we may not have the capacity to post these letters of credit.
33
Table of Contents
Accreditor and state regulatory requirements also address financial responsibility, and these requirements vary among agencies and also are different from the ED requirements. Any developments relating to our satisfaction of ED’s financial responsibility requirements may lead to additional focus or review by our accreditors or applicable state agencies regarding their respective financial responsibility requirements.
See Item 1A, “Risk Factors – Risks Related to the Highly Regulated Field in Which We Operate – A failure to demonstrate ‘financial responsibility’ or ‘administrative capability’ would have negative impacts on our operations,” for additional information regarding risks relating to the financial responsibility standards.
Return and Refunds of Title IV Program Funds
An institution participating in Title IV Programs must correctly calculate the amount of unearned Title IV Program funds that were disbursed to students who withdrew from educational programs before completing the programs, and must return those funds in a timely manner.
The portion of tuition and registration fee payments received from students but not yet earned is recorded as deferred tuition revenue and reflected as a current liability on our consolidated balance sheets, as such amounts represent revenue that we expect to earn within the next year. If a student withdraws from one of our institutions prior to the completion of the academic term or program period, we refund the portion of tuition and registration fees already paid that we are not entitled to retain, pursuant to applicable federal and state law and accrediting agency standards and our refund policy. The amount of funds to be refunded on behalf of a student is calculated based upon the period of time in which the student has attended classes and the amount of tuition and registration fees paid by the student as of the student’s withdrawal date. Such refunds typically result in a reduction to deferred tuition revenue and cash on our consolidated balance sheets, because generally, we do not recognize tuition revenue in our consolidated statements of (loss) income and comprehensive (loss) income until related refund provisions have lapsed.
Institutions are required to return any unearned Title IV funds within 45 days of the date the institution determines that the student has withdrawn. An institution that is found to be in non-compliance with ED refund requirements for either of the last two completed fiscal years must post a letter of credit in favor of ED in an amount equal to 25% of the total Title IV Program returns that were paid or should have been paid by the institution during its most recently completed fiscal year. As of December 31, 2014, we have posted no letters of credit in favor of ED due to non-compliance with ED refund requirements.
Change of Ownership or Control
When an institution undergoes a change of ownership resulting in a change of control, as that term is defined by the state in which it is located, its accrediting agency and ED, it must secure the approval of those agencies to continue to operate and to continue to participate in Title IV Programs. If the institution is unable to re-establish state authorization and accreditation requirements and satisfy other requirements for certification by ED, the institution may lose its authority to operate and its ability to participate in Title IV Programs. An institution whose change of ownership or control is approved by the appropriate authorities is nonetheless provisionally re-certified by ED for a period of up to three years. Transactions or events that constitute a change of control by one or more of the applicable regulatory agencies, including ED, applicable state agencies, and accrediting bodies, include the acquisition of an institution from another entity or significant acquisition or disposition of an institution’s equity. It is possible that some of these events may occur without our control. Our failure to obtain, or a delay in obtaining, a required approval of any change in control from ED, applicable state agencies, or accrediting agencies could impair our ability or the ability of the affected institutions to participate in Title IV Programs. If we were to undergo a change of control and a material number of our institutions failed to obtain the required approvals from applicable regulatory agencies in a timely manner, our student population, financial condition, results of operations and cash flows could be materially adversely affected.
34
Table of Contents
When we acquire an institution that is eligible to participate in Title IV Programs, that institution undergoes a change of ownership resulting in a change of control as defined by ED. Each of our acquired institutions has undergone a certification review under our ownership and has been certified to participate in Title IV Programs on a provisional basis, per ED requirements, until such time that ED signs a new program participation agreement with the institution. Currently, none of our institutions are subject to provisional certification status due to ED’s change of ownership criteria. The potential adverse effects of a change of control under ED regulations may influence future decisions by us and our stockholders regarding the sale, purchase, transfer, issuance or redemption of our common stock.
Opening New Institutions, Start-up Campuses, and Adding Educational Programs
The HEA generally requires that proprietary institutions be fully operational for two years before applying to participate in Title IV Programs. However, an institution that is certified to participate in Title IV Programs may establish a start-up branch campus or location and participate in Title IV Programs at the start-up campus without reference to the two-year requirement if the start-up campus has received all of the necessary state and accrediting agency approvals, has been reported to ED, and meets certain other criteria as defined by ED. Nevertheless, under certain circumstances, a start-up branch campus may also be required to obtain approval from ED to be able to participate in Title IV Programs.
In addition to ED regulations, certain of the state and accrediting agencies with jurisdiction over our institutions have requirements that may affect our ability to open a new institution, open a start-up branch campus or location of one of our existing institutions, or begin offering a new educational program at one of our institutions. If we establish a new institution, add a new branch start-up campus, or expand program offerings at any of our institutions without obtaining the required approvals, we would likely be liable for repayment of Title IV Program funds provided to students at that institution or branch campus or enrolled in that educational program, and we could also be subject to sanctions. Also, if we are unable to obtain the approvals from ED, applicable state regulatory agencies, and accrediting agencies for any new institutions, branch campuses, or program offerings where such approvals are required, or to obtain such approvals in a timely manner, our ability to grow our business would be impaired and our financial condition, results of operations and cash flows could be materially adversely affected.
Administrative Capability
ED regulations specify extensive criteria that an institution must satisfy to establish that it has the requisite administrative capability to participate in Title IV Programs. These criteria relate to, among other things, institutional staffing, operational standards such as procedures for disbursing and safeguarding Title IV Program funds, timely submission of accurate reports to ED and various other procedural matters. If an institution fails to satisfy any of ED’s criteria for administrative capability, ED may require the repayment of Title IV Program funds disbursed by the institution, place the institution on provisional certification status, require the institution to receive Title IV Program funds under another funding arrangement, impose fines or limit or terminate the participation of the institution in Title IV Programs.
Restrictions on Payment of Commissions, Bonuses and Other Incentive Payments
An institution participating in Title IV Programs cannot provide any commission, bonus, or other incentive payment based directly or indirectly on success in securing enrollments or Title IV financial aid to any persons or entities engaged in any student recruiting or admission activities or in making decisions regarding the award of student financial assistance. New regulations issued in October 2010 which became effective July 1, 2011 rescinded previously issued ED guidance and “safe harbors” relied upon by higher education institutions in making decisions how they managed, compensated and promoted individuals engaged in student recruiting and the awarding of financial aid and their supervisors. The elimination of these “safe harbor” protections and guidance required us to terminate certain compensation payments to our affected employees and to implement
35
Table of Contents
changes in contractual and other arrangements with third parties to change structures formerly allowed under ED rules, and has had an impact on our ability to compensate, recruit, retain and motivate affected admissions and other affected employees as well as on our business arrangements with third-party lead generators and other marketing vendors.
Further, ED provided very limited published guidance regarding this rule and does not establish clear criteria for compliance for many circumstances. If ED determined that an institution’s compensation practices violated these standards, ED could subject the institution to monetary fines, penalties or other sanctions.
Substantial Misrepresentation
The HEA prohibits an institution participating in Title IV Programs from engaging in substantial misrepresentation of the nature of its educational programs, financial charges, graduate employability or its relationship with ED. Under ED’s rules, a “misrepresentation” is any statement (made in writing, visually, orally or otherwise) made by the institution, any of its representatives or a third party that provides educational programs, marketing, advertising, recruiting, or admissions services to the institution, that is false, erroneous or has the likelihood or tendency to deceive, and a “substantial misrepresentation” is any misrepresentation on which the person to whom it was made could reasonably be expected to rely, or has reasonably relied, to that person’s detriment. Considering the broad definition of “substantial misrepresentation,” it is possible that, despite our training efforts and compliance programs, our institutions’ employees or service providers may make statements that could be construed as substantial misrepresentations. In addition, ED’s gainful employment regulation requires the disclosure of select student outcome metrics and in the future will include a number of new metrics on institutional websites and during enrollment to all new students. Errors or omissions in these metrics may be used by ED as the basis for a finding of “substantial misrepresentation.” If ED determines that one of our institutions has engaged in substantial misrepresentation, ED may revoke the institution’s program participation agreement, deny applications from the institution for approval of new programs or locations or other matters, or initiate proceedings to fine the institution or limit, suspend, or terminate its eligibility to participate in Title IV Programs; the institution could also be exposed to increased risk of action under the federal False Claims Act.
OTHER INFORMATION
Our website address is www.careered.com. We make available within the “Investor Relations” portion of our website under the caption “Financial Information,” free of charge, our annual reports on Form 10-K, quarterly reports on Form 10-Q, and current reports on Form 8-K, including any amendments to those reports, as soon as reasonably practicable after we electronically file or furnish such materials to the U.S. Securities and Exchange Commission (“SEC”). Materials that we file or furnish to the SEC may also be read and copied at the SEC’s Public Reference Room at 100 F Street, N.E., Washington, DC 20549. Information on the operation of the Public Reference Room may be obtained by calling the SEC at 1-800-SEC-0330. Also, the SEC maintains an Internet site at www.sec.gov that contains reports, proxy and information statements, and other information that we file electronically with the SEC. Information contained on our website is expressly not incorporated by reference into this Form 10-K.
36
Table of Contents
| Item 1A. | RISK FACTORS |
Risks Related to the Highly Regulated Field in Which We Operate
Increased scrutiny of the for-profit postsecondary education sector by Congress, the President and various state and federal governmental agencies have resulted in adverse publicity and increased regulatory burdens and costs, and this trend may continue or intensify.
We and other for-profit postsecondary education providers have been subject to increased regulatory scrutiny and litigation in recent years. State Attorneys General, ED, the President, members and committees of Congress, various advocacy and lobbying groups and other parties have increasingly focused on various aspects of the education industry, including accreditation matters, student debt, student recruiting, student success and outcomes and other matters. This increased scrutiny has led to negative publicity about these topics and we expect this to continue.
Congress, ED and certain states have adopted and proposed legislation directed at the for-profit education sector, and the reauthorization of the HEA is pending. The increased scrutiny of the for-profit postsecondary education sector and the focus on U.S. debt levels and deficit spending could lead to significant regulatory changes in connection with the upcoming reauthorization of the HEA or otherwise, and many of these changes are likely to be adverse to postsecondary institutions generally or for-profit institutions specifically. Various groups continue to actively lobby state and federal regulators to adopt stringent rules selectively targeting for-profit institutions. Further, these circumstances could also lead to additional federal or other investigations of the sector and third-party litigation alleging statutory violations, regulatory infractions or common law causes of action.
The further adoption of laws or regulations that limit our institutions’ ability to attract new students or that reduce funding for federal student financial aid programs or the ability of our institutions or students to participate in these programs could have a material adverse effect on our student population and revenue. Legislative action may also increase our administrative costs and require us to modify our practices or strategies in order for our institutions to comply with applicable requirements.
If our institutions fail to comply with the extensive regulatory requirements applicable to our business, we could incur financial penalties, restrictions on our operations, loss of federal and state financial aid funding for our students, or loss of our authorization to operate our institutions.
We are subject to extensive federal and state regulation as a provider of postsecondary education. The applicable regulatory requirements cover virtually all phases of the operations of our institutions, including educational program offerings, facilities, instructional and administrative staff, administrative procedures, marketing and recruiting, financial operations, payment of refunds to students who withdraw, financial aid to students, acquisitions or openings of new institutions, additions of new educational programs, closure or relocation of existing locations and changes in corporate structure and ownership. ED is our primary federal regulator pursuant to the HEA.
A significant portion of our U.S.-based students rely on Title IV Programs, and we derive a substantial portion of our revenue and cash flows from Title IV Programs. For example, for the fiscal year ended December 31, 2014, approximately 90% of our U.S.-based students who were in a program of study at any date during that year participated in Title IV Programs, which resulted in Title IV Program cash receipts recorded by the Company of approximately $695 million.
All of our institutions participate in Title IV Programs and are subject to extensive regulation by ED, various state agencies and accrediting commissions. To participate in Title IV Programs, an institution must receive and maintain authorization by the appropriate state education agencies, be accredited by an accrediting commission recognized by ED, and be certified by ED as an eligible institution. Most ED requirements are
37
Table of Contents
applied on an institutional basis, with an institution defined by ED as a main campus and any of its branch campuses or additional locations. Each institution is assigned an identification number known as an OPEID, or Office of Postsecondary Education Identification number, with each institution’s branches and other locations assigned to the institution’s OPEID.
The regulations, standards and policies of our regulators change frequently and are subject to interpretation, particularly where they are crafted for traditional, academic term-based institutions rather than our non-term academic delivery model. Changes in, or new interpretations of, applicable laws, regulations or standards could have a material adverse effect on our accreditation, authorization to operate in various states, permissible activities, receipt of funds under Title IV Programs, or costs of doing business. We cannot predict with certainty how all of the requirements applied by our regulators will be interpreted or whether our institutions will be able to comply with these requirements in the future.
If we are found to have violated any applicable regulations, standards or policies, we may be subject to the following sanctions, among others, imposed by any one or more of the relevant regulatory agencies or other government bodies:
| • | imposition of monetary fines or penalties; |
| • | repayment of funds received under Title IV or other federal programs or state financial aid programs; |
| • | restrictions on, or termination of, our institutions’ eligibility to participate in Title IV or other federal programs or state financial aid programs; |
| • | limits on, or termination of, our institutions’ operations or ability to grant degrees, diplomas and certificates; |
| • | restrictions on, or revocation of, our institutions’ accreditations; |
| • | limitations on our ability to open new institutions or offer new programs; |
| • | costly investigations, litigation or other adversarial proceedings; and |
| • | civil or criminal penalties being levied against us or our institutions. |
In addition, findings or allegations of noncompliance may subject us to qui tam lawsuits under the Federal False Claims Act, under which private plaintiffs seek to enforce remedies on behalf of the U.S. and, if successful, are entitled to recover their costs and to receive a portion of any amounts recovered by the U.S. in the lawsuit. We may also be subject to other types of lawsuits or claims by third parties. The costs of these proceedings may be significant and we may not have sufficient resources to fund any material adverse outcomes.
Any of the penalties, injunctions, restrictions, lawsuits or other forms of censure listed above could have a material adverse effect on our business, financial condition, results of operations and cash flows. If we lose Title IV Program eligibility, we would experience a dramatic decline in revenue and we would be unable to continue our business as it currently is conducted.
ED’s gainful employment regulations may limit the programs we can offer students and increase our cost of operations.
Under the HEA, proprietary institutions are generally eligible to participate in Title IV Programs only in respect of educational programs that “prepare students for gainful employment in a recognized occupation.” On October 30, 2014, ED published a new complex final regulation to define “gainful employment,” a term used in the Higher Education Act which historically has not been defined by Congress or ED. In addition to significant new disclosure requirements, the new regulation establishes debt to earnings ratio thresholds a program’s students must achieve for the program to remain eligible to participate in Title IV federal aid programs. See Item 1, “Business – Student Financial Aid and Related Federal Regulation – Legislative Action and Recent ED Regulatory Initiatives – Gainful Employment,” for more information about the new gainful employment regulation.
38
Table of Contents
We believe that certain of our Culinary Arts and Art & Design programs have the greatest risk of losing Title IV eligibility under the new gainful employment eligibility test. On December 18, 2014, our Board of Directors approved a plan to sell the Company’s 16 Culinary Arts campuses. We are de-emphasizing certain Art & Design programs which have not produced positive operating results and are not positioned well under the new gainful employment regulations. There can be no assurance that the Company’s efforts to mitigate the impact of the regulation will be successful or result in compliance with the new regulation. In particular, the continuing eligibility of our educational programs for Title IV program funding would be at risk due to factors beyond our control, such as changes in the actual or deemed income level of our graduates, changes in student borrowing levels, increases in interest rates, changes in the federal poverty income level relevant for calculating discretionary income, the Affordable Care Act’s incentive for businesses to reduce employee work schedules, pending immigration reform proposals and labor supply impacts on starting wages generally, changes in the percentage of our former students who are current in repayment of their student loans, and other factors. The exposure to these external factors could reduce our ability to confidently offer or continue certain types of programs for which there is market demand, and therefore would impact our ability to maintain or grow our business. In addition, the disclosure and reporting requirements of the new regulation increase our costs of operations and could adversely impact student enrollment, persistence and retention.
If a particular program ceased to be eligible for Title IV Program funding, in most cases it would not be practical to continue offering that program under our current business model, which could reduce our enrollment and have a material adverse effect on our cash flows, results of operations and financial condition.
Additional ED rulemaking could materially and adversely affect our operations, business, results of operations, financial condition and cash flows.
In addition to the new gainful employment regulation discussed above, the U.S. Department of Education has promulgated a substantial number of new regulations in recent years that impact our business, including but not limited to compensation rules for persons engaged in certain aspects of admissions and financial aid, state authorization, determination of attendance and definitions of a “credit hour” and a “substantial misrepresentation” which became effective on July 1, 2011. These new regulations, known as the program integrity rules, have had significant impacts on our business, requiring a large number of reporting and operational changes and resulting in changes to and elimination of certain educational programs.
Future regulatory actions by ED or other agencies that regulate our institutions are likely to occur and to have significant impacts on our business, require us to change our business practices and incur costs of compliance and of developing and implementing changes in operations, as has been the case with past regulatory changes. As mentioned above, the increased scrutiny of the private, postsecondary education sector and the ongoing policy differences in Congress regarding spending levels could lead to significant regulatory changes in connection with the upcoming reauthorization of the HEA, and many of these changes may be adverse to postsecondary institutions generally or proprietary institutions specifically.
We cannot predict with certainty the ultimate combined impact of the regulatory changes which have occurred over the past few years, nor can we predict the effect of future legislative or regulatory action by federal, state or other agencies regulating our education programs or other aspects of our operations, how any resulting regulations will be interpreted or whether we and our institutions will be able to comply with these requirements in the future. Any such actions by legislative or regulatory bodies that affect our programs and operations could have a material adverse effect on our student population and our institutions, including the need to cease offering a number of programs.
A failure to demonstrate “financial responsibility” or “administrative capability” would have negative impacts on our operations.
All higher education institutions participating in Title IV Programs must, among other things, satisfy financial and administrative standards. Failure to meet these standards will subject an institution to additional
39
Table of Contents
monitoring and reporting procedures, the costs of which may be significant; alterations in the timing and process for receipt of cash pursuant to Title IV Programs; a requirement to submit an irrevocable letter of credit to ED in an amount equal to 10-100% of the Title IV Program funds that the institution received during its most recently completed fiscal year; or provisional certification for up to three years; depending on the level of compliance with the standards and ED’s discretion. See Item 1, “Business – Student Financial Aid and Related Federal Regulation – Compliance with Federal Regulatory Standards and Effect of Federal Regulatory Violations,” for more information about the standards of financial responsibility and administrative capability and the alternative ways an institution may establish eligibility to continue to participate in Title IV Programs.
Recent profitability declines and the write down of the carrying value of non-financial assets, such as deferred tax assets and goodwill, have negatively impacted our financial responsibility scores. We may be required to seek further cost reductions, sell additional assets, modify our capital structure or implement other organizational changes to remain compliant with the annual financial responsibility tests, and investment decisions, such as the use of our cash, may be impacted by our compliance efforts. A failure to successfully implement our plan to sell our Culinary Arts campuses may negatively impact our financial responsibility composite score. There can be no assurance that the Company’s actions will result in the Company remaining financially responsible as defined by ED. We believe that recent developments in the proprietary postsecondary education industry have negatively impacted the availability and cost of capital for companies in the industry, which may impact our future compliance with ED’s financial responsibility standards. Further, there is some uncertainty regarding ED’s treatment of certain components of the financial responsibility composite score. If in the future we are required to satisfy ED’s standards of financial responsibility on an alternative basis, including potentially by posting irrevocable letters of credit, we may not have the capacity to post these letters of credit.
Accreditor and state regulatory requirements also address financial responsibility, and these requirements vary among agencies and also are different from the ED requirements. Any developments relating to our satisfaction of ED’s financial responsibility requirements may lead to additional focus or review by our accreditors or applicable state agencies regarding their respective financial responsibility requirements.
If our institutions fail to maintain financial responsibility or administrative capability, they could lose their eligibility to participate in Title IV Programs, have that eligibility adversely conditioned or be subject to similar negative consequences under accreditor and state regulatory requirements, which would have a material adverse effect on our business. In particular, limitations on, or termination of, participation in Title IV Programs as a result of the failure to demonstrate financial responsibility or administrative capability would limit students’ access to Title IV Program funds, which would materially and adversely reduce the enrollments and revenues of our institutions.
Our institutions could lose their eligibility to participate in federal student financial aid programs or have other limitations placed upon them if their student loan cohort default rates are greater than the standards set by ED.
To remain eligible to participate in Title IV Programs, our institutions must maintain student loan cohort default rates below specified levels. Each cohort is the group of students who first enter into student loan repayment during a federal fiscal year (ending September 30). The applicable cohort default rate for each cohort is now the percentage of the students in the cohort who default on their student loans prior to the end of the two following federal fiscal years, which represents a three-year measuring period. If an educational institution’s cohort default rate exceeds the applicable standards, it may be required to delay for 30 days the release of the first disbursement of U.S. federal student loan proceeds to first time borrowers, establish a default prevention task force and develop a default prevention plan with measurable objectives for improving the cohort default rate, be subject to provisional certification imposing various additional requirements for participation in Title IV Programs or, depending on the duration or magnitude of the compliance failure, cease participation in Title IV Programs.
40
Table of Contents
We believe maintaining cohort default rates in compliance with the standards will remain challenging due to the economic climate and changes in the manner in which student loans are serviced. All federal student loans have migrated to the Federal Direct Loan Program under which the federal government lends directly to students. This could adversely impact loan repayment rates and our institutions’ cohort default rates if the federal government is less effective in promoting timely repayment of federal student loans than the private lenders were under the FFELP.
See Item 1, “Business – Student Financial Aid and Related Federal Regulation – Compliance with Federal Regulatory Standards and Effect of Federal Regulatory Violations – Student Loan Default Rates,” for more information about cohort default rates, ED’s standards and penalties applicable thereto as well as the change to federal servicing of student loans and the Company’s rates for each of its institutions.
If our student loan default rates approach applicable limits, we may be required to increase our efforts and resources dedicated to improving these default rates. In addition, because there is a lag between the funding of a student loan and a default thereunder, many of the borrowers who are in default or at risk of default are former students with whom we may have only limited contact. Accordingly, we may not be able to effectively improve our default rates or improve them in a timely manner to meet the requirements for continued participation in Title IV Program funding if we experience an increase in our student loan default rates.
If any of our institutions were to lose eligibility to participate in Title IV Programs due to student loan default rates being higher than ED’s thresholds and we could not arrange for adequate alternative student financing sources, we would most likely have to close those institutions, which could have a material adverse effect on our total student enrollment, financial condition, results of operations and cash flows.
Our institutions could lose their eligibility to participate in federal student financial aid programs if the percentage of their revenues derived from those programs is too high.
Any of our institutions or OPEIDs may lose eligibility to participate in Title IV Programs if, on modified cash basis accounting, the percentage of the cash receipts derived from Title IV Programs for two consecutive fiscal years is greater than 90%. Under the 90-10 Rule, an OPEID that derives more than 90% of its cash receipts from Title IV sources for a fiscal year will be placed on provisional participation status for its next two fiscal years. We have substantially no control over the amount of Title IV student loans and grants sought by or awarded to our students. In addition, if the OPEID violates the 90-10 Rule and becomes ineligible to participate in Title IV Programs but continues to disburse Title IV Program funds, ED would require repayment of all Title IV Program funds received by it after the effective date of the loss of eligibility.
Several factors have adversely affected our institutions’ 90-10 Rule percentages in recent years, and we expect this negative impact to continue. We have implemented various measures intended to reduce the percentage of our institution’s cash basis revenue attributable to Title IV Program funds, but they have had only limited impact to date and there is no assurance that they will be adequate to prevent our institutions’ 90-10 Rule percentages from exceeding 90% in the future. One such measure is delaying the disbursement and subsequent receipt of Title IV Program funds. We have adjusted tuition at several of our campuses for programs that are under pressure to comply with the 90-10 Rule, which could adversely affect our enrollment and our cohort default rates. The ability of our institutions to maintain 90-10 rates below 90% will depend on the impact of future changes in our enrollment mix and regulatory and other factors outside of our control, including any reduction in government assistance for military personnel, including veterans, or changes in the treatment of such funding for purposes of the 90-10 rate calculation. In addition, there is a lack of clarity regarding some of the technical aspects of the calculation methodology under the 90-10 Rule, which may lead to regulatory action or investigations by ED. Changes in, or new interpretations of, the calculation methodology or other industry practices under the 90-10 Rule could further significantly impact our compliance with the 90-10 Rule, and any review or investigation by ED involving us could require a significant amount of resources.
41
Table of Contents
Two of our institutions which are not in teach-out are on provisional certification due to 90-10 Rule percentages exceeding the 90% limit for our 2011 fiscal year. Additional Transitional Group institutions have also been placed on provisional certification due to the 90-10 Rule. ED has broad discretion to impose additional sanctions on institutions that fail the 90-10 Rule limit, but there is only limited precedent available to predict what those additional sanctions might be in the future, particularly in the current regulatory environment. ED could specify a wide range of additional conditions as part of the provisional certification and the institutions’ continued participation in Title IV Programs. These conditions may include, among other things, restrictions on the total amount of Title IV Program funds that may be distributed to students attending the institutions; restrictions on programmatic and geographic expansion; requirements to obtain and post letters of credit; and additional reporting requirements to include additional interim financial or enrollment reporting.
See Item 1, “Business – Student Financial Aid and Related Federal Regulation – Compliance with Federal Regulatory Standards and Effect of Federal Regulatory Violations – ‘90-10 Rule,’” for more information about the 90-10 Rule, the factors which have adversely affected our ability to comply, the measures we have implemented to improve our compliance and the OPEIDs which are on provisional certification.
If any of our institutions lose eligibility to participate in Title IV Programs due to violation of the 90-10 Rule, such institutions’ operating and financial results would be materially adversely affected. Efforts to reduce the 90-10 Rule percentage for our institutions, especially if the percentage exceeds 90% for a fiscal year, have and may in the future involve taking measures that involve interpretations of the 90-10 Rule that are without clear precedent, reduce our revenue, increase our operating expenses (or any or all of the foregoing, in each case perhaps significantly). If the 90-10 Rule is not changed to provide relief for proprietary institutions, we may be required to make structural changes to our business or teach-out additional campuses in order to remain in compliance, which changes may materially alter the manner in which we conduct our business and materially and adversely impact our business, financial condition, results of operations and cash flows. Furthermore, these required changes could make more difficult our ability to comply with other important regulatory requirements, such as the cohort default rate regulations.
If ED denies, or significantly conditions, recertification of any of our institutions to participate in Title IV Programs, that institution could not conduct its business as it is currently conducted.
Under the provisions of the Higher Education Act, an institution must apply to ED for continued certification to participate in Title IV Programs at least every six years or when it undergoes a change of control. Each institution is assigned an identification number by ED known as an OPEID, or Office of Postsecondary Education Identification number, with each institution’s branches and additional locations assigned to the main campus’ OPEID. Nineteen of our 22 OPEIDs are currently in the process of seeking recertification from ED. We have submitted necessary documentation for recertification and eligibility of these institutions continues on a month-to-month basis until ED issues its decision on the applications. Generally, the recertification process includes a review by ED of an institution’s educational programs and locations, administrative capability, financial responsibility and other oversight categories. It is not unusual to be continued on a month-to-month basis until ED completes its review; however, it can be challenging to start new programs at institutions currently in recertification, which could negatively impact our ability to start new programs.
ED is conducting an inquiry concerning possible violations of ED misrepresentation regulations. See Note 12 “Contingencies – Regulatory Matters – ED Inquiry and HCM1 Status” to our consolidated financial statements. In addition, several of our institutions that are seeking recertification are subject to provisional certification. See Item 1, “Business – Student Financial Aid and Related Federal Regulation – Eligibility and Certification by ED.” We cannot predict whether, or to what extent, ED’s inquiry or provisional certification might impact the recertification process.
If ED finds that any of our institutions do not fully satisfy all required eligibility and certification standards, ED could limit, suspend or terminate the institution’s participation in Title IV Programs. Continued Title IV
42
Table of Contents
program eligibility is critical to the operation of our business. If our institutions become ineligible to participate in Title IV Programs, or have that participation significantly conditioned, we could not conduct our business as it is currently conducted and it would have a material adverse effect on our business, financial condition, results of operations and cash flows.
Government and regulatory agencies and third parties may conduct compliance reviews and audits or bring actions against us that could result in monetary liabilities, injunctions, loss of eligibility for Title IV Programs or other adverse outcomes.
Because we operate in a highly regulated industry, we are subject to compliance reviews and audits as well as claims of noncompliance and lawsuits by government agencies, regulatory agencies and third parties. In this regard, we have several pending audits, inquiries and claims against us, including ED’s Office of Inspector General audit of CTU and inquiries from ED and various other regulators. See Note 12 “Contingencies” to our consolidated financial statements for additional discussion of these pending matters.
It is possible for one or more of our employees to engage in non-compliant behavior or make statements that violate some aspect of the extensive regulations governing our institutions and business despite our compliance programs. We have undertaken significant personnel and cost reductions to stabilize our business which could create resource constraints that may increase the likelihood of a compliance failure. From time to time, we identify compliance deficiencies that we must address and, where appropriate, report such deficiencies to ED. Such reporting, even in regard to a minor or inadvertent compliance issue, could result in a more significant compliance review by ED or even a full recertification review, which may require the expenditure of substantial administrative time and resources to address.
If the result of any pending or future proceeding is unfavorable to us, we may be required to pay money damages or be subject to fines, limitations, loss of Title IV funding, injunctions or other penalties. Even if we adequately address issues raised by an agency review or successfully defend a lawsuit or claim, we may have to divert significant financial and management resources from our ongoing business operations to address issues raised by those actions. Claims and lawsuits brought against us may damage our reputation or adversely affect our stock price, even if such actions are eventually determined to be without merit.
Any failure to comply with state laws and regulatory requirements, or new state legislative or regulatory initiatives affecting our institutions, could have a material adverse effect on our total student enrollment, results of operations, financial condition and cash flows.
Our institutions are subject to extensive state-level regulation and oversight by state licensing agencies, whose approval or exemption is necessary to allow an institution to operate and grant degrees or diplomas. State laws vary from state to state, but generally establish standards for faculty qualifications, the location and nature of facilities, financial policies, new programs and student instruction, administrative staff, marketing and recruitment and other operational and administrative procedures. Any failure of one of our institutions to maintain state authorization would result in that institution being unable to offer educational programs and students attending the campus being ineligible for Title IV Programs. State legislatures often consider legislation affecting regulation of postsecondary educational institutions. Enactment of this legislation and ensuing regulations, or changes in interpretation of existing regulations, may impose substantial costs on our institutions and require them to modify their operations in order to comply with the new regulations. State attorneys general have increasingly become active in their review and oversight of postsecondary education institutions, through investigative inquiries and regulation.
If we fail or are unable to comply with current or future state licensing or authorization requirements, are unable to successfully obtain new required state approvals for our institutions offering online education, or determine that we are unable to cost effectively comply with new or changed state licensing, authorization or other requirements, we could lose enrollments, eligibility to participate in Title IV Programs and revenues in any affected states, which could materially affect our revenues and our growth opportunities.
43
Table of Contents
If one or more of our institutions fails to maintain institutional accreditation, if one or more of our accrediting agencies loses recognition by ED, or if certain of our programs cannot obtain or maintain programmatic accreditation, our student enrollments would diminish and our business would suffer.
Institutional Accreditation. In the U.S., accrediting agencies periodically review the academic quality of an institution’s instructional programs and its administrative and financial operations to ensure that the institution has the resources to perform its educational mission. ED relies on accrediting agencies to assess whether an institution’s educational programs qualify the institution to participate in Title IV Programs. See Item 1, “Business – Accreditation and Jurisdictional Authorizations – Institutional Accreditation” and – “Compliance Monitoring by Accrediting Agencies.”
The failure to comply with accreditation standards will subject an institution to additional oversight and reporting requirements, accreditation proceedings such as a show-cause directive, an action to defer or deny action related to an institution’s application for a new grant of accreditation or an action to suspend an institution’s accreditation or a program’s approval. See, for example, the risk factor below regarding minimum placement rate standards. If our institutions or programs are subject to accreditation actions or are placed on probationary accreditation status, we may experience additional adverse publicity, impaired ability to attract and retain students and substantial expense to obtain unqualified accreditation status.
The inability to obtain reaccreditation following periodic reviews or any final loss of institutional accreditation after exhaustion of the administrative agency processes would result in a loss of Title IV Program funds for the affected institution and its students. Such events and any related claims brought against us could have a material adverse impact on our business, reputation, financial condition, results of operations and cash flows.
Programmatic Accreditation. Many states and professional associations require professional programs to be accredited. While programmatic accreditation is not a sufficient basis to qualify for institutional Title IV Program certification, programmatic accreditation may improve employment opportunities for program graduates in their chosen field and enable them to sit for certain required professional licensing exams. Those of our programs that do not have such programmatic accreditation, where available, or fail to maintain such accreditation, may experience adverse publicity, declining enrollments, litigation or other claims from students or suffer other adverse impacts, which could result in it being impractical for us to continue offering such programs.
ED Recognition of Accrediting Agencies. Our participation in Title IV Programs is dependent on ED continuing to recognize the accrediting agencies that accredit our colleges and universities. The standards and practices of these agencies have become a focus of attention by the Office of Inspector General and ED over the last few years. This focus may make the accreditation review process longer and potentially more challenging for all of our institutions when they undergo their normal accreditation review processes. It may also be making the process by which ED evaluates and recognizes accreditors as appropriate Title IV gatekeepers similarly longer and more challenging. If an accreditor loses recognition by ED as an approved Title IV accreditor, the institutions it accredits would have only 18 months to become accredited by another accreditor in order to maintain Title IV eligibility. If an institution loses accreditation, or its accreditor loses ED recognition, it could experience increased operational costs and reduced enrollments, and each has the potential to materially adversely affect our business and results of operations.
Most of our campuses are required to achieve minimum placement standards which have been difficult to achieve.
Our national accreditors, some programmatic accreditors and some state licensing bodies require our campuses and/or programs to achieve placement rates of between 47.5% and 80% within limited time periods after students have graduated, and many of these standards have been increasing over recent years. During recent periods of economic slowdown and high unemployment across the U.S., job prospects for many college
44
Table of Contents
graduates, regardless of the institution they attend or the degree they have earned, have been diminished as new graduates are facing increased competition from displaced workers with, in some cases, significant work experience. Many graduates, including those who have attended our institutions, have experienced a lengthening of the time it takes to obtain their first full-time, in-field job after graduation. We believe our placement rates have been and will continue to be adversely impacted by current economic conditions until there is improvement in the national and local unemployment rates and a higher rate of job growth. The various minimum placement standards required by our accreditors and state regulators generally do not fluctuate based on economic conditions, although they may take these factors into consideration when determining how to respond to campuses or programs that fail to maintain their minimum standards. In addition, there is a lack of clarity and uniformity in many instances regarding how a placement is defined by our accreditors and state regulators, which contributes to the difficulty and lack of certainty of being in compliance with these minimum placement standards.
Achieving minimum placement standards is dependent upon internal factors as well, such as the efforts of our career services personnel, our ability to provide adequate staffing to achieve desired results, program quality and the effectiveness of our strategies to improve placement rates.
A number of our 32 ACICS-accredited campuses that are not in teach-out are subject to increased levels of accreditation oversight because they fell below ACICS’ benchmark placement or retention rate standards, including one campus that reported an institutional retention rate below the minimum compliance standard. In addition, a number of programs are subject to increased levels of accreditation oversight by ACICS and ACCSC. Our institutions doing business in New York are also subject to a minimum placement rate requirement implemented by an Assurance of Discontinuance with the New York Attorney General. See Item 1, “Business – Accreditation and Jurisdictional Authorizations – Compliance Monitoring by Accrediting Agencies” and “– Additional State Regulatory Matters,” for more information about the requirements applicable to our institutions and our compliance therewith.
Failure to achieve minimum placement standards could result in a loss of accreditation or state regulatory approvals for the campus as a whole or for specific programs.We have had to cap enrollment in or teach-out certain programs due to low placement opportunities for graduates of those programs, and we may need to take these steps with respect to more programs and/or campuses if we are unable to place our graduates within the time frames required by the accreditors and states that regulate our institutions. These actions reduce our revenues and therefore could have a material adverse effect on our results of operations, cash flows and financial condition. These actions may also reduce student interest in our programs and/or campuses, which would further negatively impact our business.
We need timely approval by applicable regulatory agencies to offer new programs, make substantive changes to existing programs, or expand our operations into or within certain states.
We are facing a period of extremely heightened regulatory scrutiny as discussed in other risk factors above. We believe regulatory agencies are generally seeing significant increases in the volume of requests as a result of the industry adjusting to the significant volume of new regulations and challenging economic circumstances which have affected students and institutions. Regulatory capacity constraints have resulted in delays to various approvals our institutions are requesting. To open a new institution or branch campus, or to establish a new educational program or substantive changes to existing programs, we are required to obtain the appropriate approvals from ED and applicable state and accrediting regulatory agencies, which may be conditioned, delayed or denied in a manner that could significantly affect our strategic plans and future growth. Approval by these regulatory agencies may be negatively impacted due to regulatory inquiries or reviews and any adverse publicity relating to such matters or the industry generally. Also, any adverse action taken by ED regarding its recognition of any accrediting agency that accredits our institutions or programs could adversely impact our ability to open a new institution or branch campus or establish new or changed educational programs. The threat of any adverse action by ED regarding its recognition of any of our accrediting agencies may impact the timing of our
45
Table of Contents
accrediting agencies’ review and decision whether to grant approval of our various requests, in particular in areas of current focus by ED. ED and applicable state and accrediting bodies must certify a new institution or branch campus for it to be eligible to participate in Title IV Programs.
Risks Related to Our Business
Our financial performance depends on the level of student enrollment in our institutions.
We have experienced reduced new student enrollments in recent years. The continuation of heightened unemployment could further harm our business. Diminished job prospects and heightened financial worries could continue to affect the willingness of students to incur loans to pay for postsecondary education and to pursue postsecondary education in general. Conversely, an improving economy and improving job prospects may lead prospective students to choose to work rather than to pursue postsecondary education. Our enrollments could suffer from any of these circumstances.
Enrollment of students at our institutions is impacted by many of the regulatory risks discussed above and business risks discussed below, many of which are beyond our control. If the costs of Title IV loans increase and if availability of alternate student financial aid decreases, students may decide not to enroll in a postsecondary institution, including our institutions. We could experience decreasing enrollments in our institutions due to changing demographic trends in family size, overall declines in enrollment in postsecondary institutions, job growth in fields unrelated to our core disciplines, immigration and visa laws, or other societal factors.
Reduced enrollments at our institutions, for any of the reasons mentioned or otherwise, generally reduces our profitability and is likely to have a negative impact on our business, results of operation, financial condition and cash flows, which, depending on the level of the decline, could be material.
If we are unable to successfully resolve pending or future litigation and regulatory and governmental inquiries involving us, or face increased regulatory actions or litigation, our financial condition and results of operations could be adversely affected.
We and certain of our current and former directors and executive officers have been named as defendants in various lawsuits, investigations and claims covering a range of matters, including, but not limited to, violations of the federal securities laws, breaches of fiduciary duty and claims made by current and former students and employees of our institutions. Current claims include qui tam actions filed in federal court by individual plaintiffs on behalf of themselves and the federal government alleging that we submitted false claims or statements to ED in violation of the False Claims Act. Qui tam actions are filed under seal, and remain under seal until the government decides whether it will intervene in the case. If the government elects to intervene in an action, it assumes primary control of that matter; if the government elects not to intervene; individual plaintiffs may continue the litigation at their own expense on behalf of the government. See Note 12 “Contingencies” to our consolidated financial statements for discussion of these and other current matters. Additional actions may arise in the future.
We and our institutions also are subject to and have pending audits, compliance reviews, inquiries, investigations, claims of non-compliance and litigation by ED, federal and state regulatory agencies, accrediting agencies, state attorney general offices, present and former students and employees, and others that may allege violations of statutes, regulations, accreditation standards, consumer protection and other legal and regulatory requirements applicable to us or our institutions. For example, we have received inquiries from attorneys general in 20 states, including a collective inquiry by 16 states relating to potential non-compliance with applicable state laws and regulations by certain of our institutions. See Note 12 “Contingencies” to our consolidated financial statements for additional discussion of these and other current matters. If the results of any such audits, reviews, inquiries, investigations, claims, or actions are unfavorable to us, we may be required to pay monetary damages or be subject to fines, operational limitations, loss of federal funding, injunctions, undertakings, additional oversight and reporting, or other civil or criminal penalties.
46
Table of Contents
Even if we maintain compliance with applicable governmental and accrediting body regulations, increased regulatory scrutiny or adverse publicity arising from allegations of non-compliance may increase our costs of regulatory compliance and adversely affect our financial results, growth rates and prospects. For example, Congressional hearings and the continuing state attorneys general and Consumer Financial Protection Bureau (“CFPB”) investigations affecting proprietary institutions may spur plaintiffs’ law firm or others to initiate additional litigation against us and other proprietary education providers.
We are subject to a variety of other claims and litigation that arise from time to time alleging non-compliance with or violations of state or federal regulatory matters including, but not limited to, claims involving students, graduates and employees. In the event the extensive changes in the overall federal and state regulatory construct results in additional statutory or regulatory bases for these types of matters, or other events result in more of such claims or unfavorable outcomes to such claims, there exists the possibility of a material adverse impact on our business, reputation, financial position, cash flows and results of operations for the periods in which the effects of any such matter or matters becomes probable and reasonably estimable.
We cannot predict the ultimate outcome of these matters and expect to continue to incur significant defense costs and other expenses in connection with them. We may be required to pay substantial damages or settlement costs in excess of our insurance coverage related to these matters. Government investigations, including the pending state attorneys general investigations in which we are involved, and any related legal and administrative proceedings may result in the institution of administrative, civil injunctive or criminal proceedings against us and/or our current or former directors, officers or employees, or the imposition of significant fines, penalties or suspensions, or other remedies and sanctions. Any such costs and expenses could have a material adverse effect on our financial condition and results of operations and the market price of our common stock.
We may be compelled to terminate programs or teach out additional campuses due to regulatory considerations or declining enrollments and may incur additional costs and expenses associated with past or future exit activities.
We may face excess capacity if student enrollments continue to decrease or if we decide to terminate the offering of certain programs. We must balance current student populations and projected changes in student population with appropriate levels of costs and investment in real estate and our online platforms in order to effectively manage capacity. We have in the past decided to teach out and cap enrollments in certain programs due to existing regulatory considerations such as minimum placement rate standards, the 90-10 Rule and other factors, and we may need to cease offering additional programs as a result of the gainful employment or other regulations. We have also made the decision to teach out certain campuses after evaluating a number of factors including, but not limited to: the overall performance of the campus including operating results, new student enrollments, placement opportunities in the local market, degree of market competition from both for-profit and not-for-profit institutions and the existing lease obligation for the campus. In late 2012 and 2013, we announced plans to teach out approximately 30 campuses as part of our strategy to simplify the organization, including the decision to invest in a smaller number of ground-based campuses. In late 2014, we announced a plan to sell the Company’s 16 Culinary Arts campuses. Changes in the economy, regulatory environment or unavailability of Title IV Program funds may cause us to terminate additional programs or teach out or sell additional campuses. All of these actions may contribute to significant decreases in enrollments in our continuing programs. Closing facilities or other exit activities involve costs and expenses which can be significant, and therefore affect profitability. For example, see Note 10 “Restructuring Charges” to our consolidated financial statements for a discussion of such costs in connection with recent decisions regarding campus closures and reductions in work force. Actual costs and expenses involved in closing facilities or other exit activities may be higher than expected and the benefits anticipated may be less due to a number of factors including unanticipated expenses in teaching out campuses and higher than expected lease exit costs.
47
Table of Contents
We compete with a variety of educational institutions, especially in the online education market, and if we are unable to compete effectively, our total student enrollment and revenue could be adversely impacted.
The postsecondary education industry is highly fragmented and increasingly competitive. Our institutions compete with traditional public and private two-year and four-year colleges and universities, other proprietary institutions, other online education providers, and alternatives to higher education, such as immediate employment and military service. Some public and private institutions charge lower tuition for courses of study similar to those offered by our institutions due, in part, to government subsidies, government and foundation grants, tax-deductible contributions and other financial resources not available to proprietary institutions, and this competition may increase if additional subsidies or resources become available to those institutions. Our competitors may have substantially greater brand recognition and financial and other resources than we have, which may enable them to compete more effectively for potential students. Our strategy to invest in a smaller number of brands within our Career Colleges may impact our ability to compete effectively, including the potential difficulty of building brand awareness in markets where brand changes occur. We also expect to experience increased competition as more postsecondary education providers increase their online program offerings, including traditional and community colleges that had not previously offered online education programs, and increase their use of adaptive learning technologies. An increase in competition could affect the success of our recruiting efforts, or cause us to reduce our tuition rates and increase our marketing and other recruiting expenses, which could adversely impact our profitability and cash flows.
Our financial performance depends, in part, on our ability to continue to develop awareness and acceptance of our institutions and programs among high school graduates and working adults in a cost effective manner.
If our institutions are unable to successfully market and advertise their educational programs, our institutions’ ability to attract and enroll prospective students in such programs could be adversely affected, and, consequently, our ability to increase revenue or maintain profitability could be impaired. Some of the factors that could prevent us from successfully marketing and advertising our institutions and the programs that they offer include, but are not limited to: student or employer dissatisfaction with educational programs and services; diminished access to prospective students; our failure to maintain or expand our brand names or other factors related to our marketing or advertising practices; Federal Trade Commission or Federal Communications Commission restrictions on contacting prospective students, Internet, mobile phone and other advertising and marketing media; costs and effectiveness of Internet, mobile phone and other advertising programs; and changing media preferences of our target audiences. In addition, we use third-party lead aggregators to help us identify potential students. The practices of some lead aggregators have been questioned by various regulatory bodies, which could lead to changes in the quality and number of the leads provided by these lead aggregators as well as the cost thereof, which could in turn result in a reduction in the number of students we enroll.
Our future financial condition and results of operations could be materially adversely affected if we are required to write down the carrying value of non-financial assets and non-financial liabilities, including long-lived assets and goodwill and intangible assets, such as our trade names.
In accordance with U.S. GAAP, we review our non-financial assets and non-financial liabilities, including goodwill and indefinite-lived intangible assets, such as our trade names and deferred tax assets, for impairment on at least an annual basis through the application of fair value-based measurements. On an interim basis, we review our assets and liabilities to determine if a triggering event had occurred that would result in it being more likely than not that the fair value would be less than the carrying amount for any of our reporting units or indefinite-lived intangible assets. We determine the fair value of our reporting units using a combination of an income approach, based on discounted cash flow, and a market-based approach. To the extent the fair value of a reporting unit is less than its carrying amount, we may be required to record an impairment charge in the consolidated statements of loss and comprehensive loss. We determine the fair value of our trade names using a relief from royalty method which is based on the assumption that, in lieu of ownership of an intangible asset, a company would be willing to pay a royalty in order to enjoy the benefits of the asset. To the extent the fair value of the trade name is less than its carrying amount, we record an impairment charge in the consolidated statements
48
Table of Contents
of loss and comprehensive loss. During 2014 and 2013, we recorded asset impairment charges of $16.9 million and $8.7 million, respectively, for our continuing operations (see Note 9 “Goodwill and Other Intangible Assets” and Note 7 “Property and Equipment” to our consolidated financial statements). Our estimates of fair value for these are based primarily on projected future results and expected cash flows consistent with our plans to manage the underlying businesses. However, should we encounter unexpected economic conditions or operational results or need to take additional actions not currently foreseen to comply with current and future regulations, the assumptions used to calculate the fair value of our assets, estimate of future cash flows, revenue growth, and discount rates, could be negatively impacted and could result in an impairment of goodwill or other long-lived assets which could materially adversely affect our financial condition and results of operations.
Furthermore, we believe that our evaluation of deferred tax assets and the need for a valuation allowance against such assets involve critical accounting estimates because they are subject to, among other things, estimates of future taxable income. These estimates are susceptible to change and are dependent on events that may or may not occur. Our assessment of the need for a valuation allowance is material to the assets reported on our consolidated balance sheets and changes in any of the assumptions utilized in this assessment could result in a reversal of all or a portion of our deferred tax assets currently in a valuation allowance position. As of December 31, 2014, we have recorded a cumulative valuation allowance in the amount of $150.4 million related to that portion of our deferred tax assets which we determined were not more likely than not to be realized based upon the existing positive and negative evidence, most notably the Company’s three-year cumulative loss position. Future changes in circumstances that causes a change in judgment about the realizability of the deferred tax asset, could result in an increase or decrease to the valuation allowance recorded within the consolidated balance sheet in future periods.
The loss of our key personnel could harm us.
Our future success depends largely on the skills, efforts and motivation of our executive officers and other key personnel, as well as on our ability to attract and retain qualified managers and our institutions’ ability to attract and retain qualified faculty members and administrators. Many leadership positions within the Company have been transitioned over recent years. This includes several changes in the offices of Chief Executive Officer and Chief Financial Officer, and a search for a permanent Chief Executive Officer is underway to replace Ronald D. McCray in his recently appointed Interim Chief Executive Officer role. These transitions and loss of key personnel in the future could slow implementation of key initiatives, lead to changes in or create uncertainty about our business strategies or otherwise impact management’s attention to operations. We face competition in attracting, hiring and retaining executives and key personnel who possess the skill sets and experiences that we seek. Cost reduction measures due to declining enrollments, our recent operating losses and the negative publicity surrounding our industry may make it difficult or more expensive to attract, hire and retain qualified and experienced personnel. In addition, key personnel may leave us and subsequently compete against us after any period they are contractually obligated not to pursue such activities. The loss of the services of our key personnel, or our failure to attract, integrate and retain other qualified and experienced personnel on acceptable terms could adversely affect our results of operations or financial condition.
Budget constraints in states that provide state financial aid to our students could adversely affect us and our student population by reducing available financial aid.
A significant number of states in which our institutions operate face budget constraints that may reduce state appropriations in a number of areas including state student financial aid, but we cannot predict the amount or timing of any such reductions. State grant programs generally benefit our institution’s compliance with the 90-10 Rule. If state funding for our students decreases, our institutions’ compliance with the 90-10 Rule will be adversely affected, which could adversely impact our institutions’ eligibility for Title IV Programs. If our students are unable to secure alternative sources of funding for their education, our student population could be adversely affected, which could have a material adverse effect on our results of operations, financial condition, and cash flows. Increased state or federal support for public institutions and community colleges, resulting in increased competition for students, also could have a material adverse effect on our enrollments.
49
Table of Contents
Our credit facility and letters of credit are cash-collateralized and therefore may impact our liquidity.
Effective October 31, 2014, we increased our revolving credit facility to $120.0 million. The loans and letter of credit obligations under the credit facility are secured by 100% cash collateral. Cash generated by operations may continue to decrease due to lower student enrollments and operating losses. Further, any negative decisions in regulatory proceedings or other legal actions against us may reduce existing available cash balances. We therefore may have liquidity needs in the future which the credit facility will not meet. For example, we may not have the capacity to post required letters of credit we may need in the future for state licensing requirements, if we are required to satisfy ED’s standards of financial responsibility on an alternative basis or for other purposes due to insufficient cash available to provide security. If cash generated by operations and existing cash balances are insufficient in the future to support our cash requirements, we would need to pursue other sources of liquidity, if available, such as additional sources of credit which may be more expensive, issuance of stock to new investors or a sale of assets.
Our financial performance depends, in part, on our ability to keep pace with changing market needs and technology.
Increasingly, prospective employers of students who graduate from our institutions demand that their new employees possess appropriate technological skills and also appropriate “soft” skills, such as communication, critical thinking and teamwork skills. These skills can evolve rapidly in a changing economic and technological environment, so it is important for our institutions’ educational programs to evolve in response to those economic and technological changes. Current or prospective students or the employers of our graduates may not accept expansion of our existing programs, improved program content and the development of new programs. Even if our institutions are able to develop acceptable new and improved programs in a cost-effective manner, our institutions may not be able to begin offering them as quickly as prospective employers would like or as quickly as our competitors offer similar programs. If we are unable to adequately respond to changes in market requirements due to regulatory or financial constraints, rapid technological changes or other factors, our ability to attract and retain students could be impaired, the rates at which our graduates obtain jobs involving their fields of study could decline, and our results of operations and cash flows could be adversely affected.
If our graduates are unable to obtain professional licenses or certification in their chosen field of study, we may face declining enrollments and revenues or student claims against us.
Many of our students, particularly in the healthcare programs we offer, require or desire professional licenses and certifications in order to obtain employment in their chosen fields. Many factors affect a student’s ability to become licensed, including whether the student’s program and institution are accredited by a particular accrediting commission or approved by a professional association or by the state in which the student seeks employment, and the student’s own qualifications and attainment. If one or more states, local governments or major employers deny licenses, certifications or employment eligibility to a significant number of our students due to factors relating to our institutions or programs, we could suffer reputational harm and declining enrollments in those institutions or programs, or face student claims or litigation that could negatively affect our revenues and results of operations.
Government regulations relating to the Internet could increase our cost of doing business or otherwise have a material adverse effect on our business.
The increasing popularity and use of the Internet and other online services has led and may lead to the adoption of new laws and regulatory practices in the United States or in foreign countries and to new interpretations of existing laws and regulations. These new laws and interpretations may relate to issues such as online privacy, copyrights, trademarks and service marks, sales taxes, fair business practices and the requirement that online education institutions qualify to do business as foreign corporations or be licensed in one or more jurisdictions where they have no physical location or other presence. New laws, regulations or interpretations related to doing business over the Internet could increase our costs and adversely affect enrollments.
50
Table of Contents
We are subject to privacy and information security laws and regulations due to our collection and use of personal information, and any violations of those laws or regulations, or any breach, theft or loss of that information, could adversely affect our reputation and operations.
Our efforts to attract and enroll students result in us collecting, using and keeping substantial amounts of personal information regarding applicants, our students, their families and alumni, including social security numbers and financial data. We also maintain personal information about our employees in the ordinary course of our activities. Our services, the services of many of our health plan and benefit plan vendors, and other information can be accessed globally through the Internet. We rely extensively on our network of interconnected applications and databases for day to day operations as well as financial reporting and the processing of financial transactions. Our computer networks and those of our vendors that manage confidential information for us or provide services to our student may be vulnerable to unauthorized access, inadvertent access or display, theft or misuse, hackers, computer viruses, or third parties in connection with hardware and software upgrades and changes. Such unauthorized access, misuse, theft or hacks could evade our intrusion detection and prevention precautions without alerting us to the breach or loss for some period of time or may never be detected. We have experienced malware and virus attacks on our systems which went undetected by our virus detection and prevention software. Regular patching of our computer systems and frequent updates to our virus detection and prevention software with the latest virus and malware signatures may not catch newly introduced malware and viruses or “zero-day” viruses, prior to their infecting our systems and potentially disrupting our data integrity, taking sensitive information or affecting financial transactions. Because our services can be accessed globally via the Internet, we may be subject to privacy laws in countries outside the U.S. from which students access our services, which laws may constrain the way we market and provide our services. While we utilize security and business controls to limit access to and use of personal information, any breach of student or employee privacy or errors in storing, using or transmitting personal information could violate privacy laws and regulations resulting in fines or other penalties. A wide range of high profile data breaches in 2014 has led to renewed interest in federal data and cybersecurity legislation that could increase our costs and/or require changes in our operating procedures or systems. A breach, theft or loss of personal information held by us or our vendors, or a violation of the laws and regulations governing privacy could have a material adverse effect on our reputation or result in lawsuits, additional regulation, remediation and compliance costs or investments in additional security systems to protect our computer networks, the costs of which may be substantial.
System disruptions and vulnerability from security risks to our online technology infrastructure could have a material adverse effect on our ability to attract and retain students.
For our online and on-ground campuses, the performance and reliability of program infrastructure is critical to their operations, reputation and ability to attract and retain students. Any computer system error or failure, significant increase in traffic on our computer networks, or any significant failure or unavailability of our computer networks, including but not limited to those as a result of natural disasters and network and telecommunications failures could materially disrupt our delivery of these programs. Any interruption to our institutions’ computer systems or operations could have a material adverse effect on our total student enrollment, our business, financial condition, results of operations and cash flows.
Our computer networks may also be vulnerable to unauthorized access, computer hackers, computer viruses and other security threats. A user who circumvents security measures could misappropriate proprietary information or cause interruptions or malfunctions in our operations. Due to the sensitive nature of the information contained on our networks hackers may target our networks. We may be required to expend significant resources to protect against the threat of these security breaches or to alleviate problems caused by these breaches. We cannot ensure that these efforts will protect our computer networks against security breaches despite our regular monitoring of our technology infrastructure security.
Our institutions’ online programs’ success depends, in part, on our institutions’ ability to expand the content of their programs, develop new programs in a cost-effective manner, maintain good standing with regulators and
51
Table of Contents
accreditors, and meet students’ needs in a timely manner. New programs can be delayed due to current and future unforeseen regulatory restrictions. Furthermore, our regulators may impose additional restrictions or conditions on the manner in which we offer online courses to our students, any one of which could negatively impact our business or results of operations.
Any general decline in Internet use for any reason, including security or privacy concerns, cost of Internet service or changes in government regulation, could result in less demand for online educational services and inhibit growth in our online programs.
We may incur liability for the unauthorized duplication or distribution of class materials posted online for class discussions.
In some instances our faculty members or our students may post various articles or other third-party content on class discussion boards or download third-party content to personal computers. We may incur claims or liability for the unauthorized duplication or distribution of this material. Any such claims could subject us to costly litigation and could impose a strain on our financial resources and management personnel regardless of whether the claims have merit.
We rely on proprietary rights and intellectual property in conducting our business, which may not be adequately protected under current laws, and we may encounter disputes from time to time relating to our use of intellectual property of third parties.
Our success depends in part on our ability to protect our proprietary rights. We rely on a combination of copyrights, trademarks, service marks, patents, trade secrets, domain names and agreements to protect our proprietary rights. We rely on service mark and trademark protection in the United States and select foreign jurisdictions to protect our rights to our marks as well as distinctive logos and other marks associated with our services. We cannot assure you that these measures will be adequate, that we have secured, or will be able to secure, appropriate protections for all of our proprietary rights. Unauthorized third parties may attempt to duplicate the proprietary aspects of our curricula, online resource material and other content despite our efforts to protect these rights. Our management’s attention may be diverted by these attempts, and we may need to use funds for lawsuits to protect our proprietary rights against any infringement or violation.
These and other risks exist with respect to our intellipath™ adaptive learning technology, in which we have a perpetual but non-exclusive license. We receive software support for the intellipath technology from CCKF, a Dublin-based educational technology company in which we have an equity investment. If CCKF ceases to operate or otherwise becomes unable to work with our institutions, it would be necessary to either develop the ability to support the software using our own resources or engage another third party vendor to provide these services, which transition could be economically disadvantageous, cause an interruption in the use of the technology and present a distraction to management and applicable business units, any of which could negatively impact our business.
We may encounter disputes from time to time over rights and obligations concerning intellectual property, and we may not prevail in these disputes. Third parties may raise a claim against us alleging an infringement or violation of the intellectual property of that third party. Some third party intellectual property rights may be extremely broad, and it may not be possible for us to conduct our operations in such a way as to avoid those intellectual property rights. Any such intellectual property claim could subject us to costly litigation and impose a significant strain on our financial resources and management personnel regardless of whether such claim has merit.
52
Table of Contents
Risk Related to Our Common Stock
The trading price of our common stock may continue to fluctuate substantially in the future.
Our stock price has declined substantially since mid-2011. The trading price of our common stock has and may fluctuate significantly as a result of a number of factors, some of which are not in our control. These factors include:
| • | general conditions in the postsecondary education field, including declining enrollments; |
| • | the outcomes and impacts on our business of ED’s rulemakings, and other changes in the legal or regulatory environment in which we operate; |
| • | negative media coverage of the proprietary education industry; |
| • | changes in the student lending and credit markets; |
| • | the initiation, pendency or outcome of litigation, accreditation reviews, regulatory reviews, inquiries and investigations, including the pending state attorneys general investigations in which we are involved, and any related adverse publicity; |
| • | failure of certain of our institutions to meet minimum placement rates established by our institutions’ accreditors; |
| • | failure of certain of our institutions to maintain compliance under the gainful employment regulation, 90-10 Rule or with financial responsibility standards; |
| • | loss of key personnel; |
| • | our ability to meet or exceed, or changes in, expectations of analysts or investors, or the extent of analyst coverage of our company; |
| • | decisions by any significant investors to reduce their investment in us; |
| • | quarterly variations in our operating results; |
| • | price and volume fluctuations in the overall stock market, which may cause the market price for our common stock to fluctuate significantly more than the market as a whole; and |
| • | general economic conditions. |
Further, the trading volume of our common stock is relatively low, which may cause our stock price to react more to these various and other factors and may impact an investor’s ability to sell their shares at the desired time at a price considered satisfactory. These factors may adversely affect the trading price of our common stock, regardless of our actual operating performance, and could prevent an investor from selling shares at or above the price at which the investor acquired them.
| ITEM 1B. | UNRESOLVED STAFF COMMENTS |
None.
| ITEM 2. | PROPERTIES |
Our campuses are located throughout the United States. Each of our campuses contains admissions and administrative offices and teaching facilities, including classrooms, laboratories, and, in the case of campuses with culinary arts programs, kitchens. Also, certain of our campuses include cafeteria facilities, and utilize leased space to operate restaurants in conjunction with their culinary arts programs. Additionally, we have administrative facilities located primarily within the Chicagoland area.
53
Table of Contents
Almost all of our campus and administrative facilities are leased. As of December 31, 2014 we leased approximately 2.9 million square feet under lease agreements related to our continuing operations that have remaining terms ranging from less than one year to nine years. As of December 31, 2014, we leased approximately 2.1 million square feet under lease agreements related to our discontinued operations that have remaining terms ranging from one to eight years. As of December 31, 2014, we owned approximately 0.1 million square feet of real property at the following campuses:
| • | American InterContinental University and Sanford-Brown College, Houston, Texas |
| • | Le Cordon Bleu College of Culinary Arts in Chicago, Chicago, Illinois |
See Item 1, “Business,” for a listing of our campus locations. The listing excludes institutions that have been sold and campuses that have ceased operations and are reported within assets of discontinued operations.
We actively monitor our real estate needs in light of our current utilization and projected student enrollment growth. We believe that our institutions can acquire any necessary additional facility capacity on reasonably acceptable terms within a relatively short timeframe. We devote capital resources to facility improvements and expansions as we deem necessary to promote growth and to most effectively serve our students.
| ITEM 3. | LEGAL PROCEEDINGS |
Note 12 “Contingencies” to our consolidated financial statements in Part IV, Item 15 of this Annual Report on Form 10-K is incorporated herein by reference.
| ITEM 4. | MINE SAFETY DISCLOSURES |
Not applicable.
54
Table of Contents
PART II
| ITEM 5. | MARKET FOR REGISTRANT’S COMMON EQUITY, RELATED STOCKHOLDER MATTERS AND ISSUER PURCHASES OF EQUITY SECURITIES |
Our common stock is listed on the NASDAQ Global Select Market (“NASDAQ”) under the symbol “CECO.”
The following table sets forth the range of high and low sales prices per share for our common stock as reported on the NASDAQ:
| Price Range of Common Stock |
||||||||
| High | Low | |||||||
| 2014 |
||||||||
| First quarter |
$ | 7.93 | $ | 5.28 | ||||
| Second quarter |
7.85 | 4.32 | ||||||
| Third quarter |
5.81 | 4.53 | ||||||
| Fourth quarter |
7.10 | 4.75 | ||||||
| High | Low | |||||||
| 2013 |
||||||||
| First quarter |
$ | 4.22 | $ | 2.33 | ||||
| Second quarter |
3.27 | 2.03 | ||||||
| Third quarter |
3.97 | 2.46 | ||||||
| Fourth quarter |
6.50 | 2.54 | ||||||
The closing price of our common stock as reported on the NASDAQ on February 13, 2015 was $5.34 per share. As of February 13, 2015, there were approximately 226 holders of record of our common stock.
We have never paid cash dividends on our common stock and have no plan to do so in the foreseeable future. The declaration and payment of dividends on our common stock are subject to the discretion of our Board of Directors. The decision of our Board of Directors to pay future dividends will depend on general business conditions, the effect of a dividend payment on our financial condition, and other factors the Board of Directors may consider relevant. In addition, our credit facility limits the payment of cash dividends. The current policy of our Board of Directors is to reinvest earnings in our operations to promote future growth and, from time to time, to execute repurchases of shares of our common stock under the stock repurchase program discussed below. The repurchase of shares of our common stock reduces the amount of cash available to pay cash dividends to our common stockholders.
We did not repurchase any shares of our common stock during the year to date ended December 31, 2014 except for shares delivered back to the Company for payment of withholding taxes from employees for vesting restricted shares. Under the Company’s previously authorized stock repurchase program, stock repurchases may be made on the open market or in privately negotiated transactions from time to time, depending on factors including market conditions and corporate and regulatory requirements. The stock repurchase program does not have an expiration date and may be suspended or discontinued at any time. As of December 31, 2014, approximately $183.3 million was available under the stock repurchase program.
Our common stock transfer agent and registrar is Computershare Trust Company, N.A. They can be contacted at P.O Box# 30170, College Station, TX 77842-3170 or at their website www.computershare.com/investor.
55
Table of Contents
Issuer Purchases of Equity Securities
| Period |
Total Number of Shares Purchased (1) |
Average Price Paid per Share |
Total Number of Shares Purchased as Part of Publicly Announced Plans or Programs |
Maximum Approximate Dollar Value of Shares that May Yet Be Purchased Under the Plans or Programs |
||||||||||||
| December 31, 2013 |
$ | 183,296,772 | ||||||||||||||
| January 1, 2014—January 31, 2014 |
— | $ | — | — | 183,296,772 | |||||||||||
| February 1, 2014—February 28, 2014 |
— | — | — | 183,296,772 | ||||||||||||
| March 1, 2014—March 31, 2014 |
86,266 | 7.19 | — | 183,296,772 | ||||||||||||
| April 1, 2014—April 30, 2014 |
— | — | — | 183,296,772 | ||||||||||||
| May 1, 2014—May 31, 2014 |
9,670 | 5.03 | — | 183,296,772 | ||||||||||||
| June 1, 2014—June 30, 2014 |
— | — | — | 183,296,772 | ||||||||||||
| July 1, 2014—July 31, 2014 |
— | — | — | 183,296,772 | ||||||||||||
| August 1, 2014—August 31, 2014 |
— | — | — | 183,296,772 | ||||||||||||
| September 1, 2014—September 30, 2014 |
— | — | — | 183,296,772 | ||||||||||||
| October 1, 2014—October 31, 2014 |
— | — | — | 183,296,772 | ||||||||||||
| November 1, 2014—November 30, 2014 |
330 | 5.62 | — | 183,296,772 | ||||||||||||
| December 1, 2014—December 31, 2014 |
— | — | — | 183,296,772 | ||||||||||||
|
|
|
|
|
|||||||||||||
| Total |
96,266 | — | ||||||||||||||
|
|
|
|
|
|||||||||||||
| (1) | Includes 96,266 shares delivered back to the Company for payment of withholding taxes from employees for vesting restricted shares pursuant to the terms of the Career Education Corporation 2008 Incentive Compensation Plan. |
See Item 12, “Security Ownership of Certain Beneficial Owners and Management and Related Stockholder Matters,” for information as of December 31, 2014, with respect to shares of our common stock that may be issued under our existing share-based compensation plans.
56
Table of Contents
The graph below shows a comparison of cumulative total returns for CEC, the Standard & Poor’s 500 Index and an index of peer companies selected by CEC. The companies in the peer index are weighted according to their market capitalization as of the end of each period for which a return is indicated. Included in the peer index are the following companies whose primary business is postsecondary education, including: Apollo Education Group, Inc., Corinthian Colleges, Inc., DeVry Education Group Inc., ITT Educational Services, Inc., and Strayer Education, Inc. The performance graph begins with CEC’s $23.31 per share closing price on December 31, 2009.
COMPARISON OF CUMULATIVE FIVE-YEAR TOTAL RETURN
(Based on $100 invested on December 31, 2009 and assumes the reinvestment of all dividends.)
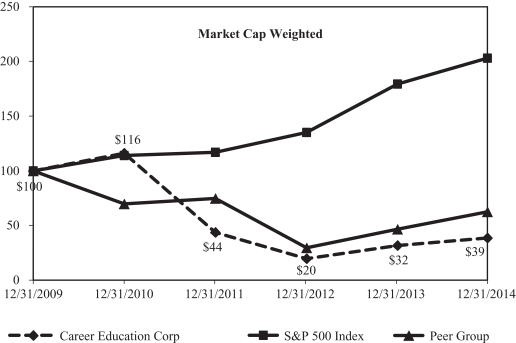
57
Table of Contents
| ITEM 6. | SELECTED FINANCIAL DATA |
The following selected historical consolidated financial and other data are qualified in their entirety by reference to, and should be read in conjunction with, our consolidated financial statements and the related notes thereto appearing elsewhere in this annual report and “Management’s Discussion and Analysis of Financial Condition and Results of Operations.” Our selected statement of (loss) income and comprehensive (loss) income and statement of cash flows data set forth below for each of the five years ended December 31, 2014, 2013, 2012, 2011 and 2010, and the balance sheet data as of December 31, 2014, 2013, 2012, 2011 and 2010, are derived from our audited consolidated financial statements. Prior period financial results have been recast to be comparable to current period reporting.
| For the Year Ended December 31, | ||||||||||||||||||||
| 2014 | 2013 | 2012 | 2011 | 2010 | ||||||||||||||||
| (Dollars in thousands, except per share amounts) | ||||||||||||||||||||
| Selected Statements of (Loss) Income and Comprehensive (Loss) Income Data |
||||||||||||||||||||
| Total revenue |
$ | 741,358 | $ | 839,681 | $ | 1,019,903 | $ | 1,267,295 | $ | 1,435,035 | ||||||||||
| Operating expenses: |
||||||||||||||||||||
| Educational services and facilities |
240,796 | 274,450 | 324,493 | 359,352 | 371,259 | |||||||||||||||
| General and administrative |
520,361 | 592,236 | 630,142 | 662,106 | 725,909 | |||||||||||||||
| Depreciation and amortization |
36,019 | 45,155 | 48,352 | 49,107 | 39,720 | |||||||||||||||
| Goodwill and asset impairment (1) |
16,898 | 8,681 | 86,606 | 96,916 | 2,314 | |||||||||||||||
|
|
|
|
|
|
|
|
|
|
|
|||||||||||
| Total operating expenses |
814,074 | 920,522 | 1,089,593 | 1,167,481 | 1,139,202 | |||||||||||||||
|
|
|
|
|
|
|
|
|
|
|
|||||||||||
| Operating (loss) income |
(72,716 | ) | (80,841 | ) | (69,690 | ) | 99,814 | 295,833 | ||||||||||||
| Operating margin percentage |
-9.8 | % | -9.6 | % | -6.8 | % | 7.9 | % | 20.6 | % | ||||||||||
| Total other (expense) income |
212 | (6,740 | ) | 901 | 2,515 | 253 | ||||||||||||||
|
|
|
|
|
|
|
|
|
|
|
|||||||||||
| Pretax (loss) income |
(72,504 | ) | (87,581 | ) | (68,789 | ) | 102,329 | 296,086 | ||||||||||||
| Provision for (benefit from) income taxes |
3,736 | 30,144 | (3,948 | ) | 63,055 | 100,047 | ||||||||||||||
|
|
|
|
|
|
|
|
|
|
|
|||||||||||
| (Loss) income from continuing operations |
(76,240 | ) | (117,725 | ) | (64,841 | ) | 39,274 | 196,039 | ||||||||||||
|
|
|
|
|
|
|
|
|
|
|
|||||||||||
| Loss from discontinued operations, net of tax (2) |
(101,923 | ) | (46,538 | ) | (77,955 | ) | (20,701 | ) | (38,266 | ) | ||||||||||
|
|
|
|
|
|
|
|
|
|
|
|||||||||||
| Net (loss) income |
$ | (178,163 | ) | $ | (164,263 | ) | $ | (142,796 | ) | $ | 18,573 | $ | 157,773 | |||||||
|
|
|
|
|
|
|
|
|
|
|
|||||||||||
| Net (loss) income per share - basic: |
||||||||||||||||||||
| (Loss) income from continuing operations |
$ | (1.13 | ) | $ | (1.76 | ) | $ | (0.98 | ) | $ | 0.53 | $ | 2.45 | |||||||
| Loss from discontinued operations |
(1.52 | ) | (0.70 | ) | (1.17 | ) | (0.28 | ) | (0.48 | ) | ||||||||||
|
|
|
|
|
|
|
|
|
|
|
|||||||||||
| Net (loss) income |
$ | (2.65 | ) | $ | (2.46 | ) | $ | (2.15 | ) | $ | 0.25 | $ | 1.97 | |||||||
|
|
|
|
|
|
|
|
|
|
|
|||||||||||
| Net (loss) income per share - diluted: |
||||||||||||||||||||
| (Loss) income from continuing operations |
$ | (1.13 | ) | $ | (1.76 | ) | $ | (0.98 | ) | $ | 0.53 | $ | 2.42 | |||||||
| Loss from discontinued operations |
(1.52 | ) | (0.70 | ) | (1.17 | ) | (0.28 | ) | (0.47 | ) | ||||||||||
|
|
|
|
|
|
|
|
|
|
|
|||||||||||
| Net (loss) income |
$ | (2.65 | ) | $ | (2.46 | ) | $ | (2.15 | ) | $ | 0.25 | $ | 1.95 | |||||||
|
|
|
|
|
|
|
|
|
|
|
|||||||||||
58
Table of Contents
| As of December 31, | ||||||||||||||||||||
| 2014 | 2013 | 2012 | 2011 | 2010 | ||||||||||||||||
| (Dollars in thousands) | ||||||||||||||||||||
| Selected Balance Sheet Data |
||||||||||||||||||||
| Assets: |
||||||||||||||||||||
| Cash and cash equivalents, restricted cash and short-term investments |
$ | 239,628 | $ | 362,624 | $ | 275,272 | $ | 332,332 | $ | 331,045 | ||||||||||
| Student receivables, net (3) |
27,490 | 31,271 | 43,750 | 35,315 | 45,075 | |||||||||||||||
| Total current assets |
380,804 | 460,017 | 543,561 | 610,478 | 626,525 | |||||||||||||||
| Total assets |
573,534 | 805,045 | 1,122,703 | 1,338,391 | 1,587,792 | |||||||||||||||
| Liabilities: |
||||||||||||||||||||
| Deferred tuition revenue |
37,572 | 44,769 | 47,526 | 70,312 | 77,057 | |||||||||||||||
| Total current liabilities |
201,183 | 207,432 | 352,715 | 329,443 | 457,084 | |||||||||||||||
| Total liabilities |
291,601 | 349,661 | 510,913 | 532,300 | 653,255 | |||||||||||||||
| Working capital |
179,621 | 252,585 | 190,846 | 281,035 | 169,441 | |||||||||||||||
| Total stockholders’ equity |
$ | 281,933 | $ | 455,384 | $ | 611,790 | $ | 806,091 | $ | 934,537 | ||||||||||
| For the Year Ended December 31, | ||||||||||||||||||||
| 2014 | 2013 | 2012 | 2011 | 2010 | ||||||||||||||||
| (Dollars in thousands) | ||||||||||||||||||||
| Selected Statements of Cash Flows Data |
||||||||||||||||||||
| Net cash (used in) provided by operating activities |
$ | (118,624 | ) | $ | (85,804 | ) | $ | (16,798 | ) | $ | 230,450 | $ | 272,259 | |||||||
| Net cash (used in) provided by investing activities |
$ | (107,623 | ) | $ | 166,866 | $ | 58,355 | $ | (66,231 | ) | $ | (92,808 | ) | |||||||
| Net cash provided by (used in) financing activities |
$ | 980 | $ | 6,103 | $ | (79,690 | ) | $ | (163,043 | ) | $ | (173,725 | ) | |||||||
| Capital expenditures |
$ | (13,156 | ) | $ | (19,636 | ) | $ | (37,944 | ) | $ | (78,333 | ) | $ | (127,283 | ) | |||||
| (1) | See Note 7 “Property and Equipment” and Note 9 “Goodwill and Other Intangible Assets” to our consolidated financial statements for further discussion of these impairment charges. |
| (2) | See Note 4 “Discontinued Operations” to our consolidated financial statements for further discussion. |
| (3) | Student receivables, net includes both current and non-current balances. |
59
Table of Contents
| ITEM 7. | MANAGEMENT’S DISCUSSION AND ANALYSIS OF FINANCIAL CONDITION AND RESULTS OF OPERATIONS |
The discussion below contains “forward-looking statements,” as defined in Section 21E of the Securities Exchange Act of 1934, as amended, that reflect our current expectations regarding our future growth, results of operations, cash flows, performance and business prospects, and opportunities, as well as assumptions made by, and information currently available to, our management. We have tried to identify forward-looking statements by using words such as “anticipate,” “believe,” “expect,” “intend,” “trend,” “will,” “continue to,” and similar expressions, but these words are not the exclusive means of identifying forward-looking statements. These statements are based on information currently available to us and are subject to various risks, uncertainties, and other factors, including, but not limited to, those matters discussed in Item 1A, “Risk Factors,” in Part I of this Annual Report on Form 10-K that could cause our actual growth, results of operations, cash flows, performance, business prospects and opportunities to differ materially from those expressed in, or implied by, these statements. Except as expressly required by the federal securities laws, we undertake no obligation to update such factors or to publicly announce the results of any of the forward-looking statements contained herein to reflect future events, developments, or changed circumstances, or for any other reason.
As used in this Annual Report on Form 10-K, the terms “we,” “us,” “our,” “the Company,” and “CEC” refer to Career Education Corporation and our wholly-owned subsidiaries. The terms “college,” “institution,” and “university” each refer to an individual, branded, proprietary educational institution, owned by us and including its campus locations. The term “campus” refers to an individual main or branch campus operated by one of our colleges, institutions or universities.
Overview
Our institutions include, among others, American InterContinental University (“AIU”); Brooks Institute; Colorado Technical University (“CTU”); Harrington College of Design; Le Cordon Bleu North America (“LCB”); and Sanford-Brown Institutes and Colleges (“SBI” and “SBC,” respectively). Through our institutions, we are committed to providing high-quality education, enabling students to graduate and pursue rewarding career opportunities.
During 2014, we announced the teach-out of three additional Sanford-Brown campuses: Chicago, Las Vegas and Orlando. These campuses are now included in the Transitional Group segment. During 2014, we also completed the teach-out of 20 Transitional Group campuses and one CTU campus as well as sold two campuses (one previously reported in the Career Colleges segment and one previously reported in the Transitional Group segment).
Additionally, during the fourth quarter of 2014, our Board of Directors approved a plan to sell our 16 Culinary Arts campuses (“LCB”). Our decision to pursue the divestiture of LCB was the result of an ongoing portfolio review undertaken to evaluate the strategic direction of the Company. As a result of the decision to sell LCB, the assets and liabilities of the entities to be sold are classified as held for sale within discontinued operations as of December 31, 2014.
All prior period results have been recast to reflect our reporting segments on a comparable basis.
We operate in a highly regulated industry, which has significant impacts on our business and creates risks and uncertainties. We encourage you to review Item 1, “Business,” and Item 1A, “Risk Factors,” to learn more.
The following Management’s Discussion and Analysis of Financial Condition and Results of Operations (“MD&A”) should be read in conjunction with the Company’s consolidated financial statements and the notes thereto appearing elsewhere in this Annual Report on Form 10-K. The MD&A is intended to help investors understand the results of operations, financial condition and present business environment. The MD&A is organized as follows:
| • | 2014 Overview and 2015 Outlook |
| • | Consolidated Results of Operations |
60
Table of Contents
| • | Segment Results of Operations |
| • | Summary of Critical Accounting Policies and Estimates |
| • | Liquidity, Financial Position and Capital Resources |
Note Regarding Non-GAAP measures
The Company believes it is useful to present non-GAAP financial measures which exclude certain significant items as a means to understand the performance of its core business. As a general matter, the Company uses non-GAAP financial measures in conjunction with results presented in accordance with GAAP to help analyze the performance of its core business, assist with preparing the annual operating plan, and measure performance for some forms of compensation. In addition, the Company believes that non-GAAP financial information is used by analysts and others in the investment community to analyze the Company’s historical results and to provide estimates of future performance and that failure to report non-GAAP measures could result in a misplaced perception that the Company’s results have underperformed or exceeded expectations.
We believe adjusted EBITDA allows us to compare our current operating results with corresponding historical periods and with the operational performance of other companies in our industry because it does not give effect to potential differences caused by items we do not consider reflective of underlying operating performance. We also present adjusted EBITDA because we believe it is frequently used by securities analysts, investors and other interested parties as a measure of performance. In evaluating adjusted EBITDA, investors should be aware that in the future we may incur expenses similar to the adjustments presented below. Our presentation of adjusted EBITDA should not be construed as an inference that our future results will be unaffected by expenses that are unusual, non-routine or non-recurring. Adjusted EBITDA has limitations as an analytical tool, and you should not consider it in isolation, or as a substitute for net income (loss), operating income (loss), or any other performance measure derived in accordance and reported under GAAP or as an alternative to cash flow from operating activities or as a measure of our liquidity.
Non-GAAP financial measures. when viewed in a reconciliation to corresponding GAAP financial measures, provide an additional way of viewing the Company’s results of operations and the factors and trends affecting the Company’s business. Non-GAAP financial measures should be considered as a supplement to, and not as a substitute for, or superior to, the corresponding financial results presented in accordance with GAAP.
2014 OVERVIEW
Throughout 2014, we made significant progress within our operations related to the strategic goals we set for ourselves. Through the efforts of our dedicated faculty, staff and support services groups we advanced our mission to Enroll, Educate and Place our students into careers that will enrich their lives. As a result of the continued progress of our various initiatives, we find ourselves in a stronger position as compared to the prior year, despite the continued regulatory challenges and enrollment trends experienced within postsecondary education in general, and the proprietary education sector in particular.
In February of 2015, as previously announced, Scott W. Steffey resigned as President, Chief Executive Officer and Board member. The Board has appointed Ronald D. McCray as Interim President and Chief Executive Officer in addition to his current role as Chairman of the Board of Directors. Mr. McCray joined the Board in November 2012 and has served as Chairman since June 2014. Mr. McCray’s extensive experience with both publicly-held companies and educational institutions will provide the Company with strong support as it searches for a permanent successor to serve as President and CEO. Mr. McCray, together with the solid leadership team, continues to focus on and execute against the strategic objectives set forth by the Company including: strengthen academic outcomes, enhance regulatory compliance and simplify our business model; generate modest total student enrollment growth within our University segments; neutralize the negative impact of our Career Colleges and Culinary Arts campuses; reduce the organizational cost structure; and continue to successfully complete the teach-out of our Transitional Group.
61
Table of Contents
During the fourth quarter of 2014, the Company announced its intent to sell the Le Cordon Bleu Colleges of Culinary Arts (LCB). The decision to pursue the divestiture of LCB was the result of an ongoing portfolio review undertaken as part of an evaluation of the strategic direction of the Company. We anticipate that the sale of LCB will help further strengthen our financial position and enable us to focus on and grow other parts of our business. We have not yet secured a buyer for the sale of LCB, but have allocated resources to the sale process and contracted with a third party firm to assist with the transaction. We anticipate completing the sale by the end of 2015. As a result of this decision, the Culinary Arts segment, which was previously reported within the Career Schools group, has been recast to discontinued operations as an asset held for sale.
During 2014, revenue from continuing operations declined $98.3 million or 11.7% due to an overall 8.0% decrease in total student enrollments. Excluding our campuses within the Transitional Group, which no longer enroll new students, revenue for ongoing operations declined approximately 8.5% as a result of an approximate 4.5% decline in total student enrollments as compared to the prior year. For the current year, we reported an operating loss of $72.7 million as compared to an operating loss of $80.8 million in the prior year for continuing operations and an operating loss of $34.8 million in the current year versus an operating loss of $42.7 million in the prior year for ongoing operations, which excludes our Transitional Group. The current year results include an increase in asset impairment charges of $8.2 million as compared to the prior year, which were more than offset by decreases in the remaining operating expense categories as compared to the prior year, including administrative and compensation expenses.
Within our University segments, revenue decreased by $32.7 million or 14.1% for AIU and $9.5 million or 2.7% for CTU, as compared to the prior year. Operating income improved for CTU by $4.4 million or 6.8% and declined for AIU by $3.9 million or 69.4%. Total student enrollments were approximately 1.2% lower as compared to the prior year, while our online total student enrollment increased approximately 1.0% and new student enrollments increased 15.2%.
Within our Career Colleges, revenue decreased $24.2 million or 12.3% for the current year as compared to the prior year and operating loss increased $5.1 million or 7.4%, primarily due to the decrease in revenue being only partially offset with lower operating expenses. Career Colleges experienced a decline in new student enrollments of approximately 10.3% and an approximate 15.0% decline in total student enrollments as compared to the prior year. We believe new student enrollments were impacted, in part, by a short-term market disruption related to our Sanford-Brown brand consolidation and changes to our marketing strategy which led to fewer student applications and ultimately fewer new student enrollments.
Progress against strategic objectives
Strengthening our academic outcomes continues to remain a top priority for our institutions. Our adaptive learning system, intellipath, continues to serve as a powerful tool in the education of our students by strengthening academic outcomes. Not only does intellipath serve as a competitive differentiator for our company and institutions, but it also increases student engagement and satisfaction and thus student retention rates overall at the campuses that have integrated intellipath into their curriculum. Currently intellipath is almost exclusively used by our online institutions, but through 2016 we intend to expand its use to include our ground-based campuses. Through ongoing assessment of a student’s current knowledge and knowledge gains, this technology personalizes the learning experience enabling each student to spend more time where they need to fill knowledge gaps while also allowing them to skip material they already know. Of particular interest to us is our realization that even when our students satisfactorily complete a learning module or node, they often times elect to complete additional practice exercises to further improve their knowledge and skills. In key classes, such as College Algebra, we have seen a considerable increase in student grades and pass rates for those who have utilized the intellipath software.
During 2014, we increased our investment by $3.2 million in the company that developed the analytical engine that drives our adaptive learning system, bringing our total investment share to approximately 30.7%.
62
Table of Contents
This investment provides continuing access to the engine as we continue to explore new ways to leverage its power to improve academic outcomes and the student experience.
We continue to focus on regulatory compliance and adherence to the standards of each of our institutional and programmatic accreditors. Evidence of our commitment to academic and operational excellence include the many renewal of accreditation decisions achieved by our institutions this year. Of the 29 institutions that had applied for ACICS renewal of accreditation, 28 received a renewal grant through 2019 or 2020 and one is on deferral pending the next Commission meeting. AIU’s accreditation was continued by HLC with the next reaffirmation of accreditation scheduled for 2023-2024. The results of one HLC renewal application (Harrington College of Design) and one ACCSC renewal application (Le Cordon Bleu Boston) are pending. We have continued to improve our cohort default rates for the third consecutive year, in part as a result of additional default prevention tools we have put in place. Additionally, we have simplified our business model through the divestiture of our International business in late 2013 and the consolidation of several brands within the Career Colleges segment. We have also streamlined our management structure to align with our simpler operating model.
Within our University group, we experienced total online student enrollment growth of approximately 1.0% as compared to the prior year. Online students comprise approximately 90% of our University group total enrollments. As we progressed through 2014, the rate of decline in total student enrollments continued to decrease. Teach-outs and consolidations at several of our ground-based University campuses have contributed to lower total student enrollments. We expect continued modest fluctuations within results during 2015, but remain focused on growing this profitable component of our business, including our award-winning online offerings. The stabilization of total student enrollments within our University group and an improved cost structure entering 2015 positions us well to move forward and expand the profitability of this group, including positive operating income for AIU during 2015.
We experienced a stabilization of trends within our Career Colleges as the rate of decline for our total student enrollments lessened compared to the prior year. However, we experienced challenges earlier in the year due to both weather-related campus closures and market disruptions related to our Sanford-Brown brand consolidation as well as our de-emphasis of certain programs such as Art & Design programs which have not produced optimal operating results and may face challenges in meeting the new gainful employment requirements. We expect these challenges to continue to impact student enrollments and anticipate that we will see fluctuations within our operating results for Career Colleges for the foreseeable future. We are focused on adding new programs at certain campuses in order to meet changing workforce needs and student interests, to generate new student enrollments and to replace programs that may face challenges under the gainful employment rules, but we cannot predict whether our actions will be successful. As with all of our assets, we continue to monitor our Career Colleges performance trends against projected results and we continue to evaluate options to produce sustainable positive operating results for the Company and to maximize shareholder value.
We have continued to focus on reducing our overall organizational cost structure and as a result, we have removed over $300 million of operating expenses since 2012, including expenses within our Transitional Group that have since closed, with over $100 million of that improvement realized during 2014. The decrease is primarily a result of enterprise-wide cost reduction efforts and lower general and administrative expenses due to an insurance recovery in the current year, lower legal expenses as compared to the prior year and reorganization efforts. These proactive cost reductions helped drive positive adjusted EBITDA within our ongoing operations for the fourth quarter of 2014. Further, we expect an additional $40 million of cost savings to be realized in 2015 as a result of actions taken in 2014. We believe there are opportunities to remove additional costs from the organization during 2015.
We believe the use of an adjusted EBITDA measure allows us to compare our current operating results for our ongoing operations, which excludes our Transitional Group and discontinued operations, with corresponding historical periods and with the operational performance of other companies in our industry because it does not
63
Table of Contents
give effect to potential differences caused by items we do not consider reflective of underlying operating performance. Adjusted EBITDA for the current quarter as well as the previous four quarters is presented below.
| Adjusted EBITDA |
Q4 2014 | Q3 2014 | Q2 2014 | Q1 2014 | Q4 2013 | |||||||||||||||
| ($ in thousands) |
||||||||||||||||||||
| Ongoing Operations: |
||||||||||||||||||||
| Pre-tax loss from continuing operations |
$ | (7,747 | ) | $ | (31,651 | ) | $ | (11,664 | ) | $ | (21,442 | ) | $ | (14,230 | ) | |||||
| Transitional Group operating loss |
10,138 | 10,856 | 9,091 | 7,789 | 12,126 | |||||||||||||||
| Interest (income) expense, net |
(38 | ) | (120 | ) | (177 | ) | (25 | ) | 67 | |||||||||||
| Loss (gain) on sale of business |
— | — | — | — | (68 | ) | ||||||||||||||
| Depreciation and amortization(1) |
6,965 | 7,668 | 8,244 | 8,761 | 9,397 | |||||||||||||||
| Stock-based compensation(1) |
966 | 950 | 1,020 | 1,341 | 1,580 | |||||||||||||||
| Legal settlements(1)(2) |
— | — | (400 | ) | 2,850 | 1,500 | ||||||||||||||
| Asset impairments(1) |
3,883 | 12,873 | 3 | 74 | 3,050 | |||||||||||||||
| Unused space charges(1)(3) |
(356 | ) | (439 | ) | (413 | ) | (428 | ) | (3,231 | ) | ||||||||||
| Insurance recovery |
— | (8,588 | ) | — | — | — | ||||||||||||||
| Cumulative adjustment related to revenue recognition(1) |
1,815 | — | — | — | — | |||||||||||||||
|
|
|
|
|
|
|
|
|
|
|
|||||||||||
| Adjusted EBITDA – Ongoing Operations |
$ | 15,626 | $ | (8,451 | ) | $ | 5,704 | $ | (1,080 | ) | $ | 10,191 | ||||||||
|
|
|
|
|
|
|
|
|
|
|
|||||||||||
| Adjusted EBITDA per diluted share |
$ | 0.23 | $ | (0.13 | ) | $ | 0.08 | $ | (0.02 | ) | $ | 0.15 | ||||||||
|
|
|
|
|
|
|
|
|
|
|
|||||||||||
| Memo: Advertising Expenses |
$ | 45,033 | $ | 60,031 | $ | 46,893 | $ | 57,058 | $ | 45,865 | ||||||||||
|
|
|
|
|
|
|
|
|
|
|
|||||||||||
| Transitional Group and Discontinued Operations: |
||||||||||||||||||||
| Pre-tax (loss) income from discontinued operations |
$ | (17,195 | ) | $ | (15,201 | ) | $ | (33,046 | ) | $ | (36,481 | ) | $ | 88,044 | ||||||
| Transitional Group operating loss |
(10,138 | ) | (10,856 | ) | (9,091 | ) | (7,789 | ) | (12,126 | ) | ||||||||||
| Interest expense (income), net |
— | — | — | — | (53 | ) | ||||||||||||||
| Loss (gain) on sale of business(4) |
— | — | 311 | — | (130,109 | ) | ||||||||||||||
| International Schools operating income |
— | — | — | — | (11,434 | ) | ||||||||||||||
| Depreciation and amortization(4) |
5,524 | 5,473 | 6,150 | 6,670 | 7,029 | |||||||||||||||
| Legal settlements(4) |
— | 225 | 2,000 | 3,000 | 15,500 | |||||||||||||||
| Asset impairments(4) |
10,320 | 1,612 | 7,451 | (7 | ) | 3,933 | ||||||||||||||
| Unused space charges(3)(4) |
(2,080 | ) | (3,272 | ) | 970 | 2,921 | 6,073 | |||||||||||||
| Cumulative adjustment related to revenue recognition(4) |
568 | — | — | — | — | |||||||||||||||
|
|
|
|
|
|
|
|
|
|
|
|||||||||||
| Adjusted EBITDA – Transitional and Discontinued Operations |
$ | (13,001 | ) | $ | (22,019 | ) | $ | (25,255 | ) | $ | (31,686 | ) | $ | (33,143 | ) | |||||
|
|
|
|
|
|
|
|
|
|
|
|||||||||||
| Adjusted EBITDA per diluted share |
$ | (0.19 | ) | $ | (0.33 | ) | $ | (0.38 | ) | $ | (0.47 | ) | $ | (0.50 | ) | |||||
|
|
|
|
|
|
|
|
|
|
|
|||||||||||
| (1) | Quarterly amounts relate to ongoing operations, excluding the Transitional Group and assets held for sale |
| (2) | Legal settlement amounts are net of insurance recoveries |
| (3) | Unused space charges include initial charge and subsequent accretion |
| (4) | Quarterly amounts relate to the Transitional Group and discontinued operations |
Adjusted EBITDA for ongoing operations, which excludes the Transitional Group and discontinued operations, improved $5.4 million or 53.3% for the fourth quarter of 2014 as compared to the same quarter last year as revenue declines of $18.0 million were more than offset by reduced operating expenses. Adjusted EBITDA was $15.6 million or $0.23 per diluted share for the fourth quarter of 2014 as compared to $10.2 million or $0.15 per diluted share for the fourth quarter of 2013. This favorability was a result of continued efforts to align current cost structure with total student enrollment and improved profitability from the University
64
Table of Contents
group. We expect that our ongoing operations will be adjusted EBITDA positive for the full year 2015; although not necessarily for each quarter as advertising investments are typically heavier in the first and third quarters of each year as reflected above in the table. The primary drivers of our plans to be adjusted EBITDA positive for 2015 include: improved EBITDA from our CTU segment; positive adjusted EBITDA for our AIU segment, driven primarily by an improved cost structure; benefit from the $40.0 million of expense reductions we took in the latter half of 2014, a portion of which will drive the CTU and AIU improvement; and continued focus on stemming our losses in Career Colleges. However, these improvements will be substantially offset with management allocations that will be absorbed by our continuing operations which were previously allocated to our Culinary Arts campuses that are now reported within discontinued operations. Therefore, our expected adjusted EBITDA growth for 2015 is expected to be minimal as compared to 2014.
Adjusted EBITDA for the Transitional Group and discontinued operations was -$13.0 million or -$0.19 per diluted share for the fourth quarter of 2014 as compared to -$33.1 million or -$0.50 per diluted share for the fourth quarter of 2013. This favorability was a result of the completion of teach-out operations at campuses that have now closed and continued focus on exiting and reducing real estate lease obligations once a teach-out is complete. Such lease obligations are a large component of our cost structure and cash usage. In addition to real estate leases associated with our ongoing operations, campuses that have completed the teach-out process more often than not have ongoing lease obligations that continue for some time. During the past twelve months we have entered into sublease agreements and early lease termination agreements which will result in cash savings of $39 million, net of cash payments over the remaining life of the leases. See “Contractual Obligations” under “Liquidity, Financial Position and Capital Resources” below for further information regarding our remaining lease obligations. We intend to continue to be proactive in our efforts to lower our real estate exposure, including termination agreements, sublease agreements and space consolidation but we anticipate that the level and volume of transactions in 2015 may be less than those negotiated in 2014. We anticipate adjusted EBITDA for the Transitional Group and discontinued operations to continue to decrease through 2015 and we expect adjusted EBITDA to be approximately negative $62.0 for the full year 2015 based on the current composition of our Transitional Group and discontinued operations.
Within the Transitional Group, we closed twenty campuses during 2014, as well as divested one campus in the second quarter of 2014, bringing the remaining number of Transitional campuses to 12, four of which are expected to close in 2015. As we continue to complete the teach-outs within the Transitional Group, we expect the operating loss and cash consumption associated with these campuses to further decline. We will continue to analyze the student outcomes and financial performance of each of our programs and campuses to make the necessary decisions that are in the best interest of our students, as well as for long-term success and value creation for the organization.
As an organization, our focus continues to be to Enroll, Educate and Place our students into a better position to succeed professionally and to close the gap between students and employers. In doing so, we seek to create a winning formula for our students, for employers that employ our graduates and for our shareholders. We have successfully executed against our strategic goals for 2014 and we remain committed to execute on our goals in 2015. We continue to believe that we are well-positioned to complete our turnaround strategy and generate long-term profitability.
2015 OUTLOOK
An update on our expectations for performance and general business outlook for full year 2015 include:
| • | Modest growth in total student enrollments for the year within our University group, with online being the primary contributor |
| • | Positive adjusted EBITDA for full year 2015 from ongoing operations, which excludes the Transitional Group and campuses held for sale |
| • | Reduced operating expenses of $40 million based on actions that were taken in 2014 |
65
Table of Contents
| • | Continued progress on reductions of real estate obligations |
| • | End fiscal year 2015 with over $190 million in total cash, cash equivalents, restricted cash and short-term investments |
The progress we have made to date against our strategic goals puts us on target with our plans for the successful turnaround of our Company and return to profitability. We believe our strong cash position and competitive academic platforms position us well in our industry, and early indicators in our business thus far in fiscal year 2015 support continued positive momentum in each of the recent performance improvements we have achieved.
CONSOLIDATED RESULTS OF OPERATIONS
The summary of selected financial data table below should be referenced in connection with a review of the following discussion of our results of operations for the years ended December 31, 2014, 2013 and 2012. Results for the prior period have been reclassified for our campuses that have been sold, taught-out or are held for sale, to be comparable to the current year presentation (dollars in thousands):
| For the Year Ended December 31, | ||||||||||||||||||||||||
| 2014 | % of Total Revenue |
2013 | % of Total Revenue |
2012 | % of Total Revenue |
|||||||||||||||||||
| TOTAL REVENUE |
$ | 741,358 | $ | 839,681 | $ | 1,019,903 | ||||||||||||||||||
|
|
|
|
|
|
|
|||||||||||||||||||
| OPERATING EXPENSES |
||||||||||||||||||||||||
| Educational services and facilities (1) |
240,796 | 32.5 | % | 274,450 | 32.7 | % | 324,493 | 31.8 | % | |||||||||||||||
| General and administrative (2): |
||||||||||||||||||||||||
| Advertising |
212,365 | 28.6 | % | 227,916 | 27.1 | % | 247,185 | 24.2 | % | |||||||||||||||
| Admissions |
105,598 | 14.2 | % | 115,139 | 13.7 | % | 137,679 | 13.5 | % | |||||||||||||||
| Administrative |
186,548 | 25.2 | % | 228,763 | 27.2 | % | 223,364 | 21.9 | % | |||||||||||||||
| Bad debt |
15,850 | 2.1 | % | 20,418 | 2.4 | % | 21,914 | 2.1 | % | |||||||||||||||
|
|
|
|
|
|
|
|||||||||||||||||||
| Total general and administrative expense |
520,361 | 70.2 | % | 592,236 | 70.5 | % | 630,142 | 61.8 | % | |||||||||||||||
| Depreciation and amortization |
36,019 | 4.9 | % | 45,155 | 5.4 | % | 48,352 | 4.7 | % | |||||||||||||||
| Goodwill and asset impairment |
16,898 | 2.3 | % | 8,681 | 1.0 | % | 86,606 | 8.5 | % | |||||||||||||||
|
|
|
|
|
|
|
|||||||||||||||||||
| OPERATING LOSS |
(72,716 | ) | -9.8 | % | (80,841 | ) | -9.6 | % | (69,690 | ) | -6.8 | % | ||||||||||||
|
|
|
|
|
|
|
|||||||||||||||||||
| PRETAX LOSS |
(72,504 | ) | -9.8 | % | (87,581 | ) | -10.4 | % | (68,789 | ) | -6.7 | % | ||||||||||||
| PROVISION FOR (BENEFIT FROM) INCOME TAXES |
3,736 | 0.5 | % | 30,144 | 3.6 | % | (3,948 | ) | -0.4 | % | ||||||||||||||
|
|
|
|
|
|
|
|||||||||||||||||||
| Effective tax rate |
5.2 | % | 34.4 | % | -5.7 | % | ||||||||||||||||||
| LOSS FROM CONTINUING OPERATIONS |
(76,240 | ) | -10.3 | % | (117,725 | ) | -14.0 | % | (64,841 | ) | -6.4 | % | ||||||||||||
| LOSS FROM DISCONTINUED OPERATIONS, net of tax |
(101,923 | ) | -13.7 | % | (46,538 | ) | -5.5 | % | (77,955 | ) | -7.6 | % | ||||||||||||
|
|
|
|
|
|
|
|||||||||||||||||||
| NET LOSS |
$ | (178,163 | ) | -24.0 | % | $ | (164,263 | ) | -19.6 | % | $ | (142,796 | ) | -14.0 | % | |||||||||
|
|
|
|
|
|
|
|||||||||||||||||||
| (1) | Educational services and facilities expense includes costs directly attributable to the educational activities of our campuses, including: salaries and benefits of faculty, academic administrators and student support personnel, and costs of educational supplies and facilities, including rents on campus leases, certain costs of establishing and maintaining computer laboratories, costs of student housing, and owned and leased facility costs. Also included in educational services and facilities expense are costs of other goods and services provided by our campuses, including costs of textbooks, laptop computers, restaurant services and contract training. |
| (2) | General and administrative expense includes salaries and benefits of personnel in corporate and campus administration, marketing, admissions, financial aid, accounting, human resources, legal and compliance. Other expenses within this expense category include costs of advertising and production of marketing materials, occupancy of the corporate offices and bad debt expense. |
66
Table of Contents
Year Ended December 31, 2014 as Compared to the Year Ended December 31, 2013
Revenue
Current year revenue decreased 11.7% or $98.3 million driven by an overall 8.0% decline in total student enrollments. Excluding our Transitional Group, which no longer enrolls new students as campuses are taught out, revenue declined approximately 8.5% or $66.2 million driven by an overall 4.5% decline in total student enrollments. The rate of decline in revenue as compared to the prior year has been steadily decreasing as we continued the execution of our turnaround strategy. Revenue for AIU and CTU declined while total student enrollments remained relatively flat as of December 31, 2014, in part due to the time lag of revenue earnings for new students as they progress through their program. Additionally, application volume within Career Colleges was impacted earlier in the year by market disruption related to the brand consolidation under our Sanford-Brown name, which resulted in a decrease in new student enrollments during 2014 as compared to the prior year, contributing to the decrease in revenue. Lastly, revenue was negatively impacted by approximately $9.4 million due to an adjustment related to revenue recognition for students who withdraw from one of our institutions prior to completion of their program. This decline in revenue was partially offset with a $7.5 million decrease in bad debt expense for the amount we previously had deemed uncollectable related to the revenue earnings for these students. This cumulative adjustment was recorded during the fourth quarter of 2014.
Educational Services and Facilities Expense (dollars in thousands)
| For the Year Ended December 31, | ||||||||||||||||||||||||
| 2014 | % of Total Revenue |
2013 | % of Total Revenue |
2012 | % of Total Revenue |
|||||||||||||||||||
| Educational services and facilities: |
||||||||||||||||||||||||
| Academics & student related |
$ | 164,340 | 22.2 | % | $ | 193,188 | 23.0 | % | $ | 239,106 | 23.4 | % | ||||||||||||
| Occupancy |
76,456 | 10.3 | % | 81,262 | 9.7 | % | 85,387 | 8.4 | % | |||||||||||||||
|
|
|
|
|
|
|
|||||||||||||||||||
| Total educational services and facilities |
$ | 240,796 | 32.5 | % | $ | 274,450 | 32.7 | % | $ | 324,493 | 31.8 | % | ||||||||||||
|
|
|
|
|
|
|
|||||||||||||||||||
The decrease in educational services and facilities expense as compared to the prior year was driven by lower academic costs, most notably faculty and bookstore costs and lower occupancy costs. The decrease in faculty and bookstore costs was driven primarily by lower total student enrollments across most of our institutions as well as increased operational efficiencies. The decrease in occupancy expenses was a result of our continued focus on optimizing real estate space across all of our locations. Efforts to consolidate space within closely-situated institutions as well as our corporate offices resulted in a decrease in overall fixed costs, which were partially offset in the current year with upfront expenses recorded at the onset of termination agreements.
General and Administrative Expense (dollars in thousands)
| For the Year Ended December 31, | ||||||||||||||||||||||||
| 2014 | % of Total Revenue |
2013 | % of Total Revenue |
2012 | % of Total Revenue |
|||||||||||||||||||
| General and administrative: |
||||||||||||||||||||||||
| Advertising |
$ | 212,365 | 28.6 | % | $ | 227,916 | 27.1 | % | $ | 247,185 | 24.2 | % | ||||||||||||
| Admissions |
105,598 | 14.2 | % | 115,139 | 13.7 | % | 137,679 | 13.5 | % | |||||||||||||||
| Administrative |
186,548 | 25.2 | % | 228,763 | 27.2 | % | 223,364 | 21.9 | % | |||||||||||||||
| Bad Debt |
15,850 | 2.1 | % | 20,418 | 2.4 | % | 21,914 | 2.1 | % | |||||||||||||||
|
|
|
|
|
|
|
|||||||||||||||||||
| Total general and administrative expense |
$ | 520,361 | 70.2 | % | $ | 592,236 | 70.5 | % | $ | 630,142 | 61.8 | % | ||||||||||||
|
|
|
|
|
|
|
|||||||||||||||||||
General and administrative expenses have decreased as compared to the prior year primarily due to decreases within administrative and advertising expenses. Administrative expense was lower as compared to the prior year primarily due to both an $8.6 million insurance recovery recorded in the current year and
67
Table of Contents
approximately $11.8 million of legal settlements recorded in the prior year as compared to approximately $2.5 million in the current year as well as our continued focus to reduce costs throughout the organization. The lower advertising expense was driven by operational changes within marketing to continue to improve overall efficiency.
Bad debt expense incurred by each of our segments during the years ended December 31, 2014, 2013 and 2012 was as follows (dollars in thousands):
| For the Year Ended December 31, | ||||||||||||||||||||||||
| 2014 | As a % of Segment Revenue |
2013 | As a % of Segment Revenue |
2012 | As a % of Segment Revenue |
|||||||||||||||||||
| Bad debt expense by segment: |
||||||||||||||||||||||||
| CTU |
$ | 9,587 | 2.8 | % | $ | 10,749 | 3.1 | % | $ | 8,970 | 2.5 | % | ||||||||||||
| AIU |
4,726 | 2.4 | % | 6,366 | 2.7 | % | 5,692 | 1.9 | % | |||||||||||||||
|
|
|
|
|
|
|
|||||||||||||||||||
| Total University Group |
14,313 | 2.7 | % | 17,115 | 3.0 | % | 14,662 | 2.2 | % | |||||||||||||||
|
|
|
|
|
|
|
|||||||||||||||||||
| Career Colleges |
2,143 | 1.2 | % | 4,014 | 2.0 | % | 5,095 | 2.1 | % | |||||||||||||||
| Corporate and Other |
(731 | ) | N/A | (1,646 | ) | N/A | (1,489 | ) | N/A | |||||||||||||||
|
|
|
|
|
|
|
|||||||||||||||||||
| Subtotal |
15,725 | 2.2 | % | 19,483 | 2.5 | % | 18,268 | 2.0 | % | |||||||||||||||
| Transitional Group |
125 | 0.4 | % | 935 | 1.4 | % | 3,646 | 3.3 | % | |||||||||||||||
|
|
|
|
|
|
|
|||||||||||||||||||
| Total bad debt expense |
$ | 15,850 | 2.1 | % | $ | 20,418 | 2.4 | % | $ | 21,914 | 2.1 | % | ||||||||||||
|
|
|
|
|
|
|
|||||||||||||||||||
The decrease in bad debt expense was primarily driven by a $7.5 million adjustment recorded related to students who withdraw from one of our institutions prior to completing their program. Excluding the decrease in bad debt expense related to this adjustment, bad debt expense increased approximately $3.0 million primarily due to an increase in the number of payment plans for students within our University segments as well as a slight increase in our reserve rates due to historical performance.
Goodwill and Asset Impairment
During 2014, we recorded approximately $14.7 million and $2.2 million of asset and trade name impairment charges, respectively. Approximately $14.5 million of the asset impairment charges were recorded within Career Colleges to reflect the current estimated fair values of certain leased locations based on the related undiscounted future cash flows. The $2.2 million trade name impairment was recorded within Career Colleges related to the Sanford-Brown trade name. See Note 7 “Property and Equipment” and Note 9 “Goodwill and Other Intangible Assets” to our consolidated financial statements for additional information.
Operating Loss
The operating loss reported for the current year decreased $8.1 million or 10.1% as compared to the prior year. Decreases within operating expenses, primarily due to reorganization efforts to reduce costs, lower legal settlement expenses as compared to the prior year period, operational efficiencies instituted across the organization within academics, advertising and admissions as well as strategic decisions made related to optimization of facilities, have contributed to operating margin stabilization. The current year included increased asset impairment charges related to trade name and fixed asset impairments within our Career Colleges segment.
Provision for (Benefit from) Income Taxes
As of December 31, 2014, we reported a total deferred tax valuation allowance of $150.4 million within our consolidated balance sheet, an increase of $67.5 million from December 31, 2013 as a result of the inability to record an income tax benefit related to the current year losses. We have determined that it is necessary to continue to record this valuation allowance against our net deferred tax assets as of December 31, 2014. The effective tax provision for the current year was approximately $3.7 million, resulting primarily from discrete
68
Table of Contents
items for the recent closure of a federal tax audit for the years 2008 through 2012. We will continue to evaluate our valuation allowance in future periods for any change in circumstances that may cause a change in judgment about the realizability of the deferred tax assets, but expect to continue to record a valuation allowance against our deferred tax assets at least through 2015.
Loss from Discontinued Operations
The results of operations for campuses that have ceased operations, are held for sale or institutions that were sold, and are considered distinct operations as defined under FASB ASC Topic 205 – Presentation of Financial Statements, are presented within discontinued operations. During the current year, we completed the teach-out of 20 Transitional Group campuses and one CTU campus as well as sold two campuses (one previously reported in the Career Colleges segment and one previously reported in the Transitional Group segment). As a result, all current and prior periods reflect the sold and fully taught out campuses as components of discontinued operations. See Note 4 “Discontinued Operations” to our consolidated financial statements for further discussion.
Asset Held For Sale
During the fourth quarter of 2014, our Board of Directors approved a plan to sell our 16 Culinary Arts campuses (“LCB”). Our decision to pursue the divestiture of LCB was the result of an ongoing portfolio review undertaken to evaluate the strategic direction of the Company. As a result of the decision to sell LCB, the results of operations for the entities to be sold are classified within loss from discontinued operations as of December 31, 2014. Prior period results have been recast on a comparable basis.
Revenue, loss from discontinued operations, new student enrollments and total student enrollments for our LCB asset held for sale during the years ended December 31, 2014, 2013 and 2012 was as follows (dollars in thousands):
| For the Year Ended December 31, | ||||||||||||||||||||
| 2014 | 2013 | 2012 | 2014 vs 2013 % Change |
2013 vs 2012 % Change |
||||||||||||||||
| Asset Held For Sale: |
||||||||||||||||||||
| Revenue |
$ | 172,606 | $ | 177,549 | $ | 224,842 | -2.8 | % | -21.0 | % | ||||||||||
| Loss from discontinued operations |
$ | (66,322 | ) | $ | (81,242 | ) | $ | (33,865 | ) | -18.4 | % | 139.9 | % | |||||||
| New student enrollments |
9,350 | 10,730 | 12,300 | -12.9 | % | -12.8 | % | |||||||||||||
| Total student enrollments |
8,800 | 7,900 | 8,500 | 11.4 | % | -7.1 | % | |||||||||||||
Current year revenue for our assets held for sale declined by $4.9 million or 2.8% as compared to the prior year primarily due to a $2.9 million decrease in revenue for an adjustment related to revenue recognition for students who withdraw from one of our institutions prior to completion of their program. This decline in revenue was partially offset with a $2.4 million decrease in bad debt expense for the amount we previously had deemed uncollectable related to the revenue earnings for these students. The decrease in revenue was partially offset with increased revenue related to the reintroduction of the Associates degree program, which began to positively impact the prior year revenue comparison in the latter half of 2014. Total student enrollments were positively impacted by the reintroduction of this program beginning in late 2012 due to the demand from students and employers. This program has a greater lead time between a prospective applicant to a new student enrollment as compared to the Certificate program due to the longer length of the program impacting a student’s likelihood to start.
Current year loss from discontinued operations for our assets held for sale decreased $14.9 million or 18.4% as compared to the prior year. The decrease in operating loss is primarily a result of decreases in administrative expense and bad debt expense. Administrative expenses decreased primarily due to approximately $10.5 million of decreased legal settlements in the current year as compared to the prior year. Bad debt expense decreased as a result of a decreased number of student payment plans for students attending the LCB campuses. These decreases were partially offset with increased asset impairment charges. The current year included $19.2 million of asset and trade name impairment charges as compared to $13.0 million in the prior year.
69
Table of Contents
Year Ended December 31, 2013 as Compared to the Year Ended December 31, 2012
Revenue
Total revenue decreased from 2012 in all our segments due to a decline in new student applicants which resulted in our new student enrollments being 17.9% lower than 2012. Excluding the impact of the Transitional Group, whose revenues were down $47.1 million as compared to 2012, we had approximately 15.4% fewer new student enrollments for 2013 as compared to 2012. In addition, our institutions implemented certain operational changes during 2013 that had, in the short-term, negatively impacted our new student enrollments, including certain programs which we had established to enable students to assess their readiness to commit to enrolling in college-level courses.
Educational Services and Facilities Expense
The decrease in educational services and facilities expense as compared to 2012 is primarily driven by lower academic costs, most notably faculty and bookstore costs. The decrease in faculty and bookstore costs is caused by a combination of factors, including lower student enrollment across all of our institutions, our initiative to implement self-published textbooks and procurement renegotiations for books and supplies. As a percentage of revenue, educational services and facilities expense increased slightly as compared to 2012 primarily due to fixed costs, most notably occupancy costs.
General and Administrative Expense
General and administrative expenses had decreased as compared to 2012 mainly due to lower admissions and advertising expenses. Admissions costs had decreased primarily in salary and related expenses due to headcount reductions made in response to decreasing enrollments as well as the Transitional Group no longer enrolling new students. The lower advertising expense is substantially related to the Transitional Group segment which was partially offset with increased advertising spending within our Career Colleges segments in certain marketing channels to generate additional new student lead volume.
Administrative expense was negatively impacted by $11.8 million for 2013 related to the settlement of legal matters, recorded primarily within Career Colleges. 2012 administrative expense included a $19.0 million insurance recovery recorded within Corporate and Other related to the settlement of claims under certain insurance policies.
Goodwill and Asset Impairment
During 2013 the following impairment charges were recorded: asset impairment charges of approximately $7.0 million to reflect long lived assets at their fair value as of December 31, 2013 and a $1.7 million trade name impairment charge was recorded for Sanford-Brown. During 2012, we recorded $86.6 million of goodwill and asset impairment charges, which consisted primarily of $49.5 million and $25.1 million of goodwill impairment charges recorded within our Career Colleges and Transitional Group, respectively, $6.5 million of asset impairment charges related to our campus closure actions recorded within the Transitional Group, and trade name impairments of $3.5 million and $1.0 million, recorded within Career Colleges and the Transitional Group, respectively.
Operating Loss
The $80.8 million operating loss for 2013 resulted principally from the decline in revenues across all of our segments being partially offset by lower operating expenses. Initiatives to align expenses with the declining student enrollment, changes in marketing strategies and implementation of efficiencies in our support functions continued to partially offset the impact of declining revenues and deleveraging of the business. In addition, the $11.8 million of expenses related to legal settlements and $8.7 million of trade name and asset impairment
70
Table of Contents
charges negatively impacted our 2013 operating results. The 2012 operating loss of $69.7 million included $86.6 million of goodwill and asset impairment charges partially offset with an insurance recovery of $19.0 million related to the settlement of claims under certain insurance policies.
Provision for (Benefit from) for Income Taxes
Our consolidated effective income tax rate for continuing operations was 34.4% for the year ended December 31, 2013, as compared to -5.7% for the year ended December 31, 2012. The current year tax provision includes $80.5 million of valuation allowance charges which decreased our negative effective tax rate by approximately 86.2% for the year ended December 31, 2013. The current year effective tax rate also benefited from the settlement of various state income tax audits and the reversal of one of our foreign operations as a disregarded entity which increased the effective tax rate by 13.2%.
Loss from Discontinued Operations
The results of operations for campuses that have ceased operations or institutions that were sold, and are considered distinct operations as defined under FASB ASC Topic 205 – Presentation of Financial Statements, are presented within discontinued operations. During 2013, we completed the sale and transfer of control of our International Segment and recorded a pretax gain on sale of $130.1 million. The income tax expense associated with the gain approximated $87.9 million. Our LCB asset held for sale campuses were negatively impacted by $15.5 million of legal settlement charges and $13.0 million of trade name impairment charges during 2013 and $8.1 million of trade name impairment charges during 2012.
SEGMENT RESULTS OF OPERATIONS
Management assesses results of operations for ongoing operations, which excludes the Transitional Group, separately from the Transitional Group. As a result, management’s long-term operational strategies and initiatives are primarily focused on ongoing operations.
71
Table of Contents
The following tables present segment results for the reported periods (dollars in thousands). Results for the prior years have been reclassified to be comparable to the current year presentation.
| For the Year Ended December 31, | ||||||||||||||||||||
| 2014 | 2013 | 2012 | 2014 vs 2013 % Change |
2013 vs 2012 % Change |
||||||||||||||||
| REVENUE: |
||||||||||||||||||||
| CTU |
$ | 336,573 | $ | 346,086 | $ | 360,369 | -2.7 | % | -4.0 | % | ||||||||||
| AIU |
198,896 | 231,606 | 304,208 | -14.1 | % | -23.9 | % | |||||||||||||
|
|
|
|
|
|
|
|||||||||||||||
| Total University Group |
535,469 | 577,692 | 664,577 | -7.3 | % | -13.1 | % | |||||||||||||
|
|
|
|
|
|
|
|||||||||||||||
| Career Colleges |
172,833 | 196,990 | 243,186 | -12.3 | % | -19.0 | % | |||||||||||||
| Corporate and Other |
230 | — | 55 | NM | NM | |||||||||||||||
|
|
|
|
|
|
|
|||||||||||||||
| Subtotal |
708,532 | 774,682 | 907,818 | -8.5 | % | -14.7 | % | |||||||||||||
| Transitional Group |
32,826 | 64,999 | 112,085 | -49.5 | % | -42.0 | % | |||||||||||||
|
|
|
|
|
|
|
|||||||||||||||
| Total |
$ | 741,358 | $ | 839,681 | $ | 1,019,903 | -11.7 | % | -17.7 | % | ||||||||||
|
|
|
|
|
|
|
|||||||||||||||
| OPERATING (LOSS) INCOME: |
|
|||||||||||||||||||
| CTU |
$ | 69,492 | $ | 65,078 | $ | 56,155 | 6.8 | % | 15.9 | % | ||||||||||
| AIU |
(9,412 | ) | (5,556 | ) | 20,896 | -69.4 | % | -126.6 | % | |||||||||||
|
|
|
|
|
|
|
|||||||||||||||
| Total University Group |
60,080 | 59,522 | 77,051 | 0.9 | % | -22.7 | % | |||||||||||||
|
|
|
|
|
|
|
|||||||||||||||
| Career Colleges |
(73,753 | ) | (68,652 | ) | (84,663 | ) | -7.4 | % | 18.9 | % | ||||||||||
| Corporate and Other |
(21,169 | ) | (33,600 | ) | (7,699 | ) | 37.0 | % | NM | |||||||||||
|
|
|
|
|
|
|
|||||||||||||||
| Subtotal |
(34,842 | ) | (42,730 | ) | (15,311 | ) | 18.5 | % | -179.1 | % | ||||||||||
| Transitional Group |
(37,874 | ) | (38,111 | ) | (54,379 | ) | 0.6 | % | 29.9 | % | ||||||||||
|
|
|
|
|
|
|
|||||||||||||||
| Total |
$ | (72,716 | ) | $ | (80,841 | ) | $ | (69,690 | ) | 10.1 | % | -16.0 | % | |||||||
|
|
|
|
|
|
|
|||||||||||||||
| OPERATING (LOSS) MARGIN: |
||||||||||||||||||||
| CTU |
20.6 | % | 18.8 | % | 15.6 | % | ||||||||||||||
| AIU |
-4.7 | % | -2.4 | % | 6.9 | % | ||||||||||||||
| Total University Group |
11.2 | % | 10.3 | % | 11.6 | % | ||||||||||||||
| Career Colleges |
-42.7 | % | -34.9 | % | -34.8 | % | ||||||||||||||
| Corporate and Other |
NM | NM | NM | |||||||||||||||||
| Subtotal |
-4.9 | % | -5.5 | % | -1.7 | % | ||||||||||||||
| Transitional Group |
-115.4 | % | -58.6 | % | -48.5 | % | ||||||||||||||
| Total |
-9.8 | % | -9.6 | % | -6.8 | % | ||||||||||||||
| As of December 31, | ||||||||||||||||||||
| % Change | ||||||||||||||||||||
| 2014 | 2013 | 2012 | 2014 vs. 2013 |
2013 vs. 2012 |
||||||||||||||||
| TOTAL STUDENT ENROLLMENTS: |
||||||||||||||||||||
| CTU |
20,400 | 20,800 | 21,500 | -1.9 | % | -3.3 | % | |||||||||||||
| AIU |
11,600 | 11,600 | 14,200 | 0.0 | % | -18.3 | % | |||||||||||||
|
|
|
|
|
|
|
|||||||||||||||
| Total University Group |
32,000 | 32,400 | 35,700 | -1.2 | % | -9.2 | % | |||||||||||||
|
|
|
|
|
|
|
|||||||||||||||
| Career Colleges |
8,500 | 10,000 | 10,900 | -15.0 | % | -8.3 | % | |||||||||||||
|
|
|
|
|
|
|
|||||||||||||||
| Subtotal |
40,500 | 42,400 | 46,600 | -4.5 | % | -9.0 | % | |||||||||||||
| Transitional Group |
900 | 2,600 | 4,600 | -65.4 | % | -43.5 | % | |||||||||||||
|
|
|
|
|
|
|
|||||||||||||||
| Total |
41,400 | 45,000 | 51,200 | -8.0 | % | -12.1 | % | |||||||||||||
|
|
|
|
|
|
|
|||||||||||||||
72
Table of Contents
| For the Year Ended December 31, | ||||||||||||||||||||
| % Change | ||||||||||||||||||||
| 2014 | 2013 | 2012 | 2014 vs. 2013 |
2013 vs. 2012 |
||||||||||||||||
| NEW STUDENT ENROLLMENTS: |
||||||||||||||||||||
| CTU (1) |
21,230 | 18,970 | 21,660 | 11.9 | % | -12.4 | % | |||||||||||||
| AIU (1) |
14,580 | 12,120 | 16,760 | 20.3 | % | -27.7 | % | |||||||||||||
|
|
|
|
|
|
|
|||||||||||||||
| Total University Group |
35,810 | 31,090 | 38,420 | 15.2 | % | -19.1 | % | |||||||||||||
|
|
|
|
|
|
|
|||||||||||||||
| Career Colleges |
8,650 | 9,640 | 9,720 | -10.3 | % | -0.8 | % | |||||||||||||
|
|
|
|
|
|
|
|||||||||||||||
| Subtotal |
44,460 | 40,730 | 48,140 | 9.2 | % | -15.4 | % | |||||||||||||
| Transitional Group (2) |
450 | 1,610 | 3,400 | -72.0 | % | -52.6 | % | |||||||||||||
|
|
|
|
|
|
|
|||||||||||||||
| Total |
44,910 | 42,340 | 51,540 | 6.1 | % | -17.9 | % | |||||||||||||
|
|
|
|
|
|
|
|||||||||||||||
| (1) | The increase in new student enrollments for 2014 as compared to 2013 was driven by both underlying positive performance trends and the implementation of a new student orientation process in the first quarter of 2014, which replaced our previously provided student readiness programs; this change impacts the way we calculate new student enrollments. This internal policy change had a positive impact on 2014 new student enrollments as compared to 2013. |
| (2) | Campuses within the Transitional Group segment no longer enroll new students upon teach out announcement date; students who re-enter after 365 days are reported as new student enrollments. |
Year Ended December 31, 2014 as Compared to the Year Ended December 31, 2013
University Group. Current year revenue decreased approximately 7.3% due to lower total average student enrollments during the current year as compared to the prior year periods as well as a $6.9 million decrease in revenue for a change related to revenue recognition for students who withdraw from one of our institutions prior to completion of their program. The rate of decline in revenue as compared to the prior year has been steadily decreasing as new student enrollments have increased approximately 15.2% as compared to the prior year. Current year revenue for our CTU segment was positively impacted by an increase in revenue per student due to an increase in the average credit load, which was more than offset with the decrease in average total student enrollment as compared to the prior year. For both our University segments, an increase in new student enrollments for the current year is driven by both the change in methodology referred to above and increased applications in the current year. We continued to see positive trends in overall total student enrollments as we progressed through the year as a result of operational changes made to our admissions processes.
Current year operating income for the CTU segment increased $4.4 million or 6.8% as compared to the prior year. The decrease in revenue for the current year was more than offset with reductions in operating expenses, particularly within advertising and occupancy expenses, and thus drove operating margin improvement for the CTU segment. Advertising expenses at CTU were lower as compared to the prior year period due to increased efficiency within certain marketing channels.
Current year operating loss for the AIU segment increased $3.9 million as compared to the prior year. AIU’s decline in revenue as compared to the prior year was only partially offset with decreases across most operating expense categories, including admissions, academics and occupancy expenses. The decrease in admissions expense within AIU resulted from enhancements made to streamline the admissions processes.
Within both University segments, occupancy expenses have benefitted from a favorable lease buyout at a shared location. Academic expenses for both segments are favorable as compared to the prior year period primarily due to our continued focus on driving operational efficiencies and the lower total student enrollments through the current year to date.
73
Table of Contents
Career Colleges. Current year revenue decreased 12.3% as compared to the prior year. The decline in revenue was primarily a result of declines in both total and new student enrollments during the current year period as compared to the prior year. Career Colleges was impacted by the brand consolidation of our Sanford-Brown name which resulted in market disruptions and lowered student application volume for those campuses. In addition, weather-related closures at certain campuses during the first quarter of 2014 negatively impacted new student enrollments.
The current year operating loss for the Career Colleges segment increased $5.1 million or 7.4% as compared to the prior year. Increased impairment charges of $12.0 million were offset by decreases within most operating expense categories, including administrative, academics and advertising expenses. Administrative expenses in the prior year were negatively impacted by an $8.8 million legal settlement. Academic expenses decreased as compared to the prior year primarily due to our restructuring and re-engineering initiatives carried out to better align our cost structure with current total student enrollment. Advertising expenses decreased as compared to the prior year period as a result of a change in marketing strategy to increase focus on local markets to better accommodate for differences in our campuses and markets.
Transitional Group. This segment includes our campuses that are currently being taught-out. The current year decline in revenue as compared to the prior year resulted from a decrease in total student enrollments at the beginning of the year and campuses no longer enrolling new students once a teach-out is announced. We expect revenue to continue to decline compared to prior periods as campuses continue to wind down their operations.
The operating loss within the Transitional Group remained relatively flat for the current year as compared to the prior year. Decreases across most expense categories as a result of the wind down of operations was offset with an increase in occupancy costs as a result of early termination agreements signed during the current year. As we continue to wind down programs within our Transitional Group, certain fixed overhead expenses related to academics and administration will be able to be removed from the business.
Corporate and Other. This category includes unallocated costs that are incurred on behalf of the entire company. Corporate and Other costs decreased $12.4 million as compared to the prior year. The current year benefitted from an $8.6 million insurance recovery. Additionally, the prior year to date included increased compensation costs related to changes in executive leadership and outside services expenses related to the reorganization efforts across our campus and corporate functions. The current year costs include legal settlement expense of approximately $3.4 million.
Year Ended December 31, 2013 as Compared to the Year Ended December 31, 2012
University Group. 2013 revenue decreased approximately 13.1% as both AIU and CTU experienced declines in revenue as compared to 2012. Lower student enrollment at the beginning of the year, coupled with lower new student enrollments during 2013, partially resulting from certain programs which we had established to enable students to assess their readiness to commit to enrolling in college-level courses and certain operational execution issues related to student intake and orientation that negatively impacted the rate at which students are converted from prospective applicants to new student enrollments, contributed to this decline.
The changes in operating income (loss) are driven by the declines in revenue, which were only partially offset by decreases in operating expenses for AIU. Within CTU, operating margin increased 320 basis points for 2013 as compared to 2012. Most expense categories for both CTU and AIU were lower when compared to 2012 as cost reduction efforts were implemented in response to the continued decline in total student enrollments. For AIU, legal fees expense increased as compared to 2012 due to ongoing litigation. Bad debt expense increased as compared 2012 due to an increased amount of in-school payment plans within both segments, resulting from an overall reduction in Pell grants available to students as a result of change in eligibility requirements. Additionally, we recorded $3.8 million during 2013 within the University Group as a result of decisions to vacate space and optimize our real estate footprint, and $1.3 million of expense within CTU related to the probable reimbursement of funds to the U.S. Department of Veteran Affairs.
74
Table of Contents
Career Colleges. 2013 revenue decreased approximately 19.0% as compared to 2012, primarily due to lower total student enrollments at the beginning of the year and lower new student enrollments during the first half of 2013. Although applications were higher in 2013 as compared to 2012, new student enrollments were relatively flat to 2012 due, in part, we believe to the economic conditions and the impact of our student readiness program and certain operational inefficiencies affecting the rate at which we convert prospective students to new student enrollments. New student enrollments showed positive growth during the second half of 2013 as compared to the second half of 2012 due to increased applications and an overall increase in the rate at which we convert prospective students to a new student enrollment.
The 2013 operating loss decreased $16.0 million or 18.9% as compared to 2012. 2013 goodwill and asset impairment charges decreased $48.2 million as compared to 2012. Excluding goodwill and asset impairment charges, the operating loss would have increased $32.2 million as the decline in revenue was only partially offset with declines in operating expenses. Certain expense categories decreased as compared to 2012, including academics and admissions as a result of our restructuring and re-engineering initiatives carried out to better align with current total student enrollments.
Transitional Group. This segment includes our institutions that are currently being taught out. See the “Campus Locations” table within Item 1, “Business,” for a listing of campuses. The decline in revenue as compared to 2012 is primarily a result of the decrease in total student enrollments at the beginning of the year and campuses no longer enrolling new students. We expect revenue to continue to decline as compared to prior periods as campuses continue to wind down their operations.
Operating losses are reported for both 2013 and 2012 as the lower revenue exceeds reductions in operating expenses. In addition, 2013 asset impairment charges decreased by approximately $29.5 million as compared to 2012.
Corporate and Other. This category includes unallocated costs that are incurred on behalf of the entire company. Corporate and Other costs increased $25.9 million for 2013 as compared to 2012 primarily due to a $19.0 million insurance recovery recorded in 2012 related to the settlement of claims under certain insurance policies and additional 2013 expenses related to the change in leadership, outside services expense associated with our continuing efforts to reorganize our campus and corporate functions to better align with the current total student enrollment, as well as higher insurance costs.
SUMMARY OF CRITICAL ACCOUNTING POLICIES AND ESTIMATES
We have identified the accounting policies and estimates listed below as those that we believe require management’s most subjective and complex judgments in estimating the effect of inherent uncertainties. This section should be read in conjunction with Note 2 “Summary of Significant Accounting Policies” to our consolidated financial statements which includes a discussion of these and other significant accounting policies.
Revenue Recognition
Our revenue, which is derived primarily from academic programs taught to students who attend our institutions, is generally segregated into two categories: (1) tuition and registration fees and (2) other. Tuition and registration fees represent costs to our students for educational services provided by our institutions. For certain institutions, we bill students a one-time registration fee at the beginning of their program and recognize the registration fee revenue on a straight-line basis over that program period, which includes any applicable externship period. Our institutions charge tuition at varying amounts, depending on the institution, the type of program and specific curriculum. A majority of our institutions bill students a single charge that covers tuition and required program materials, such as textbooks and supplies, which we treat as a single accounting unit. Generally, we bill student tuition fees, including those treated as a single accounting unit, at the beginning of each academic period, and recognize the tuition fees as revenue on a straight-line basis over either the academic
75
Table of Contents
term or program period, which includes any applicable externship period. The tuition fees earnings method is determined by the type of program a student is enrolled in. Typically, institutions that offer our culinary arts and our health programs earn tuition fees over the entire program while the remainder of our institutions earns tuition fees over each academic term. The portion of tuition and registration fee payments received from students but not yet earned is recorded as deferred tuition revenue and reported as a current liability on our consolidated balance sheets, as we expect to earn these revenues within the next year. Deferred tuition revenue is stated net of outstanding student receivables on a student-by-student basis as of the end of the reporting period.
If a student withdraws from one of our schools prior to the completion of the academic term or program period, we refund the portion of tuition and registration fees already paid that, pursuant to our refund policy and applicable federal and state law and accrediting agency standards, we are not entitled to retain. Generally, the amount to be refunded to a student is calculated based upon the period of time the student has attended classes and the amount of tuition and registration fees paid by the student as of their withdrawal date. These refunds typically reduce deferred tuition revenue and cash on our consolidated balance sheets as we generally do not recognize tuition revenue in our consolidated statements of loss and comprehensive loss until the related refund provisions have lapsed. Based on the application of our refund policies, we may be entitled to incremental revenue on the day the student withdraws from one of our schools. Prior to fiscal 2014, we recorded this incremental revenue, any related student receivable and any estimate of the amount we did not expect to collect as bad debt expense during the quarter a student withdrew based on our analysis of the collectability on an aggregate student portfolio basis, for which we had significant historical experience. Beginning in fiscal 2014, we record revenue for students who withdraw when payment is received (i.e., on a cash basis) because collectability on a student by student basis is difficult to ascertain. This change had the effect of reducing net revenues by $9.4 million and bad debt expense by $7.5 million, which resulted in an increase to the loss from continuing operations of $1.9 million for the year ended December 31, 2014. Additionally, this change reduced net student receivables from continuing operations by $1.9 million. This adjustment was recorded in the fourth quarter of 2014; prior year amounts were not restated because the effects were not material.
Allowance for Doubtful Accounts
We extend unsecured credit to a portion of the students who are enrolled at our institutions for tuition and certain other educational costs. Based upon past experience and judgment, we establish an allowance for doubtful accounts with respect to student receivables which we estimate will ultimately not be collectible. As such, our results from operations only reflect the amount of revenue that is estimated to be reasonably collectible. Our standard allowance estimation methodology considers a number of factors that, based on our collections experience, we believe have an impact on our credit risk and the realizability of our student receivables. Among these factors are a student’s status (in-school or out-of-school), anticipated funding source (third party, internal short-term and extended payment plans), whether or not an out-of-school student has completed his or her program of study, and our overall collections history.
We monitor our collections and write-off experience to assess whether or not adjustments to our allowance percentage estimates are necessary. Changes in trends in any of the factors that we believe impact the realizability of our student receivables, as noted above, or modifications to our credit standards, collection practices, and other related policies may impact our estimate of our allowance for doubtful accounts and our results from operations. Additionally, we monitor certain internal and external factors, including changes in our academic programs, as well as changes in the current economic, legislative and regulatory environments.
A one percentage point change in our allowance for doubtful accounts as a percentage of gross earned student receivables from continuing operations as of December 31, 2014 would have resulted in a change in pretax loss from continuing operations of $0.4 million during the year then ended.
Because a substantial portion of our revenue is derived from Title IV Programs, any legislative or regulatory action that significantly reduces the funding available under Title IV Programs, or the ability of our students or
76
Table of Contents
institutions to participate in Title IV Programs, would likely have a material adverse effect on our business, results of operations, cash flows, and financial condition, including the realizability of our receivables.
Goodwill and Indefinite-Lived Intangible Assets
Goodwill represents the excess of cost over fair market value of identifiable net assets acquired through business purchases. In accordance with FASB ASC Topic 350 – Intangibles-Goodwill and Other, we review goodwill for impairment on at least an annual basis by applying a fair-value-based test. In evaluating the recoverability of the carrying value of goodwill, we must make assumptions regarding the fair value of our reporting units, as defined under FASB ASC Topic 350. Goodwill is evaluated using a two-step impairment test at the reporting unit level. A reporting unit can be a strategic business unit or business within a strategic business unit. The first step compares the book value of a reporting unit, including goodwill, with its fair value, as determined by a combination of income and market approach valuation methodologies. If the book value of a reporting unit exceeds its fair value, we complete the second step to determine the amount of goodwill impairment loss that we should record. In the second step, we determine an implied fair value of the reporting unit’s goodwill by allocating the fair value of the reporting unit to all of the assets and liabilities other than goodwill (including any unrecognized intangible assets). The amount of impairment loss is equal to the excess of the book value of the goodwill over the implied fair value of goodwill.
In performing our annual review of goodwill balances for impairment, we estimate the fair value of each of our reporting units based on projected future operating results and cash flows, market assumptions and/or comparative market multiple methods. Determining fair value requires significant estimates and assumptions based on an evaluation of a number of factors, such as marketplace participants, relative market share, new student interest, student retention, future expansion or contraction expectations, amount and timing of future cash flows and the discount rate applied to the cash flows. Projected future operating results and cash flows used for valuation purposes do reflect improvements relative to recent historical periods with respect to, among other things, revenue growth and operating margins. Although we believe our projected future operating results and cash flows and related estimates regarding fair values are based on reasonable assumptions, historically projected operating results and cash flows have not always been achieved. The failure of one of our reporting units to achieve projected operating results and cash flows in the near term or long term may reduce the estimated fair value of the reporting unit below its carrying value and result in the recognition of a goodwill impairment charge. Significant management judgment is necessary to evaluate the impact of operating and macroeconomic changes and to estimate future cash flows. Assumptions used in our impairment evaluations, such as forecasted growth rates and our cost of capital, are based on the best available market information and are consistent with our internal forecasts and operating plans. In addition to cash flow estimates, our valuations are sensitive to the rate used to discount cash flows and future growth assumptions. These assumptions could be adversely impacted by certain of the risks discussed in “Risk Factors” in Item 1A.
Intangible assets include both indefinite and definite-lived assets. Indefinite-lived assets include our trade names and accreditation rights, which are recorded at fair market value upon acquisition and subsequently reviewed on an annual basis for impairment. Accreditation rights represent the ability of our institutions to participate in Title IV Programs.
Our definite-lived assets include courseware, which represents the value of acquired curriculum, including lesson plans and syllabi, used to deliver educational services. Acquired courseware balances are amortized on a straight-line basis over their useful lives, which are estimated by management based upon, among other things, the expected future utilization period and the nature of the related academic programs. Other definite-lived intangible assets represent ownership related to renewable internet domain names and are amortized on a straight-line basis over the applicable renewal periods.
We did not record any goodwill impairment charges during the year ended December 31, 2014. The reporting units with remaining goodwill as of December 31, 2014 are CTU and AIU which together had $87.4
77
Table of Contents
million of goodwill remaining. The fair values of our AIU and CTU reporting units exceeded their carrying values by $7.0 million and $177.4 million, (fair value as a percentage of carrying value for these reporting units of 119% and 438%) respectively, and thus, did not indicate a significant risk of goodwill impairment based on current projections and valuations.
During the year ended December 31, 2014, we recorded $2.2 million of trade name impairment charges for our Sanford-Brown trade name. As of December 31, 2014, the fair value of the Sanford-Brown trade name is $1.7 million. The decline in fair value for this trade name was primarily a result of the overall decline in new student interest due to economic conditions, negative publicity regarding the industry and a decrease in market demand for certain areas of focus. These factors are expected to negatively impact our future operating results and, as a result, the fair value calculation for this trade name declined below its respective carrying value. We calculated the fair value of our trade name in accordance with FASB ASC Topic 820 – Fair Value Measurement, by utilizing the relief from royalty method under the income approach. The assumptions utilized in determining the fair value of the Sanford-Brown trade name include utilizing projected revenue growth rates, a discount rate of approximately 25%, a royalty rate of 0.5%, and a terminal growth rate of approximately 2%. Due to the inherent uncertainty involved in deriving those estimates, actual results could differ from those estimates. We evaluate the merits of each significant assumption used, both individually and in the aggregate, to determine the fair value of our trade names for reasonableness. Although we believe our projected future operating results and cash flows and related estimates regarding fair values are based on reasonable assumptions, historically projected operating results and cash flows have not always been achieved. However, for sensitivity purposes, and with all other inputs remaining equal, a 100 basis point change in the discount rate utilized in the calculation would result in a change in the fair value of approximately $0.1 million. We continue to monitor the operating results and revenue projections related to our trade names on a quarterly basis for signs of possible further declines in estimated fair value and trade name impairment.
See Note 9 “Goodwill and Other Intangible Assets” to our consolidated financial statements for further discussion.
Impairment of Long-Lived Assets
We review property and equipment, definite-lived intangible assets, and other long-lived assets for impairment on an annual basis or whenever adverse events or changes in circumstances indicate that the carrying amounts of such assets may not be recoverable. If such adverse events or changes in circumstances occur, we will recognize an impairment loss if the undiscounted future cash flows expected to be generated by the assets are less than the carrying value of the related assets. The impairment loss would reduce the carrying value of the assets to their estimated fair value.
In evaluating the recoverability of long-lived assets, we must make assumptions regarding estimated future cash flows and other factors to determine the estimated fair value of such assets. If our fair value estimates or related assumptions change in the future, we may be required to record impairment charges related to long-lived assets and definite-lived intangible assets. See Note 7 “Property and Equipment” to our consolidated financial statements for further discussion of long-lived asset impairment considerations and related charges.
Contingencies
During the ordinary course of business, we are subject to various claims and contingencies. In accordance with FASB ASC Topic 450 – Contingencies, when we become aware of a claim or potential claim, we assess the likelihood of any related loss or exposure. The probability of whether an asset has been impaired or a liability has been incurred, and whether the amount of loss can be reasonably estimated, is analyzed, and if the loss contingency is both probable and reasonably estimable, then we accrue for costs, including direct costs incurred, associated with the loss contingency. If no accrual is made but the loss contingency is reasonably possible, we disclose the nature of the contingency and the related estimate of possible loss or range of loss if such an estimate
78
Table of Contents
can be made. For all matters that are currently being reviewed, we expense legal fees, including defense costs, as they are incurred. Loss contingencies include, but are not limited to, possible losses related to legal proceedings and regulatory compliance matters, and our assessment of exposure requires subjective and judgmental assessment. Liabilities established to provide for contingencies are adjusted as further information develops, circumstances change, or contingencies are resolved. See Note 12 “Contingencies” to our consolidated financial statements for additional information.
Income Taxes
We are subject to the income tax laws of the U.S. and various state, local and foreign jurisdictions. These tax laws are complex and subject to interpretation. As a result, significant judgments and interpretations are required in determining our income tax (benefits) provisions and evaluating our uncertain tax positions.
We account for income taxes in accordance with FASB ASC Topic 740 – Income Taxes. Topic 740 requires the recognition of deferred income tax assets and liabilities based upon the income tax consequences of temporary differences between financial reporting and income tax reporting by applying enacted statutory income tax rates applicable to future years to differences between the financial statement carrying amounts and the income tax basis of existing assets and liabilities. Topic 740 also requires that deferred income tax assets be reduced by a valuation allowance if it is more likely than not that some portion of the deferred income tax asset will not be realized.
In assessing the need for a valuation allowance, we consider both positive and negative evidence related to the likelihood of realization of the deferred tax assets. Topic 740 provides that important factors in determining whether a deferred tax asset will be realized are whether there has been sufficient taxable income in recent years and whether sufficient taxable income is expected in future years in order to utilize the deferred tax asset. In evaluating the realizability of deferred income tax assets, we consider, among other things, historical levels of taxable income along with possible sources of future taxable income, which include: the expected timing of the reversals of existing temporary reporting differences, the existence of taxable income in prior carryback year(s), the expected impact of tax planning strategies that may be implemented to prevent the potential loss of future income tax benefits and expected future taxable income. Changes in, among other things, income tax legislation, statutory income tax rates, or future taxable income levels could materially impact our valuation of income tax assets and liabilities and could cause our income tax provision to vary significantly among financial reporting periods. If, based on the weight of available evidence, it is more likely than not the deferred tax assets will not be realized, with placing less weight on projections for future growth as projections for future growth are less objectively verifiable, we record a valuation allowance. The weight given to the positive and negative evidence is commensurate with the extent to which the evidence may be objectively verified. A high degree of judgment is required to determine if, and the extent to which, valuation allowances should be recorded against deferred tax assets. A significant piece of objective negative evidence evaluated is the cumulative loss incurred over the three-year period ended December 31, 2014. Such objective evidence limits the ability to consider other subjective evidence such as our projections for future growth as projections for future growth are less objectively verifiable.
Topic 740 further clarifies the accounting for uncertainty in income taxes recognized in an entity’s financial statements and prescribes a recognition threshold and measurement attribute for the financial statement recognition and measurement of a tax position taken or expected to be taken in an income tax return. Topic 740 also provides guidance on derecognition, classification, interest and penalties, accounting in interim periods, disclosure and transition. See Note 13 “Income Taxes” to our consolidated financial statements for further discussion.
LIQUIDITY, FINANCIAL POSITION, AND CAPITAL RESOURCES
As of December 31, 2014, cash, cash equivalents, restricted cash and short-term investments totaled $239.6 million. Our cash flows from operations have historically been adequate to fulfill our liquidity requirements. We
79
Table of Contents
historically have financed our operating activities, organic growth and acquisitions primarily through cash generated from operations, existing cash balances and credit facility borrowings. The recent declines in operating performance have resulted in an increase in net cash used in operating activities and we expect continued net cash usage in operating activities. However, as we execute on our strategic imperatives, we expect continued improving cash trends in the business driven by continued reductions in cash usage related to our Transitional Group and discontinued operations, improved financial performance from our ongoing operations, reduced real estate obligations and reduced legal costs. We anticipate that we will be able to satisfy the cash requirements associated with, among other things, our working capital needs, capital expenditures and lease commitments through at least the next 12 months primarily with cash generated by operations and existing cash balances.
Restricted cash balances as of December 31, 2014 approximate $22.9 million and are comprised of restricted cash balances to provide collateral for credit facility borrowings and certificates of deposit to provide securitization for letters of credit.
We continue to focus on strategic alternatives which will position CEC for a return to sustainable growth and optimize our capital structure. Our new credit facility allows us to borrow up to a maximum amount of $120 million and is scheduled to mature on June 30, 2016. Amounts borrowed under the Credit Agreement are required to be secured with 100% cash collateral. In addition, we are continuing to assess our real estate footprint, portfolio of assets and other strategic alternatives. The decisions we make will be reached by balancing our short-term needs against our long-term strategies to return to growth.
The discussion above reflects management’s expectations regarding liquidity; however, we are not able to assess the effect of loss contingencies on future cash requirements and liquidity. See Note 12 “Contingencies” to our consolidated financial statements. Further, as a result of the significance of the Title IV Program funds received by our students, we are highly dependent on these funds to operate our business. Any reduction in the level of Title IV funds that our students are eligible to receive or any impact on timing or our ability to receive Title IV Program funds may have a significant impact on our operations and our financial condition. In addition, our financial performance is dependent on the level of student enrollment which could be impacted by external factors. See Item 1A, “Risk Factors.”
In particular, to participate in Title IV Programs, our institutions must either satisfy standards of financial responsibility prescribed by ED, or be subjected to additional oversight, required to post a letter of credit in favor of ED or placed on provisional certification. These regulations require each eligible higher education institution to, among other things, satisfy a quantitative standard of financial responsibility that is a weighted average composite score of three annual tests which assess the financial condition of the institution. If the institution achieves a composite score of at least 1.5, it is considered financially responsible without conditions or additional oversight. See Item 1, “Business – Student Financial Aid and Related Federal Regulation – Compliance with Federal Regulatory Standards and Effect of Federal Regulatory Violations – Financial Responsibility Standards,” for more information regarding ED’s standards of financial responsibility.
ED applies its quantitative financial responsibility tests annually based on an institution’s audited financial statements and may apply the tests to the parent company on a consolidated basis. Recent profitability declines and the write down of the carrying value of non-financial assets, such as deferred tax assets and goodwill, have negatively impacted our financial responsibility composite scores. Our composite score for the consolidated entity for the year ended December 31, 2013 was 1.5, and our preliminary calculation for the year ended December 31, 2014 is 1.5, which are considered financially responsible without conditions or additional oversight. The Company continuously monitors compliance with ED’s standards of financial responsibility. In order to remain financially responsible for 2015 and 2016, as defined by ED, the Company is exploring additional steps which include further cost reductions, investing in new business technologies, long-term borrowing options, acquisitions or divestitures, modifying our capital structure and other organization changes. Additionally, our investment decisions, such as the use of our cash, will be impacted by the course of action we choose.
80
Table of Contents
There can be no assurance that the Company’s actions will result in the Company remaining financially responsible as defined by ED. For example, a failure to successfully implement our plan to sell our Culinary Arts campuses may negatively impact our financial responsibility composite score. We believe that recent developments in the proprietary postsecondary education industry have negatively impacted the availability and cost of capital for companies in the industry, which may impact the course of action we choose and our future compliance with ED’s financial responsibility standards. Further, there is some uncertainty regarding ED’s treatment of certain components of the financial responsibility composite score.
ED has significant discretion in determining the monitoring and reporting procedures applicable to an institution with a composite score below 1.5, the amount of any required letter of credit and the terms of any provisional certification. If in the future we are required to satisfy ED’s standards of financial responsibility on an alternative basis, including potentially by posting irrevocable letters of credit, we may not have the capacity to post these letters of credit.
Sources and Uses of Cash
Operating Cash Flows
During the years ended December 31, 2014 and 2013, net cash flows used in operating activities totaled $118.6 million and $85.8 million, respectively. The increase in the use of our operating cash is driven primarily by the operating loss for the current year, legal settlement payments and payments related to lease buyouts. The operating cash flow usage in the second half of 2014 was less than the first half of 2014 as a result of legal settlement payments during the first half of 2014 and improving business trends in the second half of 2014.
Our primary source of cash flows from operating activities is tuition collected from our students. Our students derive the ability to pay tuition costs through the use of a variety of funding sources, including, among others, federal loan and grant programs, state grant programs, private loans and grants, institution payment plans, private and institutional scholarships and cash payments. For the years ended December 31, 2014, 2013 and 2012, approximately 78%, 78%, and 80%, respectively, of our institutions’ cash receipts from tuition payments came from Title IV Program funding.
For further discussion of Title IV Program funding and alternative private loan funding sources for our students, see Item 1, “Business – Student Financial Aid and Related Federal Regulation.”
Our primary uses of cash to support our operating activities include, among other things, cash paid and benefits provided to our employees for services, to vendors for products and services, to lessors for rents and operating costs related to leased facilities, to suppliers for textbooks and other institution supplies, and to federal, state and local governments for income and other taxes.
Investing Cash Flows
During the year ended December 31, 2014, net cash used in investing activities totaled $107.6 million as compared to net cash provided by investing activities of $166.9 million for the year ended December 31, 2013.
Purchases and Sales of Available-for-Sale Investments. Purchases and sales of available-for-sale investments resulted in a $92.5 million net cash outflow and a $32.2 million net cash inflow during the years ended December 31, 2014 and 2013, respectively.
Capital Expenditures. Capital expenditures decreased to $13.2 million for the year ended December 31, 2014 as compared to $19.6 million for the year ended December 31, 2013. Capital expenditures represented 1.4% and 1.6% of total revenue of continuing and discontinued operations during the years ended December 31, 2014
81
Table of Contents
and 2013, respectively. The decrease in capital expenditures as compared to the prior year is primarily due to elimination of capital expenditures at campuses included in our Transitional Group segment. We expect similar capital expenditures during 2015 as compared to 2014.
Equity Investment. During 2014, we increased our interest in CCKF to 30.7% through a cash payment of $1.6 million made during 2014 and an additional $1.6 million payment which is expected to be paid in 2015. See Note 5 “Investments” to our consolidated financial statements for further discussion.
Financing Cash Flows
During the years ended December 31, 2014 and 2013, net cash flows provided by financing activities totaled $1.0 million and $6.1 million respectively.
Credit Agreement. On October 31, 2014, we entered into a $120.0 million Amended and Restated Credit Agreement with BMO Harris Bank N.A., in its capacities as the initial lender and letter of credit issuer thereunder and the administrative agent for the lenders which from time to time may be parties to the Credit Agreement. The revolving credit facility under the Credit Agreement is scheduled to mature on June 30, 2016 and replaced our previous credit agreement entered in to on December 30, 2013. The Credit Agreement, which includes certain financial covenants, requires that fees and interest are payable monthly and quarterly in arrears, respectively, and principal is payable at maturity. As of December 31, 2014, we borrowed $10.0 million under the Credit Agreement. See Note 11 “Credit Agreement” to our consolidated financial statements for additional information.
Restricted Cash. As of December 31, 2014, we had approximately $22.9 million of restricted cash related to collaterization of borrowings under our Credit Agreement and certificates of deposit to secure outstanding letters of credit. As of December 31, 2013, our restricted cash balances approximated $12.6 million related to securitization of outstanding letters of credit.
82
Table of Contents
Contractual Obligations
As of December 31, 2014, future minimum cash payments due under contractual obligations, for our non-cancelable operating lease arrangements, were as follows (dollars in thousands):
| 2015 | 2016 | 2017 | 2018 | 2019 | 2020 & Thereafter |
Total | ||||||||||||||||||||||
| Gross operating lease obligations (1) |
||||||||||||||||||||||||||||
| Ongoing operations |
$ | 35,159 | $ | 32,227 | $ | 29,705 | $ | 29,698 | $ | 23,595 | $ | 34,095 | $ | 184,479 | ||||||||||||||
| Transitional Group |
12,308 | 8,866 | 7,049 | 6,040 | 4,255 | 1,822 | 40,340 | |||||||||||||||||||||
| Discontinued Operations (excluding Culinary Arts) |
17,828 | 13,915 | 13,000 | 6,734 | 1,438 | 620 | 53,535 | |||||||||||||||||||||
| Discontinued Operations (Culinary Arts) |
22,645 | 22,358 | 16,403 | 15,343 | 11,678 | 10,389 | 98,816 | |||||||||||||||||||||
|
|
|
|
|
|
|
|
|
|
|
|
|
|
|
|||||||||||||||
| Total gross operating lease obligations |
$ | 87,940 | $ | 77,366 | $ | 66,157 | $ | 57,815 | $ | 40,966 | $ | 46,926 | $ | 377,170 | ||||||||||||||
|
|
|
|
|
|
|
|
|
|
|
|
|
|
|
|||||||||||||||
| Sublease income (2) |
||||||||||||||||||||||||||||
| Ongoing operations |
$ | 2,376 | $ | 981 | $ | 796 | $ | 656 | $ | 674 | $ | 691 | $ | 6,174 | ||||||||||||||
| Transitional Group |
— | — | — | — | — | — | — | |||||||||||||||||||||
| Discontinued Operations (excluding Culinary Arts) |
4,351 | 4,261 | 4,190 | 145 | — | — | 12,947 | |||||||||||||||||||||
| Discontinued Operations (Culinary Arts) |
1,851 | 1,955 | 2,016 | 1,810 | 1,147 | 376 | 9,155 | |||||||||||||||||||||
|
|
|
|
|
|
|
|
|
|
|
|
|
|
|
|||||||||||||||
| Total sublease income |
$ | 8,578 | $ | 7,197 | $ | 7,002 | $ | 2,611 | $ | 1,821 | $ | 1,067 | $ | 28,276 | ||||||||||||||
|
|
|
|
|
|
|
|
|
|
|
|
|
|
|
|||||||||||||||
| Net operating lease obligations |
||||||||||||||||||||||||||||
| Ongoing operations |
$ | 32,783 | $ | 31,246 | $ | 28,909 | $ | 29,042 | $ | 22,921 | $ | 33,404 | $ | 178,305 | ||||||||||||||
| Transitional Group |
12,308 | 8,866 | 7,049 | 6,040 | 4,255 | 1,822 | 40,340 | |||||||||||||||||||||
| Discontinued Operations (excluding Culinary Arts) |
13,477 | 9,654 | 8,810 | 6,589 | 1,438 | 620 | 40,588 | |||||||||||||||||||||
| Discontinued Operations (Culinary Arts) |
20,794 | 20,403 | 14,387 | 13,533 | 10,531 | 10,013 | 89,661 | |||||||||||||||||||||
|
|
|
|
|
|
|
|
|
|
|
|
|
|
|
|||||||||||||||
| Total net contractual lease obligations |
$ | 79,362 | $ | 70,169 | $ | 59,155 | $ | 55,204 | $ | 39,145 | $ | 45,859 | $ | 348,894 | ||||||||||||||
|
|
|
|
|
|
|
|
|
|
|
|
|
|
|
|||||||||||||||
| (1) | Amounts exclude certain costs associated with real estate leases, such as expense for common area maintenance (i.e. “CAM”) and taxes, as these amounts are undeterminable at this time and may vary based on future circumstances. |
| (2) | Amounts provided are for executed sublease arrangements. |
Operating Lease Obligations. We lease most of our administrative and educational facilities and equipment under non-cancelable operating leases expiring at various dates through 2023. Lease terms generally range from five to ten years with one to two renewal options for extended terms. The amounts included in the table above represent future minimum lease payments for non-cancelable operating leases for continuing operations and discontinued operations.
Off-Balance Sheet Arrangements. As of December 31, 2014, we were not a party to any off-balance sheet financing or contingent payment arrangements, nor do we have any unconsolidated subsidiaries.
83
Table of Contents
Changes in Financial Position – December 31, 2014 compared to December 31, 2013
Selected consolidated balance sheet account changes from December 31, 2013 to December 31, 2014 were as follows (dollars in thousands):
| As of December 31, | ||||||||||||
| 2014 | 2013 | % Change | ||||||||||
| ASSETS |
||||||||||||
| CURRENT ASSETS: |
||||||||||||
| Total cash and cash equivalents, restricted cash and short-term investments |
$ | 239,628 | $ | 362,624 | -34 | % | ||||||
| Receivables, other, net |
18,925 | 27,198 | -30 | % | ||||||||
| Assets of discontinued operations |
77,319 | 14,219 | 444 | % | ||||||||
| LIABILITIES AND STOCKHOLDERS’ EQUITY |
||||||||||||
| CURRENT LIABILITIES: |
||||||||||||
| Liabilities of discontinued operations |
65,863 | 35,695 | 85 | % | ||||||||
Total cash and cash equivalents, restricted cash and short-term investments: The decrease is primarily driven by the net cash used in operating activities as a result of the current year operating loss, legal settlement payments and payments related to lease buyouts.
Receivables, other, net: The decrease is primarily due to approximately $12.2 million of income tax refunds received during the current year.
Assets and liabilities of discontinued operations: The increase is due to the decision to divest the Culinary Arts segment, which is recorded as an asset-held-for-sale as of December 31, 2014 within current assets and liabilities of discontinued operations due to the intent to sell within one year.
Recent Accounting Pronouncements
See Note 3 “Recent Accounting Pronouncements” to our consolidated financial statements for a discussion of recent accounting pronouncements that may affect us.
84
Table of Contents
| ITEM 7A. | QUANTITATIVE AND QUALITATIVE DISCLOSURES ABOUT MARKET RISK |
We are exposed to financial market risks, including changes in interest rates and foreign currency exchange rates. We use various techniques to manage our market risk, including, from time to time, the use of derivative financial instruments. We do not use derivative financial instruments for speculative purposes.
Our municipal bond investment in auction rate securities (“ARS”) has a stated term to maturity of greater than one year, and as such, we classify our investment in ARS as non-current on our consolidated balance sheets within other assets. Auctions can “fail” when the number of sellers of the security exceeds the buyers for that particular auction period. In the event that an auction fails, the interest rate resets at a rate based on a formula determined by the individual security. The ARS for which auctions have failed continues to accrue interest and is auctioned on a set interval until the auction succeeds, the issuer calls the security, or it matures. As of December 31, 2014, we have determined this investment is at risk for impairment due to the nature of the liquidity of the market over the past year. Cumulative unrealized losses as of December 31, 2014 amount to $0.5 million and are reflected within accumulated other comprehensive loss as a component of stockholders’ equity. We believe this impairment is temporary, as we do not intend to sell the investment and it is unlikely we will be required to sell the investment before recovery of its amortized cost basis.
Interest Rate Exposure
Any outstanding borrowings under our revolving credit facility bear annual interest at fluctuating rates under either the Base Rate Loan or as determined by the London Interbank Offered Rate (LIBOR) for the relevant currency, plus the applicable rate based on the type of loan. As of December 31, 2014, we had borrowings under this agreement of $10.0 million. The weighted average interest rate of borrowings under our credit agreement was 1.67% as of December 31, 2014.
Our financial instruments are recorded at their fair values as of December 31, 2014 and 2013. We believe that the exposure of our consolidated financial position and results of operations and cash flows to adverse changes in interest rates is not significant.
Foreign Currency Exposure
During 2014 we are subject to foreign currency exchange exposures arising from transactions denominated in currencies other than the U.S. dollar, and from the translation of foreign currency balance sheet accounts into U.S. dollar balance sheet accounts, primarily related to our equity investment. Specifically, we are subject to risks associated with fluctuations in the value of the Euro versus the U.S. dollar.
| ITEM 8. | FINANCIAL STATEMENTS AND SUPPLEMENTARY DATA |
The financial information required by Item 8 is contained in Part IV, Item 15 of this Annual Report on Form 10-K.
| ITEM 9. | CHANGES IN AND DISAGREEMENTS WITH ACCOUNTANTS ON ACCOUNTING AND FINANCIAL DISCLOSURE |
None.
85
Table of Contents
| ITEM 9A. | CONTROLS AND PROCEDURES |
Evaluation of Disclosure Controls and Procedures
We completed an evaluation as of the end of the period covered by this Report under the supervision and with the participation of management, including our Chief Executive Officer and Chief Financial Officer, of the effectiveness of the design and operation of our disclosure controls and procedures pursuant to Rule 13a-15(b) of the Securities Exchange Act of 1934, as amended (the “Exchange Act”). Based upon that evaluation, our Chief Executive Officer and Chief Financial Officer concluded that, as of December 31, 2014 our disclosure controls and procedures were effective to provide reasonable assurance that (i) the information required to be disclosed by us in this Report was recorded, processed, summarized, and reported within the time periods specified in the rules and forms provided by the U.S. Securities and Exchange Commission (“SEC”) and (ii) information required to be disclosed by us in our reports that we file or submit under the Exchange Act is accumulated and communicated to our management, including our principal executive and principal financial officers, or persons performing similar functions, as appropriate to allow timely decisions regarding required disclosure.
Changes in Internal Control over Financial Reporting
There were no changes in our internal control over financial reporting that occurred during the quarter ended December 31, 2014, that have materially affected, or are reasonably likely to materially affect, our internal control over financial reporting.
Inherent Limitations on the Effectiveness of Controls
Our management does not expect that our disclosure controls and procedures or our internal controls will prevent or detect all errors and all fraud. A control system, no matter how well conceived and operated, can provide only reasonable, not absolute, assurance that the objectives of the control system are met. Further, the design of a control system must reflect the fact that there are resource constraints, and the benefits of controls must be considered relative to their costs. Because of the inherent limitations in a cost-effective control system, no evaluation of controls can provide absolute assurance that misstatements due to error or fraud will not occur or that all control issues and instances of fraud, if any, within our company have been detected.
These inherent limitations include the realities that judgments in decision-making can be faulty and that breakdowns can occur because of simple error or mistake. Controls can also be circumvented by the individual acts of some persons, by collusion of two or more people, or by management override of the controls. The design of any system of controls is based in part on certain assumptions about the likelihood of future events, and there can be no assurance that any design will succeed in achieving its stated goals under all potential future conditions. Projections of any evaluation of controls effectiveness to future periods are subject to risks. Over time, controls may become inadequate because of changes in conditions or deterioration in the degree of compliance with policies or procedures.
Management’s Report on Internal Control over Financial Reporting
Our management is responsible for establishing and maintaining adequate internal control over financial reporting as defined in Rules 13a-15(f) under the Exchange Act to provide reasonable assurance regarding the reliability of our financial reporting and the preparation of the financial statements for external purposes in accordance with generally accepted accounting principles.
Based upon the evaluation under the framework contained in the 2013 COSO Report, management concluded that, as of December 31, 2014, our internal control over financial reporting was effective.
Ernst & Young LLP, our independent registered public accounting firm, who audited and reported on the consolidated financial statements included in this Annual Report on Form 10-K, has issued an attestation report
86
Table of Contents
on the effectiveness of our internal control over financial reporting. This attestation report is included on page 94 of this Annual Report on Form 10-K.
| ITEM 9B. | OTHER INFORMATION |
None.
87
Table of Contents
PART III
| ITEM 10. | DIRECTORS, EXECUTIVE OFFICERS AND CORPORATE GOVERNANCE |
Below is a list of our Executive Officers and Board of Directors:
| Executive Officers: |
Board of Directors: | |
| Ronald D. McCray Chairman of the Board, Interim President and Chief Executive Officer |
Ronald D. McCray – Chairman of the Board Interim President and Chief Executive Officer of Career Education Corporation, Former Chief Administrative Officer of Nike, Inc. and former chief legal officer of Kimberly-Clark Corporation | |
| Reid E. Simpson |
Thomas B. Lally – Lead Director | |
| Senior Vice President and Chief Financial Officer |
Former President of Heller Equity Capital Corporation | |
| Jeffrey D. Ayers |
Louis E. Caldera | |
| Senior Vice President, General Counsel and Corporate Secretary |
Former President of the University of New Mexico and former Secretary of the Army | |
| Lysa A. Hlavinka Clemens |
Dennis H. Chookaszian | |
| Senior Vice President and Chief Career Schools Officer |
Former Chairman and Chief Executive Officer of CNA Financial Corporation | |
| Jeffrey R. Cooper |
David W. Devonshire | |
| Senior Vice President and Chief Compliance Officer |
Former Executive Vice President and Chief Financial Officer of Motorola, Inc. | |
| Jason T. Friesen |
Patrick W. Gross | |
| Senior Vice President and Chief University Education Officer |
Chairman of the Lovell Group | |
| Diane Auer Jones |
Gregory L. Jackson | |
| Senior Vice President and Chief External Affairs Officer |
Managing Partner, Jackson Park Capital, LLC | |
| Leslie T. Thornton | ||
| Vice President and General Counsel of WGL Holdings, Inc. | ||
The other information required by this item is incorporated herein by reference to our definitive Proxy Statement to be filed in connection with our 2015 Annual Meeting of Stockholders.
| ITEM 11. | EXECUTIVE COMPENSATION |
The information required by this item is incorporated herein by reference to our definitive Proxy Statement to be filed in connection with our 2015 Annual Meeting of Stockholders.
88
Table of Contents
| ITEM 12. | SECURITY OWNERSHIP OF CERTAIN BENEFICIAL OWNERS AND MANAGEMENT AND RELATED STOCKHOLDER MATTERS |
Certain of the information required by this item is incorporated herein by reference to our definitive Proxy Statement to be filed in connection with our 2015 Annual Meeting of Stockholders.
The following table provides information as of December 31, 2014, with respect to shares of our common stock that may be issued under our existing equity compensation plans:
EQUITY COMPENSATION PLAN INFORMATION
| (a) | (b) | (c) | ||||||||||
| Plan Category |
Number of shares to be issued upon exercise of outstanding options |
Weighted-average exercise price of outstanding options |
Number of shares remaining available for future issuances under equity compensation plans (excluding securities reflected in column (a)) |
|||||||||
| Equity compensation plans approved by stockholders |
3,781,964 | (1) | $ | 12.88 | 6,101,036 | (2) | ||||||
|
|
|
|
|
|||||||||
| Total |
3,781,964 | $ | 12.88 | 6,101,036 | ||||||||
|
|
|
|
|
|||||||||
| (1) | Includes outstanding options to purchase shares of our common stock under the Career Education Corporation 1998 Employee Incentive Compensation Plan, 1998 Non-Employee Directors’ Stock Option Plan and 2008 Incentive Compensation Plan (the “2008 Plan”). |
| (2) | Includes shares available for future issuance under the 2008 Plan in addition to the number of shares issuable upon exercise of outstanding options set forth in column (a). In addition to stock options, the 2008 Plan provides for the issuance of stock appreciation rights, restricted stock, deferred stock, dividend equivalents, other stock-based awards, performance awards and units, or cash incentive awards. The amount in column (c) does not reflect 0.7 million shares underlying restricted stock units and deferred stock units outstanding as of December 31, 2014, which upon vesting will be settled in shares of our common stock and thus reduce the common stock available for future share-based awards under the 2008 Plan by the amount vested, multiplied by the applicable factor under the plan. Cash-settled awards are not included in, and do not affect, shares remaining available for future issuances under the 2008 Plan. |
We also entered into individual compensation arrangements in 2013 with Scott Steffey, our former President and Chief Executive Officer, which included the issuance of cash-settled restricted stock units and stock appreciation rights that were not issued under the 2008 Plan. These awards, which were cancelled on February 11, 2015 in connection with Mr. Steffey’s separation from the Company, did not involve the future issuance of shares of common stock and therefore are not included in the table above.
See Note 14 “Share-Based Compensation” to our consolidated financial statements for more information regarding the Company’s share-based compensation.
| ITEM 13. | CERTAIN RELATIONSHIPS AND RELATED TRANSACTIONS, AND DIRECTOR INDEPENDENCE |
The information required by this item is incorporated herein by reference to our definitive Proxy Statement to be filed in connection with our 2015 Annual Meeting of Stockholders.
| ITEM 14. | PRINCIPAL ACCOUNTANT FEES AND SERVICES |
The information required by this item is incorporated herein by reference to our definitive Proxy Statement to be filed in connection with our 2015 Annual Meeting of Stockholders.
89
Table of Contents
PART IV
| ITEM 15. | EXHIBITS AND FINANCIAL STATEMENT SCHEDULES |
| 1. | Financial Statements |
The financial statements listed in the Index to Financial Statements on page 92 are filed as part of this Annual Report.
| 2. | Financial Statement Schedules |
The financial statement schedule listed in the Index to Financial Statements on page 92 is filed as part of this Annual Report.
| 3. | Exhibits |
The exhibits listed in the Index to Exhibits on pages 141 - 144 are filed as part of this Annual Report.
90
Table of Contents
Pursuant to the requirements of Section 13 or 15(d) of the Securities Exchange Act of 1934, the registrant has duly caused this report to be signed on its behalf by the undersigned, thereunto duly authorized, on the 3rd day of March 2015.
| CAREER EDUCATION CORPORATION | ||
| By: |
/s/ REID E. SIMPSON | |
| Reid E. Simpson, | ||
| Senior Vice President and Chief Financial Officer (Principal Financial and Accounting Officer) | ||
Pursuant to the requirements of the Securities Exchange Act of 1934, this report has been signed below by the following persons on behalf of the registrant and in the capacities and on the dates indicated.
| Signature |
Title |
Date | ||
| /s/ RONALD D. McCRAY Ronald D. McCray |
Chairman of the Board and Director, Interim President and Chief Executive Officer (Principal Executive Officer) |
March 3, 2015 | ||
| /s/ REID E. SIMPSON Reid E. Simpson |
Senior Vice President and Chief Financial Officer (Principal Financial and Accounting Officer) |
March 3, 2015 | ||
| /s/ THOMAS B. LALLY Thomas B. Lally |
Lead Director |
March 3, 2015 | ||
| /s/ LOUIS E. CALDERA Louis E. Caldera |
Director |
March 3, 2015 | ||
| /s/ DENNIS H. CHOOKASZIAN Dennis H. Chookaszian |
Director |
March 3, 2015 | ||
| /s/ DAVID W. DEVONSHIRE David W. Devonshire |
Director |
March 3, 2015 | ||
| /s/ PATRICK W. GROSS Patrick W. Gross |
Director |
March 3, 2015 | ||
| /s/ GREGORY L. JACKSON Gregory L. Jackson |
Director |
March 3, 2015 | ||
| /s/ LESLIE T. THORNTON Leslie T. Thornton |
Director |
March 3, 2015 | ||
91
Table of Contents
INDEX TO FINANCIAL STATEMENTS
All other financial statement schedules are omitted because they are not applicable or the required information is shown in the consolidated financial statements or related notes.
92
Table of Contents
REPORT OF INDEPENDENT REGISTERED PUBLIC ACCOUNTING FIRM
The Board of Directors and Stockholders of Career Education Corporation and subsidiaries
We have audited the accompanying consolidated balance sheets of Career Education Corporation and subsidiaries as of December 31, 2014 and 2013, and the related consolidated statements of loss and comprehensive loss, stockholders’ equity and cash flows for each of the three years in the period ended December 31, 2014. Our audit also included the financial statement schedule listed in the Index at Item 15 to the consolidated financial statements. These financial statements and schedule are the responsibility of the Company’s management. Our responsibility is to express an opinion on these financial statements and schedule based on our audits.
We conducted our audits in accordance with the standards of the Public Company Accounting Oversight Board (United States). Those standards require that we plan and perform the audit to obtain reasonable assurance about whether the financial statements are free of material misstatement. An audit includes examining, on a test basis, evidence supporting the amounts and disclosures in the financial statements. An audit also includes assessing the accounting principles used and significant estimates made by management, as well as evaluating the overall financial statement presentation. We believe that our audits provide a reasonable basis for our opinion.
In our opinion, the financial statements referred to above present fairly, in all material respects, the consolidated financial position of Career Education Corporation and subsidiaries at December 31, 2014 and 2013, and the consolidated results of their operations and their cash flows for each of the three years in the period ended December 31, 2014, in conformity with U.S. generally accepted accounting principles. Also, in our opinion, the related financial statement schedule, when considered in relation to the basic consolidated financial statements taken as a whole, presents fairly in all material respects the information set forth therein.
We also have audited, in accordance with the standards of the Public Company Accounting Oversight Board (United States), Career Education Corporation and subsidiaries’ internal control over financial reporting as of December 31, 2014, based on criteria established in Internal Control-Integrated Framework issued by the Committee of Sponsoring Organizations of the Treadway Commission (2013 framework) and our report dated March 3, 2015 expressed an unqualified opinion thereon.
/s/ Ernst & Young LLP
Chicago, Illinois
March 3, 2015
93
Table of Contents
REPORT OF INDEPENDENT REGISTERED PUBLIC ACCOUNTING FIRM ON
INTERNAL CONTROL OVER FINANCIAL REPORTING
The Board of Directors and Stockholders of Career Education Corporation and subsidiaries
We have audited Career Education Corporation and subsidiaries’ internal control over financial reporting as of December 31, 2014 based on criteria established in Internal Control – Integrated Framework issued by the Committee of Sponsoring Organizations of the Treadway Commission (2013 framework) (the COSO criteria). Career Education Corporation and subsidiaries’ management is responsible for maintaining effective internal control over financial reporting, and for its assessment of the effectiveness of internal control over financial reporting included in the accompanying Management’s Annual Report on Internal Control Over Financial Reporting. Our responsibility is to express an opinion on Career Education Corporation and subsidiaries’ internal control over financial reporting based on our audit.
We conducted our audit in accordance with the standards of the Public Company Accounting Oversight Board (United States). Those standards require that we plan and perform the audit to obtain reasonable assurance about whether effective internal control over financial reporting was maintained in all material respects. Our audit included obtaining an understanding of internal control over financial reporting, assessing the risk that a material weakness exists, testing and evaluating the design and operating effectiveness of internal control based on the assessed risk, and performing such other procedures as we considered necessary in the circumstances. We believe that our audit provides a reasonable basis for our opinion.
A company’s internal control over financial reporting is a process designed to provide reasonable assurance regarding the reliability of financial reporting and the preparation of financial statements for external purposes in accordance with generally accepted accounting principles. A company’s internal control over financial reporting includes those policies and procedures that (1) pertain to the maintenance of records that, in reasonable detail, accurately and fairly reflect the transactions and dispositions of the assets of the company; (2) provide reasonable assurance that transactions are recorded as necessary to permit preparation of financial statements in accordance with generally accepted accounting principles, and that receipts and expenditures of the company are being made only in accordance with authorizations of management and directors of the company; and (3) provide reasonable assurance regarding prevention or timely detection of unauthorized acquisition, use, or disposition of the company’s assets that could have a material effect on the financial statements.
Because of its inherent limitations, internal control over financial reporting may not prevent or detect misstatements. Also, projections of any evaluation of effectiveness to future periods are subject to the risk that controls may become inadequate because of changes in conditions, or that the degree of compliance with the policies or procedures may deteriorate.
In our opinion, Career Education Corporation and subsidiaries maintained, in all material respects, effective internal control over financial reporting as of December 31, 2014, based on the COSO criteria.
We also have audited, in accordance with the standards of the Public Company Accounting Oversight Board (United States), the consolidated balance sheets of Career Education Corporation and subsidiaries as of December 31, 2014 and 2013, and the related consolidated statements of loss and comprehensive loss, stockholders’ equity, and cash flows for each of the three years in the period ended December 31, 2014 of Career Education Corporation and subsidiaries and our report dated March 3, 2015 expressed an unqualified opinion thereon.
/s/ Ernst & Young LLP
Chicago, Illinois
March 3, 2015
94
Table of Contents
CAREER EDUCATION CORPORATION AND SUBSIDIARIES
CONSOLIDATED BALANCE SHEETS
(In thousands, except share and per share amounts)
| As of December 31, | ||||||||
| 2014 | 2013 | |||||||
| ASSETS | ||||||||
| CURRENT ASSETS: |
||||||||
| Cash and cash equivalents, unrestricted |
$ | 93,832 | $ | 318,468 | ||||
| Restricted cash |
22,938 | 12,564 | ||||||
| Short-term investments |
122,858 | 31,592 | ||||||
|
|
|
|
|
|||||
| Total cash and cash equivalents, restricted cash and short-term investments |
239,628 | 362,624 | ||||||
| Student receivables, net of allowance for doubtful accounts of $12,398 and $14,500 as of December 31, 2014 and 2013, respectively |
24,564 | 27,995 | ||||||
| Receivables, other, net |
18,925 | 27,198 | ||||||
| Prepaid expenses |
14,679 | 16,723 | ||||||
| Inventories |
3,305 | 4,593 | ||||||
| Deferred income tax assets, net |
— | 3,606 | ||||||
| Other current assets |
2,384 | 3,059 | ||||||
| Assets of discontinued operations |
77,319 | 14,219 | ||||||
|
|
|
|
|
|||||
| Total current assets |
380,804 | 460,017 | ||||||
|
|
|
|
|
|||||
| NON-CURRENT ASSETS: |
||||||||
| Property and equipment, net |
73,083 | 112,095 | ||||||
| Goodwill |
87,356 | 87,356 | ||||||
| Intangible assets, net |
9,819 | 12,817 | ||||||
| Student receivables, net of allowance for doubtful accounts of $2,119 and $3,070 as of December 31, 2014 and 2013, respectively |
2,926 | 3,276 | ||||||
| Deferred income tax assets, net |
— | 10,644 | ||||||
| Other assets |
18,571 | 17,132 | ||||||
| Assets of discontinued operations |
975 | 101,708 | ||||||
|
|
|
|
|
|||||
| TOTAL ASSETS |
$ | 573,534 | $ | 805,045 | ||||
|
|
|
|
|
|||||
| LIABILITIES AND STOCKHOLDERS’ EQUITY | ||||||||
| CURRENT LIABILITIES: |
||||||||
| Short-term borrowings |
$ | 10,000 | $ | — | ||||
| Accounts payable |
21,968 | 22,826 | ||||||
| Accrued expenses: |
||||||||
| Payroll and related benefits |
29,545 | 33,997 | ||||||
| Advertising and production costs |
13,162 | 17,166 | ||||||
| Income taxes |
1,633 | 14,994 | ||||||
| Other |
21,440 | 37,985 | ||||||
| Deferred tuition revenue |
37,572 | 44,769 | ||||||
| Liabilities of discontinued operations |
65,863 | 35,695 | ||||||
|
|
|
|
|
|||||
| Total current liabilities |
201,183 | 207,432 | ||||||
|
|
|
|
|
|||||
| NON-CURRENT LIABILITIES: |
||||||||
| Deferred rent obligations |
48,381 | 54,236 | ||||||
| Other liabilities |
19,178 | 24,797 | ||||||
| Liabilities of discontinued operations |
22,859 | 63,196 | ||||||
|
|
|
|
|
|||||
| Total non-current liabilities |
90,418 | 142,229 | ||||||
|
|
|
|
|
|||||
| STOCKHOLDERS’ EQUITY: |
||||||||
| Preferred stock, $0.01 par value; 1,000,000 shares authorized; none issued or outstanding |
— | — | ||||||
| Common stock, $0.01 par value; 300,000,000 shares authorized; 82,336,689 and 81,889,907 shares issued, 67,521,038 and 67,170,522 shares outstanding as of December 31, 2014 and 2013, respectively |
823 | 819 | ||||||
| Additional paid-in capital |
606,531 | 600,904 | ||||||
| Accumulated other comprehensive loss |
(853 | ) | (503 | ) | ||||
| Retained (deficit) earnings |
(109,403 | ) | 68,658 | |||||
| Cost of 14,815,651 and 14,719,385 shares in treasury as of December 31, 2014 and 2013, respectively |
(215,165 | ) | (214,494 | ) | ||||
|
|
|
|
|
|||||
| Total stockholders’ equity |
281,933 | 455,384 | ||||||
|
|
|
|
|
|||||
| TOTAL LIABILITIES AND STOCKHOLDERS’ EQUITY |
$ | 573,534 | $ | 805,045 | ||||
|
|
|
|
|
|||||
The accompanying notes are an integral part of these consolidated financial statements.
95
Table of Contents
CAREER EDUCATION CORPORATION AND SUBSIDIARIES
CONSOLIDATED STATEMENTS OF LOSS AND COMPREHENSIVE LOSS
(In thousands, except per share amounts)
| For the Year Ended December 31, | ||||||||||||
| 2014 | 2013 | 2012 | ||||||||||
| REVENUE: |
||||||||||||
| Tuition and registration fees |
$ | 736,883 | $ | 834,084 | $ | 1,005,753 | ||||||
| Other |
4,475 | 5,597 | 14,150 | |||||||||
|
|
|
|
|
|
|
|||||||
| Total revenue |
741,358 | 839,681 | 1,019,903 | |||||||||
|
|
|
|
|
|
|
|||||||
| OPERATING EXPENSES: |
||||||||||||
| Educational services and facilities |
240,796 | 274,450 | 324,493 | |||||||||
| General and administrative |
520,361 | 592,236 | 630,142 | |||||||||
| Depreciation and amortization |
36,019 | 45,155 | 48,352 | |||||||||
| Goodwill and asset impairment |
16,898 | 8,681 | 86,606 | |||||||||
|
|
|
|
|
|
|
|||||||
| Total operating expenses |
814,074 | 920,522 | 1,089,593 | |||||||||
|
|
|
|
|
|
|
|||||||
| Operating loss |
(72,716 | ) | (80,841 | ) | (69,690 | ) | ||||||
|
|
|
|
|
|
|
|||||||
| OTHER (EXPENSE) INCOME: |
||||||||||||
| Interest income |
851 | 1,359 | 1,191 | |||||||||
| Interest expense |
(491 | ) | (1,328 | ) | (134 | ) | ||||||
| Loss on sale of business |
— | (6,905 | ) | — | ||||||||
| Miscellaneous (expense) income |
(148 | ) | 134 | (156 | ) | |||||||
|
|
|
|
|
|
|
|||||||
| Total other income (expense) |
212 | (6,740 | ) | 901 | ||||||||
|
|
|
|
|
|
|
|||||||
| PRETAX LOSS |
(72,504 | ) | (87,581 | ) | (68,789 | ) | ||||||
| Provision for (benefit from) income taxes |
3,736 | 30,144 | (3,948 | ) | ||||||||
|
|
|
|
|
|
|
|||||||
| LOSS FROM CONTINUING OPERATIONS |
(76,240 | ) | (117,725 | ) | (64,841 | ) | ||||||
| LOSS FROM DISCONTINUED OPERATIONS, net of tax |
(101,923 | ) | (46,538 | ) | (77,955 | ) | ||||||
|
|
|
|
|
|
|
|||||||
| NET LOSS |
(178,163 | ) | (164,263 | ) | (142,796 | ) | ||||||
|
|
|
|
|
|
|
|||||||
| OTHER COMPREHENSIVE INCOME (LOSS), net of tax: |
||||||||||||
| Foreign currency translation adjustments |
— | 4,295 | 503 | |||||||||
| Unrealized losses on investments |
(350 | ) | (13 | ) | (152 | ) | ||||||
|
|
|
|
|
|
|
|||||||
| Total other comprehensive (loss) income |
(350 | ) | 4,282 | 351 | ||||||||
|
|
|
|
|
|
|
|||||||
| COMPREHENSIVE LOSS |
$ | (178,513 | ) | $ | (159,981 | ) | $ | (142,445 | ) | |||
|
|
|
|
|
|
|
|||||||
| NET LOSS PER SHARE – BASIC and DILUTED: |
||||||||||||
| Loss from continuing operations |
$ | (1.13 | ) | $ | (1.76 | ) | $ | (0.98 | ) | |||
| Loss from discontinued operations |
(1.52 | ) | (0.70 | ) | (1.17 | ) | ||||||
|
|
|
|
|
|
|
|||||||
| Net loss per share |
$ | (2.65 | ) | $ | (2.46 | ) | $ | (2.15 | ) | |||
|
|
|
|
|
|
|
|||||||
| WEIGHTED AVERAGE SHARES OUTSTANDING: |
||||||||||||
| Basic and Diluted |
67,173 | 66,738 | 66,475 | |||||||||
|
|
|
|
|
|
|
|||||||
The accompanying notes are an integral part of these consolidated financial statements.
96
Table of Contents
CAREER EDUCATION CORPORATION AND SUBSIDIARIES
CONSOLIDATED STATEMENTS OF STOCKHOLDERS’ EQUITY
(In thousands)
| Common Stock | Treasury Stock | Additional Paid-in Capital |
Accumulated Other Comprehensive Loss |
Retained Earnings (Deficit) |
Total | |||||||||||||||||||||||||||
| Issued Shares |
$0.01 Par Value |
Purchased Shares |
Cost | |||||||||||||||||||||||||||||
| BALANCE, December 31, 2011 |
81,967 | $ | 820 | (8,345 | ) | $ | (156,275 | ) | $ | 590,965 | $ | (5,136 | ) | $ | 375,717 | $ | 806,091 | |||||||||||||||
| Net loss |
— | — | — | — | — | — | (142,796 | ) | (142,796 | ) | ||||||||||||||||||||||
| Foreign currency translation gain |
— | — | — | — | — | 503 | — | 503 | ||||||||||||||||||||||||
| Unrealized loss on investments |
— | — | — | — | — | (152 | ) | — | (152 | ) | ||||||||||||||||||||||
|
|
|
|||||||||||||||||||||||||||||||
| Total comprehensive loss |
(142,445 | ) | ||||||||||||||||||||||||||||||
|
|
|
|||||||||||||||||||||||||||||||
| Treasury stock purchased |
— | — | (6,072 | ) | (56,431 | ) | — | — | — | (56,431 | ) | |||||||||||||||||||||
| Share-based compensation expense: |
||||||||||||||||||||||||||||||||
| Stock option plans |
— | — | — | — | 2,907 | — | — | 2,907 | ||||||||||||||||||||||||
| Restricted stock award plans |
— | — | — | — | 6,637 | — | — | 6,637 | ||||||||||||||||||||||||
| Employee stock purchase plan |
— | — | — | — | 143 | — | — | 143 | ||||||||||||||||||||||||
| Common stock issued under: |
||||||||||||||||||||||||||||||||
| Stock option plans |
— | — | — | — | — | — | — | — | ||||||||||||||||||||||||
| Restricted stock award plans |
(557 | ) | (6 | ) | (130 | ) | (1,282 | ) | 6 | — | — | (1,282 | ) | |||||||||||||||||||
| Employee stock purchase plan |
207 | 2 | — | — | 1,597 | — | — | 1,599 | ||||||||||||||||||||||||
| Tax effect of stock settlements |
— | — | — | — | (5,429 | ) | — | — | (5,429 | ) | ||||||||||||||||||||||
|
|
|
|
|
|
|
|
|
|
|
|
|
|
|
|
|
|||||||||||||||||
| BALANCE, December 31, 2012 |
81,617 | $ | 816 | (14,547 | ) | $ | (213,988 | ) | $ | 596,826 | $ | (4,785 | ) | $ | 232,921 | $ | 611,790 | |||||||||||||||
|
|
|
|
|
|
|
|
|
|
|
|
|
|
|
|
|
|||||||||||||||||
| Net loss |
— | — | — | — | — | — | (164,263 | ) | (164,263 | ) | ||||||||||||||||||||||
| Foreign currency translation gain |
— | — | — | — | — | 4,295 | — | 4,295 | ||||||||||||||||||||||||
| Unrealized loss on investments |
— | — | — | — | — | (13 | ) | — | (13 | ) | ||||||||||||||||||||||
|
|
|
|||||||||||||||||||||||||||||||
| Total comprehensive loss |
(159,981 | ) | ||||||||||||||||||||||||||||||
|
|
|
|||||||||||||||||||||||||||||||
| Share-based compensation expense: |
||||||||||||||||||||||||||||||||
| Stock option plans |
— | — | — | — | 2,308 | — | — | 2,308 | ||||||||||||||||||||||||
| Restricted stock award plans |
— | — | — | — | 4,339 | — | — | 4,339 | ||||||||||||||||||||||||
| Employee stock purchase plan |
— | — | — | — | 52 | — | — | 52 | ||||||||||||||||||||||||
| Common stock issued under: |
||||||||||||||||||||||||||||||||
| Stock option plans |
1 | — | — | — | 4 | — | — | 4 | ||||||||||||||||||||||||
| Restricted stock award plans |
(131 | ) | (1 | ) | (172 | ) | (506 | ) | 1 | — | — | (506 | ) | |||||||||||||||||||
| Employee stock purchase plan |
403 | 4 | — | — | 990 | — | — | 994 | ||||||||||||||||||||||||
| Tax effect of options exercised and stock settlements |
— | — | — | — | (3,616 | ) | — | — | (3,616 | ) | ||||||||||||||||||||||
|
|
|
|
|
|
|
|
|
|
|
|
|
|
|
|
|
|||||||||||||||||
| BALANCE, December 31, 2013 |
81,890 | $ | 819 | (14,719 | ) | $ | (214,494 | ) | $ | 600,904 | $ | (503 | ) | $ | 68,658 | $ | 455,384 | |||||||||||||||
|
|
|
|
|
|
|
|
|
|
|
|
|
|
|
|
|
|||||||||||||||||
| Net loss |
— | — | — | — | — | — | (178,163 | ) | (178,163 | ) | ||||||||||||||||||||||
| Unrealized loss on investments |
— | — | — | — | — | (350 | ) | — | (350 | ) | ||||||||||||||||||||||
|
|
|
|||||||||||||||||||||||||||||||
| Total comprehensive loss |
(178,513 | ) | ||||||||||||||||||||||||||||||
|
|
|
|||||||||||||||||||||||||||||||
| Share-based compensation expense: |
||||||||||||||||||||||||||||||||
| Stock option plan |
— | — | — | — | 1,372 | — | — | 1,372 | ||||||||||||||||||||||||
| Restricted stock award plan |
— | — | — | — | 2,865 | — | — | 2,865 | ||||||||||||||||||||||||
| Employee stock purchase plan |
— | — | — | — | 40 | — | — | 40 | ||||||||||||||||||||||||
| Common stock issued under: |
||||||||||||||||||||||||||||||||
| Stock option plan |
225 | 2 | — | — | 610 | — | — | 612 | ||||||||||||||||||||||||
| Restricted stock award plan |
95 | 1 | (97 | ) | (671 | ) | (1 | ) | — | — | (671 | ) | ||||||||||||||||||||
| Employee stock purchase plan |
127 | 1 | — | — | 741 | — | — | 742 | ||||||||||||||||||||||||
| Cumulative adjustment for change from cost method investment to equity method investment |
— | — | — | — | — | — | 102 | 102 | ||||||||||||||||||||||||
|
|
|
|
|
|
|
|
|
|
|
|
|
|
|
|
|
|||||||||||||||||
| BALANCE, December 31, 2014 |
82,337 | $ | 823 | (14,816 | ) | $ | (215,165 | ) | $ | 606,531 | $ | (853 | ) | $ | (109,403 | ) | $ | 281,933 | ||||||||||||||
|
|
|
|
|
|
|
|
|
|
|
|
|
|
|
|
|
|||||||||||||||||
The accompanying notes are an integral part of these consolidated financial statements.
97
Table of Contents
CAREER EDUCATION CORPORATION AND SUBSIDIARIES
CONSOLIDATED STATEMENTS OF CASH FLOWS
(In thousands)
| For the Year Ended December 31, | ||||||||||||
| 2014 | 2013 | 2012 | ||||||||||
| CASH FLOWS FROM OPERATING ACTIVITIES: |
||||||||||||
| Net Loss |
$ | (178,163 | ) | $ | (164,263 | ) | $ | (142,796 | ) | |||
| Adjustments to reconcile net loss to net cash used in operating activities: |
||||||||||||
| Goodwill and asset impairment |
36,209 | 22,691 | 127,007 | |||||||||
| Loss on sale of student receivables |
— | — | 720 | |||||||||
| Depreciation and amortization expense |
55,455 | 73,150 | 81,813 | |||||||||
| Bad debt expense |
14,841 | 28,892 | 40,022 | |||||||||
| Compensation expense related to share-based awards |
4,277 | 6,699 | 9,687 | |||||||||
| Loss (gain) on sale of businesses, net |
311 | (123,204 | ) | — | ||||||||
| Gain on bargain purchase |
— | — | (669 | ) | ||||||||
| Loss on disposition of property and equipment |
32 | 118 | 301 | |||||||||
| Deferred income taxes |
14,250 | 58,087 | (42,014 | ) | ||||||||
| Changes in operating assets and liabilities: |
||||||||||||
| Student receivables, gross |
13,281 | 56,072 | 17,913 | |||||||||
| Allowance for doubtful accounts |
(23,812 | ) | (39,766 | ) | (57,908 | ) | ||||||
| Other receivables, net |
7,854 | (29,526 | ) | (1,433 | ) | |||||||
| Inventories, prepaid expenses, and other current assets |
(1,877 | ) | 40,257 | 16,244 | ||||||||
| Deposits and other non-current assets |
(1,166 | ) | 12,244 | 1,654 | ||||||||
| Accounts payable |
(830 | ) | (8,463 | ) | (11,984 | ) | ||||||
| Accrued expenses and deferred rent obligations |
(52,972 | ) | (4,885 | ) | (19,473 | ) | ||||||
| Deferred tuition revenue |
(6,314 | ) | (13,907 | ) | (35,882 | ) | ||||||
|
|
|
|
|
|
|
|||||||
| Net cash used in operating activities |
(118,624 | ) | (85,804 | ) | (16,798 | ) | ||||||
|
|
|
|
|
|
|
|||||||
| CASH FLOWS FROM INVESTING ACTIVITIES: |
||||||||||||
| Purchases of available-for-sale investments |
(157,425 | ) | (40,842 | ) | (147,085 | ) | ||||||
| Sales of available-for-sale investments |
64,920 | 73,070 | 246,464 | |||||||||
| Purchases of property and equipment |
(13,156 | ) | (19,636 | ) | (37,944 | ) | ||||||
| Proceeds on the sale of business, net of cash divested |
— | 156,816 | — | |||||||||
| Payments of cash upon sale of asset |
(387 | ) | (2,525 | ) | — | |||||||
| Business acquisitions, net of acquired cash |
— | — | (1,721 | ) | ||||||||
| Purchase of equity method investment |
(1,575 | ) | — | — | ||||||||
| Other |
— | (17 | ) | (1,359 | ) | |||||||
|
|
|
|
|
|
|
|||||||
| Net cash (used in) provided by investing activities |
(107,623 | ) | 166,866 | 58,355 | ||||||||
|
|
|
|
|
|
|
|||||||
| CASH FLOWS FROM FINANCING ACTIVITIES: |
||||||||||||
| Purchase of treasury stock |
— | — | (56,431 | ) | ||||||||
| Issuance of common stock |
1,354 | 998 | 1,599 | |||||||||
| Tax benefit associated with stock option exercises |
— | 1 | — | |||||||||
| Payments of assumed loans upon business acquisition |
— | — | (318 | ) | ||||||||
| Payments of contingent consideration |
— | — | (5,818 | ) | ||||||||
| Borrowings from credit facility |
10,000 | — | 80,000 | |||||||||
| Payments on borrowings |
— | (80,000 | ) | — | ||||||||
| Change in restricted cash |
(10,374 | ) | 85,314 | (97,878 | ) | |||||||
| Payments of capital lease obligations |
— | (210 | ) | (844 | ) | |||||||
|
|
|
|
|
|
|
|||||||
| Net cash provided by (used in) financing activities |
980 | 6,103 | (79,690 | ) | ||||||||
|
|
|
|
|
|
|
|||||||
| EFFECT OF FOREIGN CURRENCY EXCHANGE RATE CHANGES ON CASH AND CASH EQUIVALENTS: |
156 | (8,844 | ) | (1,837 | ) | |||||||
|
|
|
|
|
|
|
|||||||
| NET (DECREASE) INCREASE IN CASH AND CASH EQUIVALENTS |
(225,111 | ) | 78,321 | (39,970 | ) | |||||||
| DISCONTINUED OPERATIONS CASH ACTIVITY INCLUDED ABOVE: |
||||||||||||
| Add: Cash balance of discontinued operations, beginning of the year |
475 | 127,104 | 108,867 | |||||||||
| Less: Cash balance of discontinued operations, end of the year |
— | 475 | 127,104 | |||||||||
| CASH AND CASH EQUIVALENTS, beginning of the year |
318,468 | 113,518 | 171,725 | |||||||||
|
|
|
|
|
|
|
|||||||
| CASH AND CASH EQUIVALENTS, end of the year |
$ | 93,832 | $ | 318,468 | $ | 113,518 | ||||||
|
|
|
|
|
|
|
|||||||
| Supplemental Cash Flow Information: |
||||||||||||
| Interest paid |
$ | 54 | $ | 517 | $ | 205 | ||||||
| Income taxes paid |
$ | 17,528 | $ | 5,106 | $ | 19,102 | ||||||
The accompanying notes are an integral part of these consolidated financial statements.
98
Table of Contents
CAREER EDUCATION CORPORATION AND SUBSIDIARIES
NOTES TO CONSOLIDATED FINANCIAL STATEMENTS
December 31, 2014, 2013 and 2012
1. DESCRIPTION OF THE COMPANY
The colleges, institutions and universities that are part of the Career Education Corporation (“CEC”) family offer high-quality education to a diverse student population in a variety of career-oriented disciplines through online, on-ground and hybrid learning program offerings. In addition to its online offerings, Career Education serves students from campuses throughout the United States offering programs that lead to doctoral, master’s, bachelor’s and associate degrees, as well as to diplomas and certificates.
Our institutions include both universities that provide degree programs through the master or doctoral level and colleges that provide programs through the associate and bachelor level. The University group includes American InterContinental University (“AIU”) and Colorado Technical University (“CTU”) – predominantly serving students online with career-focused degree programs that meet the educational demands of today’s busy adults. The Career Colleges group offers career-centered education primarily through ground-based campuses and includes Briarcliffe College, Brooks Institute, Harrington College of Design, Missouri College and Sanford-Brown Institutes and Colleges (“SBI” and “SBC,” respectively). Through our colleges, institutions and universities, we are committed to providing high-quality education, enabling students to graduate and pursue rewarding career opportunities.
A detailed listing of individual campus locations and web links to Career Education’s colleges, institutions and universities can be found at www.careered.com.
As used in this Annual Report on Form 10-K, the terms “we,” “us,” “our,” “the Company” and “CEC” refer to Career Education Corporation and our wholly-owned subsidiaries. The terms “college,” “institution,” and “university” refer to an individual, branded, proprietary educational institution, owned by us and includes its campus locations. The term “campus” refers to an individual main or branch campus operated by one of our colleges, institutions or universities.
2. SUMMARY OF SIGNIFICANT ACCOUNTING POLICIES
a. Principles of Consolidation and Basis of Presentation
These consolidated financial statements include the accounts of CEC and our wholly-owned subsidiaries (collectively “CEC”). All inter-company transactions and balances have been eliminated. The results of operations of all acquired businesses have been consolidated for all periods subsequent to the date of acquisition.
We organize our business across four reporting segments: CTU, AIU (comprises University Group); Career Colleges; and Transitional Group. Campuses included in our Transitional Group segment are currently being taught out and no longer enroll new students. These campuses employ a gradual teach-out process, enabling them to continue to operate while current students complete their course of study.
b. Reclassifications
During 2014, we announced the teach-out of three additional Sanford-Brown campuses: Chicago, Las Vegas and Orlando. These campuses are now included in the Transitional Group segment. During the current year, we also completed the teach-out of 20 Transitional Group campuses and one CTU campus as well as sold two campuses (one previously reported in the Career Colleges segment and one previously reported in the Transitional Group segment). As a result, all current and prior periods reflect the sold and fully taught out campuses as components of discontinued operations.
99
Table of Contents
Additionally, during the fourth quarter of 2014, our Board of Directors approved a plan to sell our 16 Culinary Arts campuses (“LCB”). Our decision to pursue the divestiture of LCB was the result of an ongoing portfolio review undertaken to evaluate the strategic direction of the Company. As a result of the decision to sell LCB, the assets and liabilities of the entities to be sold are classified as held for sale within discontinued operations as of December 31, 2014.
All prior period results have been recast to reflect our reporting segments on a comparable basis.
c. Management’s Use of Estimates
The preparation of financial statements in conformity with generally accepted accounting principles in the U.S. (“GAAP”) requires management to make certain estimates and assumptions that affect the reported amounts of assets and liabilities and the disclosure of contingent liabilities as of the date of the financial statements and reported amounts of revenues and expenses during the reported period. Significant estimates, among others, include the allowance for doubtful accounts, the allocation of purchase price to the fair value of net assets and liabilities acquired in connection with business combinations, the assumptions surrounding sublease income utilized in determining the fair value of remaining lease obligations, assumptions utilized in calculating income tax related matters including our deferred tax balances and any respective valuation allowance, fair values used in asset impairment evaluations including goodwill, intangible assets, long-lived assets, and held for sale assets and the assumptions used in determining the fair value of accruals for severance and related costs. Although these estimates are based upon management’s best knowledge of current events and actions that we may undertake in the future, actual results could differ from these estimates.
d. Concentration of Credit Risk
A substantial portion of credit extended to students is repaid through the students’ participation in various federal financial aid programs authorized by Title IV of the Higher Education Act of 1965, as amended (“HEA”), which we refer to as “Title IV Programs.” For the years ended December 31, 2014, 2013 and 2012, approximately 78%, 78% and 80% respectively, of our institutions’ cash receipts from tuition payments came from Title IV Program funding.
Transfers of funds received from Title IV Programs are made in accordance with the U.S. Department of Education’s (“ED”) requirements. Changes in ED funding of Title IV Programs could have a material impact on our ability to attract students and the realizability of our student receivables. See Item 1A, “Risk Factors,” of this Annual Report on Form 10-K for further discussion of the risks associated with Title IV Programs.
e. Allowance for Doubtful Accounts
We extend unsecured credit to a portion of the students who are enrolled at our institutions for tuition and certain other educational costs. Based upon past experience and judgment, we establish an allowance for doubtful accounts with respect to student receivables which we estimate will ultimately not be collectible. As such, our results from operations only reflect the amount of revenue that is estimated to be reasonably collectible. Our standard allowance estimation methodology considers a number of factors that, based on our collections experience, we believe have an impact on our credit risk and the realizability of our student receivables. Among these factors are a student’s status (in-school or out-of-school), anticipated funding source (third party, internal short-term and extended payment plans), whether or not an out-of-school student has completed his or her program of study, and our overall collections history.
We monitor our collections and write-off experience to assess whether or not adjustments to our allowance percentage estimates are necessary. Changes in trends in any of the factors that we believe impact the realizability of our student receivables, as noted above, or modifications to our credit standards, collection practices, and other related policies may impact our estimate of our allowance for doubtful accounts and our results from operations. Additionally, we monitor certain internal and external factors, including changes in our academic programs, as well as changes in the current economic, legislative and regulatory environments.
100
Table of Contents
f. Fair Value of Financial Instruments
The carrying amounts for cash and cash equivalents, short-term investments, and the current portion of accounts receivables and accounts payable reported in our consolidated balance sheets approximate fair value because of the nature of these financial instruments, as they generally have short maturity periods.
The fair value measure of accounting for financial instruments establishes a three-tier fair value hierarchy, which prioritizes the inputs used in measuring fair value. These tiers include: Level 1, defined as observable inputs such as quoted prices in active markets; Level 2, defined as inputs other than quoted prices in active markets that are either directly or indirectly observable; and Level 3, defined as unobservable inputs in which little or no market data exists, therefore requiring an entity to develop its own assumptions.
Our investment in auction rate securities (“ARS”) is presented within other non-current assets on the consolidated balance sheets. As of December 31, 2014, we have determined this investment is at risk for impairment due to the nature of the liquidity of the market over the past several years. We believe this impairment is temporary, as we do not intend to sell the investment and it is unlikely we will be required to sell the investment before recovery of its amortized cost basis.
Our student receivables with repayment periods greater than one year are presented within non-current assets on the consolidated balance sheets. It is not practicable to estimate the fair value of these financial instruments, since observable market data is not readily available, and no reasonable estimation methodology exists.
g. Revenue Recognition
Our revenue, which is derived primarily from academic programs taught to students who attend our institutions, is generally segregated into two categories: (1) tuition and registration fees and (2) other. Tuition and registration fees represent costs to our students for educational services provided by our institutions. For certain institutions, we bill students a one-time registration fee at the beginning of their program and recognize the registration fee revenue on a straight-line basis over that program period, which includes any applicable externship period. Our institutions charge tuition at varying amounts, depending on the institution, the type of program and specific curriculum. A majority of our institutions bill students a single charge that covers tuition and required program materials, such as textbooks and supplies, which we treat as a single accounting unit. Generally, we bill student tuition fees, including those treated as a single accounting unit, at the beginning of each academic period, and recognize the tuition fees as revenue on a straight- line basis over either the academic term or program period, which includes any applicable externship period. The tuition fees earnings method is determined by the type of program a student is enrolled in. Typically, institutions that offer our culinary arts and our health programs earn tuition fees over the entire program while the remainder of our institutions earns tuition fees over each academic term. The portion of tuition and registration fee payments received from students but not yet earned is recorded as deferred tuition revenue and reported as a current liability on our consolidated balance sheets, as we expect to earn these revenues within the next year. Deferred tuition revenue is stated net of outstanding student receivables on a student-by-student basis as of the end of the reporting period.
If a student withdraws from one of our schools prior to the completion of the academic term or program period, we refund the portion of tuition and registration fees already paid that, pursuant to our refund policy and applicable federal and state law and accrediting agency standards, we are not entitled to retain. Generally, the amount to be refunded to a student is calculated based upon the period of time the student has attended classes and the amount of tuition and registration fees paid by the student as of their withdrawal date. These refunds typically reduce deferred tuition revenue and cash on our consolidated balance sheets as we generally do not recognize tuition revenue in our consolidated statements of loss and comprehensive loss until the related refund provisions have lapsed. Based on the application of our refund policies, we may be entitled to incremental revenue on the day the student withdraws from one of our schools. Prior to fiscal 2014, we recorded this incremental revenue, any related student receivable and any estimate of the amount we did not expect to collect
101
Table of Contents
as bad debt expense during the quarter a student withdrew based on our analysis of the collectability on an aggregate student portfolio basis, for which we had significant historical experience. Beginning in fiscal 2014, we record revenue for students who withdraw when payment is received (i.e., on a cash basis) because collectability on a student by student basis is difficult to ascertain. This change had the effect of reducing net revenues by $9.4 million and bad debt expense by $7.5 million, which resulted in an increase to the loss from continuing operations of $1.9 million for the year ended December 31, 2014. Additionally, this change reduced net student receivables from continuing operations by $1.9 million. Prior year amounts were not restated because the effects were not material.
Our institutions’ academic year is generally at least 30 weeks in length but varies both by institution and program of study and is divided by academic terms or payment periods. Academic terms or payment periods are determined by regulatory requirements mandated by the federal government and/or appropriate accrediting body, which also vary by institution and program. Academic terms are determined by start dates, which also vary by institution and program. Our students finance costs through a variety of funding sources, including, among others, federal loan and grant programs, institution payment plans, private loans and grants, private and institutional scholarships and cash payments.
Other revenue, which consists primarily of bookstore sales for institutions not using single-charge billing and contract-training revenue, is billed and recognized as goods are delivered or services are performed.
h. Cash and Cash Equivalents
Cash equivalents include short-term investments with a term to maturity of less than 90 days at the date of purchase. Loans which are disbursed under our current credit agreement are secured by 100% cash collateral. The Company has funds which are restricted in use under our credit agreement and additional restricted funds which provide collateral for letters of credit. See Note 11 “Credit Agreement” for further details of our current credit agreement.
Restricted cash balances as of December 31, 2014 and 2013 total $22.9 million and $12.6 million, respectively. Restricted cash balances were comprised of $12.9 million and $12.6 million of certificates of deposit to provide securitization of our letters of credit as of December 31, 2014 and 2013, respectively. Additionally, $10.0 million of restricted cash to provide securitization of borrowings under our credit agreement was included in restricted cash balances as of December 31, 2014.
Students at our institutions may receive grants, loans and work-study opportunities to fund their education under Title IV Programs. In certain instances, students may request that we retain a portion of their Title IV funds provided to them in excess of tuition billings. Students may authorize us to apply these funds to historical balances or future charges and/or distribute them directly to the student in certain cases. As of December 31, 2014, we held $12.2 million of these funds on behalf of students within our cash, cash equivalents, restricted cash and short term investments on our consolidated balance sheet.
i. Student Receivables
Student receivables represent funds owed to us in exchange for the education services that we provided to a student. Student receivables are reported net of an allowance for doubtful accounts and net of deferred tuition revenue, as determined on a student-by-student basis as of the end of the reporting period. Student receivables which are due to be paid in less than one year are recorded as current assets within our consolidated balance sheets. Student receivables which are due to be paid at dates ranging from one to five years from the balance sheet date are reported as non-current assets within our consolidated balance sheets.
Generally, a student receivable balance is written off once it reaches greater than 90 days past due. Although we analyze past due receivables, it is not practical to provide an aging of our non-current student receivable
102
Table of Contents
balances as a result of the methodology utilized in determining our earned student receivable balances. Student receivables are recognized on our consolidated balance sheets as they are deemed earned over the course of a student’s program and/or term, and therefore cash collections are not applied against specifically dated transactions.
j. Discontinued Operations
Discontinued operations are accounted for in accordance with the provisions of Financial Accounting Standards Board (“FASB”) Accounting Standards Codification (“ASC”) Section 360-10-35 Property, Plant, and Equipment. In accordance with FASB ASC Section 360-10-35, the net assets of discontinued operations are recorded on our consolidated balance sheets at estimated fair value. The results of operations of discontinued operations are segregated from continuing operations and reported separately as discontinued operations in our consolidated statements of loss and comprehensive loss. See Note 4 “Discontinued Operations” for further discussion.
k. Investments
Our investments, which primarily consist of non-governmental debt securities, treasury and federal agencies, and municipal bonds are classified as “available-for-sale” and recorded at fair value. Any unrealized holding gains or temporary unrealized holding losses, net of income tax effects, are reported as a component of accumulated other comprehensive loss within stockholders’ equity. Realized gains and losses are computed on the basis of specific identification and are included in miscellaneous (expense) income in our consolidated statements of loss and comprehensive loss. Our investment in a municipal auction rate security has a stated term to maturity of greater than one year. As such, we classify this investment as non-current on our consolidated balance sheets within other assets.
We use the equity method to account for our investment in equity securities if our investment gives us the ability to exercise significant influence over operating and financial policies of the investee. We include our proportionate share of earnings and/or losses of our equity method investee in other (expense) income within our consolidated statements of loss and comprehensive loss. The carrying value of our equity investment is reported within other non-current assets on our consolidated balance sheets.
l. Inventories
Inventories, consisting principally of program materials, textbooks, food and supplies, are stated at the lower of cost, determined on a first-in, first-out basis, or market. The cost of inventory is reflected as a component of educational services and facilities expense as the items are used or sold.
m. Property and Equipment
Property and equipment are stated at cost less accumulated depreciation. Depreciation and amortization are recognized using the straight-line method over the estimated useful lives of the related assets for financial reporting purposes and an accelerated method for income tax reporting purposes. Leasehold improvements are amortized on a straight-line basis over the shorter of the life of the lease or the useful life. Maintenance, repairs, minor renewals and betterments are expensed as incurred, and major improvements, which extend the useful life of the asset, are capitalized.
n. Goodwill and Intangible Assets
Goodwill represents the excess of cost over fair market value of identifiable net assets acquired through business purchases. In accordance with FASB ASC Topic 350 – Intangibles-Goodwill and Other, we review goodwill for impairment on at least an annual basis by applying a fair-value-based test. In evaluating the
103
Table of Contents
recoverability of the carrying value of goodwill, we must make assumptions regarding the fair value of our reporting units, as defined under FASB ASC Topic 350. Goodwill is evaluated using a two-step impairment test at the reporting unit level. A reporting unit can be a strategic business unit or business within a strategic business unit. The first step compares the book value of a reporting unit, including goodwill, with its fair value, as determined by a combination of income and market approach valuation methodologies. If the book value of a reporting unit exceeds its fair value, we complete the second step to determine the amount of goodwill impairment loss that we should record. In the second step, we determine an implied fair value of the reporting unit’s goodwill by allocating the fair value of the reporting unit to all of the assets and liabilities other than goodwill (including any unrecognized intangible assets). The amount of impairment loss is equal to the excess of the book value of the goodwill over the implied fair value of goodwill.
In performing our annual review of goodwill balances for impairment, we estimate the fair value of each of our reporting units based on projected future operating results and cash flows, market assumptions and/or comparative market multiple methods. Determining fair value requires significant estimates and assumptions based on an evaluation of a number of factors, such as marketplace participants, relative market share, new student interest, student retention, future expansion or contraction expectations, amount and timing of future cash flows and the discount rate applied to the cash flows. Projected future operating results and cash flows used for valuation purposes do reflect improvements relative to recent historical periods with respect to, among other things, revenue growth and operating margins. Although we believe our projected future operating results and cash flows and related estimates regarding fair values are based on reasonable assumptions, historically projected operating results and cash flows have not always been achieved. The failure of one of our reporting units to achieve projected operating results and cash flows in the near term or long term may reduce the estimated fair value of the reporting unit below its carrying value and result in the recognition of a goodwill impairment charge. Significant management judgment is necessary to evaluate the impact of operating and macroeconomic changes and to estimate future cash flows. Assumptions used in our impairment evaluations, such as forecasted growth rates and our cost of capital, are based on the best available market information and are consistent with our internal forecasts and operating plans. In addition to cash flow estimates, our valuations are sensitive to the rate used to discount cash flows and future growth assumptions. These assumptions could be adversely impacted by certain of the risks discussed in Item 1A, “Risk Factors,” in this Annual Report on Form 10-K.
Intangible assets include both indefinite and definite-lived assets. Indefinite-lived assets include our trade names and accreditation rights, which are recorded at fair market value upon acquisition and subsequently reviewed on an annual basis for impairment. Accreditation rights represent the ability of our institutions to participate in Title IV Programs.
Our definite-lived intangible assets include courseware, which represents the value of acquired curriculum, including lesson plans and syllabi, used to deliver educational services. Acquired courseware balances are amortized on a straight-line basis over their useful lives, which are estimated by management based upon, among other things, the expected future utilization period and the nature of the related academic programs. Other definite-lived intangible assets represent ownership related to renewable internet domain names and are amortized on a straight-line basis over the applicable renewal periods.
See Note 9 “Goodwill and Other Intangible Assets” for further discussion.
o. Impairment of Long-Lived Assets
We review property and equipment, definite-lived intangible assets, and other long-lived assets for impairment on an annual basis or whenever adverse events or changes in circumstances indicate that the carrying amounts of such assets may not be recoverable. If such adverse events or changes in circumstances occur, we will recognize an impairment loss if the undiscounted future cash flows expected to be generated by the assets are less than the carrying value of the related assets. The impairment loss would reduce the carrying value of the assets to their estimated fair value.
See Note 7 “Property and Equipment” for further discussion.
104
Table of Contents
p. Contingencies
During the ordinary course of business, we are subject to various claims and contingencies. In accordance with FASB ASC Topic 450 – Contingencies, when we become aware of a claim or potential claim, we assess the likelihood of any related loss or exposure. The probability of whether an asset has been impaired or a liability has been incurred, and whether the amount of loss can be reasonably estimated, is analyzed, and if the loss contingency is both probable and reasonably estimable, then we accrue for costs, including direct costs incurred, associated with the loss contingency. If no accrual is made but the loss contingency is reasonably possible, we disclose the nature of the contingency and the related estimate of possible loss or range of loss if such an estimate can be made. For all matters that are currently being reviewed, we expense legal fees, including defense costs, as they are incurred. Loss contingencies include, but are not limited to, possible losses related to legal proceedings and regulatory compliance matters, and our assessment of exposure requires subjective and judgmental assessment. Liabilities established to provide for contingencies are adjusted as further information develops, circumstances change, or contingencies are resolved. See Note 12 “Contingencies” for additional information.
q. Income Taxes
We are subject to the income tax laws of the U.S. and various state, local and foreign jurisdictions. These tax laws are complex and subject to interpretation. As a result, significant judgments and interpretations are required in determining our income tax (benefits) provisions and evaluating our uncertain tax positions.
We account for income taxes in accordance with FASB ASC Topic 740 – Income Taxes. Topic 740 requires the recognition of deferred income tax assets and liabilities based upon the income tax consequences of temporary differences between financial reporting and income tax reporting by applying enacted statutory income tax rates applicable to future years to differences between the financial statement carrying amounts and the income tax basis of existing assets and liabilities. Topic 740 also requires that deferred income tax assets be reduced by a valuation allowance if it is more likely than not that some portion of the deferred income tax asset will not be realized.
In assessing the need for a valuation allowance, we consider both positive and negative evidence related to the likelihood of realization of the deferred tax assets. Topic 740 provides that important factors in determining whether a deferred tax asset will be realized are whether there has been sufficient taxable income in recent years and whether sufficient taxable income is expected in future years in order to utilize the deferred tax asset. In evaluating the realizability of deferred income tax assets, we consider, among other things, historical levels of taxable income along with possible sources of future taxable income, which include: the expected timing of the reversals of existing temporary reporting differences, the existence of taxable income in prior carryback year(s), the expected impact of tax planning strategies that may be implemented to prevent the potential loss of future income tax benefits and expected future taxable income. Changes in, among other things, income tax legislation, statutory income tax rates, or future taxable income levels could materially impact our valuation of income tax assets and liabilities and could cause our income tax provision to vary significantly among financial reporting periods. If, based on the weight of available evidence, it is more likely than not the deferred tax assets will not be realized, we record a valuation allowance. The weight given to the positive and negative evidence is commensurate with the extent to which the evidence may be objectively verified. A high degree of judgment is required to determine if, and the extent to which, valuation allowances should be recorded against deferred tax assets. A significant piece of objective negative evidence evaluated is the cumulative loss incurred over the three-year period ended December 31, 2014. Such objective evidence limits the ability to consider other subjective evidence such as our projections for future growth as projections for future growth are less objectively verifiable.
Topic 740 further clarifies the accounting for uncertainty in income taxes recognized in an entity’s financial statements and prescribes a recognition threshold and measurement attribute for the financial statement recognition and measurement of a tax position taken or expected to be taken in an income tax return. Topic 740 also provides guidance on derecognition, classification, interest and penalties, accounting in interim periods, disclosure and transition.
105
Table of Contents
r. Deferred Rent Obligations
Certain of the real estate operating lease agreements to which we are party contain rent escalation clauses or lease incentives, such as rent abatements or tenant improvement allowances. Rent escalation clauses and lease incentives are taken into account in determining total rent expense to be recognized during the term of the lease, which begins on the date that we take control of the leased space. Renewal options are considered when evaluating the overall term of the lease. In accordance with FASB ASC Topic 840 – Leases, differences between periodic rent expense and periodic cash rental payments, caused primarily by the recognition of rent expense on a straight-line basis and tenant improvement allowances due or received from lessors, are recorded as deferred rent obligations on our consolidated balance sheets.
We record tenant improvement allowances as a deferred rent obligation on our consolidated balance sheets and as a cash inflow from operating activities in our consolidated statements of cash flows. We record capital expenditures funded by tenant improvement allowances received as a leasehold improvement on our consolidated balance sheets and as an investing activity within our consolidated statements of cash flows.
s. Share-Based Compensation
FASB ASC Topic 718 – Compensation-Stock Compensation requires that all share-based payments to employees and non-employee directors, including grants of stock options, shares or units of restricted stock, and the compensatory elements of employee stock purchase plans, be recognized in the financial statements based on the estimated fair value of the equity or liability instruments issued.
See Note 14 “Share-Based Compensation” for further discussion of our share-based compensation plans, the nature of share-based awards issued under the plans and our accounting for share-based awards.
t. Educational Services and Facilities Expense
Educational services and facilities expense includes costs directly attributable to the educational activities of our institutions, including: (1) salaries and benefits of faculty, academic administrators, and student support personnel, (2) costs of educational supplies and facilities, including rents on institution leases, certain costs of establishing and maintaining computer laboratories, costs of student housing, and owned and leased facility costs, and (3) costs of other goods and services provided by our institutions, including costs of textbooks, laptop computers, restaurant services and contract training. Costs of such other goods and services for continuing operations, included in educational services and facilities expense in our consolidated statements of loss and comprehensive loss, were approximately $20.5 million, $29.1 million and $41.3 million for the years ended December 31, 2014, 2013 and 2012, respectively.
u. Advertising Costs
Advertising costs are expensed as incurred. Advertising costs for continuing operations, which are included in general and administrative expenses in our consolidated statements of loss and comprehensive loss, were $212.4 million, $227.9 million and $247.2 million, for the years ended December 31, 2014, 2013 and 2012, respectively.
3. RECENT ACCOUNTING PRONOUNCEMENTS
In January 2015, the FASB issued Accounting Standards Update (“ASU”) No. 2015-01, Income Statement – Extraordinary and Unusual Items (Subtopic 225-20): Simplifying Income Statement Presentation by Eliminating the Concept of Extraordinary Items. This ASU eliminates from GAAP the concept of extraordinary items. Subtopic 225-20 previously required that an entity separately classify, present, and disclose extraordinary events and transactions from the results of ordinary operations and show the items separately. The amendments in this
106
Table of Contents
ASU are effective for annual periods and interim periods within those annual periods, beginning after December 15, 2015; early adoption is permitted, for both public and all other entities. We are currently evaluating this guidance and do not believe the adoption will significantly impact the presentation of our financial condition, results of operations and disclosures.
In August 2014, the FASB issued ASU No. 2014-15, Presentation of Financial Statements – Going Concern (Subtopic 205-40): Disclosure of Uncertainties about an Entity’s Ability to Continue as a Going Concern. This ASU provides guidance to an organization’s management, intended to define management’s responsibility to evaluate whether there is a substantial doubt about an organization’s ability to continue as a going concern and to provide guidance regarding related footnote disclosure. In connection with preparing financial statements for each annual and interim reporting period, an entity’s management should evaluate whether there are conditions or events, considered in the aggregate, that raise substantial doubt about the entity’s ability to continue as a going concern within one year after the date that the financial statements are issued. Management’s evaluation should be based on relevant conditions and events that are known and reasonably knowable at the date that the financial statements are issued. For all entities, ASU 2014-15 is effective for annual periods and interim periods within those annual periods beginning after December 15, 2016; early adoption is permitted. We are currently evaluating the impact that the adoption of ASU 2014-15 will have on our financial condition, results of operations and disclosures.
In June 2014, the FASB issued ASU No. 2014-12, Compensation – Stock Compensation (Topic 718): Accounting for Share-Based Payments When the Terms of an Award Provide That a Performance Target Could Be Achieved after the Requisite Service Period. This ASU standardizes the reporting for these awards by requiring that entities treat these performance targets as a performance condition. As such, the performance target should not be reflected in estimating the grant-date fair value of the award. Compensation cost should be recognized in the period in which it becomes probable that the performance target will be achieved and should represent the compensation cost attributable to the period(s) for which the requisite service has already been rendered. For all entities, ASU 2014-12 is effective for annual periods and interim periods within those annual periods beginning after December 15, 2015; early adoption is permitted. We are currently evaluating the impact that the adoption of ASU 2014-11 will have on our financial condition, results of operations and disclosures.
In May 2014, the FASB issued ASU No. 2014-09, Revenue from Contracts with Customers (Topic 606). ASU 2014-09 is principles based guidance that can be applied to all contracts with customers, enhancing comparability of revenue recognition practices across entities, industries, jurisdictions and capital markets. The core principle of the guidance is that entities should recognize revenue to depict the transfer of promised goods or services to customers in an amount that reflects the consideration to which the entity expects to be entitled in exchange for those goods and services. The guidance details the steps entities should apply to achieve the core principle. For public entities, ASU 2014-09 is effective for annual reporting periods beginning after December 15, 2016, including interim periods within that reporting period; early adoption is not permitted. We are currently evaluating the impact that the adoption of ASU 2014-09 will have on our financial condition, results of operations and disclosures.
In April 2014, the FASB issued ASU No. 2014-08, Presentation of Financial Statements (Topic 205) and Property, Plant, and Equipment (Topic 360): Reporting Discontinued Operations and Disclosures of Disposals of Components of an Entity. This ASU limits discontinued operations reporting to disposals of components of an entity that represent strategic shifts that have (or will have) a major effect on an entity’s operations and financial results. In addition, the amendments in this ASU require expanded disclosures for discontinued operations as well as for disposals that do not qualify as discontinued operations. For public entities, ASU 2014-08 is effective for fiscal years, and interim periods within those years, beginning on or after December 15, 2014. We have evaluated the impact that the adoption of ASU 2014-08 will have on our financial condition, results of operation and disclosures and believe the impact to be material. Previously, campuses within our Transitional Group would be reclassified as discontinued operations upon the teach-out date. Under the new guidance, campuses that complete their teach-out will not meet the definition of discontinued operations, with the exception of those that
107
Table of Contents
meet the definition of a “strategic shift.” Therefore, revenues and any respective operating losses associated with these campuses that do not meet the definition of a “strategic shift” will remain within continuing operations for all periods presented. Additionally, we will provide increased disclosures surrounding discontinued operations as well as increased disclosures surrounding our campuses that will cease operations but not meet the requirements to be classified as discontinued operations.
We have evaluated and adopted the guidance of the following ASUs issued by the FASB in 2013; adopting these ASUs did not materially impact the presentation of our financial condition, results of operations and disclosures:
| • | ASU No. 2013-11, Income Taxes (Topic 740): Presentation of an Unrecognized Tax Benefit When a Net Operating Loss Carryforward, a Similar Tax Loss, or a Tax Credit Carryforward Exists issued in July 2013. ASU 2013-11 standardizes the financial statement presentation of an unrecognized tax benefit when a net operating loss carryforward, a similar tax loss, or a tax credit carryforward exists; it does not require new recurring disclosures. ASU 2013-11 requires that an unrecognized tax benefit, or a portion of an unrecognized tax benefit, should be presented in the financial statements as a reduction to a deferred tax asset for a net operating loss carryforward, a similar tax loss, or a tax credit carryforward unless specific criteria exist, in which case the unrecognized tax benefit should be presented as a liability and should not be combined with deferred tax assets. |
| • | ASU No. 2013-04, Liabilities (Topic 405): Obligations Resulting from Joint and Several Liability Arrangements for Which the Total Amount of the Obligation is Fixed at the Reporting Date issued in February 2013. The guidance in ASU 2013-04 requires entities to measure obligations resulting from joint and several liability arrangements, for which the total obligation amount is fixed at the reporting date, as the sum of the amount the reporting entity agreed to pay on the basis of its arrangement among its co-obligors and any additional amount it expects to pay on behalf of its co-obligors. ASU 2013-04 also specifies disclosure requirements. |
4. DISCONTINUED OPERATIONS
As of December 31, 2014, the results of operations for campuses that have ceased operations, assets that are held for sale or institutions that were sold, and are considered distinct operations as defined under FASB ASC Topic 205 – Presentation of Financial Statements, are presented within discontinued operations. During 2014, we completed the teach-out of twenty-one campuses, as well as completed the sale of two campuses, and accordingly, all current and prior period financial statements include the results of operations and financial position of these campuses as components of discontinued operations.
Assets Held for Sale
During the fourth quarter of 2014, we made the decision to commit to a plan of sale for our Le Cordon Bleu Culinary Arts institutions. Accordingly, the assets and liabilities for these institutions are included in the assets and liabilities of discontinued operations on our consolidated balance sheets and the results of operations are reported within discontinued operations in the consolidated statements of loss and comprehensive loss. As we anticipate the sale of these assets to be completed within one year, we have recorded the assets and liabilities related to these institutions within current assets and liabilities of discontinued operations as of December 31, 2014.
During the fourth quarter of 2014, and prior to the announcement of the plan of sale for our LCB institutions, we concluded that certain indicators, including the recent release of the gainful employment regulation, existed to suggest the long-lived assets were at risk of their carrying values exceeding their respective fair values. As a result of our analysis of fair value, we recorded $10.0 million of asset impairment charges related to the fixed assets at four of our LCB institutions. The fixed assets related to these institutions are expected to generate negative cash flows through their respective lease end dates and as such the carrying values were not deemed recoverable. The fair value for these assets was determined based upon management’s
108
Table of Contents
assumptions regarding an estimated percentage of replacement value for similar assets and estimated salvage values. Because the determination of the estimated fair value of these assets requires significant estimation and assumptions, these fair value measurements are categorized as Level 3 per ASC Topic 820.
Disposition of International Segment
On December 3, 2013, we completed the sale and transfer of control of our International Segment, which consisted of our INSEEC schools and the International University of Monaco located in France and Monaco, respectively. This sale reflected our strategy to redeploy our assets to rebuild our domestic educational institutions and improve our options for accelerating growth. The total consideration for the International Segment pursuant to the Purchase Agreement was $305.0 million, less certain distributions and adjustments prior to closing, which resulted in a cash payment of $276.5 million received at closing. We realized a gain on the sale of $130.1 million, net of approximately $8.9 million of transaction costs, during 2013 within loss from discontinued operations on our consolidated statements of loss and comprehensive loss. This gain represented the difference between the proceeds received and the book value of the net assets sold. The income tax expense associated with the gain was approximately $87.9 million.
Results of Discontinued Operations
Combined summary results of operations for our discontinued operations for the years ended December 31, 2014, 2013 and 2012, were as follows (dollars in thousands):
| For the Year Ended December 31, | ||||||||||||
| 2014 | 2013 (1) | 2012 (2) | ||||||||||
| Revenue |
$ | 177,314 | $ | 355,340 | $ | 470,661 | ||||||
|
|
|
|
|
|
|
|||||||
| Pretax loss |
$ | (101,923 | ) | $ | (7,749 | ) | $ | (125,123 | ) | |||
| Income tax provision (benefit) |
— | 38,789 | (47,168 | ) | ||||||||
|
|
|
|
|
|
|
|||||||
| Loss from discontinued operations, net of tax |
$ | (101,923 | ) | $ | (46,538 | ) | $ | (77,955 | ) | |||
|
|
|
|
|
|
|
|||||||
| Net loss per diluted share |
$ | (1.52 | ) | $ | (0.70 | ) | $ | (1.17 | ) | |||
|
|
|
|
|
|
|
|||||||
| (1) | The income tax expense associated with the gain on sale of our International Segment approximates $87.9 million. |
| (2) | 2012 pretax loss includes income for non-profit entities within our International segment, which are not subject to income tax. |
The summary results of operations held for sale presented within results from discontinued operations above were (dollars in thousands):
| For the Year Ended December 31, | ||||||||||||
| 2014 | 2013 | 2012 | ||||||||||
| Asset Held For Sale: |
||||||||||||
| Revenue |
$ | 172,606 | $ | 177,549 | $ | 224,842 | ||||||
| Loss from discontinued operations |
$ | (66,322 | ) | $ | (81,242 | ) | $ | (33,865 | ) | |||
109
Table of Contents
Assets and Liabilities of Discontinued Operations
Assets and liabilities of discontinued operations on our consolidated balance sheets as of December 31, 2014 and 2013 include the following (dollars in thousands):
| As of December 31, | ||||||||
| 2014 | 2013 | |||||||
| Assets: |
||||||||
| Current assets: |
||||||||
| Cash and cash equivalents |
$ | — | $ | 475 | ||||
| Receivables, net |
473 | 1,521 | ||||||
| Other current assets |
— | 1,344 | ||||||
| Assets held for sale |
76,846 | 10,879 | ||||||
|
|
|
|
|
|||||
| Total current assets |
77,319 | 14,219 | ||||||
| Non-current assets: |
| |||||||
| Property and equipment, net |
— | 2,731 | ||||||
| Other assets, net |
975 | 1,507 | ||||||
| Assets held for sale |
— | 97,470 | ||||||
|
|
|
|
|
|||||
| Total assets of discontinued operations |
$ | 78,294 | $ | 115,927 | ||||
|
|
|
|
|
|||||
| Liabilities: |
||||||||
| Current liabilities: |
||||||||
| Accounts payable and accrued expenses |
$ | 579 | $ | 1,370 | ||||
| Deferred tuition revenue |
— | 1,522 | ||||||
| Remaining lease obligations |
14,927 | 13,132 | ||||||
| Liabilities held for sale |
50,357 | 19,671 | ||||||
|
|
|
|
|
|||||
| Total current liabilities |
65,863 | 35,695 | ||||||
| Non-current liabilities: |
||||||||
| Remaining lease obligations |
22,689 | 30,952 | ||||||
| Other |
170 | 6,512 | ||||||
| Liabilities held for sale |
— | 25,732 | ||||||
|
|
|
|
|
|||||
| Total liabilities of discontinued operations |
$ | 88,722 | $ | 98,891 | ||||
|
|
|
|
|
|||||
The major components of assets and liabilities held for sale presented above within discontinued operations were (dollars in thousands):
| As of December 31, | ||||||||
| 2014 | 2013 | |||||||
| Assets: |
||||||||
| Receivables, net (1) |
$ | 8,303 | $ | 7,487 | ||||
| Property and equipment, net (1) |
42,521 | 67,570 | ||||||
| Other intangible assets (1) |
18,400 | 27,300 | ||||||
| Other assets (1) |
7,622 | 5,992 | ||||||
|
|
|
|
|
|||||
| Total assets held for sale |
$ | 76,846 | $ | 108,349 | ||||
|
|
|
|
|
|||||
| Liabilities: |
||||||||
| Accounts payable and accrued expenses |
12,410 | 4,831 | ||||||
| Deferred revenue |
17,001 | 14,840 | ||||||
| Remaining lease obligations (2) |
2,253 | 2,671 | ||||||
| Other liabilities (2) |
18,693 | 23,061 | ||||||
|
|
|
|
|
|||||
| Total liabilities held for sale |
$ | 50,357 | $ | 45,403 | ||||
|
|
|
|
|
|||||
110
Table of Contents
| (1) | Property and equipment, net, other intangible assets and a portion of receivables, net and other assets are classified within non-current assets held for sale as of December 31, 2013. |
| (2) | Other liabilities and a portion of remaining lease obligations are classified within non-current liabilities held for sale as of December 31, 2013. |
Remaining Lease Obligations
A number of the campuses that ceased operations or are held for sale have remaining lease obligations that expire over time with the latest expiration in 2022. A liability is recorded representing the fair value of the remaining lease obligation at the time the space is no longer being utilized. Changes in our future remaining lease obligations, which are reflected within current and non-current liabilities of discontinued operations on our consolidated balance sheets, for the years ended December 31, 2014, 2013 and 2012, were as follows (dollars in thousands):
| Balance, Beginning of Period |
Charges Incurred (1) |
Net
Cash Payments (2) |
Other (3) | Balance, End of Period |
||||||||||||||||
| For the twelve months ended December 31, 2014 |
$ | 46,755 | $ | 14,129 | $ | (26,546 | ) | $ | 5,531 | $ | 39,869 | |||||||||
|
|
|
|
|
|
|
|
|
|
|
|||||||||||
| For the twelve months ended December 31, 2013 |
$ | 49,392 | $ | 11,855 | $ | (14,780 | ) | $ | 288 | $ | 46,755 | |||||||||
|
|
|
|
|
|
|
|
|
|
|
|||||||||||
| For the twelve months ended December 31, 2012 |
$ | 53,877 | $ | 8,689 | $ | (13,174 | ) | $ | — | $ | 49,392 | |||||||||
|
|
|
|
|
|
|
|
|
|
|
|||||||||||
| (1) | Includes charges for newly vacated spaces and subsequent adjustments for accretion, revised estimates, and variances between estimated and actual charges, net of any reversals for terminated lease obligations. |
| (2) | See Note 8 “Leases” for the future minimum lease payments under operating leases for discontinued operations as of December 31, 2014. |
| (3) | Includes existing prepaid rent and deferred rent liability balances for newly vacated spaces that are netted with the losses incurred in the period recorded. |
5. INVESTMENTS
Investments from our continuing operations consist of the following as of December 31, 2014 and 2013 (dollars in thousands):
| December 31, 2014 | ||||||||||||||||
| Gross Unrealized | ||||||||||||||||
| Cost | Gain | (Loss) | Fair Value | |||||||||||||
| Short-term investments (available for sale): |
||||||||||||||||
| Municipal bonds |
$ | 6,880 | $ | 1 | $ | (56 | ) | $ | 6,825 | |||||||
| Non-governmental debt securities |
98,400 | 1 | (271 | ) | 98,130 | |||||||||||
| Treasury and federal agencies |
17,928 | 6 | (31 | ) | 17,903 | |||||||||||
|
|
|
|
|
|
|
|
|
|||||||||
| Total short-term investments |
123,208 | 8 | (358 | ) | 122,858 | |||||||||||
|
|
|
|
|
|
|
|
|
|||||||||
| Long-term investments (available for sale): |
||||||||||||||||
| Municipal bond |
7,850 | — | (476 | ) | 7,374 | |||||||||||
|
|
|
|
|
|
|
|
|
|||||||||
| Total investments (available for sale) |
$ | 131,058 | $ | 8 | $ | (834 | ) | $ | 130,232 | |||||||
|
|
|
|
|
|
|
|
|
|||||||||
| December 31, 2013 | ||||||||||||||||
| Gross Unrealized | ||||||||||||||||
| Cost | Gain | (Loss) | Fair Value | |||||||||||||
| Short-term investments (available for sale): |
||||||||||||||||
| U.S. Treasury bills |
$ | 31,591 | $ | 1 | $ | — | $ | 31,592 | ||||||||
| Long-term investments (available for sale): |
||||||||||||||||
| Municipal bond |
7,850 | — | (476 | ) | 7,374 | |||||||||||
|
|
|
|
|
|
|
|
|
|||||||||
| Total investments (available for sale) |
$ | 39,441 | $ | 1 | $ | (476 | ) | $ | 38,966 | |||||||
|
|
|
|
|
|
|
|
|
|||||||||
111
Table of Contents
In the table above, unrealized holding losses as of December 31, 2014 relate to short-term investments that have been in a continuous unrealized loss position for less than one year. The table also includes an unrealized holding loss, greater than one year, that relates to our long-term investment in a municipal bond, which is an auction rate security (“ARS”).
Our long-term investment in a municipal bond is comprised of debt obligations issued by states, cities, counties, and other governmental entities, which earn federally tax-exempt interest. Our investment in ARS has a stated term to maturity of greater than one year, and as such, we classify our investment in ARS as non-current on our consolidated balance sheets within other assets. Auctions can “fail” when the number of sellers of the security exceeds the buyers for that particular auction period. In the event that an auction fails, the interest rate resets at a rate based on a formula determined by the individual security. The ARS for which auctions have failed continues to accrue interest and is auctioned on a set interval until the auction succeeds, the issuer calls the security, or it matures. As of December 31, 2014, we have determined this investment is at risk for impairment due to the nature of the liquidity of the market over the past several years. Cumulative unrealized losses as of December 31, 2014 amount to $0.5 million and are reflected within accumulated other comprehensive loss as a component of stockholders’ equity. We believe this impairment is temporary, as we do not intend to sell the investment and it is unlikely we will be required to sell the investment before recovery of its amortized cost basis.
Our non-governmental debt securities primarily consist of corporate bonds and commercial paper. Our treasury and federal agencies primarily consist of U.S. Treasury bills and federal home loan debt securities. We do not intend to sell our investments in these securities and it is not likely that we will be required to sell these investments before recovery of the amortized cost basis.
A schedule of available-for-sale investments segregated by their original stated terms to maturity as of December 31, 2014 and 2013, are as follows (dollars in thousands):
| Less than one year |
One to five years |
Five to ten years |
Greater than ten years |
Total | ||||||||||||||||
| Original stated term to maturity of available-for-sale-investments as of December 31, 2014 |
$ | 77,177 | $ | 44,182 | $ | 211 | $ | 8,662 | $ | 130,232 | ||||||||||
| Original stated term to maturity of available-for-sale-investments as of December 31, 2013 |
$ | 31,592 | $ | — | $ | — | $ | 7,374 | $ | 38,966 | ||||||||||
Realized gains or losses resulting from sales of investments during the years ended December 31, 2014, 2013 and 2012 were not significant.
Fair Value Measurements
FASB ASC Topic 820 – Fair Value Measurements establishes a three-tier fair value hierarchy, which prioritizes the inputs used in measuring fair value. These tiers include: Level 1, defined as observable inputs such as quoted prices in active markets; Level 2, defined as inputs other than quoted prices in active markets that are either directly or indirectly observable; and Level 3, defined as unobservable inputs in which little or no market data exists, therefore requiring an entity to develop its own assumptions.
As of December 31, 2014, we held investments that are required to be measured at fair value on a recurring basis. These investments (available-for-sale) consist of non-governmental debt securities, treasury and federal agencies and municipal bonds that are publicly traded and for which market prices are readily available, and our investment in an ARS. Available for sale securities included in Level 2 are estimated based on observable inputs other than quoted prices in active markets for identical assets and liabilities, quoted prices for identical or similar assets or liabilities in inactive markets, or other inputs that are observable or can be corroborated by observable market data for substantially the full term of the assets or liabilities. During the first quarter of 2014, we reclassified our investments in U.S Treasury bills from Level 1 classification to Level 2. The fair value for these
112
Table of Contents
investments was not based on identical assets as of March 31, 2014 which resulted in this reclassification. Our investment in an ARS is categorized as Level 3 and fair value is estimated utilizing a discounted cash flow analysis as of December 31, 2014 which considers, among other items, the collateralization underlying the security investment, the credit worthiness of the counterparty, the time of expected future cash flows, and the expectation of the next time the security is expected to have a successful auction. The auction event for our ARS investment has failed for multiple years. The security was also compared, when possible, to other observable market data with similar characteristics.
Investments measured at fair value on a recurring basis subject to the disclosure requirements of FASB ASC Topic 820 – Fair Value Measurements at December 31, 2014 and 2013 were as follows (dollars in thousands):
| As of December 31, 2014 | ||||||||||||||||
| Level 1 | Level 2 | Level 3 | Total | |||||||||||||
| Municipal bonds |
$ | — | $ | 6,825 | $ | 7,374 | $ | 14,199 | ||||||||
| Non-governmental debt securities |
— | 98,130 | — | 98,130 | ||||||||||||
| Treasury and federal agencies |
— | 17,903 | — | 17,903 | ||||||||||||
|
|
|
|
|
|
|
|
|
|||||||||
| Totals |
$ | — | $ | 122,858 | $ | 7,374 | $ | 130,232 | ||||||||
|
|
|
|
|
|
|
|
|
|||||||||
| As of December 31, 2013 | ||||||||||||||||
| Level 1 | Level 2 | Level 3 | Total | |||||||||||||
| U.S. Treasury bills |
$ | 31,592 | $ | — | $ | — | $ | 31,592 | ||||||||
| Municipal bond |
— | — | 7,374 | 7,374 | ||||||||||||
|
|
|
|
|
|
|
|
|
|||||||||
| Totals |
$ | 31,592 | $ | — | $ | 7,374 | $ | 38,966 | ||||||||
|
|
|
|
|
|
|
|
|
|||||||||
The following table presents a rollforward of our assets measured at fair value on a recurring basis using significant unobservable inputs (Level 3) as defined in FASB ASC Topic 820 for the year to date ended December 31, 2014 (dollars in thousands):
| Balance at December 31, 2013 |
$ | 7,374 | ||
| Unrealized loss |
— | |||
|
|
|
|||
| Balance at December 31, 2014 |
$ | 7,374 | ||
|
|
|
See Note 7 “Property and Equipment” and Note 9 “Goodwill and Other Intangible Assets” for further information regarding non-recurring fair value measurements.
Equity Method Investment
Our investment in an equity affiliate, which is recorded within other noncurrent assets on our consolidated balance sheet, represents an international investment in a private company. As of December 31, 2014, our investment in an equity affiliate equated to a 30.7%, or $4.8 million, non-controlling interest in CCKF, a Dublin-based educational technology company providing intelligent adaptive systems to power the delivery of individualized and personalized learning. During the fourth quarter of 2014, we increased our investment in CCKF to 30.7% through a $3.2 million additional investment, thus requiring us to record this investment under the equity method. Prior to our additional investment, we accounted for our investment in CCKF as a cost method investment because we had less than a 20% interest and did not have significant influence. As a result of this increase in investment, we recorded a retroactive adjustment to account for the investment and applied the equity method for all prior periods in which the investment was held in accordance with ASC Topic 323 – Investments – Equity Method and Joint Ventures. Accordingly, we did not adjust prior period financial statements or information as the impact of the change in accounting method was not material to any individual year. The retroactive cumulative adjustment increased retained earnings as of January 1, 2014 by $0.1 million. Additionally, we recorded less than $0.1 million of income related to our proportionate investment in CCKF for the year ended December 31, 2014.
113
Table of Contents
6. STUDENT RECEIVABLES
Student receivables represent funds owed to us in exchange for the educational services provided to a student. Student receivables are reflected net of an allowance for doubtful accounts and net of deferred tuition revenue. Student receivables, net are reflected on our consolidated balance sheets as components of both current and non-current assets. We do not accrue interest on past due student receivables; interest is recorded only upon collection.
Generally, a student receivable balance is written off once it reaches greater than 90 days past due. Although we analyze past due receivables, it is not practical to provide an aging of our non-current student receivable balances as a result of the methodology utilized in determining our earned student receivable balances. Student receivables are recognized on our consolidated balance sheets as they are deemed earned over the course of a student’s program and/or term, and therefore cash collections are not applied against specifically dated transactions.
Our standard student receivable allowance estimation methodology considers a number of factors that, based on our collection experience, we believe have an impact on our repayment risk and ability to collect student receivables. Changes in the trends in any of these factors may impact our estimate of the allowance for doubtful accounts. These factors include, but are not limited to: internal repayment history, repayment practices of previous extended payment programs and information provided by a third-party institution who previously offered similar extended payment programs, changes in the current economic, legislative or regulatory environments and credit worthiness of our students. These factors are monitored and assessed on a regular basis. Overall, our allowance estimation process for student receivables is validated by trending analysis and comparing estimated and actual performance. The repayment risk associated with student receivables under extended payment plans is generally higher than those not related to extended payment plans; as such, the allowance for doubtful accounts for these student receivables as a percentage of outstanding student receivables is higher.
Student Receivables Under Extended Payment Plans and Recourse Loan Agreements
To assist students in completing their educational programs, we had previously provided extended payment plans to certain students and also had loan agreements with Sallie Mae and Stillwater National Bank and Trust Company (“Stillwater”) which required us to repurchase loans originated by them to our students after a certain period of time. We discontinued providing extended payment plans to students during the first quarter of 2011 and the recourse loan agreements with Sallie Mae and Stillwater ended in March 2008 and April 2007, respectively.
As of December 31, 2014 and December 31, 2013, the amount of non-current student receivables under these programs, net of allowance for doubtful accounts and net of deferred tuition revenue, was $2.9 million and $3.3 million, respectively.
Student Receivables Valuation Allowance
Changes in our current and non-current receivables allowance for the years ended December 31, 2014, 2013 and 2012 were as follows (dollars in thousands):
| Balance, Beginning of Period |
Charges to Expense (1) |
Amounts Written-off |
Balance, End of Period |
|||||||||||||
| For the year ended December 31, 2014 |
$ | 17,570 | $ | 15,850 | $ | (18,903 | ) | $ | 14,517 | |||||||
|
|
|
|
|
|
|
|
|
|||||||||
| For the year ended December 31, 2013 |
$ | 21,524 | $ | 20,418 | $ | (24,372 | ) | $ | 17,570 | |||||||
|
|
|
|
|
|
|
|
|
|||||||||
| For the year ended December 31, 2012 |
$ | 26,371 | $ | 21,914 | $ | (26,761 | ) | $ | 21,524 | |||||||
|
|
|
|
|
|
|
|
|
|||||||||
| (1) | Charges to expense include an offset for recoveries of amounts previously written off of $5.7 million, $5.1 million and $6.1 million for the years ended December 31, 2014, 2013 and 2012, respectively. |
114
Table of Contents
Fair Value Measurements
The carrying amount reported in our consolidated balance sheets for the current portion of student receivables approximates fair value because of the nature of these financial instruments as they generally have short maturity periods. It is not practicable to estimate the fair value of the non-current portion of student receivables, since observable market data is not readily available, and no reasonable estimation methodology exists.
7. PROPERTY AND EQUIPMENT
The cost basis and estimated useful lives of property and equipment for continuing operations as of December 31, 2014 and 2013 are as follows (dollars in thousands):
| December 31, | ||||||||||
| 2014 | 2013 | Life | ||||||||
| Leasehold improvements |
$ | 174,026 | $ | 182,260 | Shorter of Life of Lease or Useful Life | |||||
| Computer hardware and software |
121,136 | 134,866 | 3 years | |||||||
| Furniture, fixtures and equipment |
90,671 | 94,493 | 5-10 years | |||||||
| Building and improvements |
8,656 | 8,625 | 15-35 years | |||||||
| Library materials |
3,840 | 4,004 | 10 years | |||||||
| Vehicles |
778 | 819 | 5 years | |||||||
| Construction in progress |
372 | 753 | ||||||||
|
|
|
|
|
|||||||
| 399,479 | 425,820 | |||||||||
| Less-Accumulated depreciation |
(326,396 | ) | (313,725 | ) | ||||||
|
|
|
|
|
|||||||
| Total property and equipment, net |
$ | 73,083 | $ | 112,095 | ||||||
|
|
|
|
|
|||||||
Depreciation expense for continuing operations for the years ended December 31, 2014, 2013 and 2012, was $35.2 million, $44.0 million and $47.1 million, respectively. Depreciation expense for discontinued operations, included in loss from discontinued operations, was $19.4 million, $27.8 million and $32.3 million for the years ended December 31, 2014, 2013 and 2012, respectively.
Property and equipment was affected by asset impairment charges of approximately $14.7 million for the year ended December 31, 2014 and $7.0 million for the year ended December 31, 2013, as a result of the reduction in carrying values for campuses that are being taught out, decisions made to exit certain leased facilities, and for certain long-lived assets related to ongoing institutions which are expected to generate negative cash flows through the respective lease end dates and as such the carrying values were not recoverable. The fair value for these assets was determined based upon management’s assumptions regarding an estimated percentage of replacement value for similar assets and estimated salvage values. Because the determination of the estimated fair value of these assets requires significant estimation and assumptions, these fair value measurements are categorized as Level 3 per ASC Topic 820.
8. LEASES
We lease most of our administrative and educational facilities and certain equipment under non-cancelable operating leases expiring at various dates through 2023. Lease terms generally range from five to ten years with one to two renewal options for extended terms. In most cases, we are required to make additional payments under facility operating leases for taxes, insurance and other operating expenses incurred during the operating lease period.
Certain of our leases contain rent escalation clauses or lease incentives, including rent abatements and tenant improvement allowances. Rent escalation clauses and lease incentives are taken into account in determining total rent expense to be recognized during the term of the lease, which begins on the date we take control of the leased
115
Table of Contents
space. Renewal options are considered when determining the overall lease term. In accordance with FASB ASC Topic 840 – Leases, differences between periodic rent expense and periodic cash rental payments, caused primarily by the recognition of rent expense on a straight-line basis and tenant improvement allowances due or received from lessors, are recorded as deferred rent obligations on our consolidated balance sheets.
Rent expense, exclusive of related taxes, insurance, and maintenance costs, for continuing operations totaled approximately $48.5 million, $55.0 million and $58.5 million for the years ended December 31, 2014, 2013 and 2012, respectively, and is reflected in educational services and facilities expense in our consolidated statements of loss and comprehensive loss. Rent expense for discontinued operations, which is included in loss from discontinued operations, was approximately $34.5 million, $54.4 million and $51.8 million for the years ended December 31, 2014, 2013 and 2012, respectively.
Remaining Lease Obligations
We have recorded lease exit costs associated with the exit of real estate space for certain campuses related to our continuing operations. These costs are recorded within educational services and facilities expense on our consolidated statements of loss and comprehensive loss. The current portion of the liability for these charges is reflected within other accrued expenses under current liabilities and the long-term portion of these charges are included in other liabilities under the non-current liabilities section of our consolidated balance sheets. Changes in our future minimum lease obligations for exited space related to our continuing operations for the years ended December 31, 2014, 2013 and 2012 were as follows (dollars in thousands):
| Balance, Beginning of Period |
Charges Incurred (1) |
Net Cash Payments |
Other (2) | Balance, End of Period |
||||||||||||||||
| For the year ended December 31, 2014 |
$ | 4,588 | $ | 4,043 | $ | (3,783 | ) | $ | (7 | ) | $ | 4,841 | ||||||||
|
|
|
|
|
|
|
|
|
|
|
|||||||||||
| For the year ended December 31, 2013 |
$ | 6,147 | $ | 1,905 | $ | (6,746 | ) | $ | 3,282 | $ | 4,588 | |||||||||
|
|
|
|
|
|
|
|
|
|
|
|||||||||||
| For the year ended December 31, 2012 |
$ | 4,915 | $ | 2,931 | $ | (1,699 | ) | $ | — | $ | 6,147 | |||||||||
|
|
|
|
|
|
|
|
|
|
|
|||||||||||
| (1) | Includes charges for newly vacated spaces and subsequent adjustments for accretion, revised estimates and variances between estimated and actual charges, net of any reversals for terminated lease obligations. |
| (2) | Includes existing prepaid rent and deferred rent liability balances for newly vacated spaces that offset the losses incurred in the period recorded. |
As of December 31, 2014, future minimum lease payments under operating leases for continuing and discontinued operations are as follows (dollars in thousands):
| Operating Leases | ||||||||||||
| Continuing Operations |
Discontinued Operations |
Total | ||||||||||
| 2015 |
$ | 47,467 | $ | 40,473 | $ | 87,940 | ||||||
| 2016 |
41,093 | 36,273 | 77,366 | |||||||||
| 2017 |
36,754 | 29,403 | 66,157 | |||||||||
| 2018 |
35,738 | 22,077 | 57,815 | |||||||||
| 2019 |
27,850 | 13,116 | 40,966 | |||||||||
| 2020 and thereafter |
35,917 | 11,009 | 46,926 | |||||||||
|
|
|
|
|
|
|
|||||||
| Total |
$ | 224,819 | $ | 152,351 | $ | 377,170 | ||||||
|
|
|
|
|
|
|
|||||||
Of the remaining $224.8 million of lease payments for continuing operations, $40.3 million relates to our Transitional Group leases and of the remaining $152.4 million lease obligations for discontinued operations, $98.8 million relate to our assets held for sale. See Note 4 “Discontinued Operations” and Note 10 “Restructuring Charges” for further discussion.
116
Table of Contents
As of December 31, 2014, future minimum sublease rental income under operating leases, which will decrease our future minimum lease payments presented above, for continuing and discontinued operations is as follows (dollars in thousands):
| Operating Subleases | ||||||||||||
| Continuing Operations |
Discontinued Operations |
Total | ||||||||||
| 2015 |
$ | 2,376 | $ | 6,202 | $ | 8,578 | ||||||
| 2016 |
981 | 6,216 | 7,197 | |||||||||
| 2017 |
796 | 6,206 | 7,002 | |||||||||
| 2018 |
656 | 1,955 | 2,611 | |||||||||
| 2019 |
674 | 1,147 | 1,821 | |||||||||
| 2020 and thereafter |
691 | 376 | 1,067 | |||||||||
|
|
|
|
|
|
|
|||||||
| Total |
$ | 6,174 | $ | 22,102 | $ | 28,276 | ||||||
|
|
|
|
|
|
|
|||||||
9. GOODWILL AND OTHER INTANGIBLE ASSETS
Changes in the carrying amount of goodwill for continuing operations during the years ended December 31, 2014 and 2013 are as follows by segment (dollars in thousands):
| CTU | AIU | Career Colleges |
Transitional | Total | ||||||||||||||||
| Goodwill balance as of December 31, 2012 (1) |
$ | 45,938 | $ | 41,418 | $ | — | $ | — | $ | 87,356 | ||||||||||
| Goodwill impairment |
— | — | — | — | — | |||||||||||||||
|
|
|
|
|
|
|
|
|
|
|
|||||||||||
| Goodwill balance as of December 31, 2013 and 2014 |
$ | 45,938 | $ | 41,418 | $ | — | $ | — | $ | 87,356 | ||||||||||
|
|
|
|
|
|
|
|
|
|
|
|||||||||||
| (1) | Goodwill impairments of approximately $74.6 million were recorded during the year ended December 31, 2012. |
We performed our annual impairment testing of goodwill as of October 1, 2014 and determined that none of our reporting units were at risk of failing the first step of the goodwill impairment test as of October 1, 2014.
In calculating the fair value for CTU and AIU, we performed extensive valuation analyses, utilizing both income and market approaches, in our goodwill assessment process. The following describes the valuation methodologies used to derive the fair value of our reporting units:
| • | Income Approach: To determine the estimated fair value of each reporting unit, we discount the expected cash flows which are developed by management. We estimate our future cash flows after considering current economic conditions and trends, estimated future operating results, our views of growth rates and anticipated future economic and regulatory conditions. The discount rate used represents the estimated weighted average cost of capital, which reflects the overall level of inherent risk involved in our future expected cash flows and the rate of return an outside investor would expect to earn. To estimate cash flows beyond the final year of our models, we use a terminal value approach and incorporate the present value of the resulting terminal value into our estimate of fair value. |
| • | Market-Based Approach: To corroborate the results of the income approach described above, we estimate the fair value of our reporting units using several market-based approaches, including the guideline company method, which focuses on comparing our risk profile and growth prospects to select reasonably similar publicly traded companies. |
The determination of estimated fair value of each reporting unit requires significant estimates and assumptions, and as such, these fair value measurements are categorized as Level 3 per ASC Topic 820. These estimates and assumptions primarily include, but are not limited to, the discount rate, terminal growth rates,
117
Table of Contents
operating cash flow projections and capital expenditure forecasts. Due to the inherent uncertainty involved in deriving those estimates, actual results could differ from those estimates. We evaluate the merits of each significant assumption used, both individually and in the aggregate, to determine the fair value of each reporting unit for reasonableness.
As of December 31, 2014 and 2013, the cost basis, accumulated amortization and net book value of intangible assets for continuing operations are as follows (dollars in thousands):
| December 31, 2014 | December 31, 2013 | |||||||||||||||||||||||
| Cost | Accumulated Amortization |
Net Book Value |
Cost | Accumulated Amortization |
Net Book Value |
|||||||||||||||||||
| Amortizable intangible assets: |
||||||||||||||||||||||||
| Courseware |
$ | 9,656 | $ | (9,656 | ) | $ | — | $ | 9,656 | $ | (9,091 | ) | $ | 565 | ||||||||||
| Trade name |
438 | (219 | ) | 219 | — | — | — | |||||||||||||||||
| Other |
96 | (96 | ) | — | 96 | (77 | ) | 19 | ||||||||||||||||
|
|
|
|
|
|
|
|
|
|
|
|
|
|||||||||||||
| Amortizable intangible assets, net |
$ | 10,190 | $ | (9,971 | ) | $ | 219 | $ | 9,752 | $ | (9,168 | ) | $ | 584 | ||||||||||
|
|
|
|
|
|
|
|
|
|
|
|
|
|||||||||||||
| Non-amortizable intangible assets: |
||||||||||||||||||||||||
| Accreditation, licensing, and Title IV Program participation rights |
$ | 1,000 | $ | 1,000 | ||||||||||||||||||||
| Trade names |
8,600 | 11,233 | ||||||||||||||||||||||
|
|
|
|
|
|||||||||||||||||||||
| Non-amortizable intangible assets |
9,600 | 12,233 | ||||||||||||||||||||||
|
|
|
|
|
|||||||||||||||||||||
| Intangible assets, net |
$ | 9,819 | $ | 12,817 | ||||||||||||||||||||
|
|
|
|
|
|||||||||||||||||||||
Amortizable intangible assets are amortized on a straight-line basis over their estimated useful lives; remaining useful lives for these assets are one year as of December 31, 2014. During the first quarter of 2014, we made the decision to simplify our structure and began to consolidate many of our institutions under one brand. Accordingly, we determined that the trade name associated with Missouri College should no longer be classified as indefinite-lived, and was reclassified to definite-lived. We assigned a remaining useful life of 24 months based upon the timing of when the trade name for this institution was expected to change. Amortization expense from continuing operations was $0.8 million, $1.2 million and $1.3 million, for the years ended December 31, 2014, 2013 and 2012, respectively.
As of December 31, 2014, net intangible assets include certain accreditation, licensing, and Title IV Program participation rights and trade names that are considered to have indefinite useful lives and, in accordance with FASB ASC Topic 350 – Intangibles – Goodwill and Other, are not subject to amortization but rather reviewed for impairment on at least an annual basis by applying a fair-value-based test.
During 2014, in conjunction with our quarterly review processes, we concluded that certain indicators, including variation from previously projected revenue results, existed to suggest the Sanford-Brown trade name was at risk of its carrying value exceeding its respective fair value. We calculated the fair value of our trade name in accordance with FASB ASC Topic 820 – Fair Value Measurement, by utilizing the relief from royalty method under the income approach. The determination of estimated fair value for trade name requires significant estimates and assumptions, and as such is categorized as Level 3 per ASC Topic 820. The assumptions utilized in determining the fair value of the Sanford-Brown trade name included utilizing projected revenue growth rates, a discount rate of approximating 25%, royalty rate of 0.5% and a terminal growth rate of approximately 2%. As a result of the assessment, we recorded a $0.7 million trade name impairment charge for Sanford-Brown. This impairment was recorded in the fourth quarter of 2014 and is in addition to impairment of $1.5 million recorded during the third quarter of 2014. The value of the Sanford-Brown trade names is $1.7 million as of December 31, 2014.
Additionally, we performed our annual impairment testing of indefinite-lived intangible asset balances as of October 1, 2014 and concluded that no indicators existed that would suggest that it is more likely than not that
118
Table of Contents
the remaining assets would be impaired. Due to the inherent uncertainty involved in deriving those estimates, actual results could differ from those estimates. We evaluate the merits of each significant assumption used, both individually and in the aggregate, to determine the fair value for reasonableness. Although we believe our projected future operating results and cash flows and related estimates regarding fair value are based on reasonable assumptions, historically projected operating results and cash flows have not always been achieved. However, for sensitivity purposes, and with all other inputs remaining equal, a 100 basis point change in the discount rate utilized in the calculation would result in a change in the fair value of approximately $0.1 million. We continue to monitor the operating results and revenue projections related to our trade name on a quarterly basis for signs of possible further declines in estimated fair value and trade name impairment.
10. RESTRUCTURING CHARGES
During the past several years, we have carried out reductions in force related to the continued reorganization of our corporate and campus functions to better align with current total enrollments and made decisions to teach out a number of campuses, meaning gradually close the campuses through an orderly process. Most notably, we have recorded charges within our Career Colleges segment and our corporate functions as we continue to align our overall management structure. The remaining Transitional Group campuses that are in the process of teaching out as of December 31, 2014 will cease operations at various dates through 2017. See Item 1, “Business,” for a listing of campuses that comprise our Transitional Group segment.
The following table details the changes in our accrual for severance and related costs associated with all of these restructuring events for our continuing operations during the years ended December 31, 2014 and 2013 (dollars in thousands):
| Balance, Beginning of Period |
Severance and related charges (1) |
Payments | Non-cash adjustments (2) |
Balance, End of Period |
||||||||||||||||
| For the year ended December 31, 2014 |
$ | 3,243 | $ | 3,524 | $ | (2,885 | ) | $ | (1,181 | ) | $ | 2,701 | ||||||||
|
|
|
|
|
|
|
|
|
|
|
|||||||||||
| For the year ended December 31, 2013 |
$ | 5,574 | $ | 5,084 | $ | (6,665 | ) | $ | (750 | ) | $ | 3,243 | ||||||||
|
|
|
|
|
|
|
|
|
|
|
|||||||||||
| (1) | Includes payments related to COBRA and outplacement services which are assumed to be completed by the third month following an employee’s departure. |
| (2) | Includes cancellations due to employee departures prior to agreed upon end dates, employee transfers to open positions within the organization and subsequent adjustments to severance and related costs. |
Severance and related expenses for the years ended December 31, 2014 and 2013 by reporting segment is as follows (dollars in thousands):
| For the Year Ended December 31, | ||||||||
| 2014 | 2013 | |||||||
| CTU |
$ | 544 | $ | — | ||||
| AIU |
103 | 213 | ||||||
|
|
|
|
|
|||||
| Total University Group |
647 | 213 | ||||||
|
|
|
|
|
|||||
| Career Colleges |
1,093 | 1,351 | ||||||
| Corporate and Other |
1,087 | 2,088 | ||||||
|
|
|
|
|
|||||
| Subtotal |
2,827 | 3,652 | ||||||
|
|
|
|
|
|||||
| Transitional Group |
697 | 1,432 | ||||||
|
|
|
|
|
|||||
| Total |
$ | 3,524 | $ | 5,084 | ||||
|
|
|
|
|
|||||
The current portion of the accrual for severance and related charges was $1.7 million as of December 31, 2014 and 2013, which is recorded within current accrued expenses – payroll and related benefits; the long-term portion of $1.0 million and $1.5 million is recorded within other non-current liabilities on our consolidated balance sheets as of December 31, 2014 and 2013, respectively.
119
Table of Contents
In addition, as of December 31, 2014, we have an accrual of approximately $0.7 million related to retention bonuses that have been offered to certain employees. These amounts are recorded ratably over the period the employees are retained; $0.9 million was recorded during the year ended December 31, 2014.
In addition to the charges detailed above, a number of these campuses will have remaining lease obligations following the eventual campus closure, with the longest lease term being through 2021. The total estimated charge related to the remaining lease obligation for these leases, once the campus completes the close process, and adjusted for possible lease buyouts and sublease assumptions is approximately $12.0 million. The amount related to each campus will be recorded at each campus closure date based on current estimates and assumptions related to the amount and timing of sublease income. See Note 8 “Leases” for details regarding our gross remaining lease obligations for our Transitional Group.
11. CREDIT AGREEMENT
On October 31, 2014, the Company; its wholly-owned subsidiary, CEC Educational Services, LLC (“CEC-ES”); and the subsidiary guarantors thereunder entered into a First Amendment (the “First Amendment”) to its Amended and Restated Credit Agreement dated as of December 30, 2013 (as amended, the “Credit Agreement”) with BMO Harris Bank N.A. (“BMO Harris”), in its capacities as the initial lender and letter of credit issuer thereunder and the administrative agent for the lenders which from time to time may be parties to the Credit Agreement, to among other things, increase the revolving credit facility to $120.0 million. The revolving credit facility under the Credit Agreement is scheduled to mature on June 30, 2016. The Credit Agreement requires that fees and interest are payable monthly and quarterly in arrears, respectively, and principal is payable at maturity. Any borrowings bear interest at fluctuating interest rates based on either the base rate or the London Interbank Offered Rate (LIBOR), plus the applicable rate based on the type of loan.
We may prepay amounts outstanding, or terminate or reduce the commitments, under the Credit Agreement upon three or five business days’ prior notice, respectively, in each case without premium or penalty. The Credit Agreement contains customary affirmative, negative and financial maintenance covenants, including a requirement to maintain a three month average balance of cash, cash equivalents and permitted investments in our domestic accounts of at least $190.0 million at all times, subject to adjustment for certain cash payments made by the Company in connection with buyouts of leases for campus locations and other facilities. The loans and letter of credit obligations under the Credit Agreement are secured by 100% cash collateral. The agreement also contains customary representations and warranties, events of default, and rights and remedies upon the occurrence of any event of default, including rights to accelerate the loans, terminate the commitments and rights to realize upon the collateral securing the obligations under the Credit Agreement.
We have $10.0 million outstanding as of December 31, 2014, pursuant to the revolving credit facility under the Credit Agreement. The full amount borrowed as of December 31, 2014 is classified as short-term borrowings on our consolidated balance sheet.
Selected details of our credit agreements as of and for the years ended December 31, 2014 and 2013 were as follows (dollars in thousands):
| As of December 31, | ||||||||
| 2014 | 2013 | |||||||
| Credit Agreement: |
||||||||
| Credit facility remaining availability |
$ | 98,437 | $ | 70,000 | ||||
| Credit facility borrowings |
$ | 10,000 | $ | — | ||||
| Outstanding letters of credit (1)(2) |
$ | 11,563 | $ | 12,318 | ||||
| Availability of additional letters of credit (3) |
$ | 8,437 | $ | 7,682 | ||||
| Weighted average daily revolving credit borrowings for the year ended |
$ | 9 | $ | 40 | ||||
| Weighted average annual interest rate |
1.67 | % | 5.25 | % | ||||
| Commitment fee rate |
0.25 | % | 0.25 | % | ||||
| Letter of credit fee rate |
0.75 | % | 0.75 | % | ||||
120
Table of Contents
| (1) | Represents letters of credit which are fully collateralized with $11.6 million and $12.6 million of restricted cash as of December 31, 2014 and 2013, respectively. |
| (2) | As of December 31, 2014, outstanding letters of credit not related to the Credit Agreement totaled $1.3 million, which amount is fully collateralized with restricted cash, which is in addition to the $11.6 million reflected above. |
| (3) | The letters of credit sublimit of $20.0 million under the Credit Agreement is part of, not in addition to, the $120.0 million aggregate commitments. |
12. CONTINGENCIES
An accrual for estimated legal fees and settlements of $2.3 million and $20.3 million at December 31, 2014 and December 31, 2013, respectively, is presented within other current liabilities on our consolidated balance sheets. This decrease was primarily a result of payment of $17.0 million for a legal settlement during 2014 which was included in our accrual balance as of December 31, 2013.
We record a liability when we believe that it is both probable that a loss will be incurred and the amount of loss can be reasonably estimated. We evaluate, at least quarterly, developments in our legal matters that could affect the amount of liability that was previously accrued, and make adjustments as appropriate. Significant judgment is required to determine both probability and the estimated amount. We may be unable to estimate a possible loss or range of possible loss due to various reasons, including, among others: (1) if the damages sought are indeterminate; (2) if the proceedings are in early stages; (3) if there is uncertainty as to the outcome of pending appeals, motions, or settlements; (4) if there are significant factual issues to be determined or resolved; and (5) if there are novel or unsettled legal theories presented. In such instances, there is considerable uncertainty regarding the ultimate resolution of such matters, including a possible eventual loss, if any.
Litigation
We are, or were, a party to the following legal proceedings that we consider to be outside the scope of ordinary routine litigation incidental to our business. Due to the inherent uncertainties of litigation, we cannot predict the ultimate outcome of these matters. An unfavorable outcome of any one or more of these matters could have a material adverse impact on our business, results of operations, cash flows and financial position.
Student Litigation
Enea, et al. v. Career Education Corporation, California Culinary Academy, Inc., SLM Corporation, and Sallie Mae, Inc. Plaintiffs filed this putative class action in the Superior Court State of California, County of San Francisco, on or about June 27, 2013. Plaintiffs allege that CCA materially misrepresented the placement rates of its graduates, falsely stated that admission to the culinary school was competitive and that the school had an excellent reputation among restaurants and other food service providers, represented that the culinary schools were well-regarded institutions producing skilled graduates who employers eagerly hired, and lied by telling students that the school provided graduates with career placement services for life. The class purports to consist of persons who executed Parent Plus loans or co-signed loans for students who attended CCA at any time between January 1, 2003 and December 31, 2008. Plaintiffs seek restitution, damages, civil penalties and attorneys’ fees.
Defendants filed a motion to dismiss and to strike class action allegations on October 31, 2013. A hearing on the motions was conducted on March 14, 2014. Thereafter, the Court issued two separate orders granting the motion to strike the class allegations and the motion to dismiss without leave to amend. Plaintiffs filed a motion seeking leave to file a third amended complaint and/or for reconsideration of the Court’s orders. On May 9, 2014, the Court denied plaintiffs’ motion to reconsider its order striking the class allegations and granted plaintiffs leave to file a third amended complaint as to some, but not all, of plaintiffs’ claims. On May 15, 2014, plaintiffs appealed the Court’s ruling with respect to the motion to strike the class allegations. The Court has stayed the case pending a ruling on the appeal.
121
Table of Contents
Because of the many questions of fact and law that may arise in the future, the outcome of this legal proceeding is uncertain at this point. Based on information available to us at present, we cannot reasonably estimate a range of potential loss, if any, for this action because, among other things, our potential liability depends on whether a class is certified and, if so, the composition and size of any such class, as well as on an assessment of the appropriate measure of damages if we were to be found liable. Accordingly, we have not recognized any liability associated with this action.
Surrett, et al. v. Western Culinary Institute, Ltd. and Career Education Corporation. On March 5, 2008, a complaint was filed in Portland, Oregon in the Circuit Court of the State of Oregon in and for Multnomah County naming Western Culinary Institute, Ltd. (“WCI”) and the Company as defendants. Plaintiffs filed the complaint individually and as a putative class action and alleged two claims for equitable relief: violation of Oregon’s Unlawful Trade Practices Act (“UTPA”) and unjust enrichment. Plaintiffs filed an amended complaint on April 10, 2008, which added two claims for money damages: fraud and breach of contract. Plaintiffs allege WCI made a variety of misrepresentations to them, relating generally to WCI’s placement statistics, students’ employment prospects upon graduation from WCI, the value and quality of an education at WCI, and the amount of tuition students could expect to pay as compared to salaries they could expect to earn after graduation. WCI subsequently moved to dismiss certain of plaintiffs’ claims under Oregon’s UTPA; that motion was granted on September 12, 2008. On February 5, 2010, the Court entered a formal Order granting class certification on part of plaintiff’s UTPA and fraud claims purportedly based on omissions, denying certification of the rest of those claims and denying certification of the breach of contract and unjust enrichment claims. The class consists of students who enrolled at WCI between March 5, 2006 and March 1, 2010, excluding those who dropped out or were dismissed from the school for academic reasons.
Plaintiffs filed a fifth amended complaint on December 7, 2010, which included individual and class allegations by Nathan Surrett. Class notice was sent on April 22, 2011, and the opt-out period expired on June 20, 2011. The class consisted of approximately 2,600 members. They are seeking tuition refunds, interest and certain fees paid in connection with their enrollment at WCI.
On May 23, 2012, WCI filed a motion to compel arbitration of claims by 1,062 individual class members who signed enrollment agreements containing express class action waivers. The Court issued an Order denying the motion on July 27, 2012. On August 6, 2012, WCI filed an appeal from the Court’s Order and on August 30, 2012, the Court of Appeals issued an Order granting WCI’s motion to compel the trial court to cease exercising jurisdiction in the case. The oral argument on the appeal was heard on May 9, 2014 and we are awaiting the Court’s decision. All proceedings with the trial court have been stayed pending the outcome of the appeal.
Because of the many questions of fact and law that have already arisen and that may arise in the future, the outcome of this legal proceeding is uncertain at this point. Based on information available to us at present, we cannot reasonably estimate a range of potential loss, if any, for this action because of the inherent difficulty in assessing the appropriate measure of damages and the number of class members who might be entitled to recover damages, if we were to be found liable. Accordingly, we have not recognized any liability associated with this action.
False Claims Act
United States of America, ex rel. Melissa Simms Powell, et al. v. American InterContinental University, Inc., a Georgia Corporation, Career Education Corp., a Delaware Corporation and John Doe Nos. 1-100. On July 28, 2009, we were served with a complaint filed in the U.S. District Court for the Northern District of Georgia, Atlanta Division. The complaint was originally filed under seal on July 14, 2008 by four former employees of the Dunwoody campus of our American InterContinental University on behalf of themselves and the federal government. On July 27, 2009, the Court ordered the complaint unsealed and we were notified that the U.S. Department of Justice declined to intervene in the action. When the federal government declines to intervene in a False Claims Act action, as it has done in this case, the private plaintiffs (or “relators”) may elect
122
Table of Contents
to pursue the litigation on behalf of the federal government and, if they are successful, receive a portion of the federal government’s recovery. The action alleges violations of the False Claims Act and promissory fraud, including allegedly providing false certifications to the federal government regarding compliance with certain provisions of the Higher Education Act and accreditation standards. Relators claim that defendants’ conduct caused the government to pay federal funds to defendants and to make payments to third-party lenders, which the government would not have made if not for defendants’ alleged violation of the law. Relators seek treble damages plus civil penalties and attorneys’ fees. On July 12, 2012, the Court granted our motion to dismiss for a lack of jurisdiction, the claims related to incentive compensation and proof of graduation. Thus, the only claim that remained pending against defendants was based on relators’ contention that defendants misled the school’s accreditor, Southern Association of Colleges and Schools, during the accreditation process. On December 16, 2013, we filed a motion for summary judgment on a variety of substantive grounds. On September 29, 2014, the Court granted our motion for summary judgment and entered judgment in our favor. On October 2, 2014, relators filed a notice of appeal.
Because of the many questions of fact and law that may arise on appeal, the outcome of this legal proceeding is uncertain at this point. Based on information available to us at present, we cannot reasonably estimate a range of potential loss, if any, for this action because the complaint does not seek a specified amount of damages and it is unclear how damages would be calculated, if we were to be found liable. Moreover, the case presents novel legal issues. Accordingly, we have not recognized any liability associated with this action.
United States of America, ex rel. Brent M. Nelson v. Career Education Corporation, Sanford-Brown, Ltd., and Ultrasound Technical Services, Inc. On April 18, 2013, defendants were served with an amended complaint filed in the U.S. District Court for the Eastern District of Wisconsin. The original complaint was filed under seal on July 30, 2012 by a former employee of Sanford-Brown College Milwaukee on behalf of himself and the federal government. On February 27, 2013, the Court ordered the complaint unsealed and we were notified that the U.S. Department of Justice declined to intervene in the action. After the federal government declined to intervene in this case, the relator elected to pursue the litigation on behalf of the federal government. If he is successful he would receive a portion of the federal government’s recovery. An amended complaint was filed by the relator on April 12, 2013 and alleges violations of the False Claims Act, including allegedly providing false certifications to the federal government regarding compliance with certain provisions of the Higher Education Act and accreditation standards. Relator claims that defendants’ conduct caused the government to pay federal funds to defendants, and to make payments to third-party lenders, which the government would not have made if not for defendants’ alleged violation of the law. Relator seeks treble damages plus civil penalties and attorneys’ fees. On June 11, 2013, defendants filed a motion to dismiss the case on a variety of grounds. The Court ruled on that motion, dismissing CEC from the case and dismissing several of the relator’s factual claims. On November 27, 2013, Sanford Brown, LTD., and Ultrasound Technical Services, Inc., the remaining Company defendants, filed a motion to dismiss the case for lack of subject matter jurisdiction due to prior public disclosures of the relator’s alleged claims. On March 17, 2014, the Court granted this motion in part, limiting the timeframe and geographical scope of the relator’s claims. On June 13, 2014, the Court granted the remaining Company defendants’ motion for summary judgment and entered judgment in their favor. On July 9, 2014, relator filed a notice of appeal. The oral argument on the appeal was heard on January 8, 2015, and we are awaiting the Court’s decision.
Because of the many questions of fact and law that may arise on appeal, the outcome of this legal proceeding is uncertain at this point. Based on information available to us at present, we cannot reasonably estimate a range of potential loss, if any, for this action because the complaint does not seek a specified amount of damages and it is unclear how damages would be calculated, if we were to be found liable. Accordingly, we have not recognized any liability associated with this action.
United States of America, ex rel. Ann Marie Rega v. Career Education Corporation, et al. On May 16, 2014, Relator Ann Marie Rega, a former employee of Sanford-Brown Iselin, filed an action in the U.S. District Court for the District of New Jersey against the Company and almost all of the Company’s individual schools on behalf of herself and the federal government. She alleges claims under the False Claims Act, including allegedly
123
Table of Contents
providing false certifications to the federal government regarding compliance with certain provisions of the Higher Education Act and accreditation standards. Relator claims that defendants’ conduct caused the government to pay federal funds to defendants, and to make payments to third-party lenders, which the government would not have made if not for defendants’ alleged violation of the law. Relator seeks treble damages plus civil penalties and attorneys’ fees. Relator failed to comply with the statutory requirement that all False Claims Act cases be filed under seal. On June 16, 2014, defendants filed a motion to dismiss the complaint with prejudice as to relator for failure to file her complaint under seal in accordance with the requirements of the False Claims Act. The motion is fully briefed and the parties are awaiting a ruling from the Court.
Because the matter is in its early stages and because of the many questions of fact and law that may arise, the outcome of this legal proceeding is uncertain at this point. Based on information available to us at present, we cannot reasonably estimate a range of potential loss, if any, for this action because the complaint does not seek a specified amount of damages and it is unclear how damages would be calculated, if we were to be found liable. Moreover, the case presents novel legal issues. Accordingly, we have not recognized any liability associated with this action.
Employment Litigation
Wilson, et al. v. Career Education Corporation. On August 11, 2011, Riley Wilson, a former admissions representative based in Minnesota, filed a complaint in the U.S. District Court for the Northern District of Illinois. The two-count complaint asserts claims of breach of contract and unjust enrichment arising from our decision to terminate our Admissions Representative Supplemental Compensation (“ARSC”) Plan. In addition to his individual claims, Wilson also seeks to represent a nationwide class of similarly situated admissions representatives who also were affected by termination of the plan. On October 6, 2011, we filed a motion to dismiss the complaint. On April 13, 2012, the Court granted our motion to dismiss in its entirety and dismissed plaintiff’s complaint for failure to state a claim. The Court dismissed this action with prejudice on May 14, 2012. On June 11, 2012, plaintiff filed a notice of appeal with the U.S. Court of Appeals for the Seventh Circuit appealing the final judgment of the trial court. Briefing was completed on October 30, 2012, and oral argument was held on December 3, 2012. On August 30, 2013, the Seventh Circuit affirmed the district court’s ruling on plaintiff’s unjust enrichment claim but reversed and remanded for further proceedings on plaintiff’s breach of contract claim. On September 13, 2013, we filed a petition for rehearing to seek review of the panel’s decision on the breach of contract claim and for certification of question to the Illinois Supreme Court, but the petition was denied.
The case now is on remand to the district court for further proceedings on the sole question of whether CEC’s termination of the ARSC Plan violated the implied covenant of good faith and fair dealing. CEC has answered the complaint, and the parties have commenced fact discovery as to the issue of liability. The Court has ordered the parties to complete fact discovery as to that issue by January 30, 2015 and to file summary judgment motions by March 24, 2015.
Because the matter is in its early stages and because of the many questions of fact and law that may arise, the outcome of this legal proceeding is uncertain at this point. Based on information available to us at present, we cannot reasonably estimate a range of potential loss, if any, for this action. Accordingly, we have not recognized any liability associated with this action.
Other Litigation
In addition to the legal proceedings and other matters described above, we are also subject to a variety of other claims, suits and investigations that arise from time to time out of the conduct of our business, including, but not limited to, claims involving students or graduates and routine employment matters. While we currently believe that such claims, individually or in aggregate, will not have a material adverse impact on our financial position, cash flows or results of operations, these other matters are subject to inherent uncertainties, and
124
Table of Contents
management’s view of these matters may change in the future. Were an unfavorable final outcome to occur in any one or more of these matters, there exists the possibility of a material adverse impact on our business, reputation, financial position, cash flows, and the results of operations for the period in which the effect becomes probable and reasonably estimable.
State Investigations
The Attorney General of Connecticut is serving as the point of contact for inquiries received from the attorneys general of the following 16 states: Arkansas, Arizona, Connecticut, Idaho, Iowa, Kentucky, Missouri, Nebraska, North Carolina, Oregon, Pennsylvania, Washington (January 24, 2014); Illinois (December 9, 2011); Tennessee (February 7, 2014), Hawaii (May 28, 2014 ) and New Mexico (May 2014) (these 16 attorneys general are collectively referred to as the “Multi-State AGs”). In addition, the Company has received inquiries from the attorneys general of Florida (November 5, 2010), Massachusetts (September 27, 2012), Colorado (August 27, 2013) and Minnesota (September 18, 2014). The inquiries are civil investigative demands or subpoenas which relate to the investigation by the attorneys general of whether the Company and its schools have complied with certain state consumer protection laws, and generally focus on the Company’s practices relating to the recruitment of students, graduate placement statistics, graduate certification and licensing results and student lending activities, among other matters. Depending on the state, the documents and information sought by the attorneys general in connection with their investigations cover time periods as early as 2006 to the present. The Company intends to cooperate with the states involved with a view towards resolving these inquiries as promptly as possible. In this regard, over the past several months the Company has participated in several meetings with representatives of the Multi-State AGs about the Company’s business and to engage in a dialogue towards a resolution of these inquiries.
We cannot predict the scope, duration or outcome of these attorney general investigations. At the conclusion of any of these matters, the Company or certain of its schools may be subject to claims of failure to comply with state laws or regulations and may be required to pay significant financial penalties and/or curtail or modify their operations. Other state attorneys general may also initiate inquiries into the Company or its schools. If any of the foregoing occurs, our business, reputation, financial position, cash flows and results of operations could be materially adversely affected. Based on information available to us at present, we cannot reasonably estimate a range of potential monetary or non-monetary impact these investigations might have on the Company because it is uncertain what remedies, if any, these regulators might ultimately seek in connection with these investigations.
Regulatory Matters
ED Inquiry and HCM1 Status
In December 2011, the U.S. Department of Education (“ED”) advised the Company that it is conducting an inquiry concerning possible violations of ED misrepresentation regulations related to placement rates reported by certain of the Company’s institutions to accrediting bodies, students and potential students. This inquiry stems from the Company’s self-reporting to ED of its internal investigation into student placement determination practices at the Company’s Health Education segment campuses and review of placement determination practices at all of the Company’s other domestic campuses in 2011. The Company has been cooperating with ED in connection with this inquiry. If ED determines that the Company or any of its institutions violated ED misrepresentation regulations with regard to the publication or reporting of placement rates or other disclosures to students or prospective students or finds any other basis in the materials we are providing, ED may revoke, limit, suspend, delay or deny the institution’s or all of the Company’s institutions Title IV eligibility, or impose fines. In addition, a majority of the Company’s institutions are currently in the process of seeking recertification from ED to participate in Title IV Programs. We cannot predict whether, or to what extent, ED’s inquiry might impact this recertification process.
In December 2011, ED also moved all of the Company’s institutions from the “advance” method of payment of Title IV Program funds to cash monitoring status (referred to as Heightened Cash Monitoring 1, or HCM1, status). Although the Company’s prior practices substantially conformed to the requirements of this more
125
Table of Contents
restrictive method of drawing down students’ Title IV Program funds, if ED finds violations of the HEA or related regulations, ED may impose monetary or program level sanctions, impose some period of delay in the Company’s receipt of Title IV funds or transfer the Company’s schools to the “reimbursement” or Heightened Cash Monitoring 2 (“HCM2”) methods of payment of Title IV Program funds. While on HCM2 status, an institution must disburse its own funds to students, document the students’ eligibility for Title IV Program funds and comply with certain waiting period requirements before receiving such funds from ED, which results in a significant delay in receiving those funds. The process of re-establishing a regular schedule of cash receipts for the Title IV Program funds if ED places our schools on “reimbursement” or HCM2 payment status could take several months, and would require us to fund ongoing operations substantially out of existing cash balances. If our existing cash balances are insufficient to sustain us through this transition period, we would need to pursue other sources of liquidity, which may not be available or may be costly.
OIG Audit
Our schools and universities are also subject to periodic audits by various regulatory bodies, including the U.S. Department of Education’s Office of Inspector General (“OIG”). The OIG audit services division commenced a compliance audit of CTU in June 2010, covering the period July 5, 2009 to May 16, 2010, to determine whether CTU had policies and procedures to ensure that CTU administered Title IV Program and other federal program funds in accordance with applicable federal law and regulation. On January 13, 2012, the OIG issued a draft report identifying three findings, including one regarding the documentation of attendance of students enrolled in online programs and one regarding the calculation of returns of Title IV Program funds arising from student withdrawals without official notice to the institution. CTU submitted a written response to the OIG, contesting these findings, on March 2, 2012. CTU disagreed with the OIG’s proposed determination of what constitutes appropriate documentation or verification of online academic activity during the time period covered by the audit. CTU’s response asserted that this finding was based on the retroactive application of standards adopted as part of the program integrity regulations that first went into effect on July 1, 2011. The OIG final report, along with CTU’s response to the draft report, was forwarded to ED’s Office of Federal Student Aid on September 21, 2012. On October 24, 2012, CTU provided a further response challenging the findings of the report directly to ED’s Office of Federal Student Aid. As a result of ED’s review of these materials, on January 31, 2013, CTU received a request from ED that it perform two file reviews to determine potential liability on two discrete issues associated with one of the above findings. The first file review relates to any potential aid awarded to students who engaged in virtual classroom attendance activities prior to the official start date of a course and for which no further attendance was registered during the official class term. The second file review relates to students that were awarded and paid Pell funds for enrollment in two concurrent courses, while only registering attendance in one of the two courses. The Company completed these file reviews and provided supporting documentation to ED on April 10, 2013. As of December 31, 2014, the Company has a $0.8 million reserve recorded related to this matter.
13. INCOME TAXES
The components of pretax loss from continuing operations for the years ended December 31, 2014, 2013 and 2012 are as follows (dollars in thousands):
| For the Year Ended December 31, | ||||||||||||
| 2014 | 2013 | 2012 | ||||||||||
| U.S |
$ | (72,504 | ) | $ | (88,103 | ) | $ | (64,913 | ) | |||
| Foreign |
— | 522 | (3,876 | ) | ||||||||
|
|
|
|
|
|
|
|||||||
| Total |
$ | (72,504 | ) | $ | (87,581 | ) | $ | (68,789 | ) | |||
|
|
|
|
|
|
|
|||||||
126
Table of Contents
The provision for (benefit from) income taxes from continuing operations for the years ended December 31, 2014, 2013 and 2012 consists of the following (dollars in thousands):
| For the Year Ended December 31, | ||||||||||||
| 2014 | 2013 | 2012 | ||||||||||
| Current (benefit) provision |
||||||||||||
| Federal |
$ | (10,168 | ) | $ | 31,010 | $ | 18,849 | |||||
| State and local |
(346 | ) | 677 | 4,011 | ||||||||
|
|
|
|
|
|
|
|||||||
| Total current (benefit) provision |
(10,514 | ) | 31,687 | 22,860 | ||||||||
|
|
|
|
|
|
|
|||||||
| Deferred provision (benefit) |
||||||||||||
| Federal |
13,445 | 1,023 | (25,982 | ) | ||||||||
| State and local |
805 | (2,566 | ) | (826 | ) | |||||||
|
|
|
|
|
|
|
|||||||
| Total deferred provision (benefit) |
14,250 | (1,543 | ) | (26,808 | ) | |||||||
|
|
|
|
|
|
|
|||||||
| Total provision for (benefit from) income taxes |
$ | 3,736 | $ | 30,144 | $ | (3,948 | ) | |||||
|
|
|
|
|
|
|
|||||||
A reconciliation of the statutory U.S. federal income tax rate to our effective income tax rate for continuing operations for the years ended December 31, 2014, 2013 and 2012 is as follows (dollars in thousands):
| For the Year Ended December 31, | ||||||||||||
| 2014 | 2013 | 2012 | ||||||||||
| Statutory U.S. federal income tax rate |
(35.0 | )% | (35.0 | )% | (35.0 | )% | ||||||
| State and local income taxes |
(4.3 | ) | (4.0 | ) | (4.1 | ) | ||||||
| Nondeductible goodwill |
1.1 | 3.5 | 39.6 | |||||||||
| Valuation allowance |
39.0 | 86.2 | 2.4 | |||||||||
| Federal Audit Settlement |
4.5 | — | — | |||||||||
| Tax credits |
— | (6.2 | ) | — | ||||||||
| Other |
(0.1 | ) | (10.1 | ) | (8.6 | ) | ||||||
|
|
|
|
|
|
|
|||||||
| Effective income tax rate |
5.2 | % | 34.4 | % | (5.7 | )% | ||||||
|
|
|
|
|
|
|
|||||||
The effective tax rates for the years ended December 31, 2014 and 2013 decreased by 39.0% and 86.2%, respectively, due to valuation allowances of $71.8 million and $80.5 million, respectively. The 2014 effective tax rate was negatively impacted by the settlement of a federal income tax audit covering the years ended December 31, 2008 through December 31, 2012. The 2013 effective tax rate benefitted from the settlement of various state income tax audits and reversal of one of our foreign operations as a disregarded entity which increased the effective tax rate by 13.2%. The effective income tax rate for the year ended December 31, 2012 included a $73.6 million non-deductible goodwill and asset impairment charge which decreased our negative effective tax rate by approximately 39.6%. The 2012 effective tax rate benefited from favorable tax adjustments related to the resolution of various state tax exposures and the expiration of the statute of limitations on other federal and state tax exposures which increased our negative effective tax rate by 6.8%.
127
Table of Contents
A reconciliation of the beginning and ending amounts of gross unrecognized tax benefits as of December 31, 2014, 2013 and 2012 is as follows (dollars in thousands):
| 2014 | 2013 | 2012 | ||||||||||
| Gross unrecognized tax benefits, beginning of the year |
$ | 13,900 | $ | 24,479 | $ | 29,892 | ||||||
| Additions for tax positions of prior years |
129 | 3,582 | — | |||||||||
| Reductions for tax positions of prior years |
— | — | (3,548 | ) | ||||||||
| Additions for tax positions related to the current year |
931 | 813 | 958 | |||||||||
| Reductions due to settlements |
(4,064 | ) | (13,707 | ) | (2,531 | ) | ||||||
| Reductions due to lapse of applicable statute of limitations |
(1,578 | ) | (1,267 | ) | (292 | ) | ||||||
|
|
|
|
|
|
|
|||||||
| Subtotal |
9,318 | 13,900 | 24,479 | |||||||||
| Interest and penalties |
2,820 | 3,107 | 3,794 | |||||||||
|
|
|
|
|
|
|
|||||||
| Total gross unrecognized tax benefits, end of the year |
$ | 12,138 | $ | 17,007 | $ | 28,273 | ||||||
|
|
|
|
|
|
|
|||||||
The total amount of net unrecognized tax benefits that, if recognized, would favorably affect the effective tax rate in future periods was $8.0 million and $12.7 million for the years ended December 31, 2014 and 2013, respectively. At December 31, 2014, our short and long-term reserves, recorded within current accrued income taxes and other non-current liabilities, respectively, related to FASB’s interpretation No. 48 of ASC Topic 740-10, Accounting for Uncertainty in Income Taxes or (“FIN 48”), were $1.4 million and $7.9 million, respectively. We record interest and penalties related to unrecognized tax benefits within provision for (benefit from) income taxes on our consolidated statements of loss and comprehensive loss. The total amount of accrued interest and penalties resulting from such unrecognized tax benefits was $2.8 million and $3.1 million as of the years ended December 31, 2014 and 2013, respectively. For the years ended December 31, 2014, 2013, and 2012, we recognized less than $0.1 million of benefit, $0.7 million of benefit and $0.5 million of benefit, respectively, related to interest and penalties from unrecognized tax benefits in our consolidated results of continuing operations.
CEC and its subsidiaries file income tax returns in the U.S. and in various state and local jurisdictions. CEC and its subsidiaries are routinely examined by tax authorities in these jurisdictions. As of December 31, 2014, CEC had been examined by the Internal Revenue Service through our tax year ending December 31, 2012. In addition, a number of state and local examinations are currently ongoing. It is possible that these state examinations may be resolved within twelve months. Due to the potential for resolution of state examinations, and the expiration of various statutes of limitations, it is reasonably possible that CEC’s gross unrecognized tax benefits balance may change within the next twelve months by a range of zero to $2.0 million.
128
Table of Contents
Deferred income tax assets and liabilities result primarily from temporary differences in the recognition of various expenses for tax and financial statement purposes, and from the recognition of the tax benefits of net operating loss carry forwards. Components of deferred income tax assets and liabilities for continuing operations as of December 31, 2014 and 2013 are as follows (dollars in thousands):
| December 31, | ||||||||
| 2014 | 2013 | |||||||
| Deferred income tax assets: |
||||||||
| Accrued occupancy |
$ | 1,728 | $ | 1,633 | ||||
| Deferred rent obligations |
9,248 | 10,095 | ||||||
| Foreign tax credits |
32,998 | 12,026 | ||||||
| Valuation allowance foreign tax credits |
(6,264 | ) | (3,116 | ) | ||||
| Compensation and employee benefits |
14,225 | 17,947 | ||||||
| Tax net operating loss carry forwards |
34,067 | 7,220 | ||||||
| Valuation allowance |
(34,067 | ) | (7,220 | ) | ||||
| Allowance for doubtful accounts |
2,269 | 1,201 | ||||||
| Covenant not-to-compete |
37 | 70 | ||||||
| Accrued settlements and legal |
828 | 1,904 | ||||||
| Deferred compensation |
1,777 | 498 | ||||||
| Accrued restructuring and severance |
1,070 | 2,057 | ||||||
| Equity method for investments |
19 | — | ||||||
| General business tax credits |
450 | — | ||||||
| Depreciation and amortization |
142 | — | ||||||
| Other |
822 | 1,575 | ||||||
| Valuation allowance deferred tax assets |
(55,995 | ) | (8,250 | ) | ||||
|
|
|
|
|
|||||
| Total deferred income tax assets |
3,354 | 37,640 | ||||||
|
|
|
|
|
|||||
| Deferred income tax liabilities: |
||||||||
| Depreciation and amortization |
— | 19,387 | ||||||
| Other |
3,354 | 4,003 | ||||||
|
|
|
|
|
|||||
| Total deferred income tax liabilities |
3,354 | 23,390 | ||||||
|
|
|
|
|
|||||
| Net deferred income tax assets |
$ | — | $ | 14,250 | ||||
|
|
|
|
|
|||||
Net deferred income tax assets for continuing operations as of December 31, 2014 and 2013 are reflected in the consolidated balance sheets as follows (dollars in thousands):
| December 31, | ||||||||
| 2014 | 2013 | |||||||
| Current deferred income tax assets, net |
$ | — | $ | 3,606 | ||||
| Non-current deferred income tax assets, net |
— | 10,644 | ||||||
|
|
|
|
|
|||||
| Net deferred income tax assets |
$ | — | $ | 14,250 | ||||
|
|
|
|
|
|||||
As of December 31, 2014, we have net operating loss carry forwards, for federal and state income tax purposes, of approximately $63.9 million and $247.9 million, respectively. These net operating loss carry forwards are available to offset various future taxable income, if any, and expire between 2015 and 2034. Additionally, we have federal and state net operating loss carrybacks approximating $97.5 million and $3.5 million, respectively. We intend to apply these carrybacks against prior year’s taxable income to generate a refund of federal and state tax of approximately $14.1 million and $0.2 million, respectively. The federal net operating loss carryback will also increase the overall domestic loss account balance by approximately $52.3 million and the foreign tax credit carryforward available to reduce the tax attributable to future domestic income by approximately $18.3 million.
129
Table of Contents
In assessing the continued need for a valuation allowance, we consider both positive and negative evidence related to the likelihood of realization of the deferred tax assets. Topic 740 provides that important factors in determining whether a deferred tax asset will be realized are whether there has been sufficient taxable income in recent years and whether sufficient taxable income is expected in future years in order to utilize the deferred tax asset. In evaluating the realizability of deferred income tax assets, we consider, among other things, historical levels of taxable income along with possible sources of future taxable income, which include: the expected timing of the reversals of existing temporary reporting differences, the existence of taxable income in prior carryback year(s), the expected impact of tax planning strategies that may be implemented to prevent the potential loss of future income tax benefits and expected future taxable income. Changes in, among other things, income tax legislation, statutory income tax rates, or future taxable income levels could materially impact our valuation of income tax assets and liabilities and could cause our income tax provision to vary significantly among financial reporting periods. If, based on the weight of available evidence, it is more likely than not the deferred tax assets will not be realized, with placing less weight on projections for future growth as projections for future growth are less objectively verifiable, we record a valuation allowance. The weight given to the positive and negative evidence is commensurate with the extent to which the evidence may be objectively verified. A high degree of judgment is required to determine if, and the extent to which, valuation allowances should be recorded against deferred tax assets. A significant piece of objective negative evidence evaluated is the cumulative loss incurred over the three-year period ended December 31, 2014. Such objective evidence limits the ability to consider other subjective evidence such as our projections for future growth as projections for future growth into the future are less objectively verifiable.
As a result of our assessment, as of December 31, 2014, we continued to record a valuation allowance against our deferred tax assets and increased our valuation allowance by $67.5 million, bringing our cumulative valuation allowance to $150.4 million as of December 31, 2014. Valuation allowance expense of $80.5 million was recorded during the year ended December 31, 2013 within loss from continuing operations on our statement of loss and comprehensive loss, which increased the cumulative valuation allowance to $82.9 million. For the year ended December 31, 2014, gross valuation allowance expense of $71.8 million is reduced by $4.3 million for various deferred tax adjustments that would otherwise impact Stockholder’s Equity. Our total valuation allowance of $150.4 million recorded within our consolidated balance sheet as of December 31, 2014 consists of $96.3 million in continuing operations and $54.1 million from discontinued operations. Included in the valuation allowance total for continuing operations are $6.3 million and $34.1 million recorded for foreign tax credits and net operating loss carryforwards, respectively. The amount of the deferred tax asset considered realizable, however, could be adjusted if estimates of future taxable income during the carryforward period are increased, if objective negative evidence in the form of cumulative losses is no longer present and additional weight may be given to subjective evidence such as our projections for growth. We will continue to evaluate our valuation allowance in future years for any change in circumstances that causes a change in judgment about the realizability of the deferred tax asset.
14. SHARE-BASED COMPENSATION
Overview of Share-Based Compensation Plans
The Career Education Corporation 2008 Incentive Compensation Plan (the “2008 Plan”) authorizes awards of stock options, stock appreciation rights, restricted stock, restricted stock units, deferred stock, performance units, annual incentive awards, and substitute awards, which generally may be settled in cash or shares of our common stock. Any shares of our common stock that are subject to awards of stock options or stock appreciation rights payable in shares will be counted as 1.0 share for each share issued for purposes of the aggregate share limit and any shares of our common stock that are subject to any other form of award payable in shares will be counted as 1.67 shares for each share issued for purposes of the aggregate share limit. As of December 31, 2014, there were approximately 6.1 million shares of common stock available for future share-based awards under the 2008 Plan, which is net of 3.8 million shares issuable upon exercise of outstanding options. This amount does not reflect 0.6 million and 0.1 million shares underlying restricted stock units and deferred stock units, respectively, as of December 31, 2014, which will be settled in shares of our common stock if the vesting conditions are met
130
Table of Contents
and thus reduce the common stock available for future share-based awards under the 2008 Plan by the amount vested, multiplied by the applicable factor under the plan. The vesting of all types of equity awards (stock options, stock appreciation rights, restricted stock awards and restricted stock units) is subject to possible acceleration in certain circumstances. Generally, if a plan participant terminates employment for any reason other than by death or disability during the vesting period, the right to unvested equity awards is forfeited.
As of December 31, 2014, we estimate that compensation expense of approximately $5.0 million will be recognized over the next four years for all unvested share-based awards that have been granted to participants, including stock options, shares of restricted stock and restricted stock units and deferred stock units to be settled in shares of stock but excluding restricted stock units to be settled in cash.
Stock Options. The exercise price of stock options and stock appreciation rights granted under each of the plans is equal to the fair market value of our common stock on the date of grant. Employee stock options generally become exercisable 25% per year over a four-year service period beginning on the date of grant and expire ten years from the date of grant. Non-employee directors’ stock options expire ten years from the date of grant and generally become exercisable as follows: one-fourth on the grant date and one-fourth for each of the first through third anniversary of the grant date. Grants of stock options are generally only subject to the service conditions discussed previously.
Stock option activity during the years ended December 31, 2014, 2013 and 2012, under all of our plans was as follows:
| Options | Weighted Average Exercise Price |
Weighted Average Remaining Contractual Term |
Aggregate Intrinsic Value (in thousands) |
|||||||||||||
| Outstanding as of December 31, 2011 |
3,353,462 | $ | 27.79 | |||||||||||||
| Granted |
534,895 | 7.91 | ||||||||||||||
| Exercised |
— | — | $ | — | ||||||||||||
| Forfeited |
(196,400 | ) | 18.52 | |||||||||||||
| Cancelled |
(1,100,070 | ) | 24.09 | |||||||||||||
|
|
|
|||||||||||||||
| Outstanding as of December 31, 2012 |
2,591,887 | $ | 25.96 | |||||||||||||
|
|
|
|||||||||||||||
| Granted |
1,934,005 | 2.58 | ||||||||||||||
| Exercised |
(1,275 | ) | 3.08 | $ | 3 | |||||||||||
| Forfeited |
(261,366 | ) | 5.19 | |||||||||||||
| Cancelled |
(362,816 | ) | 31.60 | |||||||||||||
|
|
|
|||||||||||||||
| Outstanding as of December 31, 2013 |
3,900,435 | $ | 15.15 | |||||||||||||
|
|
|
|||||||||||||||
| Granted |
746,318 | 6.89 | ||||||||||||||
| Exercised |
(225,000 | ) | 2.72 | $ | 721 | |||||||||||
| Forfeited |
(299,577 | ) | 4.94 | |||||||||||||
| Cancelled |
(340,212 | ) | 39.49 | |||||||||||||
|
|
|
|||||||||||||||
| Outstanding as of December 31, 2014 |
3,781,964 | $ | 12.88 | 5.8 years | $ | 6,118 | ||||||||||
|
|
|
|||||||||||||||
| Exercisable as of December 31, 2014 |
2,138,086 | $ | 18.87 | 4.0 years | $ | 2,372 | ||||||||||
|
|
|
|||||||||||||||
131
Table of Contents
The following table summarizes information with respect to all outstanding and exercisable stock options under all of our plans as of December 31, 2014:
| Options Outstanding | Options Exercisable | |||||||||||||||||||
| Range of Exercise Prices |
Number of Options Outstanding |
Weighted Average Exercise Price |
Weighted Average Remaining Contractual Term (in Years) |
Number Exercisable |
Weighted Average Exercise Price |
|||||||||||||||
| $ 2.20 $ 2.20 |
644,628 | $ | 2.20 | 8.27 | 161,157 | $ | 2.20 | |||||||||||||
| $ 2.62 $ 2.65 |
96,729 | $ | 2.65 | 8.61 | 26,403 | $ | 2.64 | |||||||||||||
| $ 2.72 $ 2.72 |
403,504 | $ | 2.72 | 4.88 | 269,626 | $ | 2.72 | |||||||||||||
| $ 2.82 $ 6.81 |
628,327 | $ | 5.49 | 8.72 | 148,344 | $ | 4.62 | |||||||||||||
| $ 7.33 $ 8.63 |
590,500 | $ | 7.98 | 6.03 | 132,933 | $ | 8.63 | |||||||||||||
| $13.32 $22.04 |
503,112 | $ | 19.12 | 3.95 | 484,459 | $ | 19.02 | |||||||||||||
| $22.13 $30.67 |
413,564 | $ | 27.57 | 4.98 | 413,564 | $ | 27.57 | |||||||||||||
| $30.80 $34.70 |
454,350 | $ | 33.18 | 1.27 | 454,350 | $ | 33.18 | |||||||||||||
| $34.86 $37.76 |
46,750 | $ | 35.30 | 0.70 | 46,750 | $ | 35.30 | |||||||||||||
| $38.28 $38.28 |
500 | $ | 38.28 | 0.51 | 500 | $ | 38.28 | |||||||||||||
|
|
|
|
|
|||||||||||||||||
| 3,781,964 | $ | 12.88 | 5.77 | 2,138,086 | $ | 18.87 | ||||||||||||||
|
|
|
|
|
|||||||||||||||||
Restricted Stock and Restricted Stock Units to be Settled in Stock. Restricted stock and restricted stock units to be settled in shares of stock generally become fully vested 25% per year over a four-year service period beginning on the date of grant. Certain awards to plan participants referred to as “performance-based” are subject to performance conditions that, even if the requisite service period is met, may reduce the number of shares or units of restricted stock that vest at the end of the requisite service period or result in all shares or units being forfeited.
The following table summarizes information with respect to all outstanding restricted stock and restricted stock units to be settled in shares of stock under our plans during the years ended December 31, 2014, 2013 and 2012:
| Restricted Stock to be Settled in Shares of Stock | ||||||||||||||||||||
| Shares | Weighted Average Grant-Date Fair Value Per Share |
Units | Weighted Average Grant-Date Fair Value Per Unit |
Total | ||||||||||||||||
| Outstanding as of December 31, 2011 |
1,796,747 | $ | 24.74 | — | $ | — | 1,796,747 | |||||||||||||
| Granted |
— | — | 1,416,832 | 8.32 | 1,416,832 | |||||||||||||||
| Vested |
(374,260 | ) | 24.74 | — | — | (374,260 | ) | |||||||||||||
| Forfeited |
(568,196 | ) | 24.73 | (272,899 | ) | 8.53 | (841,095 | ) | ||||||||||||
|
|
|
|
|
|
|
|||||||||||||||
| Outstanding as of December 31, 2012 |
854,291 | $ | 24.74 | 1,143,933 | $ | 8.27 | 1,998,224 | |||||||||||||
|
|
|
|
|
|
|
|||||||||||||||
| Granted |
— | — | 43,313 | 2.72 | 43,313 | |||||||||||||||
| Vested |
(208,461 | ) | 23.10 | (306,605 | ) | 8.60 | (515,066 | ) | ||||||||||||
| Forfeited |
(424,268 | ) | 27.01 | (342,020 | ) | 7.22 | (766,288 | ) | ||||||||||||
|
|
|
|
|
|
|
|||||||||||||||
| Outstanding as of December 31, 2013 |
221,562 | $ | 22.19 | 538,621 | $ | 8.30 | 760,183 | |||||||||||||
|
|
|
|
|
|
|
|||||||||||||||
| Granted |
— | — | 318,940 | 6.57 | 318,940 | |||||||||||||||
| Vested |
(136,133 | ) | 22.94 | (135,645 | ) | 8.61 | (271,778 | ) | ||||||||||||
| Forfeited |
(42,677 | ) | 20.87 | (165,776 | ) | 7.90 | (208,453 | ) | ||||||||||||
|
|
|
|
|
|
|
|||||||||||||||
| Outstanding as of December 31, 2014 |
42,752 | $ | 21.63 | 556,140 | $ | 7.35 | 598,892 | |||||||||||||
|
|
|
|
|
|
|
|||||||||||||||
132
Table of Contents
Deferred Stock Units to be Settled in Stock. In the second quarter of 2014 and for the first time since inception of any of our plans, we granted deferred stock units to our non-employee directors. The deferred stock units are to be settled in shares of stock and generally vest one-third per year over a three-year service period beginning on the date of grant. Settlement of the deferred stock units and delivery of the underlying shares of stock to the plan participants does not occur until he or she ceases to provide services to the Company in the capacity of a director, employee or consultant.
The following table summarizes information with respect to all deferred stock units during the year to date ended December 31, 2014:
| Deferred Stock Units to be Settled in Shares |
Weighted Average Grant-Date Fair Value Per Unit |
|||||||
| Outstanding as of December 31, 2013 |
— | $ | — | |||||
| Granted |
116,952 | 4.39 | ||||||
| Vested |
— | — | ||||||
| Forfeited |
— | — | ||||||
|
|
|
|||||||
| Outstanding as of December 31, 2014 |
116,952 | $ | 4.39 | |||||
|
|
|
|||||||
Restricted Stock Units to be Settled in Cash. Restricted stock units to be settled in cash generally become fully vested 25% per year over a four-year service period beginning on the date of grant. Cash-settled restricted stock units are recorded as liabilities as the expense is recognized and the fair value for these awards is determined at each period end date with changes in fair value recorded in our statement of loss and comprehensive loss in the current period. Cash-settled restricted stock units are settled with a cash payment for each unit vested equal to the closing price on the vesting date. Cash-settled restricted stock units are not included in common shares reserved for issuance or available for issuance under the 2008 plan.
The following table summarizes information with respect to all cash-settled restricted stock units for the years ended December 31, 2014 and 2013:
| Restricted Stock Units to be Settled in Cash |
||||
| Outstanding as of December 31, 2012 |
— | |||
| Granted |
2,938,283 | |||
| Vested |
— | |||
| Forfeited |
(649,368 | ) | ||
|
|
|
|||
| Outstanding as of December 31, 2013 |
2,288,915 | |||
|
|
|
|||
| Granted |
981,136 | |||
| Vested |
(755,656 | ) | ||
| Forfeited |
(671,940 | ) | ||
|
|
|
|||
| Outstanding as of December 31, 2014 |
1,842,455 | |||
|
|
|
|||
Upon vesting, based on the conditions set forth in the award agreements, these units will be settled in cash. We valued these units in accordance with the guidance set forth by FASB ASC Topic 718 – Compensation-Stock Compensation and recognized $4.8 million of expense for the year to date 2014 for all cash-settled restricted stock units.
133
Table of Contents
Stock-Based Compensation Expense. Total stock-based compensation expense for the years ended December 31, 2014, 2013 and 2012 for all types of awards was as follows (dollars in thousands):
| December 31, | ||||||||||||
| Award Type |
2014 | 2013 | 2012 | |||||||||
| Stock Options |
$ | 1,372 | $ | 2,308 | $ | 2,907 | ||||||
| Restricted stock or units settled in stock |
2,865 | 4,339 | 6,637 | |||||||||
| Restricted stock units settled in cash |
4,514 | 3,452 | — | |||||||||
| Stock appreciation rights settled in cash |
295 | 149 | — | |||||||||
|
|
|
|
|
|
|
|||||||
| Total stock-based compensation expense |
$ | 9,046 | $ | 10,248 | $ | 9,544 | ||||||
|
|
|
|
|
|
|
|||||||
Performance Unit Awards. Performance unit awards granted during 2013 and 2014 are long-term incentive, cash-based awards. Payment of these awards is based upon a calculation of Total Shareholder Return (“TSR”) of CEC as compared to TSR across a specified peer group of our competitors over a three-year performance period ending primarily on December 31, 2015 and 2016, respectively. These awards are recorded as liabilities as the expense is recognized and fair value for these awards is revalued at each period end date with changes in fair value recorded in our statement of loss and comprehensive loss in the current period. We recorded $3.5 million and $1.1 million for expense related to these awards for the years ended December 31, 2014 and 2013, respectively.
Share-Based Awards Assumptions
In accordance with FASB ASC Topic 718, the fair value of each stock option award is estimated on the date of grant using the Black-Scholes-Merton option pricing model. We recognize the value of share-based compensation as expense in our consolidated statements of loss and comprehensive loss during the vesting periods of the underlying share-based awards using the straight-line method. FASB ASC Topic 718 requires companies to estimate forfeitures of share-based awards at the time of grant and revise such estimates in subsequent periods if actual forfeitures differ from original projections.
The fair value of each stock option award granted during the years ended December 31, 2014, 2013 and 2012 was estimated on the date of grant using the Black-Scholes-Merton option pricing model. Our determination of the fair value of each stock option is affected by our stock price on the date of grant, as well as assumptions regarding a number of highly complex and subjective variables. These variables include, but are not limited to, our expected stock price volatility over the expected life of the awards and actual and projected stock option exercise behavior. The weighted average fair value per share of stock option awards granted during the years ended December 31, 2014, 2013 and 2012, and assumptions used to value stock options are as follows:
| For the Year Ended December 31, | ||||||||||||
| 2014 | 2013 | 2012 | ||||||||||
| Dividend yield |
— | — | — | |||||||||
| Risk-free interest rate |
1.4 | % | 1.1 | % | 0.6 | % | ||||||
| Weighted average volatility |
73.0 | % | 64.6 | % | 68.4 | % | ||||||
| Expected life (in years) |
4.3 | 5.6 | 5.2 | |||||||||
| Weighted average grant date fair value per share of options granted |
$ | 3.89 | $ | 1.47 | $ | 4.10 | ||||||
Volatility is calculated based on the actual historical daily prices of our common stock over the expected term of the stock option award. During the year ended December 31, 2014, we utilized a range of expected volatility assumptions for purposes of estimating the fair value of stock options awarded during the period. Such volatility assumptions ranged from 72.9% to 74.0%.
The expected life of each stock option award is estimated based primarily on our actual historical director and employee exercise behavior.
134
Table of Contents
The fair value of each share of restricted stock and restricted stock units to be settled in stock is equal to the fair market value of our common stock as of the date of grant, which is the closing price per share of our common stock on NASDAQ.
15. WEIGHTED AVERAGE COMMON SHARES
Basic net loss per share is calculated by dividing net loss by the weighted average number of common shares outstanding for the period. Diluted earnings per share is computed by dividing net loss by the weighted average number of shares assuming dilution. Dilutive common shares outstanding is computed using the Treasury Stock Method and reflects the additional shares that would be outstanding if dilutive stock options were exercised and restricted stock and restricted stock units were settled for common shares during the period.
Due to the fact that we reported a loss from continuing operations for the years ended December 31, 2014, 2013 and 2012, potential common stock equivalents are excluded from the diluted common shares outstanding calculation. Per FASB ASC Topic 260 – Earnings Per Share, an entity that reports discontinued operations shall use income or loss from continuing operations as the benchmark for calculating diluted common shares outstanding, and as such, we have zero common stock equivalents since these shares would have an anti-dilutive effect on our net loss per share for the years ended December 31, 2014, 2013 and 2012.
In addition to the common stock issued upon the exercise of employee stock options, the granting of restricted stock and the vesting of restricted stock units to be settled in stock, we issued approximately 0.1 million, 0.4 million and 0.2 million shares for the years ended December 31, 2014, 2013 and 2012, respectively, upon the purchase of common stock pursuant to our employee stock purchase plan.
16. EMPLOYEE BENEFIT PLANS
Retirement Savings and Profit Sharing Plan
We maintain a defined contribution 401(k) retirement savings plan which is available to all employees who work greater than 1,000 hours in a fiscal year. Under the plan, an eligible employee may elect to defer receipt of a portion of their annual pay, including salary and bonus. During 2014 and 2013, we contributed this amount to the plan on the employee’s behalf and also made a matching contribution equal to 50% of the first 2% and 25% of the next 4% of the percentage of annual pay that the employee elected to defer. For the year ended December 31, 2012, we made matching contributions equal to 100% of the first 2% and 50% of the next 4% of the percentage of annual pay that the employee elected to defer. A participant is 100% vested at all times in the amounts the employee defers from annual pay. A participant becomes 100% vested in our matching contributions after two years of credited employee service. During the years ended December 31, 2014, 2013 and 2012, we recorded expense for continuing and discontinued operations under this plan of approximately $3.8 million, $4.6 million, and $11.9 million, respectively, net of any forfeited employer matching contributions.
Employee Stock Purchase Plan
We maintain an employee stock purchase plan that allows substantially all full-time and part-time employees to acquire shares of our common stock through payroll deductions over three-month offering periods. The per share purchase price is equal to 95% of the fair market value of a share of our common stock on the last day of the offering period, and purchases are limited to 10% of an employee’s salary, up to a maximum of $25,000 per calendar year. We are authorized to issue up to 4.0 million shares of common stock under the employee stock purchase plan, and, as of December 31, 2014, 3.1 million shares of common stock have been issued under the plan.
Share-based compensation expense recorded during the years ended December 31, 2014, 2013 and 2012, in connection with the compensatory elements of our employee stock purchase plan, was not significant.
135
Table of Contents
17. SEGMENT REPORTING
Our segments are determined in accordance with FASB ASC Topic 280 – Segment Reporting and are based upon how the Company analyzes performance and makes decisions. Each segment represents a group of postsecondary education providers that offer a variety of degree and non-degree academic programs. These segments are organized by key market segments to enhance brand focus and operational alignment within each segment to more effectively execute our strategic plan.
During the fourth quarter of 2014, we made the decision to commit to a plan of sale of our Le Cordon Bleu Culinary Arts institutions. As we anticipate the sale of these assets to be completed within one year, we have recorded the assets and liabilities related to these institutions within current assets and liabilities of discontinued operations as of December 31, 2014. See Note 4 “Discontinued Operations” to our consolidated financial statements. Accordingly, the results of operations for the Culinary Arts segment are now reported within discontinued operations.
During 2014, we announced the teach-out of three additional campuses within our Career Colleges segment. These campuses are now included within our Transitional Group segment. In addition, during 2014 we completed the teach-out of 21 campuses, and accordingly, the results of operations for these campuses are now reported within discontinued operations.
All prior period results have been recast to reflect our reporting segments on a comparable basis. Our four reporting segments are described below.
University Group:
Colorado Technical University (CTU) places a strong focus on providing industry-relevant degree programs to meet the needs of our students for employment and of employers for a well-educated workforce and collectively offers academic programs in the career-oriented disciplines of business studies, information systems and technologies, criminal justice, computer science and engineering, and health sciences. Students pursue their degrees through local campuses, fully-online programs through CTU Online and blended formats, which combine campus-based and online education. As of December 31, 2014, students enrolled at CTU represented approximately 49% of our total enrollments. Approximately 90% of CTU’s enrollments are fully online.
American InterContinental University (AIU) focuses on helping busy professionals get the degree they need to move forward in their career as efficiently as possible and collectively offers academic programs in the career-oriented disciplines of business studies, information technologies, criminal justice and design technologies. Students pursue their degrees through local campuses, fully-online programs through AIU Online and blended formats, which combine campus-based and online education. As of December 31, 2014, students enrolled at AIU represented approximately 28% of our total enrollments. Approximately 90% of AIU’s enrollments are fully online.
Career Colleges Group includes Briarcliffe College, Brooks Institute, Harrington College of Design, Missouri College and our Sanford-Brown institutions. The Career Colleges group collectively offers academic programs primarily in the career-oriented discipline of health education complemented by certain programs in business studies and information technology, as well as visual communications, fashion design, photography, interior design, graphic design and video production. Students pursue their degrees through local campuses, fully-online programs through SBC Online and blended formats, which combine campus-based and online education. As of December 31, 2014, students enrolled within our Career Colleges represented approximately 21% of our total enrollments. Approximately 15% of Career College’s enrollments are fully online.
Transitional Group includes our campuses that are currently being taught out. See the “Campus Locations” table in Item 1, “Business,” of this Annual Report on Form 10-K for a listing of campuses that comprise this segment. These campuses employ a gradual teach-out process, enabling them to continue to operate while current
136
Table of Contents
students complete their course of study; they no longer enroll new students. The 12 remaining campuses within the Transitional Group as of December 31, 2014 will complete their teach-outs on varying dates through 2017.
We evaluate segment performance based on operating results. Adjustments to reconcile segment results to consolidated results are included under the caption “Corporate and Other,” which primarily includes unallocated corporate activity and eliminations.
Summary financial information by reporting segment is as follows (dollars in thousands):
| Revenue | Operating (Loss) Income |
Depreciation and Amortization |
Capital Expenditures |
Total Assets (9) |
||||||||||||||||
| For the Year Ended December 31, 2014 (1) |
||||||||||||||||||||
| CTU |
$ | 336,573 | $ | 69,492 | $ | 2,627 | $ | 628 | $ | 73,458 | ||||||||||
| AIU |
198,896 | (9,412 | ) | 2,329 | 916 | 51,755 | ||||||||||||||
|
|
|
|
|
|
|
|
|
|
|
|||||||||||
| Total University Group |
535,469 | 60,080 | 4,956 | 1,544 | 125,213 | |||||||||||||||
|
|
|
|
|
|
|
|
|
|
|
|||||||||||
| Career Colleges (2) |
172,833 | (73,753 | ) | 9,227 | 4,620 | 29,365 | ||||||||||||||
| Corporate and Other (3) |
230 | (21,169 | ) | 17,455 | 4,545 | 332,672 | ||||||||||||||
|
|
|
|
|
|
|
|
|
|
|
|||||||||||
| Subtotal |
708,532 | (34,842 | ) | 31,638 | 10,709 | 487,250 | ||||||||||||||
| Transitional Group |
32,826 | (37,874 | ) | 4,381 | 155 | 7,990 | ||||||||||||||
| Discontinued Operations |
2,292 | 78,294 | ||||||||||||||||||
|
|
|
|
|
|
|
|
|
|
|
|||||||||||
| Total |
$ | 741,358 | $ | (72,716 | ) | $ | 36,019 | $ | 13,156 | $ | 573,534 | |||||||||
|
|
|
|
|
|
|
|
|
|
|
|||||||||||
| For the Year Ended December 31, 2013 (1) |
||||||||||||||||||||
| CTU |
$ | 346,086 | $ | 65,078 | $ | 2,828 | $ | 158 | $ | 75,275 | ||||||||||
| AIU |
231,606 | (5,556 | ) | 3,069 | 122 | 54,426 | ||||||||||||||
|
|
|
|
|
|
|
|
|
|
|
|||||||||||
| Total University Group |
577,692 | 59,522 | 5,897 | 280 | 129,701 | |||||||||||||||
|
|
|
|
|
|
|
|
|
|
|
|||||||||||
| Career Colleges (4) |
196,990 | (68,652 | ) | 10,963 | 5,905 | 53,791 | ||||||||||||||
| Corporate and Other |
— | (33,600 | ) | 22,574 | 6,272 | 491,821 | ||||||||||||||
|
|
|
|
|
|
|
|
|
|
|
|||||||||||
| Subtotal |
774,682 | (42,730 | ) | 39,434 | 12,457 | 675,313 | ||||||||||||||
| Transitional Group (5) |
64,999 | (38,111 | ) | 5,721 | 346 | 13,805 | ||||||||||||||
| Discontinued Operations |
6,833 | 115,927 | ||||||||||||||||||
|
|
|
|
|
|
|
|
|
|
|
|||||||||||
| Total |
$ | 839,681 | $ | (80,841 | ) | $ | 45,155 | $ | 19,636 | $ | 805,045 | |||||||||
|
|
|
|
|
|
|
|
|
|
|
|||||||||||
| For the Year Ended December 31, 2012 (1) |
||||||||||||||||||||
| CTU |
$ | 360,369 | $ | 56,155 | $ | 3,321 | $ | 1,401 | ||||||||||||
| AIU |
304,208 | 20,896 | 4,249 | 1,746 | ||||||||||||||||
|
|
|
|
|
|
|
|
|
|||||||||||||
| Total University Group |
664,577 | 77,051 | 7,570 | 3,147 | ||||||||||||||||
|
|
|
|
|
|
|
|
|
|||||||||||||
| Career Colleges (6) |
243,186 | (84,663 | ) | 11,468 | 4,431 | |||||||||||||||
| Corporate and Other (7) |
55 | (7,699 | ) | 22,639 | 16,481 | |||||||||||||||
|
|
|
|
|
|
|
|
|
|||||||||||||
| Subtotal |
907,818 | (15,311 | ) | 41,677 | 24,059 | |||||||||||||||
| Transitional Group (8) |
112,085 | (54,379 | ) | 6,675 | 2,412 | |||||||||||||||
| Discontinued Operations |
11,473 | |||||||||||||||||||
|
|
|
|
|
|
|
|
|
|||||||||||||
| Total |
$ | 1,019,903 | $ | (69,690 | ) | $ | 48,352 | $ | 37,944 | |||||||||||
|
|
|
|
|
|
|
|
|
|||||||||||||
| (1) | The statement of loss and comprehensive loss balances including revenue, operating loss and depreciation and amortization are presented above on a continuing operations basis. Total assets and capital expenditures are presented on a consolidated basis including continuing and discontinued operations. |
137
Table of Contents
For the year ended December 31, 2014, segment results included:
| (2) | Career Colleges: $14.5 million related to long-lived asset impairment and a $2.2 million trade name impairment charge. |
| (3) | Corporate and Other: $8.6 million of income related to an insurance recovery. |
For the year ended December 31, 2013, segment results included:
| (4) | Career Colleges: $4.7 million of trade name and asset impairment charges and $8.8 million related to the settlement of a legal matter. |
| (5) | Transitional Group: $3.1 million in asset impairment charges and $1.7 million related to the settlement of legal matter. |
For the year ended December 31, 2012, segment results included:
| (6) | Career Colleges: $53.0 million of goodwill and trade name impairment charges. |
| (7) | Corporate and Other: A $19.0 million insurance recovery related to the settlement of claims under certain insurance policies. |
| (8) | Transitional Group: $32.6 million of goodwill, trade name and asset impairment charges. |
| (9) | Total assets do not include intercompany receivable or payable activity between institutions and corporate and investments in subsidiaries. |
18. QUARTERLY FINANCIAL SUMMARY (UNAUDITED)
Summary financial information by quarter is as follows (dollars in thousands, except per share data):
| Quarter | Total Year | |||||||||||||||||||
| 2014 |
First | Second (4) | Third (5) | Fourth (6) | ||||||||||||||||
| Revenue (1) |
$ | 198,154 | $ | 186,172 | $ | 182,825 | $ | 174,207 | $ | 741,358 | ||||||||||
| Operating loss (1) |
(21,949 | ) | (11,251 | ) | (31,732 | ) | (7,784 | ) | $ | (72,716 | ) | |||||||||
| Net loss |
(58,143 | ) | (46,564 | ) | (47,968 | ) | (25,488 | ) | $ | (178,163 | ) | |||||||||
| Net loss per share (2) |
||||||||||||||||||||
| Basic and Diluted |
$ | (0.87 | ) | $ | (0.69 | ) | $ | (0.71 | ) | $ | (0.38 | ) | $ | (2.65 | ) | |||||
| Quarter | Total Year | |||||||||||||||||||
| 2013 |
First (3) | Second (4) | Third (5) | Fourth (6) | ||||||||||||||||
| Revenue (1) |
$ | 228,655 | $ | 212,574 | $ | 199,079 | $ | 199,373 | $ | 839,681 | ||||||||||
| Operating loss (1) |
(5,570 | ) | (30,279 | ) | (30,563 | ) | (14,429 | ) | $ | (80,841 | ) | |||||||||
| Net loss |
(15,203 | ) | (31,390 | ) | (87,064 | ) | (30,606 | ) | $ | (164,263 | ) | |||||||||
| Net loss per share (2) |
||||||||||||||||||||
| Basic and Diluted |
$ | (0.23 | ) | $ | (0.47 | ) | $ | (1.30 | ) | $ | (0.46 | ) | $ | (2.46 | ) | |||||
| (1) | As of December 31, 2014, the results of operations for our Culinary Arts campuses that are held for sale as well as campuses that were taught out or institutions that were sold during 2014 (see Note 2 “Summary of Significant Accounting Polices” for further information), along with our campuses that had previously ceased operations or were sold and are considered distinct operations, are presented within discontinued operations for all periods presented. |
| (2) | Basic and diluted earnings per share are calculated independently for each of the quarters presented. Accordingly, the sum of the quarterly earnings per share amounts may not agree with the annual earnings per share amount for the corresponding year. |
| (3) | First quarter of 2013 net loss included a $6.7 million loss on sale of AIU London. |
| (4) | Second quarter of 2014 net loss included $7.4 million of trade name impairment charges within loss from discontinued operations. Second quarter of 2013 net loss included $10.0 million related to the settlement of a legal matter and $4.0 million in trade name impairment charges, of which $2.3 million was recorded within loss from discontinued operations. |
138
Table of Contents
| (5) | Third quarter of 2014 net loss included $3.0 million of trade name impairments (of which $1.5 million was recorded within loss from discontinued operations), $11.5 million of asset impairment charges and $8.6 million of income related to an insurance recovery. Third quarter of 2013 net loss included $11.6 million of trade name and asset impairment charges, of which $10.7 million was recorded within loss from discontinued operations. |
| (6) | Fourth quarter of 2014 net loss included $14.2 million of trade name and asset impairment charges, of which $10.3 million was recorded within loss from discontinued operations. Additionally, the fourth quarter of 2014 included a decrease of $9.4 million of revenue, a decrease of $7.5 million of bad debt expense and a $0.5 million increase to the loss from discontinued operations for a cumulative adjustment related to revenue recognition for withdrawn students. See Note 2 “Summary of Significant Accounting Policies – g. Revenue Recognition” for more information. Fourth quarter of 2013 net loss included a $130.1 million gain related to the sale of our International Segment, a $72.2 million valuation allowance recorded against our deferred tax assets, $15.5 million for a pending legal settlement recorded within loss from discontinued operations and $7.0 million in asset impairment charges of which $1.0 million was recorded within loss from discontinued operations. |
19. SUBSEQUENT EVENT
In the first quarter of 2015, Scott W. Steffey resigned from his positions as President and Chief Executive Officer and as a member of the Board of Directors (the “Board”) of Career Education Corporation and all other positions held at the Company and its affiliates. The Board appointed Ronald D. McCray, as Interim President and Chief Executive Officer of the Company. Mr. McCray will lead the Company while a search for a new President and Chief Executive Officer is conducted. Mr. McCray continues to serve as Chairman and as a member of the Board.
In connection with the termination of his employment, Mr. Steffey and the Company entered into a Separation and Release Agreement (the “Separation Agreement”) effective as of February 12, 2015. Under the terms of the Separation Agreement, the Company will pay Mr. Steffey $2.5 million in consideration for the cancellation of Mr. Steffey’s outstanding or promised equity and incentive awards, vested and unvested, including but not limited to, stock options, cash-settled stock appreciation rights, cash-settled restricted stock units, restricted stock units and performance units. The $2.5 million payment takes into account Mr. Steffey’s vested equity grants; the acceleration of equity grants due to vest on March 14, 2015; and the 2014 Annual Incentive Plan Bonus, offset by Mr. Steffey’s repayment of the portion of the sign-on award provided under the terms of the Employment Agreement entered into between Mr. Steffey and the Company on April 1, 2013 (the “Employment Agreement”) and Mr. Steffey’s repayment of certain travel and other expenses due the Company. The $2.5 million payment is not expected to have a material impact on the Company’s 2015 financial performance or financial position as the majority of expenses related to the payment had been previously recorded as of December 31, 2014.
139
Table of Contents
CAREER EDUCATION CORPORATION AND SUBSIDIARIES
Schedule II
Valuation and Qualifying Accounts
(Dollars in thousands)
| Description |
Balance, Beginning of Period |
Additions/Charges to Expense |
Deductions/ Other |
Balance, End of Period |
||||||||||||
| Valuation allowance for deferred tax assets (1): |
||||||||||||||||
| For the year ended December 31, 2014 |
$ | 82,876 | $ | 71,826 | $ | (4,318 | ) | $ | 150,384 | |||||||
|
|
|
|
|
|
|
|
|
|||||||||
| For the year ended December 31, 2013 |
$ | 6,057 | $ | 80,536 | $ | (3,717 | ) | $ | 82,876 | |||||||
|
|
|
|
|
|
|
|
|
|||||||||
| For the year ended December 31, 2012 |
$ | 4,327 | $ | 4,955 | $ | (3,225 | ) | $ | 6,057 | |||||||
|
|
|
|
|
|
|
|
|
|||||||||
| Valuation allowance for accounts receivable: |
||||||||||||||||
| For the year ended December 31, 2014 |
$ | 17,570 | $ | 15,850 | $ | (18,903 | ) | $ | 14,517 | |||||||
|
|
|
|
|
|
|
|
|
|||||||||
| For the year ended December 31, 2013 |
$ | 21,524 | $ | 20,418 | $ | (24,372 | ) | $ | 17,570 | |||||||
|
|
|
|
|
|
|
|
|
|||||||||
| For the year ended December 31, 2012 |
$ | 26,371 | $ | 21,914 | $ | (26,761 | ) | $ | 21,524 | |||||||
|
|
|
|
|
|
|
|
|
|||||||||
| (1) | Amounts include both continuing and discontinued operations gross deferred tax balances. |
140
Table of Contents
INDEX TO EXHIBITS
| Exhibit |
Exhibit |
Incorporated by Reference to: | ||
| 2.1 | Securities Purchase Agreement dated October 22, 2013 between CEC Europe, LLC & Investors, S.C.S., Career Education Corporation and Insignis | Exhibit 2.1 to our Current Report on Form 8-K filed on December 4, 2013 | ||
| 3.1 | Restated Certificate of Incorporation of Career Education Corporation and Amendment thereto (originally incorporated on January 5, 1994) | Exhibit 3.1 to our Form 10-Q for the period ended June 30, 2012 | ||
| 3.2 | Sixth Amended and Restated By-laws of Career Education Corporation (as amended as of October 24, 2013) | Exhibit 3.2 to our Form 10-Q for the period ended September 30, 2013 | ||
| 4.1 | Form of specimen stock certificate representing Common Stock | Exhibit 4.1 to our Registration Statement on Form S-1, effective as of January 28, 1998 | ||
| 4.2 | Amended and Restated Credit Agreement dated as of December 30, 2013 among Career Education Corporation, CEC Educational Services, LLC, the guarantors from time to time parties thereto, the lenders from time to time parties thereto and BMO Harris Bank N.A., as administrative agent and letter of credit issuer (“Credit Agreement”) | Exhibit 99.1 to our Form 8-K filed January 2, 2014 | ||
| 4.3 | First Amendment to Credit Agreement dated as of October 31, 2014 | Exhibit 10.1 to our Form 10-Q for the quarter ended September 30, 2014 | ||
| +4.4 | Second Amendment to Credit Agreement dated as of January 30, 2015 | |||
| *10.1 | Career Education Corporation 1998 Non-Employee Directors’ Stock Option Plan (“1998 Directors Plan”) | Exhibit 10.5 to our Registration Statement on Form S-1, effective as of January 28, 1998 | ||
| *10.2 | First Amendment to the 1998 Directors Plan | Exhibit 10.13 to our Form 10-Q for the period ended September 30, 2002 (File No. 000-23245) | ||
| *10.3 | Second Amendment to the 1998 Directors Plan | Exhibit 10.5 to our Form 10-K for the year ended December 31, 2008 (File No. 000-23245) | ||
| *10.4 | Form of Non-Employee Director’s Stock Option Agreement under the 1998 Directors’ Plan | Exhibit 10.6 to our Registration Statement on Form S-1, effective as of January 28, 1998 | ||
| *10.5 | Career Education Corporation 1998 Employee Incentive Compensation Plan (“1998 Plan”) and the First, Second, Third, Fourth and Fifth Amendments thereto | Exhibit B to our Proxy Statement dated April 16, 2004 (File No. 000-23245) | ||
| *10.6 | Sixth Amendment to the 1998 Plan | Exhibit 10.14 to our Form 10-Q for the period ended June 30, 2004 (File No. 000-23245) | ||
| *10.7 | Seventh Amendment to the 1998 Plan | Exhibit 10.1 to our Form 10-Q for the period ended September 30, 2005 (File No. 000-23245) | ||
141
Table of Contents
| Exhibit |
Exhibit |
Incorporated by Reference to: | ||
| *10.8 | Form of Incentive Stock Option Agreement under the 1998 Plan | Exhibit 10.4 to our Registration Statement on Form S-1, effective as of January 28, 1998 | ||
| *10.9 | Career Education Corporation 2008 Incentive Compensation Plan (“2008 Plan”) | Exhibit 10.1 to our Form 8-K filed on May 16, 2008 (File No. 000-23245) | ||
| *10.10 | First Amendment to the 2008 Plan | Exhibit 10.30 to our Form 10-K for the year ended December 31, 2008 (File No. 000-23245) | ||
| *10.11 | Non-Employee Director Share Accumulation Program pursuant to the 2008 Plan | Exhibit 10.36 to our Form 10-K for the year ended December 31, 2009 (File No. 000-23245) | ||
| +*10.12 | 2014 Annual Incentive Award Program for Key Executives pursuant to the 2008 Plan | |||
| +*10.13 | 2014 Annual Incentive Award Program pursuant to the 2008 Plan | |||
| *10.14 | Form of 2008 Non-Qualified Stock Option Grant Agreement under the 2008 Plan | Exhibit 10.2 to our Form 8-K filed on May 16, 2008 (File No. 000-23245) | ||
| *10.15 | Form of Non-Employee Director Option Grant Agreement under the 2008 Plan | Exhibit 10.1 to our Form 10-Q for the period ended June 30, 2011 | ||
| *10.16 | Form of Non-Qualified Stock Option Agreement (General Counsel) under the 2008 Plan | Exhibit 10.1 to our Form 8-K filed on February 27, 2009 (File No. 000-23245) | ||
| *10.17 | Form of Non-Qualified Stock Option Agreement under the 2008 Plan | Exhibit 10.3 to our Form 8-K filed on February 27, 2009 (File No. 000-23245) | ||
| *10.18 | Form of Option Extension and Amendment Agreements dated February 20, 2009 between the Company and the following non-employee directors: Dennis H. Chookaszian, Patrick W. Gross, Thomas B. Lally and Leslie T. Thornton | Exhibit 10.1 to our Form 8-K filed on February 20, 2009 (File No. 000-23245) | ||
| *10.19 | Form of Option Extension and Amendment Agreements dated February 20, 2009 between the Company and David W. Devonshire | Exhibit 10.2 to our Form 8-K filed on February 20, 2009 (File No. 000-23245) | ||
| *10.20 | Form of Option Extension Agreement dated February 20, 2009 between the Company and Gregory L. Jackson | Exhibit 10.3 to our Form 8-K filed on February 20, 2009 (File No. 000-23245) | ||
| *10.21 | Form of Option and Restricted Stock Amendment Agreements dated February 20, 2009 between the Company and its Section 16 reporting officers at that time | Exhibit 10.4 to our Form 8-K filed on February 20, 2009 (File No. 000-23245) | ||
| *10.22 | Form of Employee Non-Qualified Stock Option Agreement under the 2008 Plan | Exhibit 10.2 to our Form 8-K filed on March 6, 2012 | ||
| *10.23 | Form of Employee Non-Qualified Stock Option Agreement under the 2008 Plan (used for awards in 2013) | Exhibit 10.3 to our Form 8-K filed on March 8, 2013 | ||
142
Table of Contents
| Exhibit |
Exhibit |
Incorporated by Reference to: | ||
| *10.24 | Form of Employee Non-Qualified Stock Option Agreement under the 2008 Plan (Time-Based) (used for awards commencing in 2014) | Exhibit 10.2 to our Form 8-K filed on March 10, 2014 | ||
| *10.25 | Form of Restricted Stock Agreement under the 2008 Plan | Exhibit 10.4 to our Form 8-K filed on February 27, 2009 (File No. 000-23245) | ||
| **10.26 | Form of Non-Employee Director Deferred Stock Unit Agreement under the Career Education Corporation 2008 Incentive Compensation Plan | Exhibit 10.1 to our Form 10-Q for the quarter ended June 30, 2014 | ||
| *10.27 | Form of Employee Restricted Stock Unit Award Agreement under the 2008 Plan (Tim-Based) (used for awards in 2012) | Exhibit 10.1 to our Form 8-K filed on March 6, 2012 | ||
| *10.28 | Form of Employee Restricted Stock Unit Award Agreement under the 2008 Plan (Time-Based) (used for awards in 2013) | Exhibit 10.4 to our Form 8-K filed on March 8, 2013 | ||
| *10.29 | Form of Employee Restricted Stock Unit Award Agreement under the 2008 Plan (Time-Based) (used for awards commencing in 2014) | Exhibit 10.3 to our Form 8-K filed on March 10, 2014 | ||
| *10.30 | Form of Employee Restricted Stock Unit Award Agreement under the 2008 Plan (Performance-Based) (used for awards commencing in 2014) | Exhibit 10.1 to our Form 8-K filed on March 19, 2014 | ||
| *10.31 | Form of Employee Cash-Settled Restricted Stock Unit Award Agreement under the 2008 Plan (Time-Based) (used for awards in 2013) | Exhibit 10.1 to our Form 8-K filed on March 8, 2013 | ||
| *10.32 | Form of Employee Cash-Settled Restricted Stock Unit Award Agreement under the 2008 Plan (Time-Based) (used for awards commencing in 2014) | Exhibit 10.4 to our Form 8-K filed on March 10, 2014 | ||
| *10.33 | Form of 2013 Performance Unit Award Agreement under the 2008 Plan | Exhibit 10.2 to our Form 8-K filed on March 8, 2013 | ||
| *10.34 | Form of 2014 Performance Unit Award Agreement under the 2008 Plan | Exhibit 10.1 to our Form 8-K filed on March 10, 2014 | ||
| *10.35 | Letter Agreement between Career Education Corporation and Lysa Clemens dated June 11, 2013 | Exhibit 10.5 to our Form 10-Q for the quarter ended June 30, 2013 | ||
| *10.36 | Letter Agreement between Career Education Corporation and Jeffrey R. Cooper dated January 10, 2014 | Exhibit 10.6 to our Form 10-Q for the quarter ended March 31, 2014 | ||
| *10.37 | Letter Agreement between Career Education Corporation and Diane Auer Jones dated July 17, 2013 | Exhibit 10.1 to our Form 10-Q for the quarter ended September 30, 2013 | ||
| **10.38 | Letter Agreement between Career Education Corporation and Reid Simpson dated May 21, 2014 | Exhibit 10.1 to our Form 8-K filed on May 22, 2014 | ||
| **10.39 | Transition and Separation Agreement and General Release between Career Education Corporation and Colleen O’Sullivan dated June 10, 2014 | Exhibit 10.1 to our Form 8-K filed on June 13, 2014 | ||
| *10.40 | Letter Agreement between Career Education Corporation and Scott Steffey dated April 1, 2013 | Exhibit 10.1 to our Form 8-K filed on April 8, 2013 | ||
143
Table of Contents
| Exhibit |
Exhibit |
Incorporated by Reference to: | ||
| *10.41 | Separation and Release Agreement between the Company and Scott Steffey dated February 12, 2015 | Exhibit 10.1 to our Form 8-K filed on February 12, 2015 | ||
| *10.42 | Form of Indemnification Agreement for Directors and Executive Officers | Exhibit 10.1 to our Form 8-K filed June 25, 2008 (File No. 000-23245) | ||
| **10.43 | Career Education Corporation Executive Severance Plan (Amended and Restated as of January 1, 2015) | Exhibit 10.1 to our Form 8-K filed December 18, 2014 | ||
| +21 | Subsidiaries of the Company | |||
| +23.1 | Consent of Ernst & Young LLP | |||
| +31.1 | Certification of CEO Pursuant to Section 302 of Sarbanes-Oxley Act of 2002 | |||
| +31.2 | Certification of CFO Pursuant to Section 302 of Sarbanes-Oxley Act of 2002 | |||
| +32.1 | Certification of CEO Pursuant to Section 906 of Sarbanes-Oxley Act of 2002 | |||
| +32.2 | Certification of CFO Pursuant to Section 906 of Sarbanes-Oxley Act of 2002 | |||
| +101 | The following financial information from our Annual Report on Form 10-K for the twelve months ended December 31, 2014, filed with the SEC on March 3, 2015, formatted in Extensible Business Reporting Language (XBRL): (i) the Consolidated Balance Sheets as of December 31, 2014 and December 31, 2013, (ii) the Consolidated Statements of Loss and Comprehensive Loss for the twelve months ended December 31, 2014, December 31, 2013 and December 31, 2012, (iii) the Consolidated Statements of Stockholders’ Equity for the twelve months ended December 31, 2014, December 31, 2013 and December 31, 2012, (iv) the Consolidated Statements of Cash Flows for the twelve months ended December 31, 2014, December 31, 2013 and December 31, 2012, and (v) Notes to Consolidated Financial Statements | |||
| * | Management contract or compensatory plan or arrangement required to be filed as an Exhibit to this Form 10-K. |
| + | Filed herewith. |
144