Attached files
| file | filename |
|---|---|
| 8-K - FORM 8-K - PTC INC. | form8k.htm |
| EX-99.1 - PRESS RELEASE - PTC INC. | presrel.htm |
Q4 FISCAL 2014 PREPARED REMARKS
Executing on our long-term financial strategy
In November 2009 we outlined an aggressive commitment to deliver 20% per year non-GAAP EPS growth annually over five years by accelerating revenue growth and driving substantial margin improvement. Over these past five years we have outperformed that commitment, growing non-GAAP EPS at a 22% CAGR (compound annual growth rate) and operating cash flow at an 34% CAGR. We have achieved this goal through a combination of non-GAAP operating margin expansion (from 13% in FY’09 to 25% in FY’14) and non-GAAP revenue expansion at an 8% CAGR (4% organic and 4% from acquisitions). Our new goal is to drive 15% compound annual growth in non-GAAP EPS through 2018 based on a combination of improved revenue growth, further expansion of operating margins, reduced share count through our capital allocation strategy, and improved tax outlook.
Evolving our corporate strategy
Our strategy has evolved considerably since 2009. Our customers – and the manufacturing industry in general – are now creating products with increasing mechanical complexity and far greater software intelligence, and they are progressively following the trend of servitization and deploying these products with an associated service strategy or business model. These products are the “things” in the “Internet of Things”, and as products become both smart and connected, the feedback loops now being created from the product back to the customer or operator and to the Engineering, Manufacturing, and Sales and Service departments of the manufacturer represent a breakthrough opportunity to dramatically transform the way products are created, operated, and serviced. The transformative power of smart connected products is outlined in the cover story of the November 2014 issue of Harvard Business Review, which was co-authored by Professor Michael Porter and our CEO James Heppelmann. Similarly, McKinsey, Gartner Group, and other firms have published estimates suggesting that the business transformation enabled by the Internet of Things will create trillions of dollars of economic value in the manufacturing industry by 2025.
Following this trend toward smart, connected products and associated service-oriented business models, we have expanded our product portfolio over the last five years to include Application Lifecycle Management (ALM), Service Lifecycle Management (SLM), and Internet of Things (IoT) software solutions. As a result, we are now able to provide a full technology stack for smart connected products, helping customers to design both the physical (CAD) and smart elements (ALM), to connect those products to the cloud (IoT), and in so doing to gather feedback and capture knowledge of the product in its operational environment to enhance the product operation, evolve the product’s design and configuration (PLM), and optimize service needs (SLM) over the full lifecycle of the product.
With our cloud services offering, we are lowering the barrier of entry to our customers by hosting and managing PTC enterprise applications. With our professional services offerings, we are also increasingly acting as the trusted guide that can help our customers transform their businesses and capture this technology-enabled value opportunity.
Growing our addressable market
We estimate the total addressable market for our software products is approximately $17 billion for our FY’15, growing approximately 8% per year, based on third party data sources and our PTC strategy team’s forecasts. Based on overall market penetration rates and relative maturity levels, we see the strongest growth potential in the IoT and SLM markets, with more modest growth expectations for CAD and EPLM (Extended PLM). We believe we can grow at or modestly faster than the markets in which we participate based on our technology leadership position in these markets. In particular, the cross-sell opportunities between CAD/EPLM, SLM, and IoT segment within our customer base are substantial, and SLM and IoT represent an excellent opportunity for new account capture and development.
PTC Addressable Market Estimates (Assumes Increasing Mix of IoT and SLM Business)
|
FY’15
|
FY’15-'18
|
FY’15-‘18
|
||
|
PTC
|
Total
|
Total
|
PTC
|
|
|
Solution
|
Addressable
|
Market
|
License
|
|
|
Market
|
Area
|
Size
|
CAGR
|
CAGR (1)
|
|
Computer-Aided Design (CAD) (3)
|
CAD
|
$4.3B
|
~4%
|
3% - 5%
|
|
Product Lifecycle Management (PLM) (4)
|
Extended PLM
|
$5.2B
|
~6%
|
6% - 8%
|
|
Application Lifecycle Management (ALM) (5)
|
Extended PLM
|
$3.5B
|
~8%
|
7% - 9%
|
|
Service Lifecycle Management (SLM) (6)
|
SLM & IoT
|
$4.0B
|
~11%
|
10% - 15%
|
|
Internet of Things (IoT) (7)
|
SLM & IoT
|
$1.1B
|
~38%
|
~40%
|
|
Total
|
$17B
|
~8%
|
10% - 12% (2)
|
|
|
(1) Includes perpetual software license and subscriptions
|
||||
|
(2) Assumes steadily increasing mix of IoT and SLM business throughout FY’15-FY’18 CAGR period
|
||||
|
(3) PTC Creo® and PTC Mathcad®
|
||||
|
(4) PTC Windchill® and supply chain management (SCM) software solutions
|
||||
|
(5) PTC IntegrityTM and Atego®
|
||||
|
(6) PTC Arbortext® and PTC Servigistics®
|
||||
|
(7) PTC ThingWorx® and Axeda®
|
||||
Software licensing models: perpetual and subscription
A majority of our software license sales to date have been perpetual licenses, where customers own the software license and revenue is recognized at the time of sale. Typically our customers choose to pay for ongoing support, which includes the right to software upgrades and technical support, and attach rates on support are in the high 90% range with retention rates in the 90% range. Due to evolving customer preferences as well as acquisitions we have made in the IoT and cloud services space, a small but growing percentage of our business consists of ratably recognized subscriptions. Under a subscription, customers do not own the software but pay a periodic fee for right to use our software, including access to technical support. They may also elect to use our cloud services and have us manage the application.
While we expect a significant majority of our customer base to continue to purchase our software offerings under a perpetual licensing arrangement, we are also offering subscription pricing as an option for most PTC products
starting in FY’15. We believe this additional buying option could prove attractive over time as it: (1) increases customer flexibility and opportunity to change their mix of licenses; (2) lowers the potential initial purchase commitment; and (3) allows customers the ability to use operating rather than capital budgets. Over a three to five year period we believe the net present value (NPV) of a subscription is likely to exceed a perpetual license, assuming similar seat counts. However, initial revenue, operating margin, and EPS will be lower as revenue is recognized ratably in a subscription, rather than up front.
For planning purposes we assume 85% of our Perpetual License & Subscription Solutions business in Q1’15 and FY’15 will be perpetual license sales, down from approximately 92% in FY’14. The remainder of our Perpetual License & Subscription Solutions revenue is a combination of run-rate revenue from previous bookings plus new and renewal subscription solutions bookings (subscription software and cloud services), of which a portion will be recognized as revenue during the quarter and year, and the balance of which will be recorded as billed in deferred revenue and be recognized ratably over the remaining term of the subscription (as run-rate revenue).
New business line categories and reporting metrics
Through FY’14 we have provided revenue disclosure in three key lines of business: (1) license; (2) service; and (3) support. Starting in Q1’15, we plan to begin disclosing revenue trends as follows: (1) perpetual license & subscription solutions; (2) support; and (3) professional services. As part of this new line of business breakdown, we plan to separate cloud services revenue from professional services revenue and include it with our perpetual license & subscription solutions line of business. This change is shown in our guidance table and will be reflected in Q1’15 reported results.
In order to provide deeper insight into our recurring revenue businesses, we will begin reporting additional metrics: (1) annualized contract value (ACV) bookings for new and renewal business; (2) deferred subscription revenue; and (3) subscription solutions revenue percentage of total revenue. When we provide guidance we will indicate assumptions for mix of perpetual versus subscription revenue in addition to the key foreign exchange rate assumptions we have previously incorporated.
Delivering value for shareholders; long-term financial targets
Our goal remains to enhance value for our stakeholders through improving financial performance. We believe our revenue growth strategy and operational discipline will enhance free cash flow (operating cash flow less capital expenditures) over time, and we have committed to a long-term goal of returning approximately 40% of our free cash flow to shareholders via stock repurchases.
Assuming a constant mix of perpetual and subscription sales, we expect to achieve a 26% non-GAAP operating margin in FY’15, with a 28% to 30% non-GAAP operating margin by FY’17 and into FY’18. We anticipate achieving
non-GAAP operating margin improvement through a mix of measures including: (1) increasing our non-GAAP professional services gross margin toward our longer-term goal of 20% by FY’18; (2) further expanding our professional services partner ecosystem to reduce professional services revenue as a percentage of total revenue; (3) enhancing sales force productivity and efficiency; (4) implementing solutions that require shorter sales cycles and less professional services; (5) continued vigilance on cost control; and (6) driving revenue growth across our existing markets while capitalizing on new opportunities, such as the trend toward smart, connected products and the Internet of Things. Based on these initiatives, we expect to grow non-GAAP EPS at a compound annual rate of approximately 15% through FY’18.
Our FY’18 long-term revenue growth target assumes a stable, healthy macroeconomic environment, and that we grow at or greater than the growth rates of the markets in which we participate, as well as 2% to 4% of acquisition-related growth. If our subscription offerings prove more attractive to our customers than our base case assumption, it will have a more adverse impact on revenue, operating margin, cash flow and EPS growth than we are currently anticipating in our financial targets. Should this happen, we believe it will be NPV positive to PTC over the long term. We will provide relevant information during this transition to help investors understand how our business model is evolving.
PTC Financial Targets - Historical Results Recast to Reflect New Reporting Framework
|
FY'15
|
FY'18
|
||||||
|
Non-GAAP
|
FY'10
|
FY'11
|
FY'12
|
FY'13
|
FY'14
|
Outlook
|
Target
|
|
Growth Metrics
|
|||||||
|
Revenue
|
|||||||
|
Perpetual license & subscription solutions growth
|
39%
|
16%
|
2%
|
2%
|
9%
|
4%-10%
|
12%-15%
|
|
Support growth
|
(1%)
|
13%
|
10%
|
7%
|
5%
|
1%
|
2%-4%
|
|
Professional services growth
|
(4%)
|
23%
|
11%
|
(4%)
|
(2%)
|
(6%)
|
(0%)-(3%)
|
|
Total revenue growth
|
8%
|
16%
|
8%
|
3%
|
5%
|
0%-2%
|
6%-10%
|
|
Operating Metrics
|
|||||||
|
Gross margin
|
72%
|
71%
|
72%
|
73%
|
75%
|
75%-76%
|
76%-78%
|
|
Sales & marketing
|
30%
|
29%
|
29%
|
27%
|
26%
|
25%-26%
|
24%-25%
|
|
R & D
|
19%
|
17%
|
16%
|
16%
|
16%
|
15%-16%
|
15%-16%
|
|
G & A
|
8%
|
7%
|
7%
|
8%
|
8%
|
7%-8%
|
7%-8%
|
|
Operating margin
|
16%
|
18%
|
20%
|
22%
|
25%
|
~26%
|
28%-30%
|
|
Tax rate
|
23%
|
24%
|
24%
|
22%
|
21%
|
18%
|
18%-20%
|
|
Shares outstanding
|
120M
|
121M
|
121M
|
121M
|
120M
|
~117M
|
~112M
|
|
EPS growth
|
25%
|
26%
|
20%
|
20%
|
20%
|
7%-10%
|
~15%
|
|
* Revenue growth rates for FY’10 to FY’13 reflect our prior reporting framework
|
|||||||
Macroeconomic factors impact our business
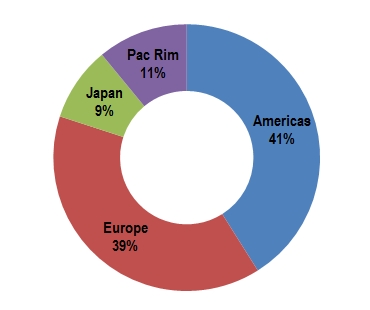
A significant percentage of our annual revenue comes from large customers in the broader manufacturing space. As a result, the historic license revenue growth in our core CAD and EPLM segments correlates to growth in broader measures of the global manufacturing economy including GDP, industrial production and manufacturing PMI. Current indicators suggest the US manufacturing economy is in the early stages of recovery, though the pace and timing remain uncertain. Nearly 60% of our annual revenue is outside the US, where manufacturing indicators appear to be weaker. GDP and PMI data in the Eurozone and Japan suggest manufacturing economies in those regions are slowing, while manufacturing activity in China remains subdued versus earlier levels. For 2015, our guidance assumes lackluster manufacturing economy growth in Europe, Japan, and the Pacific Rim, with the US manufacturing climate similar to 2014.
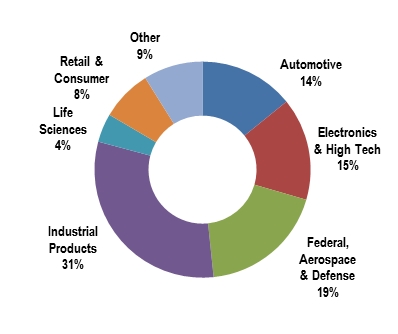
Trailing 12 Month Revenue by Industry Vertical and by Region
 |
 |
Financial guidance based on comprehensive planning methodology
We rely on a number of factors to set our internal plan and financial guidance including: (1) sales pipeline coverage data; (2) input from field sales; (3) large deal trends; (4) market and vertical industry analysis; and (5) macroeconomic factors, which correlate to significant portions of our business.
Q1 and FY’15 Guidance Table – Growth Rates Reflect Recast Historical Results
|
Q1'15
|
Q1'15
|
FY'15
|
FY'15
|
||
|
Low
|
High
|
Low
|
High
|
||
|
Perpetual license & subscription solutions
|
70
|
85
|
405
|
425
|
|
|
% mix of perpetual license
|
85%
|
85%
|
85%
|
85%
|
|
|
Support
|
180
|
180
|
700
|
700
|
|
|
Professional services
|
60
|
60
|
260
|
260
|
|
|
Total non-GAAP revenue
|
310
|
325
|
1,365
|
1,385
|
|
|
Perpetual license & subscription solutions growth
|
-16%
|
2%
|
4%
|
10%
|
|
|
Support growth
|
6%
|
6%
|
1%
|
1%
|
|
|
Professional services growth
|
-16%
|
-16%
|
-6%
|
-6%
|
|
|
Total non-GAAP revenue growth
|
-5%
|
0%
|
0%
|
2%
|
|
|
Non-GAAP gross margin
|
74%
|
74%
|
75%
|
76%
|
|
|
GAAP gross margin
|
72%
|
72%
|
73%
|
73%
|
|
|
Non-GAAP operating margin
|
23%
|
24%
|
26%
|
26%
|
|
|
GAAP operating margin
|
13%
|
14%
|
16%
|
16%
|
|
|
Total GAAP adjustments (1)
|
33
|
33
|
125
|
125
|
|
|
Other income (expense)
|
-4
|
-4
|
-15
|
-15
|
|
|
Non-GAAP tax rate
|
18%
|
18%
|
18%
|
18%
|
|
|
GAAP tax rate
|
25%
|
25%
|
25%
|
25%
|
|
|
Share count
|
117
|
117
|
117
|
117
|
|
|
Non-GAAP EPS
|
$0.47
|
$0.51
|
$2.33
|
$2.40
|
|
|
Non-GAAP EPS growth
|
-5%
|
3%
|
7%
|
10%
|
|
|
GAAP EPS
|
$0.20
|
$0.25
|
$1.33
|
$1.40
|
|
|
GAAP EPS growth
|
-39%
|
-24%
|
-2%
|
3%
|
|
|
FX Assumptions: USD/EURO = 1.25; YEN/USD = 115
|
|||||
|
Impact of currency fluctuation vs. Q1’14 on Q1’15 non-GAAP revenue guidance is ~$12 million and on non-GAAP EPS is ~$0.04
|
|||||
|
Impact of currency fluctuation vs. FY’14 on FY’15 non-GAAP revenue guidance is ~$50 million and on non-GAAP EPS is ~$0.15
|
|||||
|
(1) Adjustments are detailed in the Q4FY’14 Expenses Commentary and Q1 & FY’15 Outlook section
|
|||||
FY’15 Investor Day Event – November 13, 2014
We will host our FY’15 investor day meeting at the NASDAQ MarketSite in New York City from approximately 8:00am ET to 2:45pm ET. Investors will have the opportunity to hear from many of our key business leaders, who will provide additional insight into our future vision, corporate strategy and go-to-market approach, as well as a deeper look at our long-term financial targets and objectives.
Supplemental Information
We provide non-GAAP supplemental information to our GAAP information. A reconciliation between GAAP results and non-GAAP information and PTC's reasons for providing this information are at the end of this document. Year-over-year changes in revenue on a constant currency (FX) basis compare actual reported results converted into U.S. dollars based on the corresponding prior year’s foreign currency exchange rates to reported results for the comparable prior year period.
Q4 FY’14 - Key Points
|
1)
|
Our Q4 non-GAAP EPS of $0.67 was up 13% year over year, above our guidance range, driven by higher than expected license and support revenue, a lower than expected tax rate, and cost controls in the core business, offset by lower services gross margin, investments in our IoT business, and our acquisitions of Atego and Axeda. Q4 non-GAAP EPS was up 12% year over year on a constant currency basis.
|
|
|
2)
|
Total Q4 non-GAAP revenue of $368.0 million was up 7% over Q4’13 non-GAAP revenue (up 6% year over year on a constant currency basis and up 2% on an organic constant currency basis), above the high end of our guidance range.
|
|
|
3)
|
Non-GAAP license revenue of $113.3 million was above the high end of our Q4 guidance range and was up 7% year over year (up 7% on a constant currency basis and up 3% on an organic constant currency basis). License revenue was strongest in Europe and our CAD and EPLM businesses, offsetting year over year declines in the Pacific Rim region and the SLM business.
|
|
|
4)
|
We delivered non-GAAP support revenue of $182.4 million, above our guidance and up 9% over Q4’13 non-GAAP support revenue (up 8% on a constant currency basis and up 6% on an organic constant currency basis).
|
|
|
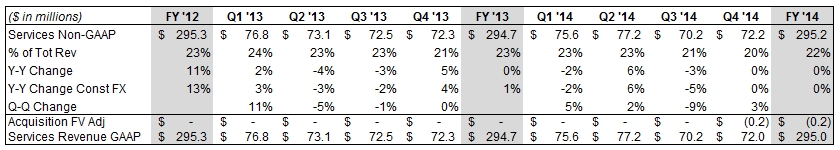
5)
|
Non-GAAP services revenue of $72.2 million came in above our guidance (and was flat year over year and on a constant currency basis, and down 7% on an organic constant currency basis). Non-GAAP services gross margin of 12.6% declined from 14.2% in Q3’14 and 15.4% in Q4’13, due to excess capacity, which we addressed with our restructuring action in Q4, as well as investments we are making in certain projects with strategic customers, which we expect to continue through the first half of FY’15.
|
|
|
6)
|
We had 33 large deals (greater than $1 million in license and services revenue from a single customer recognized in the quarter) that contributed $86.7 million in revenue, a 4% increase year over year. These included two mega deals (greater than $5 million in license revenue), which contributed $16 million in revenue in Q4.
|
|
|
7)
|
We generated $51 million in operating cash flow and borrowed net $297 million during the quarter to repurchase $125 million of shares and acquire Axeda for approximately $166 million. Additionally we used approximately $46 million to acquire Atego. We ended the quarter with a cash balance of $294 million.
|
|
8)
|
Non-GAAP revenue contribution from acquired businesses was $15.6 million, including $4.6 million from Atego, acquired on June 30, 2014, $4.3 million from Axeda, acquired on August 11, 2014, and $6.7 million from previously acquired businesses (Enigma, NetIDEAS, and ThingWorx).
|
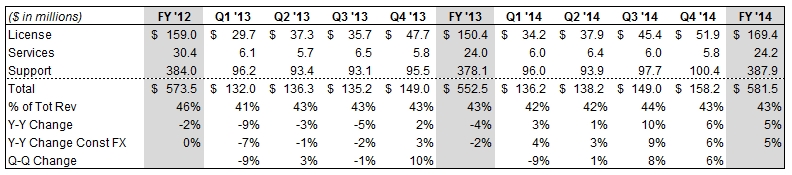
REVENUE TRENDS
LICENSE: Strength in Europe and our CAD and Extended PLM businesses
License sales generate the highest non-GAAP gross margins, which are approximately 96%. License revenue historically has tended to represent 25% to 30% of our total revenue in any given quarter, with Q4 generally being our strongest quarter.
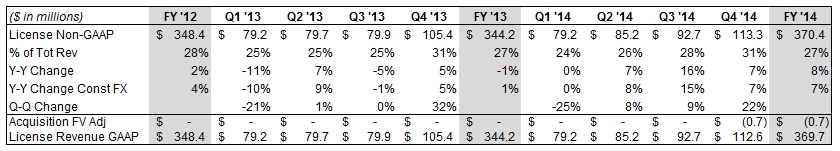
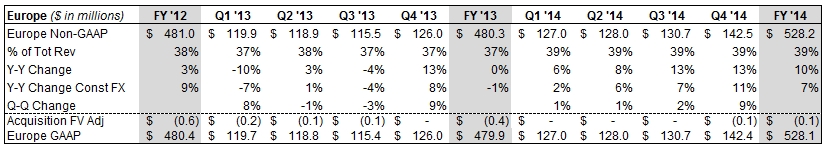
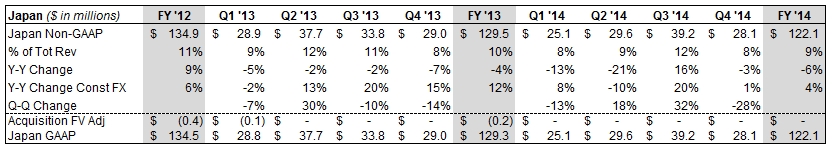
Q4 License revenue was up 7% year over year and on a constant currency basis, up 3% on an organic constant currency basis, and above our guidance range. Continuing the trend we saw during the first three quarters of FY’14, Europe was our strongest growth region, with 29% year-over-year reported growth and 28% constant currency growth. License revenue also increased in the Americas (up 14% year over year) and in Japan (up 2% year over year and 7% on a constant currency basis). The Pacific Rim remained our weakest region with license revenue down 28% year over year and down 29% on a constant currency basis, reflecting a difficult macroeconomic environment in the region.
CAD License Revenue: We saw continued healthy growth in CAD license revenue, with Q4 up 9% year over year on both a reported and constant currency basis. Performance in Q4 was helped by strong growth in sales of Creo® modules, eLearning, and a multi-million dollar license purchase of one of our heritage products. Sales of new licenses, modules and upgrades associated with our Creo® platform accounted for two thirds of CAD license revenue, and were down 5% versus Q4’13, which was a record quarter for sales of new Creo licenses, modules and upgrades. For FY’14, CAD license revenue of $169 million represented our strongest year since 2011, up 13% year over year on both a reported and constant currency basis – driven by double digit growth in Creo modules and upgrades, training software, and certain heritage products.
Looking forward, 75% of our CAD customers have now adopted the Creo platform, in line with our expectations, with positive customer feedback on the transition. In fact, during FY’14 was saw a greater than expected percentage of large customers transition to the Creo platform and purchase new software. As a result, we believe our CAD license revenue growth exceeded the overall market growth rate during FY’14. For FY’15, we continue to expect customers will transition to Creo, although with fewer large customers making the switch and more difficult comparisons, we
expect CAD license revenue growth could underperform the market. Through FY’18, we expect our CAD business will grow in line with market growth rates.
EPLM License Revenue: Q4 license revenue in our EPLM business grew 12% year over year on a reported basis, 11% on a constant currency basis, and 8% on an organic constant currency basis. Q4 PLM license revenue, primarily Windchill, grew 6% year over year on a reported and constant currency basis while license sales for our ALM business grew over 50% year over year on both a reported and organic constant currency basis, thanks to improving sales of our PTC Integrity product, which was up approximately 12% in FY’14. Q4 supply chain management solutions revenue declined 9% year over year on a reported basis and 8% year over year on a constant currency basis following near record level sales in Q3’14. For FY’14 EPLM license revenue of $162 million grew 8% year over year on a reported and constant currency basis, and 7% on an organic constant currency basis – representing our strongest year since FY’12. In FY’14 SCM saw strong double digit license growth, PLM license sales, primarily Windchill, increased by a mid-single digit percentage, and the increase in ALM was comparable to the overall performance of extended PLM on an organic constant currency basis.
Looking forward, we believe our EPLM business can modestly outgrow the overall PLM market based on our technology leadership position and ability to begin offering closed-loop lifecycle management solutions, with embedded IoT functionality, to customers in the near future. Beginning in FY15, we will no longer be providing a breakout of SCM as a part of EPLM revenue.
SLM & IoT License Revenue: Q4 SLM & IoT license revenue declined 12% year over year on a reported basis, 12% on a constant currency basis, and 42% on an organic constant currency basis. Q4 SLM license revenue declined 39% year over year on a reported and constant currency basis, and 42% on an organic constant currency basis. For FY’14 SLM license revenue declined 22% year over year on a reported and constant currency basis, and 27% on an organic constant currency basis. FY’14 SLM license revenue was affected by a slower-than-expected rebuild of our pipeline after a strong FY’13. Looking ahead to FY’15 we are encouraged by our current pipeline and the forthcoming introduction of connected SLM applications, and we believe our SLM business can return to double digit license growth.
IoT license revenue was $3.6 million in Q4’14, up over $3.3 million sequentially due to the acquisition of Axeda. Within our IoT business, we believe new logos and new ACV bookings growth will be key metrics with which to measure our success penetrating this market opportunity.
LARGE DEAL ACTIVITY:
Large deals are a significant growth driver and have historically tended to generate 20% to 25% of our total revenue in any given quarter. We define “large deals” as more than $1 million of license and service revenue recognized from a customer during a quarter. License revenue has historically comprised approximately 50% of the total large deal revenue in any quarter and was 63%, 59%, and 56% of total large deal revenue in Q4 ’14, Q3’14, and Q4’13,
respectively. We also track “mega deals,” which we define as transactions resulting in recognized license revenue of over $5 million in a quarter. In FY’14 we had a total of six mega deals, up from three in FY’13, and four in FY’12.
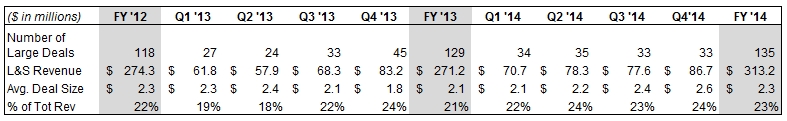
In Q4 we had 33 large deals, 15 of these customers were in the Americas, 12 were in Europe, 5 were in Asia, and one was split between the Americas and Europe. These included two mega deals, one in the Americas and one in Europe, compared to no mega deals in Q4’13. In FY’14 we had 135 large deals, including six mega deals, which was highest number of mega deals during the last 10 years. We continue to have a strong pipeline of large deals that we are working on worldwide, though the timing of closing and the size of large deals may be affected by the overall health of the manufacturing economy, among other factors.
Looking forward, we are expecting fewer mega deals in FY15 than we had in FY14.
SALES PRODUCTIVITY AND CAPACITY TRENDS:
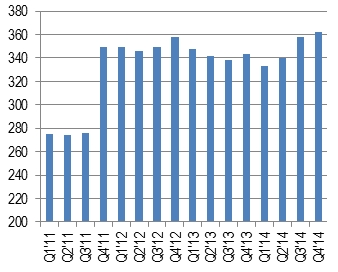
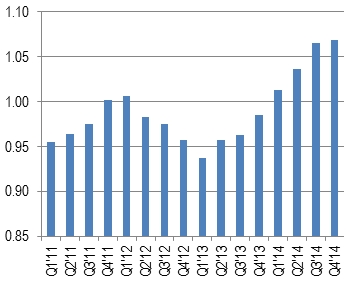
A key part of our long-term growth strategy is to expand the productivity of our quota-carrying sales reps to generate increasing amounts of license and subscription revenue per dollar of sales and marketing expense. During FY’14 we were able to generate approximately $1.07 in license and subscription revenue for each $1.00 of sales and marketing expenditure, up from $0.99 in FY’13 and $0.96 in FY’12. We had 362 quota-carry sales reps at the end of Q4, up 6% year over year.
Sales Capacity and Productivity Trend
|
Sales Capacity
|
Sales Productivity
|
 |
 |
As part of our effort to improve sales productivity and enhance our go-to-market strategy we have further evolved our sales force segmentation to: (1) focus our direct “strategic” sellers on our top accounts; and (2) repurpose significant capacity, dubbed “hunters,” to focus on acquiring new IoT and connected SLM customers. Our ability to acquire logos in IoT and connected SLM will be a key benchmark against which we will measure success in these markets. Our indirect channel partners continue to be focused on CAD and PLM, but we are planning to expand their portfolios over time.
SUPPORT: strong source of recurring revenue
Our support business is an important barometer of customer satisfaction with our solutions. Support gross margins are approximately 88% on a non-GAAP basis. Support revenue has historically tended to represent approximately 50% of our total revenues in any given quarter, with Q4 usually being at the low end as a percent of total revenue due to historically strong performance of license sales in that quarter.

Q4 non-GAAP support revenue was up 9% year over year on a reported basis, 8% on a constant currency basis, and 6% on an organic constant currency basis. Support revenue increased in all regions and business areas year over year, both as reported and on a constant currency basis. During FY’14 support revenue increased 5% year
over year on a reported and constant currency basis and 4% on an organic constant currency basis, with year over year support revenue growth in all business areas and regions (on a constant currency basis).
Looking forward to Q1, we are targeting non-GAAP support revenue of approximately $180 million, up 6% year-over-year basis. For FY’15 we are targeting approximately $700 million of non-GAAP support revenue, up 1% on a year-over-year basis.
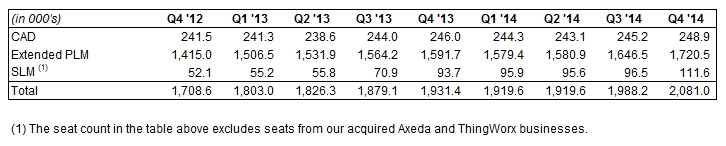
Active Support Seats
SERVICE: focus on margin and partner ecosystem expansion
Our service business provides significant value to our customers, helping them re-engineer their global product development business processes and implement our solutions and providing them with training on our software. Service revenue has historically tended to represent 20% to 25% of our total revenues in any given quarter. Over time we expect the consulting portion of our service business to decline as a percentage of our total revenue as a result of our strategy to grow our service partner ecosystem.
Q4 service revenue was flat year over year on a reported basis and constant currency basis, and down 7% on an organic constant currency basis. Consulting revenue (78% of total services revenue), was down 12% year over year due to: (1) an increasing focus on profitability within our service engagements; and (2) expansion of our service partner ecosystem. Our training business (14% of total services revenue) was up 13% year over year driven by strength in CAD license sales during FY’14. Cloud services represented 8% of total service revenue and was up 87% sequentially on a reported basis and down 9% sequentially on an organic basis. Starting in Q1’15, we will separate cloud services from our professional services and report cloud services as part of our perpetual license & subscription solutions revenue line.
On a geographic basis, the decrease in services revenue reflects double digit percentage declines in Japan and the Pacific Rim, slightly offset by 3% growth in Europe (2% on a constant currency basis), and 4% growth in the
Americas (although Americas consulting & training business was down on an organic basis). CAD service revenue increased 1% year over year on a reported basis and was flat on a constant currency basis. EPLM service revenue increased 4% on a reported and constant currency basis but declined 3% on an organic constant currency basis. SLM & IoT service revenue saw double digit declines on a reported and organic constant currency basis. We delivered non-GAAP service gross margin of 12.6% in Q4’14, down from Q3’14 non-GAAP service gross margin of 14.2% and Q4’13 service gross margin of 15.4% due to excess capacity, which we addressed with our restructuring action in Q4, as well as investments we are making in certain projects with strategic customers, which we expect to continue through the first half of FY’15.
As part of our strategy to improve overall margins and offer a range of service options to customers, we continue to expand our services partner ecosystem. Over time, we anticipate reducing our mix of direct services by shifting more business to our services partners and implementing solutions that fundamentally require less services.
Looking forward to Q1, we are targeting professional services revenue to be approximately $60 million. For FY’15 we are targeting professional services revenue of approximately $260 million. We are targeting non-GAAP gross margin in our professional services business of at least 15% for FY’15 through a combination of pricing discipline, cost control, and services partner ecosystem expansion. Given investments in certain strategic customer projects, we expect professional services margins to remain under pressure through the first half of FY’15. We expect to increase our professional services gross margin to 20% by FY’18 – the equivalent of increasing our services gross margin (including cloud services) to 22% by FY’18 under our FY’14 reporting framework.
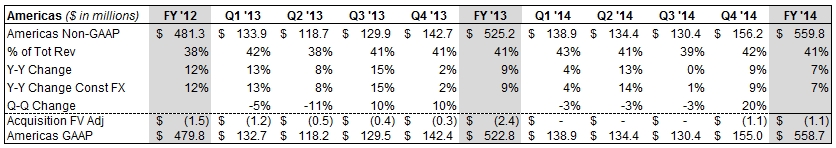
REVENUE BY SOLUTION AREA
We provide additional revenue disclosure that we believe provides valuable insight into how our business is performing within the markets we serve. Along with line of business, geographic, industry, and large deal metrics, we report revenue in three solution areas: CAD, SLM & IoT, and EPLM (Extended PLM, which encompasses our PLM and ALM businesses). We also note that starting in FY’15 our SCM solutions are now being consolidated within our EPLM business. Each of our solution areas serves a market with unique secular and cyclical dynamics, growth rates, and “buyers” within our customer base.
The following tables provide license, services and support revenue for each of our solution areas. Results include combined revenue from direct sales and our channel.
CAD:
Extended PLM:

SLM & IoT:
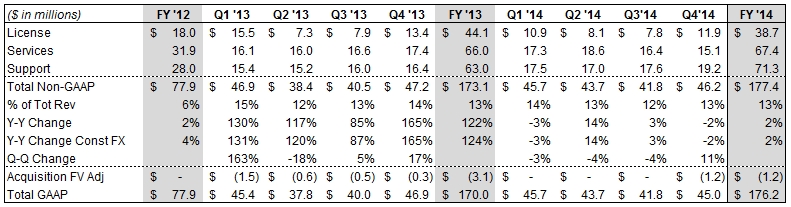
Our IoT business revenue for Q4 was $5.5 million and for FY’14 was $6.4 million, GAAP revenue was $4.2 million for Q4 and $5.2 million for FY'14.
REVENUE BY REGION

Total Revenue by Industry Vertical
|
% Y/Y
|
Q113
|
Q213
|
Q313
|
Q413
|
FY13
|
Q114
|
Q214
|
Q314
|
Q414
|
FY14
|
|
Automotive
|
3%
|
-14%
|
-8%
|
13%
|
-2%
|
2%
|
33%
|
19%
|
31%
|
21%
|
|
Electronics & High Tech
|
-13%
|
15%
|
3%
|
19%
|
5%
|
-1%
|
-15%
|
-4%
|
-14%
|
-9%
|
|
Federal, Aerospace & Defense
|
35%
|
12%
|
-5%
|
-14%
|
6%
|
-5%
|
-3%
|
9%
|
37%
|
9%
|
|
Industrial Products
|
-5%
|
8%
|
1%
|
18%
|
5%
|
12%
|
14%
|
8%
|
-14%
|
4%
|
|
Life Sciences
|
37%
|
2%
|
10%
|
-5%
|
8%
|
10%
|
0%
|
57%
|
22%
|
21%
|
|
Retail & Consumer
|
7%
|
14%
|
40%
|
6%
|
16%
|
-10%
|
5%
|
-2%
|
1%
|
-2%
|
|
Other
|
-26%
|
-16%
|
-5%
|
-11%
|
-15%
|
-6%
|
-5%
|
-5%
|
32%
|
3%
|
|
Total
|
0%
|
4%
|
1%
|
6%
|
3%
|
2%
|
5%
|
7%
|
6%
|
5%
|
As noted earlier, the largest industry verticals into which we sell our products include: (1) industrial products; (2) federal aerospace & defense; (3) electronics & high tech; (4) automotive; (5) retail & consumer; and (6) life sciences. During Q4’14, we saw our strongest revenue growth in the federal aerospace & defense, automotive, and life sciences industries, offset by revenue declines in electronics and high tech.
CURRENCY IMPACT ON RESULTS
We have a global business, with Europe and Asia historically representing approximately 60% of our revenue, and currency can significantly impact our results. We do not forecast currency movements; rather we provide detailed constant currency commentary. For example, in FY’14, currency was a tailwind for PTC and positively impacted non-GAAP revenue by $2 million and negatively impacted GAAP and non-GAAP expenses by $1 million. In FY’13, currency was a headwind for PTC and negatively impacted non-GAAP revenue by $18 million and favorably impacted GAAP and non-GAAP expenses by $9 million.
As a simple rule of thumb, based on current revenue and expense levels, a $0.10 move on the USD / EURO exchange rate will impact annualized revenue by approximately $35 to $40 million and EPS by approximately $0.08 to $0.10. Given recent fluctuation in the YEN / USD exchange rate, we also note that a 10 YEN move versus the USD will impact annualized revenue by approximately $13 to $17 million and EPS by approximately $0.04 to $0.06.
In Q4’14, currency was a tailwind for PTC and favorably impacted revenue by $1.7 million and unfavorably impacted GAAP expenses by $1.1 million and non-GAAP expenses by $1.0 million. Our actual simple average Q4’14 exchange rate was $1.35 USD / EURO and 102 YEN / USD.
Looking forward, the guidance we are providing assumes exchange rates of approximately 1.25 USD / EURO and 115 YEN / USD. Compared with FY’14, current FY’15 FX assumptions reduce non-GAAP revenue guidance by approximately $50 million and reduce non-GAAP EPS by approximately $0.15. Compared with Q1’14, current Q1’15
FX assumptions reduce non-GAAP revenue guidance by approximately $12 million and reduce non-GAAP EPS guidance by approximately $0.04.
Q4 FY’14 EXPENSES COMMENTARY AND Q1 & FY’15 OUTLOOK
Q4 non-GAAP results exclude $13.0 million of stock-based compensation expense, $13.1 million of acquisition-related intangible asset amortization, $6.2 million of other charges, net (primarily acquisition-related and pension plan termination costs) and $26.8 million of restructuring charges related to termination costs associated with 283 employees. The Q4 non-GAAP tax rate was 15% and Q4 included a GAAP tax benefit of 20% and 118.3 million diluted shares outstanding.
Q1’15 non-GAAP guidance adjusts for the impact of the following estimated expenses and their income tax effects, as well as any additional discrete tax items or restructuring costs:
|
l
|
Approximately $2 million of the effect of acquisition accounting on the fair value of acquired
|
|
deferred revenue
|
|
|
l
|
Approximately $14 million of expense related to stock-based compensation
|
|
l
|
Approximately $14 million of acquisition-related intangible asset amortization expense
|
|
l
|
Approximately $3 million of other charges, net (primarily acquisition-related and pension plan
|
|
termination related expense)
|
FY’15 GAAP and non-GAAP guidance adjusts for the impact of the following full-year estimated expenses and their income tax effects, as well as any additional discrete tax items or restructuring costs:
|
l
|
Approximately $4 million of the effect of acquisition accounting on the fair value of acquired
|
|
deferred revenue
|
|
|
l
|
Approximately $57 million of expense related to stock-based compensation
|
|
l
|
Approximately $55 million of acquisition-related intangible asset amortization expense
|
|
l
|
Approximately $9 million of other charges, net (primarily acquisition-related and pension plan
|
|
termination related expense)
|
FY’15 non-GAAP guidance also excludes settlement losses related to the termination of our U.S. pension plan. While we expect to complete the termination process by September 30, 2015, the amount of the losses and timing of the charge is subject to the timing of regulatory approvals and the projected benefit obligations and assets in the plan measured as of the dates the settlements occur. We currently estimate the pre-tax settlement losses to be approximately $65 million.
NON-GAAP GROSS MARGINS

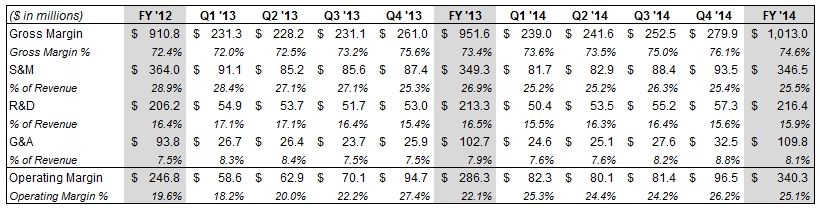
Our Q4’14 non-GAAP gross margin percentage increased year over year primarily due to leverage from higher license and support revenue, partially offset by lower services gross margin. Our Q4’14 service gross margin declined to 12.6% from 15.4% in Q4’13 due to excess capacity and certain strategic customer project investments. In addition, during Q4’14 we committed to a plan to restructure our workforce. We expect that the annualized effect of the expense reductions will be approximately $31 million, a portion of which reflects cost actions taken in our services organization. For FY’14 non-GAAP gross margin was 74.6%, up 120 basis points year over year and in line with our guidance. Q4’14 GAAP gross margin was 73.9% compared to 73.5%, in Q4’13 and FY’14 GAAP gross margin was 72.5%, compared to 71.2%, in FY’13.
Looking forward, we are targeting Q1‘15 non-GAAP gross margin of approximately 74% (GAAP gross margin of approximately 72%). For FY‘15, we are targeting non-GAAP gross margin of 75% to 76% (GAAP gross margin of approximately 73% to 74%). As noted above, we expect gross margin in the first half of FY’15 to reflect investments in certain strategic customer projects.
NON-GAAP OPERATING MARGINS
Our Q4’14 non-GAAP operating expenses were $183 million ($235 million on a GAAP basis), compared to $166 million in Q4’13 ($204 million on a GAAP basis). The higher year over year spending reflects workforce additions in our IoT business, which we view as an important future growth opportunity for PTC, as well as acquisitions including Atego and Axeda. This was partially offset by cost reduction actions taken over the last 12 months and continued discipline on operating expenses. Typically we see a modest increase in our sales & marketing expense during Q1
(related to spending for our Global Sales and Services Kickoffs) and during Q3 (related to spending for our PTC Live Global customer event).
From an operating performance perspective, we achieved 26.2% non-GAAP operating margin as reported and on a constant currency basis in Q4’14, compared to 27.4% in Q4’13. GAAP operating margin was 9.8% as reported and on a constant currency basis for Q4’14 compared to 14.2% in Q4’13. The lower Q4 operating margin reflects incremental costs from the Atego and Axeda businesses we acquired and on a GAAP basis reflects higher restructuring charges. For FY’14 our non-GAAP operating margin was 25.1%, up 300 basis point year over year and in line with our guidance.
On September 25, 2014, in support of integrating the recently acquired Atego and Axeda businesses and the continued evolution of our business model, we committed to a plan to restructure our workforce. A restructuring charge of $27 million, all of which is attributable to termination benefits, will primarily be paid in FY’15. We expect that the annualized effect of the expense reductions will be approximately $30 million, which is contemplated in our Q1’15 and FY’15 guidance.
Looking forward, we are targeting Q1 non-GAAP operating margin of approximately 23% to 24% (GAAP operating margin of approximately 13% to 14%). For FY‘15, we are targeting non-GAAP operating margin of approximately 26% (GAAP operating margin of approximately 16%).
Over the longer term we intend to increase our non-GAAP operating margin to the 28% to 30% range by FY’17 and into FY’18 primarily through increased efficiencies in our global sales and marketing organizations and improved non-GAAP gross margin (76% to 78% range) due to improved non-GAAP professional services margin and a more favorable revenue mix.
TAX RATE
Our Q4 non-GAAP tax rate was 15.1% and our Q4 GAAP tax rate was a benefit of 19.7%. The lower non-GAAP tax rate was due primarily to a different mix of income before income taxes by region than we had anticipated at the beginning of the year.
Looking forward, we expect our non-GAAP tax rate to be approximately 18% for Q1’15 and FY’15, and to be 18% to 20% for the foreseeable future. This is based on our current estimates for geographic mix of profits. Our guidance assumes a Q1 and FY’15 GAAP tax rate of 25%.
STOCK-BASED COMPENSATION
For Q4’14, expenses related to stock-based compensation were 3.5% of non-GAAP revenue compared to 4.0% of non-GAAP revenue in Q4’13, in keeping with our longer-term objective for stock-based compensation as a percentage of revenue.
SHARE COUNT / SHARE REPURCHASE
We had 118 million fully diluted weighted average shares outstanding for Q4. We paid $125 million for an accelerated stock repurchase (ASR) that we announced as part of our capital allocation strategy on August 4, 2014. Approximately 2.3 million shares (equal to approximately 70% of the ASR contract value) have been delivered to the company and canceled, with the remaining shares to be delivered by the end of Q2’15.
Free Cash Flow Return
|
($ in millions)
|
FY'12
|
Q1'13
|
Q2'13
|
Q3'13
|
Q4'13
|
FY'13
|
Q1'14
|
Q2'14
|
Q3'14
|
Q4'14
|
FY'14
|
|
Cash flow from operating activities
|
218.0
|
13.6
|
82.8
|
84.6
|
43.7
|
224.7
|
36.2
|
110.7
|
106.4
|
51.2
|
304.6
|
|
Capital expenditures
|
-31.4
|
-7.4
|
-5.0
|
-6.7
|
-10.2
|
-29.3
|
-5.8
|
-4.6
|
-6.4
|
-8.6
|
-25.3
|
|
Free cash flow
|
186.6
|
6.2
|
77.8
|
77.9
|
33.5
|
195.4
|
30.5
|
106.2
|
100.0
|
42.6
|
279.3
|
|
Repurchases of common stock
|
-35.0
|
-15.8
|
-19.2
|
-20.0
|
-20.0
|
-74.9
|
0.0
|
-40.0
|
-60.0
|
-125.0
|
-224.9
|
|
Weighted average shares outstanding
|
121.0
|
121.8
|
121.1
|
120.8
|
121.3
|
121.2
|
121.1
|
120.7
|
119.9
|
118.3
|
120.0
|
|
Free Cash Flow Return %
|
19%
|
255%
|
25%
|
26%
|
60%
|
38%
|
0%
|
38%
|
60%
|
293%
|
81%
|
Looking forward, we are committed to repurchasing shares in keeping with our long-term goal of returning approximately 40% of free cash flow to shareholders. We expect to have approximately 117 million fully diluted shares outstanding for Q1’15 and 117 million for the full fiscal year, assuming the remainder of our accelerated share repurchase is completed by the end of Q2 and we repurchase additional shares during FY’15 consistent with our long-term goal.
BALANCE SHEET:
CASH / CASH FLOW FROM OPERATIONS
As of the end of Q4’14 our cash balance was $294 million, down from $304 million at the end of Q3’14. We generated $51 million in operating cash flow, borrowed $297 million during the quarter to repurchase $125 million shares and acquire Axeda for approximately $166 million and Atego for approximately $46 million, and used $9 million for capital expenditures.
Looking forward, we expect to make cash contributions totaling approximately $45 million in FY’15 to fund pension plans, including the estimated amount required to settle our U.S. pension obligations and expected voluntary contributions to a non-U.S. plan. We expect to make payments of approximately $26 million in FY’15 for restructuring accruals recorded in FY’14.
DSO
We continue to have strong DSOs of 58 days in Q4’14, compared to 62 days in Q3’14 and 60 days in Q4’13.
OUTSTANDING DEBT
Our credit facility consists of a $1 billion revolving line and a $500 million term loan. We expect to use our credit facility for general corporate purposes, including acquisitions of businesses, working capital requirements, and share repurchases. We currently have total borrowings outstanding under the credit facility of $612 million, reflecting net borrowings of $297 million during the quarter. At the end of Q4’14, we had $112 million outstanding under the revolving loan portion of our credit facility. Under our leverage covenant, we are limited to 3.0 times adjusted EBITDA which, as of September 30, 2014, would limit additional revolving credit borrowings to $520 million.
MISCELLANEOUS COMMENTS
HEADCOUNT
Total headcount was 6,444 at the end of Q4’14, compared to 6,126 at the end of Q3’14 and 6,000 at the end of Q4’13.
M&A
We view M&A primarily as a strategic vehicle to further enhance our product portfolio and growth opportunity. We intend to remain opportunistic as it relates to M&A. Over the last three years, we have undertaken small, strategic technology tuck-ins (e.g. the acquisitions of Enigma and NetIDEAS in Q4’13 and Atego in Q3’14), as well as larger transactions, including Servigistics in Q1’13, ThingWorx in Q2’14, and Axeda in Q4’14. Axeda develops IoT solutions that securely connect machines and sensors to the cloud. Axeda serves more than 150 customers, processing hundreds of millions of machine messages daily across multiple industry sectors. At the time of the acquisition, Axeda had approximately 160 employees, who are located primarily in the US. The purchase price of Axeda was $166 million, net of cash acquired. We expect Axeda to contribute approximately $25 million to $30 million in revenue during FY’15.
We continue to evaluate strategic acquisition opportunities of varying size as they arise. Our forecasted financial, cash and debt positions for FY’15 described above are exclusive of the effects of any acquisitions that we may complete.
Important Information About Non-GAAP References
PTC provides non-GAAP supplemental information to its financial results. Non-GAAP revenue, operating expenses, margin and EPS exclude the effect of purchase accounting on the fair value of acquired deferred revenue of Axeda, Servigistics, Inc. and MKS, Inc., stock-based compensation expense, amortization of acquired intangible assets, restructuring charges, acquisition-related expenses, costs associated with terminating a U.S. pension plan, certain identified non-operating gains and losses, and the related tax effects of the preceding items and discrete tax items. We use these non-GAAP measures, and we believe that they assist our investors, to make period-to-period comparisons of our operational performance because they provide a view of our operating results without items that are not, in our view, indicative of our core operating results. We believe that these non-GAAP measures help illustrate underlying trends in our business, and we use the measures to establish budgets and operational goals, communicated internally and externally, for managing our business and evaluating our performance. We believe that providing non-GAAP measures affords investors a view of our operating results that may be more easily compared to the results of peer companies. In addition, compensation of our executives is based in part on the performance of our business based on these non-GAAP measures. However, non-GAAP information should not be construed as an alternative to GAAP information as the items excluded from the non-GAAP measures often have a material impact on PTC’s financial results. Management uses, and investors should consider, non-GAAP measures in conjunction with our GAAP results. PTC also provides results on a constant currency basis to provide a year-over-year view of our results excluding the effect of currency translation. Our constant currency disclosures are calculated by multiplying the actual results for the current period by the exchange rates in effect for the comparable prior period.
Forward-Looking Statements
Statements in these prepared remarks that are not historic facts, including statements about our first quarter and full fiscal 2015, long-term targets and other future financial and growth expectations, anticipated tax rates, expected market growth rates and the long-term prospects for PTC, are forward-looking statements that involve risks and uncertainties that could cause actual results to differ materially from those projected. These risks include the possibility that the macroeconomic and/or manufacturing climates may not improve or may deteriorate, the possibility that customers may not purchase our solutions when or at the rates we expect, the possibility that our pipeline of opportunities may not convert or generate the revenue we expect, the possibility that we will be unable to achieve planned services margins and operating margin improvements, the possibility that foreign currency exchange rates may vary from our expectations and thereby affect our reported revenue and expense, the possibility that we may not achieve the license, services or support revenue that we expect, which could result in a different mix of revenue between license, service and support and could impact our EPS results, the possibility that our customers may purchase more of our solutions as subscriptions than we expect, which would adversely affect near-term revenue, operating margins, and EPS, the possibility that market size and growth estimates may be incorrect and that we may be unable to grow our business at or in excess of market growth rates, the possibility that our businesses, including the SLM business and the Internet of Things/Smart, Connected Products business, may not expand and/or generate the revenue we expect, the possibility that we may be unable to leverage our products and customer relationships to increase sales, the possibility that our restructurings and cost containment measures may not generate the operating margin improvements we expect and could adversely affect our revenue, the possibility that we may be unable to achieve our profitability targets with lower license revenue or without additional restructuring or cost containment measures, the possibility that sales personnel productivity may not increase as we expect, the possibility that we may be unable to expand our services partner ecosystem or improve services margins as we expect, the possibility that we may be unable to attain or maintain a technology leadership position or that any such leadership position may not generate the revenue we expect, the possibility that we may be unable to generate sufficient operating cash flow to return 40% of free cash flow to shareholders or that other uses of cash could preclude share repurchases, and the possibility that remedial actions relating to our previously announced investigation in China could adversely affect our revenue and that fines and penalties may be assessed against PTC in connection with the China matter. In addition, our assumptions concerning our future GAAP and non-GAAP effective income tax rates are based on estimates and other factors that could change, including the geographic mix of our revenue, expenses and profits and loans and cash repatriations from foreign subsidiaries. Other risks and uncertainties that could cause actual results to differ materially from those projected are detailed from time to time in reports we file with the Securities and Exchange Commission, including our Annual Report on Form 10-K and our Quarterly Reports on Form 10-Q.
|
PTC Inc.
|
||||||||||||||||||||||||||||||||||||||||||
|
NON-GAAP FINANCIAL MEASURES AND RECONCILIATIONS (UNAUDITED)
|
||||||||||||||||||||||||||||||||||||||||||
|
(in thousands)
|
||||||||||||||||||||||||||||||||||||||||||
|
GAAP MARGINS
|
||||||||||||||||||||||||||||||||||||||||||
|
FY '12
|
Q1 '13
|
Q2 '13
|
Q3 '13
|
Q4 '13
|
FY '13
|
|||||||||||||||||||||||||||||||||||||
|
Revenue
|
$ | 1,255,679 | $ | 319,751 | $ | 313,949 | $ | 314,996 | $ | 344,845 | $ | 1,293,541 | ||||||||||||||||||||||||||||||
|
Cost of license revenue
|
30,595 | 8,012 | 8,291 | 8,431 | 8,270 | 33,004 | ||||||||||||||||||||||||||||||||||||
|
Cost of service revenue
|
265,482 | 68,592 | 64,550 | 62,941 | 62,871 | 258,954 | ||||||||||||||||||||||||||||||||||||
|
Cost of support revenue
|
76,051 | 20,468 | 20,429 | 19,796 | 20,388 | 81,081 | ||||||||||||||||||||||||||||||||||||
|
Gross Margin
|
$ | 883,551 | 70.4 | % | $ | 222,679 | 69.6 | % | $ | 220,679 | 70.3 | % | $ | 223,828 | 71.1 | % | $ | 253,316 | 73.5 | % | $ | 920,502 | 71.2 | % | ||||||||||||||||||
|
Sales & marketing
|
$ | 377,796 | 30.1 | % | $ | 93,549 | 29.3 | % | $ | 88,059 | 28.0 | % | $ | 88,298 | 28.0 | % | $ | 90,734 | 26.3 | % | $ | 360,640 | 27.9 | % | ||||||||||||||||||
|
Research & development
|
214,960 | 17.1 | % | 57,429 | 18.0 | % | 55,528 | 17.7 | % | 53,834 | 17.1 | % | 55,127 | 16.0 | % | 221,918 | 17.2 | % | ||||||||||||||||||||||||
|
General & administrative
|
117,468 | 9.4 | % | 35,817 | 11.2 | % | 33,398 | 10.6 | % | 28,812 | 9.1 | % | 33,910 | 9.8 | % | 131,937 | 10.2 | % | ||||||||||||||||||||||||
|
Amortization of acquired intangible assets
|
20,303 | 1.6 | % | 6,623 | 2.1 | % | 6,640 | 2.1 | % | 6,532 | 2.1 | % | 6,691 | 1.9 | % | 26,486 | 2.0 | % | ||||||||||||||||||||||||
|
Restructuring charge
|
24,928 | 2.0 | % | 15,402 | 4.8 | % | 15,810 | 5.0 | % | 3,137 | 1.0 | % | 17,848 | 5.2 | % | 52,197 | 4.0 | % | ||||||||||||||||||||||||
|
Operating Expenses
|
$ | 755,455 | 60.2 | % | $ | 208,820 | 65.3 | % | $ | 199,435 | 63.5 | % | $ | 180,613 | 57.3 | % | $ | 204,310 | 59.2 | % | $ | 793,178 | 61.3 | % | ||||||||||||||||||
|
GAAP Operating Margin
|
$ | 128,096 | 10.2 | % | $ | 13,859 | 4.3 | % | $ | 21,244 | 6.8 | % | $ | 43,215 | 13.7 | % | $ | 49,006 | 14.2 | % | $ | 127,324 | 9.8 | % | ||||||||||||||||||
|
ADJUSTMENTS TO DERIVE NON-GAAP MEASURES
|
||||||||||||||||||||||||||||||||||||||||||
|
FY '12
|
Q1 '13
|
Q2 '13
|
Q3 '13
|
Q4 '13
|
FY '13
|
|||||||||||||||||||||||||||||||||||||
|
Revenue:
|
||||||||||||||||||||||||||||||||||||||||||
|
Fair value of deferred revenue
|
$ | 2,485 | 0.2 | % | $ | 1,554 | 0.5 | % | $ | 660 | 0.2 | % | $ | 534 | 0.2 | % | $ | 287 | 0.1 | % | $ | 3,035 | 0.2 | % | ||||||||||||||||||
|
Cost of license revenue:
|
||||||||||||||||||||||||||||||||||||||||||
|
Acquired intangible amortization
|
15,819 | 1.3 | % | 4,639 | 1.5 | % | 4,628 | 1.5 | % | 4,598 | 1.5 | % | 4,695 | 1.4 | % | 18,560 | 1.4 | % | ||||||||||||||||||||||||
|
Stock-based compensation
|
22 | 0.0 | % | 5 | 0.0 | % | 8 | 0.0 | % | 4 | 0.0 | % | 4 | 0.0 | % | 21 | 0.0 | % | ||||||||||||||||||||||||
|
Cost of service revenue:
|
||||||||||||||||||||||||||||||||||||||||||
|
Fair value of deferred costs
|
- | 0.0 | % | |||||||||||||||||||||||||||||||||||||||
|
Acquired intangible amortization
|
- | 0.0 | % | - | 0.0 | % | - | 0.0 | % | - | 0.0 | % | 26 | 0.0 | % | 26 | 0.0 | % | ||||||||||||||||||||||||
|
Stock-based compensation
|
5,682 | 0.5 | % | 1,612 | 0.5 | % | 1,420 | 0.5 | % | 1,372 | 0.4 | % | 1,730 | 0.5 | % | 6,134 | 0.5 | % | ||||||||||||||||||||||||
|
Cost of support revenue:
|
||||||||||||||||||||||||||||||||||||||||||
|
Stock-based compensation
|
3,234 | 0.3 | % | 826 | 0.3 | % | 835 | 0.3 | % | 722 | 0.2 | % | 941 | 0.3 | % | 3,324 | 0.3 | % | ||||||||||||||||||||||||
|
Sales & marketing:
|
||||||||||||||||||||||||||||||||||||||||||
|
Fair value of deferred costs
|
- | 0.0 | % | |||||||||||||||||||||||||||||||||||||||
|
Stock-based compensation
|
13,809 | 1.1 | % | 2,458 | 0.8 | % | 2,835 | 0.9 | % | 2,693 | 0.9 | % | 3,340 | 1.0 | % | 11,326 | 0.9 | % | ||||||||||||||||||||||||
|
Research & development:
|
||||||||||||||||||||||||||||||||||||||||||
|
Stock-based compensation
|
8,761 | 0.7 | % | 2,512 | 0.8 | % | 1,824 | 0.6 | % | 2,139 | 0.7 | % | 2,115 | 0.6 | % | 8,590 | 0.7 | % | ||||||||||||||||||||||||
|
General & administrative:
|
||||||||||||||||||||||||||||||||||||||||||
|
Stock-based compensation
|
19,797 | 1.6 | % | 4,480 | 1.4 | % | 4,888 | 1.6 | % | 4,247 | 1.3 | % | 5,777 | 1.7 | % | 19,392 | 1.5 | % | ||||||||||||||||||||||||
|
Acquisition-related costs
|
3,833 | 0.3 | % | 4,599 | 1.4 | % | 2,110 | 0.7 | % | 900 | 0.3 | % | 2,246 | 0.7 | % | 9,855 | 0.8 | % | ||||||||||||||||||||||||
|
Amortization of acquired intangible assets
|
20,303 | 1.6 | % | 6,623 | 2.1 | % | 6,640 | 2.1 | % | 6,532 | 2.1 | % | 6,691 | 1.9 | % | 26,486 | 2.0 | % | ||||||||||||||||||||||||
|
Restructuring charge
|
24,928 | 2.0 | % | 15,402 | 4.8 | % | 15,810 | 5.0 | % | 3,137 | 1.0 | % | 17,848 | 5.2 | % | 52,197 | 4.0 | % | ||||||||||||||||||||||||
|
Non-GAAP adjustments
|
$ | 118,673 | 9.5 | % | $ | 44,710 | 14.0 | % | $ | 41,658 | 13.3 | % | $ | 26,878 | 8.5 | % | $ | 45,700 | 13.3 | % | $ | 158,946 | 12.3 | % | ||||||||||||||||||
|
NON-GAAP MARGINS
|
||||||||||||||||||||||||||||||||||||||||||
|
FY '12
|
Q1 '13
|
Q2 '13
|
Q3 '13
|
Q4 '13
|
FY '13
|
|||||||||||||||||||||||||||||||||||||
|
Revenue
|
$ | 1,258,164 | $ | 321,305 | $ | 314,609 | $ | 315,530 | $ | 345,132 | $ | 1,296,576 | ||||||||||||||||||||||||||||||
|
Cost of license revenue
|
14,754 | 3,368 | 3,655 | 3,829 | 3,571 | 14,423 | ||||||||||||||||||||||||||||||||||||
|
Cost of service revenue
|
259,800 | 66,980 | 63,130 | 61,569 | 61,115 | 252,794 | ||||||||||||||||||||||||||||||||||||
|
Cost of support revenue
|
72,817 | 19,642 | 19,594 | 19,074 | 19,447 | 77,757 | ||||||||||||||||||||||||||||||||||||
|
Gross Margin
|
$ | 910,793 | 72.4 | % | $ | 231,315 | 72.0 | % | $ | 228,230 | 72.5 | % | $ | 231,058 | 73.2 | % | $ | 260,999 | 75.6 | % | $ | 951,602 | 73.4 | % | ||||||||||||||||||
|
Sales & marketing
|
$ | 363,987 | 28.9 | % | $ | 91,091 | 28.4 | % | $ | 85,224 | 27.1 | % | $ | 85,605 | 27.1 | % | $ | 87,394 | 25.3 | % | $ | 349,314 | 26.9 | % | ||||||||||||||||||
|
Research & development
|
206,199 | 16.4 | % | 54,917 | 17.1 | % | 53,704 | 17.1 | % | 51,695 | 16.4 | % | 53,012 | 15.4 | % | 213,328 | 16.5 | % | ||||||||||||||||||||||||
|
General & administrative
|
93,838 | 7.5 | % | 26,738 | 8.3 | % | 26,400 | 8.4 | % | 23,665 | 7.5 | % | 25,887 | 7.5 | % | 102,690 | 7.9 | % | ||||||||||||||||||||||||
|
Amortization of acquired intangible assets
|
- | 0.0 | % | - | 0.0 | % | - | 0.0 | % | - | 0.0 | % | - | 0.0 | % | - | 0.0 | % | ||||||||||||||||||||||||
|
Restructuring charge
|
- | 0.0 | % | - | 0.0 | % | - | 0.0 | % | - | 0.0 | % | - | 0.0 | % | - | 0.0 | % | ||||||||||||||||||||||||
|
Operating Expenses
|
$ | 664,024 | 52.8 | % | $ | 172,746 | 53.8 | % | $ | 165,328 | 52.6 | % | $ | 160,965 | 51.0 | % | $ | 166,293 | 48.2 | % | $ | 665,332 | 51.3 | % | ||||||||||||||||||
|
Non-GAAP Operating Margin
|
$ | 246,769 | 19.6 | % | $ | 58,569 | 18.2 | % | $ | 62,902 | 20.0 | % | $ | 70,093 | 22.2 | % | $ | 94,706 | 27.4 | % | $ | 286,270 | 22.1 | % | ||||||||||||||||||
|
PTC Inc.
|
|||||||||||||||||||||||||||||||||||
|
NON-GAAP FINANCIAL MEASURES AND RECONCILIATIONS (UNAUDITED)
|
|||||||||||||||||||||||||||||||||||
|
(in thousands)
|
|||||||||||||||||||||||||||||||||||
|
GAAP MARGINS
|
|||||||||||||||||||||||||||||||||||
|
Q1 '14
|
Q2 '14
|
Q3 '14
|
Q4 '14
|
FY '14
|
|||||||||||||||||||||||||||||||
|
Revenue
|
$ | 324,925 | $ | 328,700 | $ | 336,634 | $ | 366,708 | $ | 1,356,967 | |||||||||||||||||||||||||
|
Cost of license revenue
|
7,545 | 7,972 | 7,831 | 8,315 | 31,663 | ||||||||||||||||||||||||||||||
|
Cost of service revenue
|
65,495 | 64,261 | 61,910 | 65,210 | 256,876 | ||||||||||||||||||||||||||||||
|
Cost of support revenue
|
19,916 | 21,564 | 21,335 | 22,329 | 85,144 | ||||||||||||||||||||||||||||||
|
Gross Margin
|
$ | 231,969 | 71.4 | % | $ | 234,903 | 71.5 | % | $ | 245,558 | 72.9 | % | $ | 270,854 | 73.9 | % | $ | 983,284 | 72.5 | % | |||||||||||||||
|
Sales & marketing
|
$ | 84,238 | 25.9 | % | $ | 85,934 | 26.1 | % | $ | 91,440 | 27.2 | % | $ | 95,835 | 26.1 | % | $ | 357,447 | 26.3 | % | |||||||||||||||
|
Research & development
|
53,073 | 16.3 | % | 55,631 | 16.9 | % | 57,405 | 17.1 | % | 60,387 | 16.5 | % | 226,496 | 16.7 | % | ||||||||||||||||||||
|
General & administrative
|
30,931 | 9.5 | % | 34,140 | 10.4 | % | 33,817 | 10.0 | % | 43,344 | 11.8 | % | 142,232 | 10.5 | % | ||||||||||||||||||||
|
Amortization of acquired intangible assets
|
7,789 | 2.4 | % | 7,985 | 2.4 | % | 7,998 | 2.4 | % | 8,355 | 2.3 | % | 32,127 | 2.4 | % | ||||||||||||||||||||
|
Restructuring charge
|
1,067 | 0.3 | % | - | 0.0 | % | 514 | 0.2 | % | 26,825 | 7.3 | % | 28,406 | 2.1 | % | ||||||||||||||||||||
|
Operating Expenses
|
$ | 177,098 | 54.5 | % | $ | 183,690 | 55.9 | % | $ | 191,174 | 56.8 | % | $ | 234,746 | 64.0 | % | $ | 786,708 | 58.0 | % | |||||||||||||||
|
GAAP Operating Margin
|
$ | 54,871 | 16.9 | % | $ | 51,213 | 15.6 | % | $ | 54,384 | 16.2 | % | $ | 36,108 | 9.8 | % | $ | 196,576 | 14.5 | % | |||||||||||||||
|
ADJUSTMENTS TO DERIVE NON-GAAP MEASURES
|
|||||||||||||||||||||||||||||||||||
|
Q1 '14
|
Q2 '14
|
Q3 '14
|
Q4 '14
|
FY '14
|
|||||||||||||||||||||||||||||||
|
Revenue:
|
|||||||||||||||||||||||||||||||||||
|
Fair value of deferred revenue
|
$ | - | 0.0 | % | $ | - | 0.0 | % | $ | - | 0.0 | % | $ | 1,249 | 0.3 | % | $ | 1,249 | 0.1 | % | |||||||||||||||
|
Cost of license revenue:
|
|||||||||||||||||||||||||||||||||||
|
Acquired intangible amortization
|
4,405 | 1.4 | % | 4,316 | 1.3 | % | 4,323 | 1.3 | % | 4,702 | 1.3 | % | 17,746 | 1.3 | % | ||||||||||||||||||||
|
Stock-based compensation
|
4 | 0.0 | % | 5 | 0.0 | % | 4 | 0.0 | % | 4 | 0.0 | % | 17 | 0.0 | % | ||||||||||||||||||||
|
Cost of service revenue:
|
|||||||||||||||||||||||||||||||||||
|
Fair value of deferred costs
|
- | 0.0 | % | - | 0.0 | % | - | 0.0 | % | (65 | ) | 0.0 | % | (65 | ) | 0.0 | % | ||||||||||||||||||
|
Acquired intangible amortization
|
92 | 0.0 | % | 91 | 0.0 | % | 92 | 0.0 | % | 91 | 0.0 | % | 366 | 0.0 | % | ||||||||||||||||||||
|
Stock-based compensation
|
1,598 | 0.5 | % | 1,426 | 0.4 | % | 1,608 | 0.5 | % | 2,016 | 0.5 | % | 6,648 | 0.5 | % | ||||||||||||||||||||
|
Cost of support revenue:
|
|||||||||||||||||||||||||||||||||||
|
Stock-based compensation
|
924 | 0.3 | % | 889 | 0.3 | % | 898 | 0.3 | % | 1,034 | 0.3 | % | 3,745 | 0.3 | % | ||||||||||||||||||||
|
Sales & marketing:
|
|||||||||||||||||||||||||||||||||||
|
Fair value of deferred costs
|
- | 0.0 | % | - | 0.0 | % | - | 0.0 | % | (102 | ) | 0.0 | % | (102 | ) | 0.0 | % | ||||||||||||||||||
|
Stock-based compensation
|
2,499 | 0.8 | % | 3,019 | 0.9 | % | 3,065 | 0.9 | % | 2,399 | 0.7 | % | 10,982 | 0.8 | % | ||||||||||||||||||||
|
Research & development:
|
|||||||||||||||||||||||||||||||||||
|
Stock-based compensation
|
2,689 | 0.8 | % | 2,147 | 0.7 | % | 2,231 | 0.7 | % | 3,052 | 0.8 | % | 10,119 | 0.7 | % | ||||||||||||||||||||
|
General & administrative:
|
|||||||||||||||||||||||||||||||||||
|
Stock-based compensation
|
5,050 | 1.6 | % | 5,080 | 1.5 | % | 4,726 | 1.4 | % | 4,522 | 1.2 | % | 19,378 | 1.4 | % | ||||||||||||||||||||
|
Acquisition-related costs
|
1,305 | 0.4 | % | 3,935 | 1.2 | % | 1,528 | 0.5 | % | 6,328 | 1.7 | % | 13,096 | 1.0 | % | ||||||||||||||||||||
|
Amortization of acquired intangible assets
|
7,789 | 2.4 | % | 7,985 | 2.4 | % | 7,998 | 2.4 | % | 8,355 | 2.3 | % | 32,127 | 2.4 | % | ||||||||||||||||||||
|
Restructuring charge
|
1,067 | 0.3 | % | - | 0.0 | % | 514 | 0.2 | % | 26,825 | 7.3 | % | 28,406 | 2.1 | % | ||||||||||||||||||||
|
Non-GAAP adjustments
|
$ | 27,422 | 8.4 | % | $ | 28,893 | 8.8 | % | $ | 26,987 | 8.0 | % | $ | 60,410 | 16.5 | % | $ | 143,712 | 10.6 | % | |||||||||||||||
|
NON-GAAP MARGINS
|
|||||||||||||||||||||||||||||||||||
|
Q1 '14
|
Q2 '14
|
Q3 '14
|
Q4 '14
|
FY '14
|
|||||||||||||||||||||||||||||||
|
Revenue
|
$ | 324,925 | $ | 328,700 | $ | 336,634 | $ | 367,957 | $ | 1,358,216 | |||||||||||||||||||||||||
|
Cost of license revenue
|
3,136 | 3,651 | 3,504 | 3,609 | 13,900 | ||||||||||||||||||||||||||||||
|
Cost of service revenue
|
63,805 | 62,744 | 60,210 | 63,168 | 249,927 | ||||||||||||||||||||||||||||||
|
Cost of support revenue
|
18,992 | 20,675 | 20,437 | 21,295 | 81,399 | ||||||||||||||||||||||||||||||
|
Gross Margin
|
$ | 238,992 | 73.6 | % | $ | 241,630 | 73.5 | % | $ | 252,483 | 75.0 | % | $ | 279,885 | 76.1 | % | $ | 1,012,990 | 74.6 | % | |||||||||||||||
|
Sales & marketing
|
$ | 81,739 | 25.2 | % | $ | 82,915 | 25.2 | % | $ | 88,375 | 26.3 | % | $ | 93,538 | 25.4 | % | $ | 346,567 | 25.5 | % | |||||||||||||||
|
Research & development
|
50,384 | 15.5 | % | 53,484 | 16.3 | % | 55,174 | 16.4 | % | 57,335 | 15.6 | % | 216,377 | 15.9 | % | ||||||||||||||||||||
|
General & administrative
|
24,576 | 7.6 | % | 25,125 | 7.6 | % | 27,563 | 8.2 | % | 32,494 | 8.8 | % | 109,758 | 8.1 | % | ||||||||||||||||||||
|
Amortization of acquired intangible assets
|
- | 0.0 | % | - | 0.0 | % | - | 0.0 | % | - | 0.0 | % | - | 0.0 | % | ||||||||||||||||||||
|
Restructuring charge
|
- | 0.0 | % | - | 0.0 | % | - | 0.0 | % | - | 0.0 | % | - | 0.0 | % | ||||||||||||||||||||
|
Operating Expenses
|
$ | 156,699 | 48.2 | % | $ | 161,524 | 49.1 | % | $ | 171,112 | 50.8 | % | $ | 183,367 | 49.8 | % | $ | 672,702 | 49.5 | % | |||||||||||||||
|
Non-GAAP Operating Margin
|
$ | 82,293 | 25.3 | % | $ | 80,106 | 24.4 | % | $ | 81,371 | 24.2 | % | $ | 96,518 | 26.2 | % | $ | 340,288 | 25.1 | % | |||||||||||||||
|
PTC Inc.
|
||||||||||||||||
|
NON-GAAP FINANCIAL MEASURES AND RECONCILIATIONS (UNAUDITED)
|
||||||||||||||||
|
(in thousands, except per share data)
|
||||||||||||||||
|
Three Months Ended
|
Twelve Months Ended
|
|||||||||||||||
|
September 30
|
September 30
|
September 30
|
September 30
|
|||||||||||||
|
2014
|
2013
|
2014
|
2013
|
|||||||||||||
|
GAAP revenue
|
$ | 366,708 | $ | 344,845 | $ | 1,356,967 | $ | 1,293,541 | ||||||||
|
Fair value adjustment of acquired deferred license revenue
|
719 | - | 719 | - | ||||||||||||
|
Fair value adjustment of acquired deferred service revenue
|
183 | - | 183 | - | ||||||||||||
|
Fair value adjustment of acquired deferred support revenue
|
347 | 287 | 347 | 3,035 | ||||||||||||
|
Non-GAAP revenue
|
$ | 367,957 | $ | 345,132 | $ | 1,358,216 | $ | 1,296,576 | ||||||||
|
GAAP gross margin
|
$ | 270,854 | $ | 253,316 | $ | 983,284 | $ | 920,502 | ||||||||
|
Fair value adjustment of acquired deferred license revenue
|
719 | - | 719 | - | ||||||||||||
|
Fair value adjustment of acquired deferred service revenue
|
183 | - | 183 | - | ||||||||||||
|
Fair value adjustment of acquired deferred support revenue
|
347 | 287 | 347 | 3,035 | ||||||||||||
|
Fair value adjustment to deferred services cost
|
(65 | ) | - | (65 | ) | - | ||||||||||
|
Stock-based compensation
|
3,054 | 2,675 | 10,410 | 9,479 | ||||||||||||
|
Amortization of acquired intangible assets
|
||||||||||||||||
|
included in cost of license revenue
|
4,702 | 4,695 | 17,746 | 18,586 | ||||||||||||
|
Amortization of acquired intangible assets
|
||||||||||||||||
|
included in cost of service revenue
|
91 | 26 | 366 | - | ||||||||||||
|
Non-GAAP gross margin
|
$ | 279,885 | $ | 260,999 | $ | 1,012,990 | $ | 951,602 | ||||||||
|
GAAP operating income
|
$ | 36,108 | $ | 49,006 | $ | 196,576 | $ | 127,324 | ||||||||
|
Fair value adjustment of acquired deferred license revenue
|
719 | - | 719 | - | ||||||||||||
|
Fair value adjustment of acquired deferred service revenue
|
183 | - | 183 | - | ||||||||||||
|
Fair value adjustment of acquired deferred support revenue
|
347 | 287 | 347 | 3,035 | ||||||||||||
|
Fair value adjustment to deferred services cost
|
(65 | ) | - | (65 | ) | - | ||||||||||
|
Fair value adjustment to deferred commission costs
|
(102 | ) | - | (102 | ) | - | ||||||||||
|
Stock-based compensation
|
13,027 | 13,907 | 50,889 | 48,787 | ||||||||||||
|
Amortization of acquired intangible assets
|
||||||||||||||||
|
included in cost of license revenue
|
4,702 | 4,695 | 17,746 | 18,560 | ||||||||||||
|
Amortization of acquired intangible assets
|
||||||||||||||||
|
included in cost of service revenue
|
91 | 26 | 366 | 26 | ||||||||||||
|
Amortization of acquired intangible assets
|
8,355 | 6,691 | 32,127 | 26,486 | ||||||||||||
|
Charges included in general and administrative expenses (2)
|
6,328 | 2,246 | 13,096 | 9,855 | ||||||||||||
|
Restructuring charges
|
26,825 | 17,848 | 28,406 | 52,197 | ||||||||||||
|
Non-GAAP operating income (1)
|
$ | 96,518 | $ | 94,706 | $ | 340,288 | $ | 286,270 | ||||||||
|
GAAP net income
|
$ | 38,755 | $ | 56,466 | $ | 160,194 | $ | 143,769 | ||||||||
|
Fair value adjustment of acquired deferred license revenue
|
719 | - | 719 | - | ||||||||||||
|
Fair value adjustment of acquired deferred service revenue
|
183 | - | 183 | - | ||||||||||||
|
Fair value adjustment of acquired deferred support revenue
|
347 | 287 | 347 | 3,035 | ||||||||||||
|
Fair value adjustment to deferred services cost
|
(102 | ) | - | (102 | ) | - | ||||||||||
|
Fair value adjustment to deferred commission costs
|
(65 | ) | - | (65 | ) | - | ||||||||||
|
Stock-based compensation
|
13,027 | 13,907 | 50,889 | 48,787 | ||||||||||||
|
Amortization of acquired intangible assets
|
||||||||||||||||
|
included in cost of license revenue
|
4,702 | 4,695 | 17,746 | 18,560 | ||||||||||||
|
Amortization of acquired intangible assets
|
||||||||||||||||
|
included in cost of service revenue
|
91 | 26 | 366 | 26 | ||||||||||||
|
Amortization of acquired intangible assets
|
8,355 | 6,691 | 32,127 | 26,486 | ||||||||||||
|
Charges included in general and administrative expenses (2)
|
6,328 | 2,246 | 13,096 | 9,855 | ||||||||||||
|
Restructuring charges
|
26,825 | 17,848 | 28,406 | 52,197 | ||||||||||||
|
Non-operating one-time gain (3)
|
- | (594 | ) | - | (5,717 | ) | ||||||||||
|
Income tax adjustments (4)
|
(20,440 | ) | (29,990 | ) | (43,528 | ) | (77,834 | ) | ||||||||
|
Non-GAAP net income
|
$ | 78,725 | $ | 71,582 | $ | 260,378 | $ | 219,164 | ||||||||
|
PTC Inc.
|
||||||||||||||||||||
|
NON-GAAP FINANCIAL MEASURES AND RECONCILIATIONS (UNAUDITED) - Continued
|
||||||||||||||||||||
|
(in thousands, except per share data)
|
||||||||||||||||||||
|
Three Months Ended
|
Twelve Months Ended
|
|||||||||||||||||||
|
September 30
|
September 30
|
September 30
|
September 30
|
|||||||||||||||||
|
2014
|
2013
|
2014
|
2013
|
|||||||||||||||||
|
GAAP diluted earnings per share
|
$ | 0.33 | $ | 0.47 | $ | 1.34 | $ | 1.19 | ||||||||||||
|
Fair value adjustment of acquired deferred revenue
|
0.01 | - | 0.01 | 0.03 | ||||||||||||||||
|
Fair value adjustment to deferred costs
|
- | - | - | - | ||||||||||||||||
|
Stock-based compensation
|
0.11 | 0.11 | 0.42 | 0.40 | ||||||||||||||||
|
Amortization of acquired intangibles
|
0.11 | 0.09 | 0.42 | 0.37 | ||||||||||||||||
|
Charges included in general and administrative expenses (2)
|
0.05 | 0.02 | 0.11 | 0.08 | ||||||||||||||||
|
Restructuring charges
|
0.23 | 0.15 | 0.24 | 0.43 | ||||||||||||||||
|
Non-operating one-time gain (3)
|
- | - | - | (0.05 | ) | |||||||||||||||
|
Income tax adjustments (4)
|
(0.17 | ) | (0.25 | ) | (0.36 | ) | (0.64 | ) | ||||||||||||
|
Non-GAAP diluted earnings per share
|
$ | 0.67 | $ | 0.59 | $ | 2.17 | $ | 1.81 | ||||||||||||
| (1 | ) |
Operating margin impact of non-GAAP adjustments:
|
||||||||||||||||||
|
Three Months Ended
|
Twelve Months Ended
|
|||||||||||||||||||
|
September 30
|
September 30
|
September 30
|
September 30
|
|||||||||||||||||
| 2014 | 2013 | 2014 | 2013 | |||||||||||||||||
|
GAAP operating margin
|
9.8 | % | 14.2 | % | 14.5 | % | 9.8 | % | ||||||||||||
|
Fair value adjustment of acquired deferred revenue
|
0.3 | % | 0.1 | % | 0.1 | % | 0.2 | % | ||||||||||||
|
Fair value adjustment to deferred costs
|
0.0 | % | 0.0 | % | 0.0 | % | 0.0 | % | ||||||||||||
|
Stock-based compensation
|
3.6 | % | 4.0 | % | 3.8 | % | 3.8 | % | ||||||||||||
|
Amortization of acquired intangibles
|
3.6 | % | 3.3 | % | 3.7 | % | 3.5 | % | ||||||||||||
|
Charges included in general and administrative expenses (3)
|
1.7 | % | 0.7 | % | 1.0 | % | 0.8 | % | ||||||||||||
|
Restructuring charges
|
7.3 | % | 5.2 | % | 2.1 | % | 4.0 | % | ||||||||||||
|
Non-GAAP operating margin
|
26.2 | % | 27.4 | % | 25.1 | % | 22.1 | % | ||||||||||||
| (2 | ) |
Represents acquisition-related charges, as well as, costs related to terminating a U.S. pension plan of $0.3 million in the twelve months ended September 30, 2014.
|
||||||||||||||||||
| (3 | ) |
The fourth quarter of 2013 includes a gain on investment of $0.6 million and the third quarter of 2013 includes a legal settlement gain of $5.1 million, which are both excluded from non-GAAP net income.
|
||||||||||||||||||
| (4 | ) |
Income tax adjustments for the three and twelve months ended September 30, 2014 and 2013 reflect the tax effects of non-GAAP adjustments which are calculated by applying the applicable tax rate by jurisdiction to the non-GAAP adjustments listed above, and also include any identified tax items. In Q4'12, a valuation allowance was established against our U.S. net deferred tax assets. Similarly, in Q4’14, valuation allowances totaling $3.5 million were established against our foreign net deferred tax assets in two foreign jurisdictions. As the U.S. and the two foreign jurisdictions are profitable on a non-GAAP basis, the 2014 and 2013 non-GAAP tax provision is being calculated assuming there is no valuation allowance in these jurisdictions. The following identified tax items have also been excluded from the non-GAAP tax results. Fiscal year 2014 includes a tax benefit of $18.1 million related to the release of a portion of the valuation allowance as a result of deferred tax liabilities established for the acquisitions of ThingWorx in Q2’14 of $8.9 million and Axeda in Q4’14 of $9.1 million; and a $1.9 million tax benefit in Q4’14 resulting from tax authority clearance in a foreign jurisdiction of an acquired company. Q4'13 and fiscal year 2013 includes a non-cash benefit of $7.9 million related to the release of a portion of the valuation allowance as a result of the pension gain (decrease in unrecognized actuarial loss) recorded in accumulated other comprehensive income; a $4.1 million tax benefit related to the release of a portion of the valuation allowance as a result of deferred tax liabilities established in accounting for acquisitions completed in the Q4'13; and a $2.6 million tax benefit relating to a tax audit in a foreign jurisdiction of an acquired company. Fiscal year 2013 includes a tax benefit of $32.6 million related to the release of deferred tax liabilities established for the Servigistics acquisition recorded in Q1'13 and tax benefits of $3.2 million relating to the final resolution of a long standing tax litigation and completion of an international jurisdiction tax audit recorded in Q2'13.
|
||||||||||||||||||