Attached files
| file | filename |
|---|---|
| EX-99.1 - EARNINGS PRESS RELEASE - WCI Communities, Inc. | d811815dex991.htm |
| 8-K - FORM 8-K - WCI Communities, Inc. | d811815d8k.htm |
 WCI
Communities Third
Quarter
2014
-
Earnings
Conference
Call
November 4, 2014
Exhibit 99.2 |
 2
2
Disclosure Statement
This
presentation
contains
forward-looking
statements.
All
statements
that
are
not
statements
of
historical
fact,
including
statements
about
the
Company’s
beliefs
and
expectations,
are
forward-looking
statements
within
the
meaning
of
the
federal
securities
laws,
and
should
be
evaluated
as
such.
Forward-looking
statements
include
information
concerning
the
Company’s
future
goals,
expected
growth,
market
conditions
and
outlook
(including
the
estimates,
forecasts,
statements
and
projections
relating
to
Florida
or
national
markets
prepared
by
John
Burns
Real
Estate
Consulting),
expected
liquidity
and
possible
or
assumed
future
results
of
operations,
including
descriptions
of
its
business
plan
and
strategies.
These
forward-looking
statements
may
be
identified
by
the
use
of
such forward-
looking
terminology,
including
the
terms
“believe,”
“estimate,”
“project,”
“anticipate,”
“expect,”
“seek,”
“predict,”
“contemplate,”
“continue,”
“possible,”
“intend,”
“may,”
“might,”
“will,”
“could,”
“would,”
“should,”
“forecast,”
or
“assume”
or,
in
each
case,
their
negative,
or
other
variations
or
comparable
terminology.
For
more
information
concerning
factors
that
could
cause
actual
results
to
differ
materially
from
those
contained
in
the
forward-looking
statements,
please
refer
to
“Risk
Factors”
in
Item
1A
of
Part
I
of
our
Annual
Report
on
Form
10-K
filed
by
the
Company
with
the
Securities
and
Exchange
Commission
on
February
27,
2014
and
subsequent
filings
by
the
Company.
The
Company
bases
these forward-
looking
statements
or
projections
on
its
current
expectations,
plans
and
assumptions
that
it
has
made
in
light
of
its
experience
in
the
industry,
as
well
as
its
perceptions
of
historical
trends,
current
conditions,
expected
future
developments
and
other
factors
it
believes
are
appropriate
under
the
circumstances
and
at
such
time.
As
you
read
and
consider
this
presentation,
you
should
understand
that
these
statements
are
not
guarantees
of
performance
or
results.
The
forward-looking
statements
and
projections
are
subject
to
and
involve
risks,
uncertainties
and
assumptions
and
you
should
not
place
undue
reliance
on
these
forward-looking
statements
or
projections.
Although
the
Company
believes
that
these
forward-looking
statements
and
projections
are
based
on
reasonable
assumptions
at
the
time
they
are
made,
you
should
be
aware
that
many
factors
could
affect
the
Company’s
actual
financial
results
or
results
of
operations
and
could
cause
actual
results
to
differ
materially
from
those
expressed
in
the
forward-looking
statements
and
projections.
The
Company
undertakes
no
obligation
to
update
or
revise
any
forward-looking
statements,
whether
as
a
result
of
new
information,
future
events
or
otherwise.
If
the
Company
does
update
one
or
more
forward-looking
statements,
there
should
be
no
inference
that
it
will
make
additional
updates
with
respect
to
those
or
other
forward-looking
statements.
In
addition
to
the
financial
measures
prepared
in
accordance
with
U.S.
generally
accepted
accounting
principles
(“GAAP”),
this
presentation
contains
the
non-GAAP
financial
measures
EBITDA,
Adjusted
EBITDA
and
Adjusted
gross
margin
from
homes
delivered.
The
reasons
for
the
use
of
these
measures,
a
reconciliation
of
these
measures
to
the
most
directly
comparable
GAAP
measures
and
other
information
relating
to
these
measures
are
included
below
in
the
appendix
to
this
presentation. |
 3
3
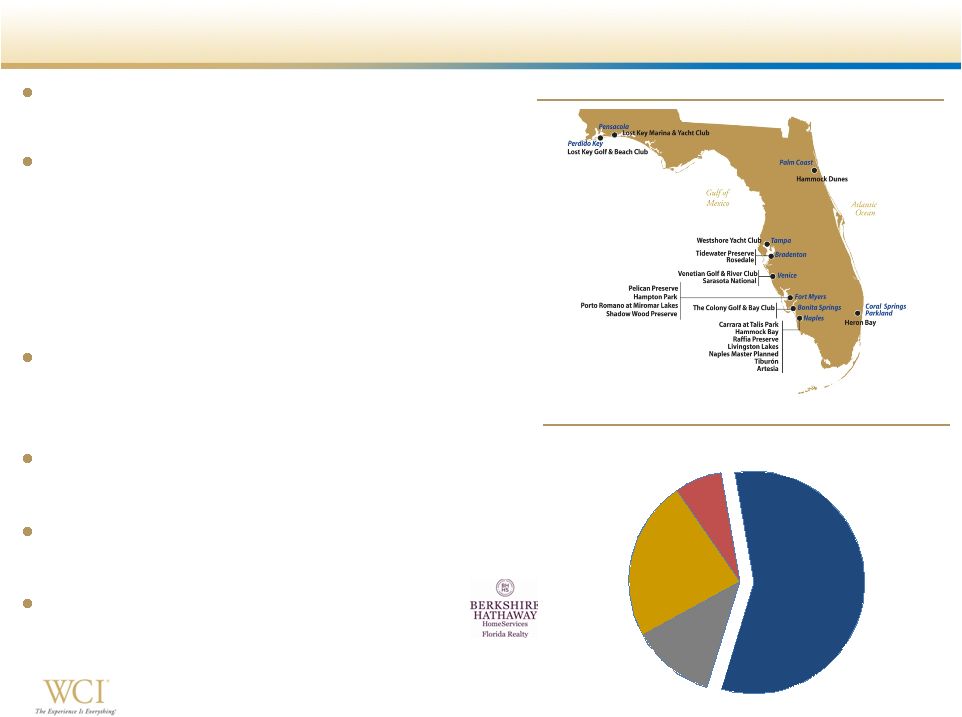
Cash
58%
LTV 1-64%
12%
LTV 65-80%
23%
LTV >80%
7%
Buyer Profile with Low Reliance on Financing
WCI Communities at a Glance
Lifestyle community developer and
luxury homebuilder throughout Florida
Target move-up, second-home and
active adult customers
–
High average selling prices -
$427k on
3Q14 deliveries
–
High proportion of all cash buyers -
58% in
3Q14; 59% year to date
–
Low cancellation rate –
6.5% in 3Q14
Approximately 10,400 home sites
owned and controlled as of
September 30, 2014
Conservative balance sheet with $170
million of cash
Continued Homebuilding new order and
neighborhood count growth
Complementary and value-add Real
Estate Services & Amenities
businesses
Geographic Footprint
Loan to Value Percentage –
3Q14 Deliveries |
 4
4
Note: Florida as referenced to John Burns Real Estate Consulting and in the
charts represents a compilation of the major FL markets
(1)
US Census Bureau
(2)
John Burns Real Estate Consulting, October 2014
(3)
Florida Realtors’
®
Florida Housing Market statewide data reports
(4)
Metrostudy
Compelling Florida Real Estate Market Opportunity
Florida building permits year to date 2014 –
2
nd
highest in the nation
(1)
–
LTM permits still ~70% off peak
–
LTM single family permit growth of 6.5%,
compared to (0.8%) nationally
(2)
Florida is a leading growth state
–
Population growth –
3
rd
highest growth state
(1)
–
Household growth rate three times the national
rate
(2)
–
Job growth rate 20% higher than the national
rate
(2)
–
Sarasota/Bradenton and Naples/Ft.Myers
ranked among the top 10 national markets for
year-over-year starts growth
(4)
Southern Florida ranked as the #1 market in the
U.S. in October 2014
(2)
(includes Naples, Ft. Myers,
Sarasota, West Palm Beach, Miami and Ft. Lauderdale)
Strong resale market
–
September 2014 was the 34th consecutive
month of year over year increase in median
sale prices for both single and multi-family
homes
(3)
Household Growth –
YOY Percent Change
0.0%
0.2%
0.4%
0.6%
0.8%
1.0%
1.2%
1.4%
2010
2011
2012
2013
Aug-14 TTM
Florida
National
Source: Moody's Analytics, John Burns R.E. Consulting, Pub: Oct-14
Months Supply of Resale Inventory -
Single Family
(3)
5.4
5.4
5.1
4.7
4.7
4.1
Florida
Naples
Ft.Lauderdale*
Ft.Myers
Tampa
Bradenton/Sarasota
Note:
Ft.Lauderdale represents Broward County only; other locations represent MSA
|
 5
5
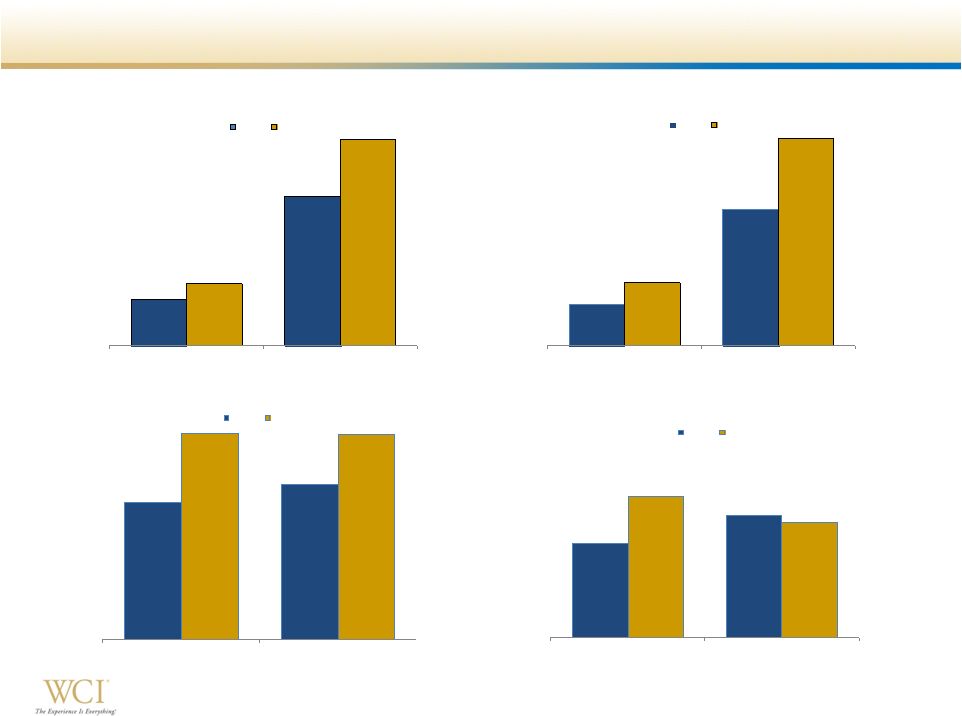
Continued New Order Growth ($ in thousands)
128
415
172
572
3Q
YTD
New Orders
2013
2014
+34%
+38%
$54,411
$183,347
$84,001
$278,750
3Q
YTD
Contract Value of New Orders
2013
2014
+54%
+52%
$425
$442
$488
$487
3Q
YTD
New Orders ASP
2013
2014
+15%
+10%
2.6%
3.4%
3.9%
3.2%
3Q
YTD
New Orders
Incentives % of Base Price
2013
2014
-20 bps
+130 bps |
 6
6
Continued Deliveries and Backlog Growth ($ in
thousands) 141
342
146
406
3Q
YTD
Deliveries
2013
2014
+4%
+19%
328
459
3Q13
3Q14
Backlog Units
3Q13
3Q14
+40%
$154,239
$252,308
3Q13
3Q14
Contract Value of Backlog
3Q13
3Q14
+64%
ASP -
$470
ASP -
$550
$429
$423
$427
$422
3Q
YTD
ASP per Home Delivered
2013
2014 |
 7
7
Executing on the Long Term Growth Strategy
(1)
Measured as a percentage of total homebuilding revenues
(2)
Percentage measured as a percentage of total revenues
17.0%
17.2%
3.0%
1.5%
20.0%
18.7%
YTD 2013
YTD 2014
SG&A %
(1)
Non-Cash Incentive Comp
$25.7
$23.7
YTD 2013
YTD 2014
Adjusted EBITDA
(2)
($ in
millions)
11.6%
9.3%
HB
$145.1
HB
$171.3
RES
$60.9
RES
$67.8
AM $16.6
AM $17.3
$222.6
$256.4
YTD 2013
YTD 2014
Revenues
($ in millions)
HB
$44.4
HB
$46.9
RES $3.2
RES $1.8
AM $(1.7)
AM $(1.2)
$45.9
$47.5
YTD 2013
YTD 2014
Gross Margin
($ in millions) |
 8
8
6,483
5,872
5,390
379
2,635
4,977
6,862
8,507
10,367
4Q12
4Q13
3Q14
Legacy
New Acquisitions
Strong Land Portfolio Positions WCI for Future Growth
Land portfolio totals approximately
10,400 owned and controlled home
sites
High quality land in constrained
markets
21% increase from the
approximately 8,600 owned and
controlled home sites in September
2013
84% Owned / 16% Optioned
Low basis legacy land marked to fair
value in 2009 represents 52% of the
total portfolio
Experienced team with extensive
land development expertise
Actively pursuing additional land
acquisition opportunities throughout
Florida
Owned and Controlled Home Sites |
 9
9
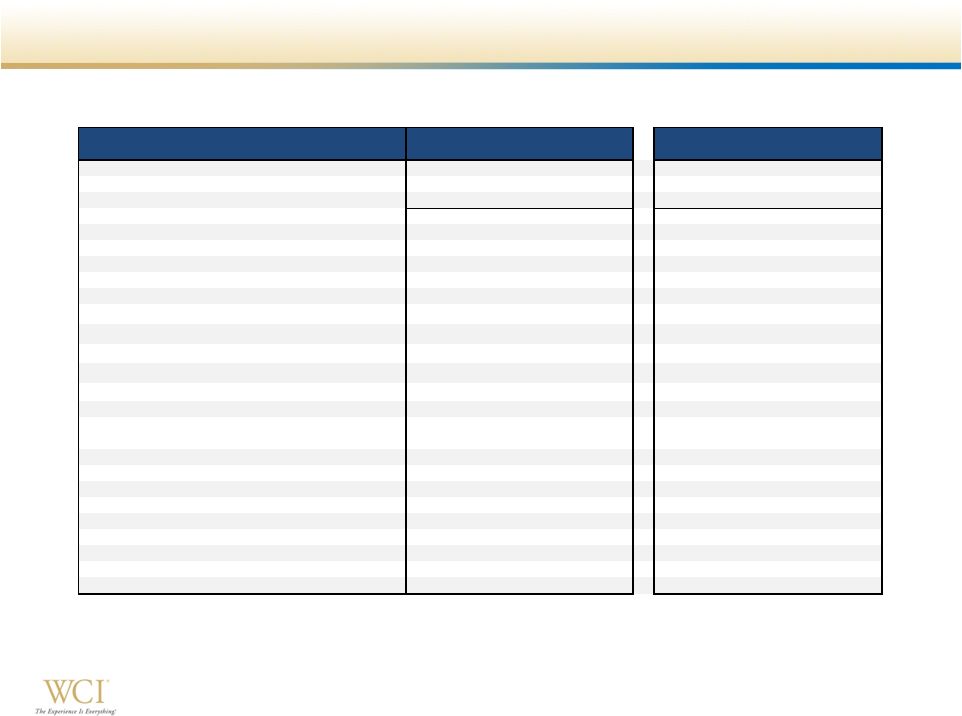
Selected Third Quarter and YTD Operating Results
Note: Some variance percentages have been rounded to tie to third quarter
2014 Form 10-Q. $ in thousands, except per share amounts
2014
2013
Variance %
2014
2013
Variance %
Homebuilding revenues
62,381
$
60,802
$
2.6%
171,294
$
145,054
$
18.1%
Real estate services revenues
22,886
20,524
11.7%
67,848
60,915
11.3%
Amenities revenues
4,393
4,192
4.8%
17,257
16,620
4.2%
Total revenues
89,660
85,518
4.9%
256,399
222,589
15.2%
Total gross margin
15,698
17,157
-8.5%
47,539
45,863
3.7%
Income tax (expense) benefit
(1,703)
-
NM
(6,337)
85
NM
Net income (loss) attributable to common shareholders
3,140
$
(17,022)
$
NM
8,958
$
(8,230)
$
NM
Earnings (loss) per share - diluted
0.12
$
(0.71)
$
NM
0.34
$
(0.41)
$
NM
Weighted average number of shares outstanding - diluted
26,307
24,138
9.0%
26,272
20,099
30.7%
SG&A expenses as a percent of Homebuilding revenues
17.7%
16.9%
+80 bps
18.7%
20.0%
-130 bps
Adjusted gross margin percentage
28.6%
31.3%
-270 bps
29.5%
32.6%
-310 bps
Adjusted EBITDA
7,847
$
11,320
$
-30.7%
23,740
$
25,724
$
-7.7%
Homes delivered
146
141
3.5%
406
342
18.7%
Average selling price per home delivered
427
$
429
$
-0.5%
422
$
423
$
-0.2%
New orders
172
128
34.4%
572
415
37.8%
Average selling price per new order
488
$
425
$
14.8%
487
$
442
$
10.2%
Backlog units
459
328
39.9%
Average selling price per backlog unit
550
$
470
$
17.0%
Three Months Ended September 30,
Nine Months Ended September 30, |
 10
10
Strong Balance Sheet with Ample Liquidity
Conservative balance sheet
positioned to execute growth
strategy
Year to date investment in
land and land development
of approximately $111
million
Undrawn $75 million
revolving credit facility
(1)
Available liquidity includes the $75 million of borrowing capacity under a
four-year revolving credit facility and $8 million of borrowing capacity
available under a revolving credit facility with Stonegate Bank.
(2)
Net Debt represents total debt excluding premium less cash and cash equivalents;
capital represents net debt plus total equity.
$ in thousands
Cash & cash equivalents
169,541
$
213,352
$
Real estate inventories
420,045
280,293
Senior notes due 2021
250,000
200,000
Total equity
421,022
409,864
Total capitalization
671,022
609,864
Availabile liquidity
(1)
252,541
296,352
Debt to capitalization
37.3%
32.8%
Net debt to capital
(2)
16.0%
NM
(Cash + inventory) / debt
2.36
2.47
September 30,
2014 December 31, 2013 |
 11
11
Key Takeaways
Fully integrated Florida luxury homebuilder and
community developer
Focus on move-up, second-home and active
adult customer segments
Complementary and strategic Amenities and
Real Estate Services businesses
Florida real estate market remains strong
Continued growth
Actively pursuing land acquisition opportunities
Leverage the scalable operating platform
Experienced and talented team
–
Orders & deliveries
–
Neighborhood counts |
 12
12
Appendix |
 13
13
2014
2013
2014
2013
($ in thousands)
Homebuilding gross margin
16,444
$
17,810
$
46,940
$
44,433
$
Less: gross margin from land and home sites
-
166
-
201
Gross margin from homes delivered
16,444
17,644
46,940
44,232
Add: capitalized interest in cost of sales
1,386
1,317
3,653
2,880
Adjusted gross margin from homes delivered
17,830
$
18,961
$
50,593
$
47,112
$
Gross margin from homes delivered as a percentage
of revenues from homes delivered
26.4%
29.2%
27.4%
30.6%
Adjusted gross margin from homes delivered as a
percentage of revenues from homes delivered
28.6%
31.3%
29.5%
32.6%
Three Months Ended
September 30,
September 30,
Nine Months Ended
Reconciliation of Non-GAAP Financial Measures
Adjusted Gross Margin from Homes Delivered
Reconciliation of Non-GAAP Financial Measures
In addition to the results reported in accordance with U.S. generally accepted
accounting principles (“GAAP”), we have provided information in this
presentation relating to adjusted gross margin from homes delivered, EBITDA and
Adjusted EBITDA (as defined below). Adjusted Gross Margin from Homes
Delivered We
calculate
adjusted
gross
margin
from
homes
delivered
by
subtracting
the
gross
margin
from
land
and
home
sites,
if
any,
from
Homebuilding
gross
margin
to
arrive
at
gross
margin
from
homes
delivered.
Adjusted
gross
margin
from
homes
delivered
is
calculated
by
adding
asset
impairments,
if
any,
and
capitalized
interest
in
cost
of
sales
to
gross
margin
from
homes
delivered.
Management
uses
adjusted
gross
margin
from
homes
delivered
to
evaluate
operating
performance
in
our
Homebuilding
segment
and
make
strategic
decisions
regarding
sales
price,
construction
and
development
pace,
product
mix
and
other
operating
decisions.
We
believe
that
adjusted
gross
margin
from
homes
delivered
is
relevant
and
useful
to
investors
and
other
interested
parties
for
evaluating
our
comparative
operating
performance
from
period
to
period
and
among
companies
within
the
homebuilding
industry
as
it
is
reflective
of
overall
profitability
during
any
given
reporting
period.
This
measure
is
considered
a
non-GAAP
financial
measure
and
should
be
considered
in
addition
to,
rather
than
as
a
substitute
for,
the
comparable
GAAP
financial
measures
when
evaluating
our
operating
performance.
Although
other
companies
in
the
homebuilding
industry
report
similar
information,
the
methods
used
by
such
companies
may
differ
from
our
methodology
and,
therefore,
may
not
be
comparable.
We
urge
investors
and
other
interested
parties
to
understand
the
methods
used
by
other
companies
in
the
homebuilding
industry
to
calculate
gross
margins
and
any
adjustments
to
such
amounts
before
comparing
our
measures
to
those
of
such
other
companies.
The table below reconciles adjusted gross margin from homes delivered to the most
directly comparable GAAP financial measure, Homebuilding gross margin, for
the periods presented herein. |
 14
14
Reconciliation of Non-GAAP Financial Measures
(continued) EBITDA and Adjusted EBITDA
EBITDA and Adjusted EBITDA
Adjusted
EBITDA
measures
performance
by
adjusting
net
income
(loss)
attributable
to
common
shareholders
of
WCI
Communities,
Inc.
to
exclude,
if
any,
interest
expense,
capitalized
interest
in
cost
of
sales,
income
taxes,
depreciation
(‘‘EBITDA’’),
preferred
stock
dividends,
income
(loss)
from
discontinued
operations,
other
income,
stock-based
and
other
non-cash
long-term
incentive
compensation
expense,
asset
impairments
and
expenses
related
to
early
repayment
of
debt.
We
believe
that
the
presentation
of
Adjusted
EBITDA
provides
useful
information
to
investors
and
other
interested
parties
regarding
our
results
of
operations
because
it
assists
those
parties
and
us
when
analyzing
and
benchmarking
the
performance
and
value
of
our
business.
We
also
believe
that
Adjusted
EBITDA
is
useful
as
a
measure
of
comparative
operating
performance
from
period
to
period
and
among
companies
in
the
homebuilding
industry
as
it
is
reflective
of
changes
in
pricing
decisions,
cost
controls
and
other
factors
that
affect
operating
performance,
and
it
removes
the
effects
of
our
capital
structure
(such
as
preferred
stock
dividends
and
interest
expense),
asset
base
(primarily
depreciation),
items
outside
of
our
control
(primarily
income
taxes)
and
the
volatility
related
to
the
timing
and
extent
of
non-operating
activities
(such
as
discontinued
operations
and
asset
impairments).
Accordingly,
we
believe
that
this
measure
is
useful
for
comparing
general
operating
performance
from
period
to
period.
Other
companies
may
define
Adjusted
EBITDA
differently
and,
as
a
result,
our
measure
of
Adjusted
EBITDA
may
not
be
directly
comparable
to
Adjusted
EBITDA
of
other
companies.
Although
we
use
Adjusted
EBITDA
as
a
financial
measure
to
assess
the
performance
of
our
business,
the
use
of
Adjusted
EBITDA
is
limited
because
it
does
not
include
certain
material
costs,
such
as
interest
and
income
taxes,
necessary
to
operate
our
business.
Adjusted
EBITDA
and
EBITDA
should
be
considered
in
addition
to,
and
not
as
substitutes
for,
net
income
(loss)
in
accordance
with
GAAP
as
a
measure
of
performance.
Our
presentation
of
EBITDA
and
Adjusted
EBITDA
should
not
be
construed
as
an
indication
that
our
future
results
will
be
unaffected
by
unusual
or
nonrecurring
items.
Our
EBITDA-based
measures
have
limitations
as
analytical
tools
and,
therefore,
investors
and
other
interested
parties
should
not
consider
them
in
isolation
or
as
substitutes
for
analyses
of
our
results
as
reported
under
GAAP.
Some
such
limitations
are:
Because
of
these
limitations,
our
EBITDA-based
measures
are
not
intended
to
be
alternatives
to
net
income
(loss),
indicators
of
our
operating
performance,
alternatives
to
any
other
measure
of
performance
in
conformity
with
GAAP
or
alternatives
to
cash
flow
provided
by
(used
in)
operating
activities
as
measures
of
liquidity.
Investors
and
other
interested
parties
should
therefore
not
place
undue
reliance
on
our
EBITDA-
based
measures
or
ratios
calculated
using
those
measures.
Our
GAAP-based
measures
can
be
found
in
our
unaudited
consolidated
financial
statements
in
Item
1
of
the
Quarterly
Report
on
Form
10-Q
that
we
plan
to
file
with
the
Securities
and
Exchange
Commission
on
or
before
November
7,
2014.
they do not reflect the impact of earnings or charges resulting from matters that
we consider not to be indicative of our ongoing operations; they are not
adjusted for all non-cash income or expense items that are reflected in our consolidated statements of cash flows;
they do not reflect the interest expense necessary to service our debt; and
other companies in our industry may calculate these measures differently than we
do, thereby limiting their usefulness as comparative measures.
|
 15
15
Reconciliation of Non-GAAP Financial Measures
(continued) EBITDA and Adjusted EBITDA (continued) (1)
Represents
capitalized
interest
expensed
in
cost
of
sales
on
home
deliveries
and
land
and
home
site
sales.
(2)
Represents
the
Company’s
income
taxes
as
reported
in
its
unaudited
consolidated
statements
of
operations.
(3)
Represents
a
reduction
in
net
income
attributable
to
WCI
Communities,
Inc.
pertaining
to
its
preferred
stock
wherein
we
(i)
exchanged
903,825
shares
of
our
common
stock
(valued
at
$19.0
million)
for
10,000
outstanding
shares
of
our
Series
A
preferred
stock
during
July
2013
and
(ii)
paid
$0.7
million
in
cash
to
purchase
the
one
outstanding
share
of
our
Series
B
preferred
stock
during
April
2013.
All
such
shares
of
preferred
stock,
which
were
carried
at
a
nominal
value
on
our
consolidated
balance
sheets,
have
been
cancelled
and
retired.
In
accordance
with
Accounting
Standards
Codification
260,
Earnings
Per
Share,
paragraph
10-S99-2,
any
difference
between
the
consideration
transferred
to
our
preferred
stock
shareholders
and
the
corresponding
book
value
has
been
(i)
characterized
as
a
preferred
stock
dividend
in
the
Company’s
unaudited
consolidated
statements
of
operations
during
the
period
that
the
related
transaction
was
completed
and
(ii)
deducted
from
net
income
attributable
to
WCI
Communities,
Inc.
to
arrive
at
net
income
(loss)
attributable
to
common
shareholders
of
WCI
Communities,
Inc.
(4)
Represents
the
Company’s
other
income,
net
as
reported
in
its
unaudited
consolidated
statements
of
operations.
(5)
Represents
expenses
recorded
in
the
Company’s
unaudited
consolidated
statements
of
operations
related
to
its
stock-based
and
other
non-cash
long-term
incentive compensation
plans.
(6)
Represents
expenses
related
to
early
repayment
of
debt
as
reported
in
the
Company’s
unaudited
consolidated
statements
of
operations
during
the
three
and
nine
months
ended
September
30,
2013,
including
write-offs
of
unamortized
debt
discount
and
debt
issuance
costs
and
a
prepayment
premium
related
to
our
voluntary
prepayment
during
August
2013
of
the
entire
outstanding
principal
amount
of
the
Company’s
Senior
Secured
Term
Notes
due
2017.
The table below reconciles EBITDA and Adjusted EBITDA to the most directly
comparable GAAP financial measure, net income (loss) attributable to common
shareholders of WCI Communities, Inc., for the periods presented herein. 2014
2013
2014
2013
($ in thousands)
Net income (loss) attributable to common
shareholders of WCI Communities, Inc.
3,140
$
(17,022)
$
8,958
$
(8,230)
$
Interest expense
191
184
876
1,798
Capitalized interest in cost of sales (1)
1,386
1,317
3,653
2,880
Income taxes (2)
1,703
-
6,337
(85)
Depreciation
678
505
1,910
1,513
EBITDA
7,098
(15,016)
21,734
(2,124)
Preferred stock dividends (3)
-
18,980
-
19,680
Other income, net (4)
(107)
(29)
(535)
(1,249)
Stock-based and other non-cash long-term
incentive compensation expense (5)
856
2,280
2,541
4,312
Expenses related to early repayment of debt (6)
-
5,105
-
5,105
Adjusted EBITDA
7,847
$
11,320
$
23,740
$
25,724
$
Adjusted EBITDA margin
8.8%
13.2%
9.3%
11.6%
Three Months Ended
September 30,
September 30,
Nine Months Ended |