Attached files
| file | filename |
|---|---|
| 8-K - 8-K - Equity Commonwealth | a14-23406_18k.htm |
| EX-99.1 - EX-99.1 - Equity Commonwealth | a14-23406_1ex99d1.htm |
Exhibit 99.2
|
|
Third Quarter 2014 Corporate Headquarters Investor Relations Two North Riverside Plaza Sarah Byrnes Suite 600 (312) 646-2801 Chicago, IL 60606 ir@eqcre.com (312) 646-2800 www.eqcre.com Supplemental Operating and Financial Data |

|
|
Corporate Information Company Profile and Investor Information 3 Financial Information Key Financial Data 4 Condensed Consolidated Balance Sheets 5 Condensed Consolidated Statements of Operations 7 Calculation of Property Net Operating Income (NOI) 9 Calculation of EBITDA and Adjusted EBITDA 10 Calculation of Fund from Operations (FFO) and Normalized FFO 11 Debt Summary 12 Debt Maturity Schedule 13 Leverage Ratios, Coverage Ratios and Public Debt Covenants 14 Capital Expenditures Summary 15 Acquisitions and Dispositions Information Since January 1, 2014 16 Portfolio Information Portfolio Summary by Property Location 17 Same Property Results of Operations by Location 18 Top 30 Properties by Annualized Rental Revenue 19 Leasing Summary 20 Leasing Summary by Property Location 21 Occupancy and Leasing Analysis by Property Location 22 Tenants Representing 1% or More of Total Annualized Rental Revenue 23 Portfolio Lease Expiration Schedule 24 Property Detail 25 Additional Support Condensed Consolidated Statements of Operations - Discontinued Operations 28 Summary of Equity Investments 29 Definitions 30 Forward-Looking Statements changes in the real estate industry, particularly in those markets in which our properties are located; our ability to raise equity or debt capital; our ability to internalize EQC’s corporate and business operations from RMR; our ability to transition property management to CBRE; the future amount of leasing activity and occupancy rates at our properties; the future rent rates we will be able to charge at our properties; the costs we may incur to lease space in our properties; our ability to declare or pay distributions to our shareholders and the amounts of such distributions; the credit quality of our tenants; the likelihood that our tenants will pay rent, renew leases, enter into new leases or be affected by cyclical economic conditions; our sales of properties; our ability to compete for tenancies effectively; our ability to pay interest on and principal of our debt; our ability to obtain credit facilities, and the availability of borrowings under those credit facilities; and our tax status as a REIT. TABLE OF CONTENTS Some of the statements contained in this presentation constitute forward-looking statements within the meaning of the federal securities laws. Any forward-looking statements contained in this presentation are intended to be made pursuant to the safe harbor provisions of Section 21E of the Private Securities Litigation Reform Act of 1995. Forward-looking statements relate to expectations, beliefs, projections, future plans and strategies, anticipated events or trends and similar expressions concerning matters that are not historical facts. In some cases, you can identify forward-looking statements by the use of forward-looking terminology such as “may,” “will,” “should,” “expects,” “intends,” “plans,” “anticipates,” “believes,” “estimates,” “predicts,” or “potential” or the negative of these words and phrases or similar words or phrases which are predictions of or indicate future events or trends and which do not relate solely to historical matters. You can also identify forward-looking statements by discussions of strategy, plans or intentions. While forward-looking statements reflect our good faith beliefs, they are not guarantees of future performance. We disclaim any obligation to publicly update or revise any forward-looking statement to reflect changes in underlying assumptions or factors, of new information, data or methods, future events or other changes. For a further discussion of these and other factors that could cause our future results to differ materially from any forward-looking statements, see the sections entitled “Risk Factors” in our Annual Report on Form 10-K for the year ended December 31, 2013 and in our most recent Quarterly Report on Form 10-Q. The forward-looking statements contained in this supplement reflect our current views about future events and are subject to numerous known and unknown risks, uncertainties, assumptions and changes in circumstances that may cause our actual results to differ significantly from those expressed in any forward-looking statement. We do not guarantee that the transactions and events described will happen as described (or that they will happen at all). The following factors, among others, could cause actual results and future events to differ materially from those set forth or contemplated in the forward-looking statements: 2 |

2
|
|
COMPANY PROFILE AND INVESTOR INFORMATION Equity Commonwealth (NYSE: EQC) is an internally managed and self-advised real estate investment trust (REIT). EQC is one of the largest commercial office REITs in the United States, with a portfolio of over 42 million square feet located in 30 states, DC and Australia. No. of Sq. % Q3 2014 Cash Basis Properties Ft. Leased Revenues NOI (1) CBD Properties 40 21,892 84.5% 63.5% 60.1% Suburban Properties 116 21,027 87.4% 36.5% 39.9% Total 156 42,919 85.9% 100.0% 100.0% Senior Unsecured Debt Ratings NYSE Trading Symbols Moody's -- Baa3 Common Stock -- EQC Standard & Poor's -- BBB- Preferred Stock Series D -- EQC-PD Preferred Stock Series E -- EQC-PE 7.50% Senior Notes due 2019 -- EQCNCL 5.75% Senior Notes due 2042 -- EQCO Board of Trustees Sam Zell (Chairman) David A. Helfand Kenneth Shea James S. Corl Peter Linneman Gerald A. Spector Martin L. Edelman James L. Lozier, Jr. James A. Star Edward A. Glickman Mary Jane Robertson Senior Management David A. Helfand David S. Weinberg President and Chief Executive Officer Executive Vice President and Chief Operating Officer Adam S. Markman Orrin S. Shifrin Executive Vice President, Executive Vice President, General Chief Financial Officer and Treasurer Counsel and Secretary Equity Research Coverage (2) Bank of America / Merrill Lynch RBC Capital Markets JMP Securities James Feldman Rich Moore Mitch Germain (646) 855-5808 (440) 715-2646 (212) 906-3546 james.feldman@baml.com rich.moore@rbccm.com mgermain@jmpsecurities.com Citigroup Stifel Nicolaus Green Street Advisors Michael Bilerman John Guinee John Bejjani (212) 816-1383 (443) 224-1307 (949) 640-8780 michael.bilerman@citi.com jwguinee@stifel.com jbejjani@greenst.com Debt Research Coverage (2) Bank of America / Merrill Lynch Credit Suisse Wells Fargo Securities Thomas Truxillo John Giordano Thierry Perrein (980) 386-5212 (212) 538-4935 (704) 715-8455 thomas.c.truxillo_jr@baml.com john.giordano@credit-suisse.com thierry.perrein@wellsfargo.com Citigroup Thomas Cook (212) 723-1112 thomas.n.cook@citigroup.com Rating Agencies (2) Moody's Investors Service Standard & Poor's Lori Marks Jaime Gitler (212) 553-1098 (212) 438-5049 lori.marks@moodys.com jaime.gitler@standardandpoors.com (1) Non-GAAP financial measure which is defined in the "Definitions" section of this document. Please refer to the calculation in this document which reconciles the differences between the non-GAAP financial measure and the most directly comparable GAAP financial measure. (2) Any opinions, estimates or forecasts regarding EQC's performance made by these analysts or agencies do not represent opinions, forecasts or predictions of EQC or its management. EQC does not by its reference to the analysts and agencies above imply its endorsement of or concurrence with any information, conclusions or recommendations provided by any of these analysts or agencies. |

3
|
|
KEY FINANCIAL DATA (dollar and share amounts in thousands, except per share data) As of and for the Three Months Ended 9/30/2014 6/30/2014 3/31/2014 12/31/2013 9/30/2013 OPERATING INFORMATION Percent leased 85.9% 86.7% 86.5% 87.0% 86.8% Total revenues $ 216,595 $ 215,194 $ 217,260 $ 214,028 $ 214,201 NOI (1) 117,203 122,493 115,529 114,568 111,851 Cash Basis NOI (1) 114,571 124,435 111,292 110,440 107,346 Adjusted EBITDA (1) 99,626 125,736 116,116 126,332 120,810 NOI margin (2) 54.1% 56.9% 53.2% 53.5% 52.2% Net income (loss) 156,740 5,385 20,448 (5,301) (216,207) Net income (loss) available for EQC common shareholders 149,759 (17,802) 9,297 (16,452) (227,466) Normalized FFO available for EQC common shareholders(1) 57,306 81,317 60,967 72,370 63,706 Common distributions paid - - 29,597 29,596 29,579 SHARES OUTSTANDING AND PER SHARE DATA Shares Outstanding Common stock outstanding (at end of period) 128,894 128,860 118,414 118,387 118,388 Preferred stock outstanding (at end of period) (3) 15,915 15,917 26,180 26,180 26,180 Weighted Average Shares Outstanding - EPS & FFO Weighted Average Common shares outstanding -- basic 128,880 123,812 118,400 118,387 118,328 Weighted Average Common shares outstanding -- diluted (3) 131,243 123,812 118,400 118,387 118,328 Weighted Average Shares Outstanding - Normalized FFO Weighted Average Common shares outstanding -- basic and diluted (3) 128,880 123,812 118,400 118,387 118,328 Per Share Data Net income (loss) available for EQC common shareholders - basic $ 1.16 $ (0.14) $ 0.08 $ (0.14) $ (1.92) Net income (loss) available for EQC common shareholders - diluted (3) 1.16 (0.14) 0.08 (0.14) (1.92) Normalized FFO available for EQC common shareholders - diluted (3) 0.44 0.66 0.51 0.61 0.54 Common distributions paid - - 0.25 0.25 0.25 BALANCE SHEET Total assets $6,170,796 $6,593,360 $6,600,714 $6,646,434 $6,821,987 Gross book value of real estate assets (4) 6,350,633 6,360,275 6,613,524 6,575,169 6,781,099 Total liabilities 2,681,793 3,222,472 3,241,644 3,282,848 3,400,954 MARKET CAPITALIZATION Total debt (book value) (5) $2,442,942 $2,986,604 $3,009,627 $3,025,428 $3,134,948 Plus: Market value of preferred shares (at end of period) 400,571 403,997 657,820 551,142 569,947 Plus: Market value of common shares (at end of period) 3,313,853 3,391,593 3,114,281 2,759,599 2,593,871 Total market capitalization $6,157,366 $6,782,194 $6,781,728 $6,336,169 $6,298,766 RATIOS Total debt (5) / total market capitalization 39.7% 44.0% 44.4% 47.7% 49.8% Net debt (6) / annualized adjusted EBITDA 4.6x 5.1x 6.1x 5.5x 6.1x Adjusted EBITDA / interest expense 2.8x 3.3x 3.0x 3.2x 3.0x (1) Non-GAAP financial measure which is defined in the "Definitions" section of this document. Please refer to the calculation in this document which reconciles the differences between the non-GAAP financial measure and the most directly comparable GAAP financial measure. (2) NOI margin is defined as NOI as a percentage of total revenues. (3) As of September 30, 2014, we had 4,915 series D preferred shares outstanding that were convertible into 2,363 of our common shares, which for GAAP earnings per common share and FFO per common share, were dilutive for the three months ended September 30, 2014 and anti-dilutive for all other periods presented. The series D preferred shares outstanding were anti-dilutive for all periods presented with respect to Normalized FFO per common share. (4) Gross book value of real estate assets is real estate properties, at cost, plus acquisition costs, before purchase price allocations and after impairment write downs, if any. (5) Total debt includes net unamortized premiums and discounts, and mortgage debt related to properties classified as held for sale totaling $19,688, $20,018 and $20,127 as of March 31, 2104, December 31, 2013, and September 30, 2013, respectively. Total debt excludes the debt of our unconsolidated equity investees. (6) Net debt is calculated as Total debt minus cash and cash equivalents. |

4
|
|
September 30, December 31, 2014 2013 ASSETS Real estate properties: Land 740,448 $ 699,135 $ Buildings and improvements 5,145,916 4,838,030 5,886,364 5,537,165 Accumulated depreciation (988,323) (895,059) 4,898,041 4,642,106 Properties held for sale - 573,531 Acquired real estate leases, net 212,584 255,812 Equity investments - 517,991 Cash and cash equivalents 597,405 222,449 Restricted cash 15,554 22,101 Rents receivable, net of allowance for doubtful accounts of $7,013 and $7,885, respectively 238,207 223,769 Other assets, net 209,005 188,675 Total assets 6,170,796 $ 6,646,434 $ LIABILITIES AND SHAREHOLDERS' EQUITY Revolving credit facility - $ 235,000 $ Senior unsecured debt, net 1,823,182 1,855,900 Mortgage notes payable, net 619,760 914,510 Liabilities related to properties held for sale - 28,734 Accounts payable and accrued expenses 163,075 165,855 Assumed real estate lease obligations, net 28,950 33,935 Rent collected in advance 26,197 27,553 Security deposits 13,648 11,976 Distributions payable 6,981 - Due to related persons - 9,385 Total liabilities 2,681,793 $ 3,282,848 $ Shareholders' equity: Preferred shares of beneficial interest, $0.01 par value: 50,000,000 shares authorized; Series D preferred shares; 6 1/2% cumulative convertible; 119,266 $ 368,270 $ Series E preferred shares; 7 1/4% cumulative redeemable on or after May 15, 2016; 11,000,000 shares issued and outstanding, aggregate liquidation preference $275,000 265,391 265,391 Common shares of beneficial interest, $0.01 par value: 350,000,000 shares authorized; 128,893,552 and 118,386,918 shares issued and outstanding, respectively 1,289 1,184 Additional paid in capital 4,484,552 4,213,474 Cumulative net income 2,392,413 2,209,840 Cumulative other comprehensive loss (39,765) (38,331) Cumulative common distributions (3,111,868) (3,082,271) Cumulative preferred distributions (622,275) (573,971) Total shareholders' equity 3,489,003 $ 3,363,586 $ Total liabilities and shareholders' equity 6,170,796 $ 6,646,434 $ (amounts in thousands, except share data) CONDENSED CONSOLIDATED BALANCE SHEETS 4,915,497 and 15,180,000 shares issued and outstanding, respectively, aggregate liquidation preference of $122,887 and $379,500, respectively 5 |

5
|
|
September 30, December 31, 2014 2013 Additional Balance Sheet Information Straight-line rents receivable 219,053 $ 199,587 $ Tenant accounts receivable, net of allowance for doubtful accounts 7,236 9,794 Other 11,918 14,388 Rents receivable, net of allowance for doubtful accounts 238,207 $ 223,769 $ Capitalized lease incentives 15,582 $ 15,258 $ Deferred financing fees 19,992 24,529 Deferred leasing costs 121,160 100,768 Other 52,271 48,120 Other assets, net 209,005 $ 188,675 $ Accounts payable 6,013 $ 16,011 $ Accrued interest 20,324 26,882 Accrued taxes 57,033 62,532 Due to RMR (1) 26,137 - Other accrued liabilities 53,568 60,430 Accounts payable and accrued expenses 163,075 $ 165,855 $ (1) Due to RMR represents amounts payable to REIT Management and Research Inc. (RMR), EQC's former external advisor. RMR was a related person as of December 31, 2013, and such amounts were included in Due to related persons as of that date. RMR ceased to be a related person after certain of EQC's former officers, who were also officers of RMR, resigned. 6 |

6
|
|
1 2 3 4 September 30, September 30, 2014 2013 2014 2013 Revenues Rental income (1) 174,216 $ 170,908 $ 518,663 $ 592,221 $ Tenant reimbursements and other income 42,379 43,293 130,386 146,780 Total revenues 216,595 $ 214,201 $ 649,049 $ 739,001 $ Expenses Operating expenses 99,392 $ 102,350 $ 293,824 $ 310,585 $ Depreciation and amortization 57,213 56,465 168,693 182,494 General and administrative 47,450 25,742 96,395 63,454 Loss on asset impairment - 124,253 17,922 124,253 Acquisition related costs - (436) 5 337 Total expenses 204,055 $ 308,374 $ 576,839 $ 681,123 $ Operating income (loss) 12,540 $ (94,173) $ 72,210 $ 57,878 $ Interest and other income 406 $ 227 $ 1,071 $ 931 $ Interest expense (including net amortization of debt discounts, premiums and deferred financing fees of $(91), $(608), $(700), and $265, respectively) (35,245) (39,236) (111,079) (134,452) Gain (loss) on early extinguishment of debt 6,699 - 6,699 (60,027) Gain on sale of equity investments 171,754 - 171,721 66,293 Gain on issuance of shares by an equity investee - - 17,020 - Income (loss) from continuing operations before income tax expense and equity in earnings of investees 156,154 (133,182) 157,642 (69,377) Income tax expense (703) (785) (2,166) (2,527) Equity in earnings of investees 1,072 10,492 24,460 14,913 Income (loss) from continuing operations 156,523 (123,475) 179,936 (56,991) Discontinued operations: Income from discontinued operations (1) 95 95 8,220 1,732 Gain (loss) on asset impairment from discontinued operations 122 (92,827) (2,238) (101,362) Loss on early extinguishment of debt from discontinued operations - - (3,345) - Net gain on sale of properties from discontinued operations - - - 3,359 Income (loss) before gain on sale of properties 156,740 (216,207) 182,573 (153,262) Gain on sale of properties - - - 1,596 Net income (loss) 156,740 $ (216,207) $ 182,573 $ (151,666) $ Net income attributable to noncontrolling interest in consolidated subsidiary - (108) - (20,093) Net income (loss) attributable to Equity Commonwealth 156,740 $ (216,315) $ 182,573 $ (171,759) $ Preferred distributions (6,981) $ (11,151) $ (25,114) $ (33,453) $ Distribution on conversion of preferred shares - - (16,205) - Net income (loss) available for EQC common shareholders 149,759 $ (227,466) $ 141,254 $ (205,212) $ (1) CONDENSED CONSOLIDATED STATEMENTS OF OPERATIONS (amounts in thousands, except per share data) For the Three Months Ended For the Nine Months Ended We report rental income on a straight line basis over the terms of the respective leases; rental income and income from discontinued operations include non-cash straight line rent adjustments. Rental income and income from discontinued operations also include non-cash amortization of intangible lease assets and liabilities. 7 |

7
|
|
September 30, September 30, 2014 2013 2014 2013 Amounts available for EQC common shareholders: Income (loss) from continuing operations 149,542 $ (134,734) $ 138,617 $ (108,941) $ Income from discontinued operations 95 95 8,220 1,732 Gain (loss) on asset impairment from discontinued operations 122 (92,827) (2,238) (101,362) Loss on early extinguishment of debt from discontinued operations - - (3,345) - Net gain on sale of properties from discontinued operations - - - 3,359 Net income (loss) 149,759 $ (227,466) $ 141,254 $ (205,212) $ Weighted average common shares outstanding - basic (1) 128,880 118,328 123,736 110,353 Weighted average common shares outstanding - diluted (1) 131,243 118,328 123,736 110,353 Basic and diluted earnings per common share available for EQC common shareholders (1): Income (loss) from continuing operations 1.16 $ (1.14) $ 1.12 $ (0.99) $ Income (loss) from discontinued operations - $ (0.78) $ 0.02 $ (0.87) $ Net income (loss) 1.16 $ (1.92) $ 1.14 $ (1.86) $ Additional Income Statement Information General and administrative expenses / total revenues 21.91% 12.02% 14.85% 8.59% General and administrative expenses / total assets (at end of period) 0.77% 0.38% 1.56% 0.93% Continuing Operations: Straight line rent adjustments within rental income (2) 3,197 $ 6,536 $ 10,172 $ 26,280 $ Lease value amortization within rental income (2) (2,099) (2,443) (8,517) (7,865) Lease termination fees within rental income 1,534 412 3,272 1,723 Shareholder litigation and transition related expenses within general and administrative 27,777 14,224 36,582 23,399 General and administrative paid to RMR (3) Business management fee 9,334 9,183 28,558 31,232 Business management incentive fee 2,124 644 15,349 2,170 Discontinued Operations: Straight line rent adjustments (2) - $ (278) $ 226 $ (224) $ Lease value amortization (2) - 187 - 649 Lease termination fees - 72 126 332 (1) (2) (3) Amounts represent general and administrative expenses under our and SIR's business management agreement (amounts for SIR are only for the period when SIR was a consolidated subsidiary of EQC). We report rental income on a straight line basis over the terms of the respective leases; rental income and income from discontinued operations include non-cash straight line rent adjustments. Rental income and income from discontinued operations also include non-cash amortization of intangible lease assets and liabilities. CONDENSED CONSOLIDATED STATEMENTS OF OPERATIONS (continued) (amounts in thousands, except per share data) For the Three Months Ended For the Nine Months Ended As of September 30, 2014, we had 4,915 series D preferred shares outstanding that were convertible into 2,363 of our common shares, which for earnings per common share available for EQC common shareholders is dilutive for the three months ended September 30, 2014, and anti-dilutive for all other periods presented. 8 |

8
|
|
September 30, September 30, 2014 2013 2014 2013 Calculation of NOI and Cash Basis NOI (1): Rental income 174,216 $ 170,908 $ 518,663 $ 592,221 $ Tenant reimbursements and other income 42,379 43,293 130,386 146,780 Operating expenses (99,392) (102,350) (293,824) (310,585) NOI 117,203 111,851 355,225 428,416 Straight line rent adjustments (3,197) (6,536) (10,172) (26,280) Lease value amortization 2,099 2,443 8,517 7,865 Lease termination fees (1,534) (412) (3,272) (1,723) Cash Basis NOI 114,571 $ 107,346 $ 350,298 $ 408,278 $ Reconciliation of Cash Basis NOI to GAAP Operating Income (Loss) Cash Basis NOI 114,571 $ 107,346 $ 350,298 $ 408,278 $ Straight line rent adjustments 3,197 6,536 10,172 26,280 Lease value amortization (2,099) (2,443) (8,517) (7,865) Lease termination fees 1,534 412 3,272 1,723 NOI 117,203 111,851 355,225 428,416 Depreciation and amortization (57,213) (56,465) (168,693) (182,494) General and administrative (47,450) (25,742) (96,395) (63,454) Loss on asset impairment - (124,253) (17,922) (124,253) Acquisition related costs - 436 (5) (337) Operating Income (Loss) 12,540 (94,173) 72,210 57,878 (1) Excludes properties classified as discontinued operations for the period ended September 30, 2014. For the Nine Months Ended CALCULATION OF PROPERTY NET OPERATING INCOME (NOI) (amounts in thousands) For the Three Months Ended 9 |

9
|
|
September 30, September 30, 2014 2013 2014 2013 Net income (loss) 156,740 $ (216,207) $ 182,573 $ (151,666) $ Plus: Interest expense from continuing operations 35,245 39,236 111,079 134,452 Interest expense from discontinued operations 31 436 608 1,326 Income tax expense 703 785 2,166 2,527 Depreciation and amortization from continuing operations 57,213 56,465 168,693 182,494 Depreciation and amortization from discontinued operations - 3,842 - 11,725 EBITDA from equity investees 1,564 15,528 36,103 22,552 Less: Equity in earnings of investees (1,072) (10,492) (24,460) (14,913) EBITDA 250,424 $ (110,407) $ 476,762 $ 188,497 $ Plus: Loss on asset impairment from continuing operations - 124,253 17,922 124,253 (Gain) loss on asset impairment from discontinued operations (122) 92,827 2,238 101,362 Acquisition related costs from continuing operations - (436) 5 337 (Gain) loss on early extinguishment of debt from continuing operations (6,699) - (6,699) 60,027 Loss on early extinguishment of debt from discontinued operations - - 3,345 - Shareholder litigation and transition costs 27,777 14,224 36,582 23,399 Adjusted EBITDA from equity investees, net of EBITDA - 349 64 (1,133) Less: Gain on sale of properties - - - (1,596) Net gain on sale of properties from discontinued operations - - - (3,359) Gain on sale of equity investments (171,754) - (171,721) (66,293) Gain on issuance of shares by an equity investee - - (17,020) - Adjusted EBITDA 99,626 $ 120,810 $ 341,478 $ 425,494 $ For the Nine Months Ended CALCULATION OF EBITDA AND ADJUSTED EBITDA (amounts in thousands) For the Three Months Ended 10 |

10
|
|
CALCULATION OF FUNDS FROM OPERATIONS (FFO) AND NORMALIZED FFO (amounts in thousands, except per share data) For the Three Months Ended For the Nine Months Ended September 30, September 30, 2014 2013 2014 2013 Calculation of FFO Net income (loss) attributable to Equity Commonwealth $ 156,740 $ (216,315) $ 182,573 $ (171,759) Plus: Depreciation and amortization from continuing operations 57,213 56,465 168,693 182,494 Depreciation and amortization from discontinued operations - 3,842 - 11,725 Loss on asset impairment from continuing operations - 124,253 17,922 124,253 (Gain) loss on asset impairment from discontinued operations (122) 92,827 2,238 101,362 FFO from equity investees 1,456 14,095 33,007 18,996 Net income attributable to noncontrolling interest - 108 - 20,093 Less: FFO attributable to noncontrolling interest - (142) - (26,270) Gain on sale of properties - - - (1,596) Net gain on sale of properties from discontinued operations - - - (3,359) Equity in earnings of investees (1,072) (10,492) (24,460) (14,913) FFO attributable to Equity Commonwealth 214,215 64,641 379,973 241,026 Less: Preferred distributions (6,981) (11,151) (25,114) (33,453) FFO available for EQC common shareholders $ 207,234 $ 53,490 $ 354,859 $ 207,573 Calculation of Normalized FFO FFO available for EQC common shareholders $ 207,234 $ 53,490 $ 354,859 $ 207,573 Recurring adjustments: Lease value amortization from continuing operations 2,099 2,443 8,517 7,865 Lease value amortization from discontinued operations - (187) - (649) Straight line rent from continuing operations (3,197) (6,536) (10,172) (26,280) Straight line rent from discontinued operations - 278 (226) 224 (Gain) loss on early extinguishment of debt from continuing operations (6,699) - (6,699) 60,027 Loss on early extinguishment of debt from discontinued operations - - 3,345 -Minimum cash rent from direct financing lease (1) 2,032 2,031 6,096 6,093 Gain on sale of equity investments (171,754) - (171,721) (66,293) Gain on issuance of shares by an equity investee - - (17,020) -Interest earned from direct financing lease (186) (272) (623) (877) Normalized FFO from equity investees, net of FFO - (1,349) (3,353) (1,445) Normalized FFO from noncontrolling interest, net of FFO - 20 - 1,987 Other items which affect comparability: Shareholder litigation and transition related expenses 27,777 14,224 36,582 23,399 Acquisition related costs from continuing operations - (436) 5 337 Normalized FFO available for EQC common shareholders $ 57,306 $ 63,706 $ 199,590 $ 211,961 Weighted average common shares outstanding -- basic 128,880 118,328 123,736 110,353 Weighted average common shares outstanding -- diluted (2) 131,243 118,328 123,736 110,353 FFO available for EQC common shareholders per share -- basic $ 1.61 $ 0.45 $ 2.87 $ 1.88 FFO available for EQC common shareholders per share -- diluted (2) $ 1.59 $ 0.45 $ 2.87 $ 1.88 Normalized FFO available for EQC common shareholders per share -- basic & diluted (2) $ 0.44 $ 0.54 $ 1.61 $ 1.92 (1) Contractual cash payments from one tenant at Arizona Center for 2014 is approximately $8,098 and will decrease to approximately $226 of rent in 2016, excluding variable management fees and reimbursements. Our calculation of Normalized FFO reflects the cash payments received from this tenant. The terms of this tenant's lease require us to classify the lease as a direct financing (or capital) lease, and as such, the revenue recognized on a GAAP basis within our condensed consolidated statements of operations is de minimis. This direct financing lease has an expiration date in 2045. (2) As of September 30, 2014, we had 4,915 series D preferred shares outstanding that were convertible into 2,363 of our common shares, which for FFO per common share, were dilutive for the three months ended September 30, 2014 and anti-dilutive for all other periods presented. The series D preferred shares outstanding were anti-dilutive for all periods presented with respect to Normalized FFO. |

11
|
|
DEBT SUMMARY As of September 30, 2014 (dollars in thousands) Interest Principal Maturity Due at Years to Rate Balance Date Maturity Maturity Unsecured Debt: Unsecured Floating Rate Debt: Revolving credit facility (LIBOR + 150 bps) (1) 1.654% $ - 10/19/2015 $ - 1.1 Term loan (LIBOR + 185 bps) (2) 2.004% 500,000 12/15/2016 500,000 2.2 Total / weighted average unsecured floating rate debt 2.004% $ 500,000 $ 500,000 2.2 Unsecured Fixed Rate Debt: 5.75% Senior Unsecured Notes due 2015 5.750% $ 138,773 11/1/2015 $ 138,773 1.1 6.25% Senior Unsecured Notes due 2016 6.250% 139,104 8/15/2016 139,104 1.9 6.25% Senior Unsecured Notes due 2017 6.250% 250,000 6/15/2017 250,000 2.7 6.65% Senior Unsecured Notes due 2018 6.650% 250,000 1/15/2018 250,000 3.3 7.50% Senior Unsecured Notes due 2019 (3) 7.500% 125,000 11/15/2019 125,000 5.1 5.875% Senior Unsecured Notes due 2020 5.875% 250,000 9/15/2020 250,000 6.0 5.75% Senior Unsecured Notes due 2042 5.750% 175,000 8/1/2042 175,000 27.9 Total / weighted average unsecured fixed rate debt 6.254% $ 1,327,877 $ 1,327,877 6.7 Secured Fixed Rate Debt: 6200 Glenn Carlson Drive (4) 5.990% $ 7,762 2/1/2015 $ 7,580 0.3 111 Monument Circle 5.235% 116,000 3/1/2016 116,000 1.4 225 Water Street (5) 6.030% 40,059 5/11/2016 38,994 1.6 111 East Wacker Drive 6.290% 143,148 7/11/2016 139,478 1.8 2501 20th Place South 7.360% 10,405 8/1/2016 9,333 1.8 Parkshore Plaza 5.670% 41,275 5/1/2017 41,275 2.6 1735 Market Street (6) 5.660% 171,798 12/2/2019 160,710 5.2 206 East 9th Street 5.690% 28,075 1/5/2021 24,836 6.3 1320 Main Street 5.300% 39,138 6/1/2021 34,113 6.7 33 Stiles Lane 6.750% 3,215 3/1/2022 - 7.4 97 Newberry Road 5.710% 6,927 3/1/2026 - 11.4 Total / weighted average secured fixed rate debt 5.770% $ 607,802 $ 572,319 3.4 Total / weighted average 5.261% $ 2,435,679 (7) $ 2,400,196 5.0 (1) Represents amounts outstanding on EQC's $750,000 revolving credit facility as of September 30, 2014. Interest rate presented is as of September 30, 2014, which equals LIBOR plus 1.5%. The spread over LIBOR varies depending upon EQC's credit rating. We have begun discussions with our lenders to recast the current $750,000 unsecured revolving credit facility that matures on October 19, 2015. (2) Represents amounts outstanding on EQC's term loan as of September 30, 2014. The interest rate presented is as of September 30, 2014, equals LIBOR plus 1.85%. The spread over LIBOR varies depending upon EQC's credit rating. We have begin discussions with our lenders to recast the current $500,000 unsecured term loan that matures on December 15, 2016. (3) On October 1, 2014 we issued a notice to the trustee to redeem at par $125.0 million of our 7.50% unsecured senior notes due 2019. The notes will be redeemed on November 17, 2014. (4) On October 31, 2014 we repaid the remaining balance of the mortgage loan secured by 6200 Glenn Carlson Drive at par. (5) On October 10, 2014, we were notified by the lender that our decision to cease making loan servicing payments on the mortgage loan secured by 225 Water Street created an event of default effective July 11, 2014, and the lender has exercised its option to accelerate the maturity of the unpaid balance of $40,059. (6) Interest is payable at a rate equal to LIBOR plus 2.625% but has been fixed by a cash flow hedge, which sets the rate at approximately 5.66% until December 1, 2016. (7) Total debt outstanding as of September 30, 2014, including net unamortized premiums and discounts, was $2,442,942. |

12
|
|
DEBT MATURITY SCHEDULE (dollars in thousands) Scheduled Principal Payments During Period Unsecured Unsecured Secured Weighted Floating Fixed Fixed Rate Average Interest Rate (1) Year Rate Debt Rate Debt Debt Total 2014 $ - $ - $ 1,734 $ 1,734 6.1% 2015 - 138,773 14,608 153,381 5.8% 2016 500,000 (2) 139,104 309,604 948,708 3.9% 2017 - 250,000 45,592 (3) 295,592 6.2% 2018 - 250,000 4,614 254,614 6.6% 2019 - 125,000 165,422 290,422 6.5% 2020 - 250,000 2,523 252,523 5.9% 2021 - - 60,470 60,470 5.5% 2022 - - 799 799 5.9% 2023 - - 702 702 5.7% Thereafter - 175,000 1,734 176,734 5.7% Total $ 500,000 $ 1,327,877 $ 607,802 $ 2,435,679 (4) 5.3% Percent 20.5% 54.5% 25.0% 100.0% (1) Based on current contractual interest rates. (2) Represents amounts outstanding under EQC's term loan which matures on December 15, 2016. We have begin discussions with our lenders to recast the current $500,000 unsecured term loan, as well as the undrawn current $750,000 unsecured revolving credit facility that matures on October 19, 2015. (3) On October 10, 2014, we were notified by the lender that our decision to cease making loan servicing payments on the mortgage loan secured by 225 Water Street created an event of default effective July 11, 2014, and the lender has exercised its option to accelerate the maturity of the unpaid balance of $40,059. (4) Total debt outstanding as of September 30, 2014, including net unamortized premiums and discounts, was $2,442,942. |

13
|
|
9/30/2014 6/30/2014 3/31/2014 12/31/2013 9/30/2013 Leverage Ratios Total debt (1) / total assets 39.6% 45.3% 45.6% 45.5% 46.0% Total debt (1) / gross book value of real estate assets (2) 38.5% 47.0% 45.5% 46.0% 46.2% Total debt (1) / gross book value of real estate assets, plus book value equity investments (2) 38.5% 43.3% 42.2% 42.7% 43.0% Total debt (1) / total book capitalization 41.2% 47.0% 47.3% 47.4% 47.8% Total debt (1) / total market capitalization 39.7% 44.0% 44.4% 47.7% 49.8% Total debt (1) / annualized adjusted EBITDA 6.1x 6.0x 6.4x 6.0x 6.5x Net debt (3) / annualized adjusted EBITDA 4.6x 5.1x 6.1x 5.5x 6.1x Secured debt / total assets 10.0% 13.6% 13.9% 14.1% 13.9% Variable rate debt / total debt (1) 20.5% 24.6% 24.4% 24.3% 23.4% Variable rate debt / total assets 8.1% 11.1% 11.1% 11.1% 10.8% Coverage Ratios Adjusted EBITDA (4) / interest expense 2.8x 3.3x 3.0x 3.2x 3.0x Adjusted EBITDA (4) / interest expense + preferred distributions 2.4x 2.8x 2.4x 2.5x 2.4x Public Debt Covenants Debt / adjusted total assets (5) (maximum 60%) 33.4% 38.9% 38.8% 38.9% 38.4% Secured debt / adjusted total assets (5) (maximum 40%) 8.5% 11.6% 11.8% 12.0% 11.6% Consolidated income available for debt service (6)/ debt service (minimum 1.5x) 3.4x 3.1x 3.2x 3.3x 3.2x Total unencumbered assets (5) / unsecured debt (minimum 150% / 200%) 348.7% 302.8% 304.4% 303.9% 305.9% (1) (2) (3) (4) (5) (6) Adjusted total assets and total unencumbered assets includes original cost of real estate assets calculated in accordance with GAAP and excludes depreciation and amortization, accounts receivable, other intangible assets and impairment write downs, if any. Consolidated income available for debt service is earnings from operations excluding interest expense, depreciation and amortization, taxes, loss on asset impairment and gains and losses on acquisitions and sales of assets and early extinguishment of debt, determined together with debt service on a pro forma basis for the four consecutive fiscal quarters most recently ended. LEVERAGE RATIOS, COVERAGE RATIOS AND PUBLIC DEBT COVENANTS As of and for the Three Months Ended Total debt includes net unamortized premiums and discounts and mortgage debt totaling $19,688, $20,018 and $20,127 as of March 31, 2014, December 31, 2013, and September 30, 2013, respectively, related to properties held for sale. Total debt excludes the debt of our unconsolidated equity investees. Gross book value of real estate assets is real estate properties, at cost, plus acquisition costs, before purchase price allocations and after impairment write downs, if any. Non-GAAP financial measure which is defined in the "Definitions" section of this document. Please refer to the calculation in this document which reconciles the differences between the non-GAAP financial measure and the most directly comparable GAAP financial measure. (dollars in thousands) Net debt is calculated as Total debt minus cash and cash equivalents. 14 |

14
|
|
9/30/2014 6/30/2014 3/31/2014 12/31/2013 9/30/2013 Tenant improvements 10,719 $ 11,687 $ 19,843 $ 30,563 $ 15,405 $ Leasing costs 15,838 5,661 5,075 11,810 14,382 Building improvements 5,897 4,659 4,244 8,137 8,676 Development, redevelopment and other activities 2,273 2,804 3,743 8,796 3,994 Total capital expenditures 34,727 24,811 32,905 59,306 42,457 Average square feet during period (1) 42,919 44,309 45,698 48,650 51,667 Building improvements per average sq. ft. during period 0.14 $ 0.11 $ 0.09 $ 0.17 $ 0.17 $ (1) Average square feet during each period includes properties held for sale at the end of each period. As of September 30, 2014, EQC did not have any properties classified as held for sale. Average square feet was adjusted for the three months ended September 30, 2013 to exclude 25,392 square feet attributable to SIR's properties because SIR ceased to be a consolidated subsidiary of EQC as of July 2, 2013. For the Three Months Ended CAPITAL EXPENDITURES SUMMARY (dollars and square feet in thousands, except per square foot data) 15 |

15
|
|
Acquisitions: Dispositions: Annualized Date No. of Property Square % Net Book Rental Mortgage Sold Property City State Bldgs Location Feet Leased (1) Value (2) Revenue (1) Debt (3) 1. 6/27/2014 11201 N. Tatum Boulevard Phoenix AZ 1 Suburban 109,961 36.8% 9,339 $ 767 $ - $ 2. 6/27/2014 Dominguez Technology Center Carson CA 5 Suburban 402,000 100.0% 39,678 5,906 - 3. 6/27/2014 Madrone Business Park Morgan Hill CA 3 Suburban 308,665 70.0% 37,161 4,807 11,226 4. 6/27/2014 8555 Aero Drive San Diego CA 1 Suburban 48,561 65.6% 2,587 562 - 5. 6/27/2014 Fountainview Business Park San Diego CA 3 Suburban 89,976 81.6% 7,571 1,514 - 6. 6/27/2014 400 Princeton Boulevard Adairsville GA 1 Suburban 292,000 100.0% 8,068 876 - 7. 6/27/2014 Corporate Square Atlanta GA 5 Suburban 246,225 84.9% 11,585 3,359 - 8. 6/27/2014 1000 Holcomb Woods Parkway Roswell GA 8 Suburban 244,379 70.4% 10,411 1,952 - 9. 6/27/2014 500 4th Street & Roma Albuquerque NM 2 CBD 229,123 67.8% 15,114 2,722 - 10. 6/27/2014 Stephenson Center Columbia SC 3 Suburban 104,300 75.7% 4,681 1,233 - 11. 6/27/2014 Synergy Business Park Columbia SC 4 Suburban 311,382 71.0% 17,750 3,392 - 12. 6/27/2014 6060 Primacy Parkway Memphis TN 1 Suburban 130,574 56.4% 6,164 1,273 - 13. 6/27/2014 Stafford Commerce Center Stafford VA 4 Suburban 149,023 25.4% 16,107 960 4,331 14. 6/27/2014 Stafford Commerce Park Stafford VA 2 Suburban 117,929 34.7% 13,332 1,041 4,203 43 2,784,098 73.4% 199,548 $ 30,364 $ 19,760 $ (1) Percent leased and annualized rental revenue is as of March 31, 2014. (2) Represents the carrying value of real estate properties, after depreciation and amortization, purchase price allocations and impairment write downs, if any. (3) In connection with the mortgage debt repayments, EQC paid $2,270 of yield maintenance for Madrone, CA and $547 in defeasance costs for Stafford, VA. ACQUISITIONS AND DISPOSITIONS INFORMATION SINCE JANUARY 1, 2014 (dollars in thousands) There were no acquisitions during the period. On June 27, 2014, EQC sold its interest in 14 properties (43 buildings) for an aggregate gross sales price of $215,900, excluding mortgage debt repayments and closing costs. 16 |

16
|
|
CBD Suburban Properties Properties Total Number of properties 40 116 156 Percent of total 25.6% 74.4% 100.0% Total square feet 21,892 21,027 42,919 Percent of total 51.0% 49.0% 100.0% Leased square feet 18,508 18,369 36,877 Percent leased (2) 84.5% 87.4% 85.9% Total revenues 137,475 $ 79,131 $ 216,606 $ Percent of total 63.5% 36.5% 100.0% NOI (3) 71,596 $ 45,615 $ 117,211 $ Percent of total 61.1% 38.9% 100.0% Cash Basis NOI (3) 68,844 $ 45,735 $ 114,579 $ Percent of total 60.1% 39.9% 100.0% (1) (2) (3) As of and for the Three Months Ended September 30, 2014 SAME PROPERTY SUMMARY BY PROPERTY LOCATION (1) (square feet and dollars in thousands) Includes properties continuously owned from July 1, 2013 through September 30, 2014, and excludes amounts related to the settlement of outstanding assets and liabilities of previously-disposed properties that are reflected in our consolidated results. Non-GAAP financial measure which is defined in the "Definitions" section of this document. Please refer to the calculation in this document which reconciles the differences between the non-GAAP financial measure and the most directly comparable GAAP financial measure. Percent leased includes (i) space being fitted out for occupancy pursuant to existing leases and (ii) space which is leased but is not occupied or is being offered for sublease by tenants. 17 |

17
|
|
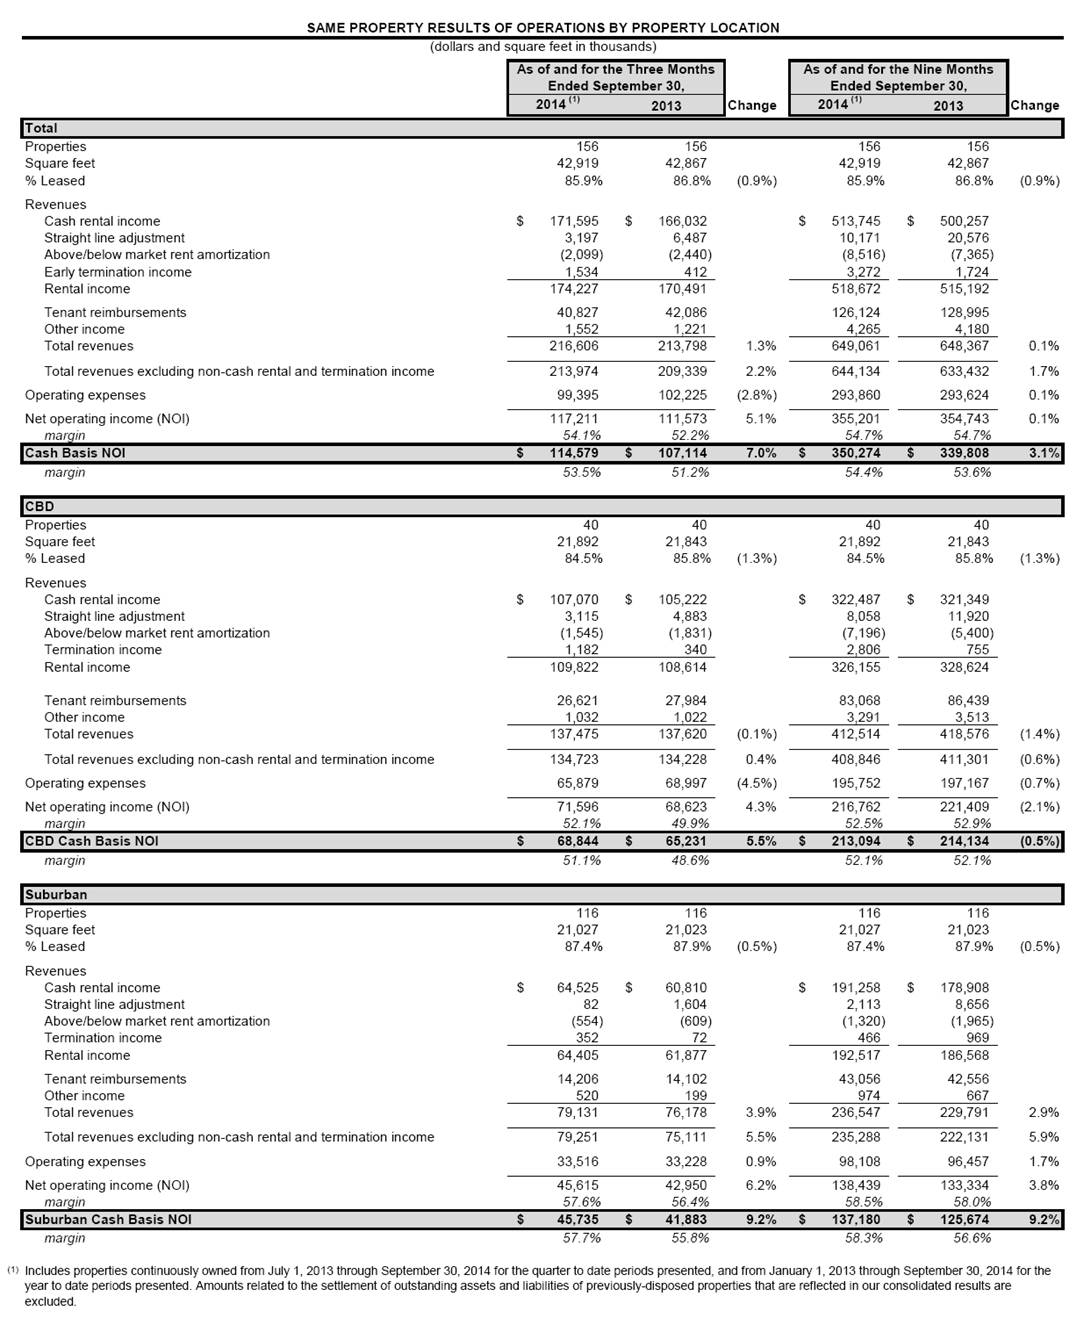
SAME PROPERTY RESULTS OF OPERATIONS BY PROPERTY LOCATION (dollars and square feet in thousands) As of and for the Three Months As of and for the Nine Months Ended September 30, Ended September 30, 2014 (1) 2014 (1) 2013 Change 2013 Change Total Properties 156 156 156 156 Square feet 42,919 42,867 42,919 42,867 % Leased 85.9% 86.8% (0.9%) 85.9% 86.8% (0.9%) Revenues Cash rental income $ 171,595 $ 166,032 $ 513,745 $ 500,257 Straight line adjustment 3,197 6,487 10,171 20,576 Above/below market rent amortization (2,099) (2,440) (8,516) (7,365) Early termination income 1,534 412 3,272 1,724 Rental income 174,227 170,491 518,672 515,192 Tenant reimbursements 40,827 42,086 126,124 128,995 Other income 1,552 1,221 4,265 4,180 Total revenues 216,606 213,798 1.3% 649,061 648,367 0.1% Total revenues excluding non-cash rental and termination income 213,974 209,339 2.2% 644,134 633,432 1.7% Operating expenses 99,395 102,225 (2.8%) 293,860 293,624 0.1% Net operating income (NOI) 117,211 111,573 5.1% 355,201 354,743 0.1% margin 54.1% 52.2% 54.7% 54.7% Cash Basis NOI $ 114,579 $ 107,114 7.0% $ 350,274 $ 339,808 3.1% margin 53.5% 51.2% 54.4% 53.6% CBD Properties 40 40 40 40 Square feet 21,892 21,843 21,892 21,843 % Leased 84.5% 85.8% (1.3%) 84.5% 85.8% (1.3%) Revenues Cash rental income $ 107,070 $ 105,222 $ 322,487 $ 321,349 Straight line adjustment 3,115 4,883 8,058 11,920 Above/below market rent amortization (1,545) (1,831) (7,196) (5,400) Termination income 1,182 340 2,806 755 Rental income 109,822 108,614 326,155 328,624 Tenant reimbursements 26,621 27,984 83,068 86,439 Other income 1,032 1,022 3,291 3,513 Total revenues 137,475 137,620 (0.1%) 412,514 418,576 (1.4%) Total revenues excluding non-cash rental and termination income 134,723 134,228 0.4% 408,846 411,301 (0.6%) Operating expenses 65,879 68,997 (4.5%) 195,752 197,167 (0.7%) Net operating income (NOI) 71,596 68,623 4.3% 216,762 221,409 (2.1%) margin 52.1% 49.9% 52.5% 52.9% CBD Cash Basis NOI $ 68,844 $ 65,231 5.5% $ 213,094 $ 214,134 (0.5%) margin 51.1% 48.6% 52.1% 52.1% Suburban Properties 116 116 116 116 Square feet 21,027 21,023 21,027 21,023 % Leased 87.4% 87.9% (0.5%) 87.4% 87.9% (0.5%) Revenues Cash rental income $ 64,525 $ 60,810 $ 191,258 $ 178,908 Straight line adjustment 82 1,604 2,113 8,656 Above/below market rent amortization (554) (609) (1,320) (1,965) Termination income 352 72 466 969 Rental income 64,405 61,877 192,517 186,568 Tenant reimbursements 14,206 14,102 43,056 42,556 Other income 520 199 974 667 Total revenues 79,131 76,178 3.9% 236,547 229,791 2.9% Total revenues excluding non-cash rental and termination income 79,251 75,111 5.5% 235,288 222,131 5.9% Operating expenses 33,516 33,228 0.9% 98,108 96,457 1.7% Net operating income (NOI) 45,615 42,950 6.2% 138,439 133,334 3.8% margin 57.6% 56.4% 58.5% 58.0% Suburban Cash Basis NOI $ 45,735 $ 41,883 9.2% $ 137,180 $ 125,674 9.2% margin 57.7% 55.8% 58.3% 56.6% (1) Includes properties continuously owned from July 1, 2013 through September 30, 2014 for the quarter to date periods presented, and from January 1, 2013 through September 30, 2014 for the year to date periods presented. Amounts related to the settlement of outstanding assets and liabilities of previously-disposed properties that are reflected in our consolidated results are excluded. |
18
|
|
TOP 30 PROPERTIES BY ANNUALIZED RENTAL REVENUE As of September 30, 2014 (1) (sorted by annualized rental revenue, dollars in thousands) Weighted Average Year Annualized Built or No. of Property Square Leased Rental Undepreciated Net Book Date Substantially Property City State Buildings Location Feet Occupancy Revenue (2) Book Value (3) Value (4) Acquired Renovated (5) 1. Illinois Center Chicago IL 2 CBD 2,090,162 73.2% 46,453 332,360 311,267 5/11/2011;1/9/2012 2001 2. 600 West Chicago Avenue Chicago IL 2 CBD 1,511,849 91.9% 44,959 354,258 328,949 8/10/2011 2001 3. 1735 Market Street Philadelphia PA 1 CBD 1,290,678 91.8% 37,012 297,429 189,243 6/30/1998 1990 4. 1500 Market Street Philadelphia PA 1 CBD 1,773,967 79.5% 36,113 280,661 214,016 10/10/2002 1974 5. 111 Monument Circle Indianapolis IN 2 CBD 1,063,885 82.7% 24,183 172,056 164,369 10/22/2012 1990 6. 111 River Street Hoboken NJ 1 CBD 566,215 94.3% 22,496 134,469 117,109 8/11/2009 2002 7. 1225 Seventeenth Street Denver CO 1 CBD 672,465 90.0% 20,866 144,818 128,405 6/24/2009 1982 8. 185 Asylum Street Hartford CT 1 CBD 868,395 98.6% 20,825 77,609 73,769 3/30/2012 2010 9. 701 Poydras Street New Orleans LA 1 CBD 1,256,971 95.6% 20,471 94,645 88,034 8/29/2011 2010 10. 310-320 Pitt Street Sydney Australia 1 CBD 313,865 100.0% 17,956 146,543 137,478 12/21/2010 1989 11. 333 108th Avenue NE Bellevue WA 1 CBD 416,503 100.0% 17,862 152,536 135,015 11/12/2009 2008 12. 1600 Market Street Philadelphia PA 1 CBD 825,968 83.4% 17,758 131,447 80,949 3/30/1998 1983 13. 6600 North Military Trail Boca Raton FL 3 Suburban 639,830 100.0% 17,283 145,690 133,522 1/11/2011 2008 14. North Point Office Complex Cleveland OH 2 CBD 873,335 79.3% 15,981 121,885 103,909 2/12/2008 1988 15. Arizona Center (6) Phoenix AZ 4 CBD 1,070,724 93.8% 15,870 97,014 90,640 3/4/2011 1992 16. 8750 Bryn Mawr Avenue Chicago IL 2 Suburban 631,518 92.1% 15,691 90,713 82,233 10/28/2010 2005 17. Foster Plaza Pittsburgh PA 8 Suburban 727,365 90.0% 13,003 72,637 56,760 9/16/2005 1993 18. 100 East Wisconsin Avenue Milwaukee WI 1 CBD 435,067 94.5% 11,827 80,847 72,575 8/11/2010 1989 19. Research Park Austin TX 4 Suburban 1,110,007 98.0% 11,507 90,596 64,437 10/7/1998 1976 20. 111 Market Place Baltimore MD 1 CBD 540,854 99.2% 11,500 75,948 54,668 1/28/2003 1990 21. 101-115 W. Washington Street Indianapolis IN 1 CBD 634,058 91.0% 11,470 87,630 67,799 5/10/2005 1977 22. Bridgepoint Parkway Austin TX 5 Suburban 440,007 94.6% 10,792 87,869 53,745 12/5/1997 1995 23. East Eisenhower Parkway Ann Arbor MI 2 Suburban 410,464 92.8% 10,363 55,051 49,848 6/15/2010 2006 24. 420 20th Street North Birmingham AL 1 CBD 514,893 77.9% 9,722 55,640 51,297 7/29/2011 2006 25. 109 Brookline Avenue Boston MA 1 CBD 285,556 94.3% 9,547 45,035 28,133 9/28/1995 1915 26. 111 East Kilbourn Avenue Milwaukee WI 1 CBD 373,669 95.9% 9,062 54,966 46,456 6/12/2008 1988 27. Woodcliff Drive Fairport NY 6 Suburban 516,760 79.8% 8,516 46,798 43,567 3/14/2006 1995 28. Inverness Center Birmingham AL 4 Suburban 475,882 88.1% 8,284 51,460 46,596 12/9/2010 1981 29. 1601 Dry Creek Drive Longmont CO 1 Suburban 552,865 97.0% 8,107 32,282 24,402 10/26/2004 1982 30. 5073, 5075, & 5085 S. Syracuse Denver CO 1 Suburban 248,493 100.0% 8,035 63,610 57,107 4/16/2010 2007 Subtotal (30 properties) 63 23,132,270 89.2% 533,514 3,674,502 3,096,297 All other properties (126 properties) 199 19,786,565 82.1% 258,754 2,211,862 1,801,744 Total (156 properties) 262 42,918,835 85.9% $ 792,268 $ 5,886,364 $ 4,898,041 Q3 2014 Q3 2014 Cash Basis % of Cash NOI (7) % of NOI NOI (7) Basis NOI Subtotal (30 properties) $ 78,982 67.4% $ 75,431 65.8% All other properties (126 properties) 38,221 32.6% 39,140 34.2% Total (156 properties) $ 117,203 100.0% $ 114,571 100.0% (1) Excludes properties classified as discontinued operations for the period ended September 30, 2014. (2) Annualized rental revenue is annualized contractual rents from our tenants pursuant to existing leases as of September 30, 2014, plus straight line rent adjustments and estimated recurring expense reimbursements; includes some triple net lease rents and excludes lease value amortization. (3) Represents the carrying value of real estate properties, after purchase price allocations, impairment write downs and currency adjustments, if any. (4) Represents the carrying value of real estate properties, after depreciation and amortization, purchase price allocations, impairment write downs and currency adjustments, if any. (5) Weighted based on square feet. (6) Contractual cash payments from one tenant at Arizona Center for 2014 is approximately $8,098 and will decrease to approximately $226 of rent in 2016, excluding variable management fees and reimbursements. Our calculation of Normalized FFO reflects the cash payments received from this tenant. The terms of this tenant's lease require us to classify the lease as a direct financing (or capital) lease, and as such, the revenue recognized on a GAAP basis within our condensed consolidated statements of operations is de minimis. This direct financing lease has an expiration date in 2045. (7) Non-GAAP financial measure which is defined in the "Definitions" section of this document. Please refer to the calculation in this document which reconciles the differences between the non-GAAP financial measure and the most directly comparable GAAP financial measure. |

19
|
|
9/30/2014 6/30/2014 3/31/2014 12/31/2013 9/30/2013 Properties 156 156 156 156 156 Total square feet (2) 42,919 42,920 42,913 42,915 42,867 Percentage leased (3) 85.9% 86.7% 86.5% 87.0% 86.8% Renewal Leases Square feet 792 1,204 459 1,215 1,289 Lease Term (years) 12.4 6.0 5.5 7.2 9.0 Percent change in Cash Rent (4) (2.8%) (2.2%) (3.9%) (3.1%) (6.3%) Percent change in GAAP Rent (4) 0.4% 3.7% (1.2%) 1.9% (0.9%) Total TI & LC per square foot (5) 37.39 $ 9.37 $ 10.98 $ 15.06 $ 25.99 $ Total TI & LC per sq. ft. per year of lease term (5) 3.02 $ 1.56 $ 2.00 $ 2.09 $ 2.89 $ New Leases Square feet 317 358 214 255 401 Lease Term (years) 7.0 5.9 8.1 6.1 6.5 Percent change in Cash Rent (4) (2.9%) (8.9%) 6.2% 2.9% (2.6%) Percent change in GAAP Rent (4) (1.6%) (3.6%) 12.7% 9.7% 1.0% Total TI & LC per square foot (5) 13.83 $ 29.89 $ 27.78 $ 22.74 $ 27.83 $ Total TI & LC per sq. ft. per year of lease term (5) 1.98 $ 5.07 $ 3.43 $ 3.73 $ 4.28 $ Total Leases Square feet 1,109 1,562 673 1,470 1,690 Lease Term (years) 10.8 6.0 6.3 7.0 8.4 Percent change in Cash Rent (4) (2.8%) (4.4%) (0.8%) (1.9%) (5.4%) Percent change in GAAP Rent (4) 0.1% 1.3% 3.0% 3.5% (0.4%) Total TI & LC per square foot (5) 30.66 $ 17.86 $ 24.91 $ 17.24 $ 28.91 $ Total TI & LC per sq. ft. per year of lease term (5) 2.84 $ 2.98 $ 3.95 $ 2.46 $ 3.44 $ (1) (2) (3) (4) (5) LEASING SUMMARY (dollars and square feet in thousands, except per square foot data) Excludes SIR's properties and properties classified as discontinued operations for the period ended September 30, 2014. Sq. ft. measurements are subject to modest changes when space is re-measured or re-configured for tenants. Percent leased includes (i) space being fitted out for occupancy pursuant to existing leases and (ii) space which is leased but is not occupied or is being offered for sublease by tenants. Percent change in GAAP and cash rent is a comparison of current rent (including tenant expense reimbursements, if any, and excluding any initial period free rent), to the rent (including tenant expense reimbursements, if any) last received for the same space during EQC's ownership on a GAAP and cash basis, respectively. Includes commitments made for leasing expenditures and concessions, such as tenant improvements and leasing commissions. The above leasing summary is based on leases executed during the periods indicated. As of and for the Three Months Ended (1) 20 3.7 2.0 14.07 36 16.32 2.45 2.8 16.39 3.2 (2.1%) 26.73 22 |
20
|
|
CBD Properties Suburban Properties Total Properties 40 116 156 Total square feet (2) 21,892 21,027 42,919 Percentage leased (3) 84.5% 87.4% 85.9% Renewal Leases Square feet 556 236 792 Lease Term (years) 14.7 6.8 12.4 Percentage change in Cash Rent (4) (4.2%) 8.2% (2.8%) Percentage change in GAAP Rent (4) (0.7%) 8.5% 0.4% Total TI & LC per square foot (5) 50.50 $ 6.52 $ 37.39 $ Total TI & LC per sq. ft. per year of lease term (5) 3.44 $ 0.96 $ 3.02 $ New Leases Square feet 90 227 317 Lease Term (years) 6.9 7.0 7.0 Percentage change in Cash Rent (4) (8.6%) 3.1% (2.9%) Percentage change in GAAP Rent (4) (5.6%) 2.8% (1.6%) Total TI & LC per square foot (5) 28.98 $ 7.77 $ 13.83 $ Total TI & LC per sq. ft. per year of lease term (5) 4.20 $ 1.11 $ 1.98 $ Total Leases Square feet 646 463 1,109 Lease Term (years) 13.6 6.9 10.8 Percentage change in Cash Rent (4) (4.7%) 5.9% (2.8%) Percentage change in GAAP Rent (4) (1.2%) 5.8% 0.1% Total TI & LC per square foot (5) 47.50 $ 7.13 $ 30.66 $ Total TI & LC per sq. ft. per year of lease term (5) 3.49 $ 1.03 $ 2.84 $ (1) (2) (3) (4) (5) The above leasing summary is based on leases executed during the periods indicated. As of and for the Three Months Ended (1) LEASING SUMMARY BY PROPERTY LOCATION (dollars and square feet in thousands, except per square foot data) Percent leased includes (i) space being fitted out for occupancy pursuant to existing leases and (ii) space which is leased but is not occupied or is being offered for sublease by tenants. Square feet measurements are subject to modest changes when space is re-measured or re-configured for tenants. Excludes SIR's properties and properties classified as discontinued operations for the period ended September 30, 2014. Percent change in GAAP and cash rent is a comparison of current rent (including tenant expense reimbursements, if any, and excluding any initial period free rent), to the rent (including tenant expense reimbursements, if any) last received for the same space during EQC's ownership on a GAAP and cash basis, respectively. Includes commitments made for leasing expenditures and concessions, such as tenant improvements and leasing commissions. 21 |

21
|
|
Total Sq. Ft. As of 9/30/2014 Renewals New Total CBD Properties 21,892 556 90 646 Suburban Properties 21,027 236 227 463 Total 42,919 792 317 1,109 Renewals Total % Leased (2) (3) Expired and New Acquisitions Total % Leased (2) CBD Properties 18,688 85.4% (826) 646 - 18,508 84.5% Suburban Properties 18,510 88.0% (604) 463 - 18,369 87.4% Total 37,198 86.7% (1,430) 1,109 - 36,877 85.9% (1) (2) (3) OCCUPANCY AND LEASING ANALYSIS BY PROPERTY LOCATION (1) (square feet in thousands) Property Location Three Months Ended September 30, 2014 Leases Executed During Property Location Square Footage Leased Percent leased includes (i) space being fitted out for occupancy pursuant to existing leases and (ii) space which is leased but is not occupied or is being offered for sublease by tenants. Excludes effects of space remeasurements during the period. Excludes properties classified as discontinued operations for the period ended September 30, 2014. June 30, 2014 September 30, 2014 22 |

22
|
|
% of Weighted Average Square % of Total Annualized Rental Remaining Feet (2) Sq. Ft. (2) Revenue (3) Lease Term 1. Telstra Corporation Limited 311 0.8% 2.2% 5.7 2. Office Depot, Inc. 651 1.8% 2.2% 9.0 3. John Wiley & Sons, Inc. 386 1.0% 2.0% 18.8 4. Expedia, Inc. 371 1.0% 2.0% 4.1 5. PNC Financial Services Group 587 1.6% 1.8% 6.4 6. U.S. Government 463 1.3% 1.6% 5.4 7. Royal Dutch Shell plc 700 1.9% 1.5% 10.1 8. J.P. Morgan Chase & Co. 388 1.1% 1.4% 9.6 9. The Bank of New York Mellon Corp. 395 1.1% 1.4% 3.2 10. Flextronics International Ltd. 1,051 2.9% 1.4% 5.3 11. United Healthcare Services Inc. 479 1.3% 1.3% 8.2 12. Bankers Life and Casualty Company 349 0.9% 1.2% 6.0 13. Wells Fargo & Co 350 0.9% 1.2% 3.4 14. Jones Day 343 0.9% 1.1% 11.8 15. Level 3 Communications, Inc. 219 0.6% 1.1% 5.6 16. Towers Watson & Co. 348 0.9% 1.1% 4.6 17. Ballard Spahr LLP 218 0.6% 1.1% 15.4 18. RE/MAX Holdings, Inc. 248 0.7% 1.0% 13.6 Total 7,857 21.3% 26.6% 7.8 (1) (2) (3) Annualized rental revenue is annualized contractual rents from our tenants pursuant to existing leases as of September 30, 2014, plus straight line rent adjustments and estimated recurring expense reimbursements; includes some triple net lease rents and excludes lease value amortization. Square footage is pursuant to existing leases as of September 30, 2014 and includes (i) space being fitted out for occupancy and (ii) space which is leased but is not occupied or is being offered for sublease. TENANTS REPRESENTING 1% OR MORE OF TOTAL ANNUALIZED RENTAL REVENUE (1) (square feet in thousands) Tenant Excludes properties classified as discontinued operations for the period ended September 30, 2014. As of September 30, 2014 23 |

23
|
|
CBD Properties Cumulative % Number of Cumulative % Annualized % of Annualized of Annualized Tenants Sq. Ft. % of Sq. Ft. of Sq. Ft. Rental Revenue Rental Revenue Rental Revenue Year Expiring Expiring (2) Expiring Expiring Expiring (3) Expiring Expiring 10/1/2014 - 12/31/2014 105 310 1.7% 1.7% 7,594 $ 1.5% 1.5% 2015 159 1,870 10.1% 11.8% 54,256 10.9% 12.4% 2016 138 1,676 9.1% 20.8% 41,972 8.4% 20.9% 2017 145 1,467 7.9% 28.8% 40,669 8.2% 29.1% 2018 127 2,421 13.1% 41.8% 60,272 12.1% 41.2% 2019 89 1,420 7.7% 49.5% 38,653 7.8% 48.9% 2020 53 2,019 10.9% 60.4% 62,308 12.5% 61.5% 2021 42 1,240 6.7% 67.1% 32,737 6.6% 68.1% 2022 33 999 5.4% 72.5% 28,074 5.6% 73.7% 2023 39 1,211 6.5% 79.1% 31,896 6.4% 80.1% Thereafter 57 3,877 20.9% 100.0% 98,921 19.9% 100.0% Total 987 18,510 100.0% 497,352 $ 100.0% Weighted average remaining lease term (in years) 6.6 6.2 Suburban Properties Cumulative % Number of Cumulative % Annualized % of Annualized of Annualized Tenants Sq. Ft. % of Sq. Ft. of Sq. Ft. Rental Revenue Rental Revenue Rental Revenue Year Expiring Expiring (2) Expiring Expiring Expiring (3) Expiring Expiring 10/1/2014 - 12/31/2014 81 698 3.8% 3.8% 10,628 $ 3.6% 3.6% 2015 154 2,273 12.4% 16.2% 37,651 12.8% 16.4% 2016 164 3,196 17.4% 33.6% 40,634 13.8% 30.1% 2017 123 1,930 10.5% 44.1% 35,003 11.9% 42.0% 2018 91 1,569 8.5% 52.6% 23,913 8.1% 50.1% 2019 71 2,260 12.3% 64.9% 30,282 10.3% 60.4% 2020 48 1,581 8.6% 73.5% 19,686 6.7% 67.1% 2021 37 1,005 5.5% 79.0% 18,422 6.2% 73.3% 2022 21 844 4.6% 83.6% 12,687 4.3% 77.6% 2023 23 1,571 8.6% 92.1% 38,724 13.1% 90.7% Thereafter 23 1,442 7.9% 100.0% 27,286 9.3% 100.0% Total 836 18,369 100.0% 294,916 $ 100.0% Weighted average remaining lease term (in years) 4.6 5.0 Total Properties Cumulative % Number of Cumulative % Annualized % of Annualized of Annualized Tenants Sq. Ft. % of Sq. Ft. of Sq. Ft. Rental Revenue Rental Revenue Rental Revenue Year Expiring Expiring (2) Expiring Expiring Expiring (3) Expiring Expiring 10/1/2014 - 12/31/2014 186 1,008 2.7% 2.7% 18,222 $ 2.3% 2.3% 2015 313 4,143 11.2% 13.9% 91,907 11.6% 13.9% 2016 302 4,872 13.2% 27.1% 82,606 10.4% 24.3% 2017 268 3,397 9.2% 36.3% 75,672 9.6% 33.9% 2018 218 3,990 10.8% 47.1% 84,185 10.6% 44.5% 2019 160 3,680 10.0% 57.1% 68,935 8.7% 53.2% 2020 101 3,600 9.8% 66.9% 81,994 10.3% 63.5% 2021 79 2,245 6.1% 73.0% 51,159 6.5% 70.0% 2022 54 1,843 5.0% 78.0% 40,761 5.1% 75.1% 2023 62 2,782 7.5% 85.5% 70,620 8.9% 84.0% Thereafter 80 5,319 14.5% 100.0% 126,207 16.0% 100.0% Total 1,823 36,879 100.0% 792,268 $ 100.0% Weighted average remaining lease term (in years) 5.6 5.8 (1) (2) (3) Annualized rental revenue is annualized contractual rents from our tenants pursuant to existing leases as of 9/30/2014, plus straight line rent adjustments and estimated recurring expense reimbursements; includes some triple net lease rents and excludes lease value amortization. PORTFOLIO LEASE EXPIRATION SCHEDULE As of September 30, 2014 (dollars and sq. ft. in thousands) Excludes properties classified as discontinued operations for the period ended September 30, 2014. Square feet is pursuant to existing leases as of September 30, 2014 and includes (i) space being fitted out for occupancy and (ii) space which is leased but is not occupied or is being offered for sublease. Square feet expiring in 2014 includes 164 square feet of month-to-month leases, 105 square feet of which relates to the self-storage facility in Hawaii. 24 |
24
|
|
Weighted Average Year Annualized Built or No. of Property Square Leased Rental Undepreciated Net Book Date Substantially Property City State Buildings Location Feet Occupancy Revenue (2) Book Value (3) Value (4) Acquired Renovated (5) 1. 2501 20th Place South Birmingham AL 1 CBD 125,722 98.6% 2,947 $ 24,114 $ 20,110 $ 12/27/2006 2001 2. 420 20th Street North Birmingham AL 1 CBD 514,893 77.9% 9,722 55,640 51,297 7/29/2011 2006 3. Inverness Center Birmingham AL 4 Suburban 475,882 88.1% 8,284 51,460 46,596 12/9/2010 1981 4. 785 Schilinger Road South Mobile AL 1 Suburban 72,000 100.0% 1,031 11,269 9,583 10/22/2007 1998 5. Arizona Center (6) Phoenix AZ 4 CBD 1,070,724 93.8% 15,870 97,014 90,640 3/4/2011 1992 6. 4 South 84th Avenue Tolleson AZ 1 Suburban 236,007 100.0% 1,515 11,359 8,781 12/19/2003 1989 7. One South Church Avenue Tucson AZ 1 CBD 240,811 66.1% 3,848 32,961 24,078 2/27/2002 1986 8. Parkshore Plaza Folsom CA 4 Suburban 269,281 91.3% 5,831 46,575 43,078 6/16/2011 1999 9. Leased Land Gonzalez CA 7 Suburban - 100.0% 3,181 31,827 29,696 8/31/2010 - 10. Sky Park Centre San Diego CA 2 Suburban 63,485 100.0% 1,364 9,785 6,826 6/24/2002 1986 11. Sorrento Valley Business Park San Diego CA 4 Suburban 105,003 100.0% 2,133 17,526 10,748 12/31/1996 1984 12. 1921 E. Alton Avenue Santa Ana CA 1 Suburban 67,846 84.7% 1,683 11,518 8,681 11/10/2003 2000 13. 9110 East Nichols Avenue Centennial CO 1 Suburban 143,958 96.2% 2,397 20,285 14,720 11/2/2001 1984 14. 7450 Campus Drive Colorado Springs CO 1 Suburban 77,411 100.0% 1,814 9,481 8,576 4/30/2010 1996 15. 1225 Seventeenth Street Denver CO 1 CBD 672,465 90.0% 20,866 144,818 128,405 6/24/2009 1982 16. 5073, 5075, & 5085 S. Syracuse Street Denver CO 1 Suburban 248,493 100.0% 8,035 63,610 57,107 4/16/2010 2007 17. 1601 Dry Creek Drive Longmont CO 1 Suburban 552,865 97.0% 8,107 32,282 24,402 10/26/2004 1982 18. 129 Worthington Ridge Road Berlin CT 1 Suburban 227,500 100.0% 781 5,252 4,604 10/24/2006 1968 19. 97 Newberry Road East Windsor CT 1 Suburban 289,386 100.0% 1,761 15,350 12,873 10/24/2006 1989 20. 185 Asylum Street Hartford CT 1 CBD 868,395 98.6% 20,825 77,609 73,769 3/30/2012 2010 21. 599 Research Parkway Meriden CT 1 Suburban 48,249 100.0% 823 8,092 6,217 7/24/2003 1982 22. 33 Stiles Lane North Haven CT 1 Suburban 175,301 100.0% 1,119 11,447 9,563 10/24/2006 2002 23. 181 Marsh Hill Road Orange CT 1 Suburban 162,036 100.0% 1,199 10,793 9,190 10/24/2006 2006 24. 101 Barnes Road Wallingford CT 1 Suburban 45,755 90.5% 837 1,468 1,442 12/22/1998 1988 25. 15 Sterling Drive Wallingford CT 1 Suburban 173,015 72.5% 1,324 4,805 4,727 10/24/2006 1978 26. 35 Thorpe Avenue Wallingford CT 1 Suburban 79,862 71.3% 1,055 6,195 6,073 6/1/1998 1986 27. 50 Barnes Industrial Road North Wallingford CT 1 Suburban 154,255 100.0% 1,393 13,876 11,516 10/24/2006 1976 28. 5-9 Barnes Industrial Road Wallingford CT 1 Suburban 38,006 99.3% 430 3,510 2,982 10/24/2006 1980 29. 860 North Main Street Wallingford CT 1 Suburban 31,165 99.5% 451 4,766 3,886 10/24/2006 1982 30. One Barnes Industrial Road SouthWallingford CT 1 Suburban 30,170 100.0% 351 3,056 2,605 10/24/2006 1977 31. Village Lane Wallingford CT 2 Suburban 58,185 84.6% 708 4,016 3,946 10/24/2006 1977 32. 100 Northfield Drive Windsor CT 1 Suburban 116,986 83.6% 1,776 15,258 11,165 8/29/2003 1988 33. 1250 H Street, NW Washington DC 1 CBD 187,684 58.0% 5,151 64,325 40,695 6/23/1998 1992 34. Georgetown-Green and Harris Buildings Washington DC 2 CBD 240,475 100.0% 6,072 60,023 55,450 9/3/2009 2006 35. 802 Delaware Avenue Wilmington DE 1 CBD 240,780 100.0% 3,607 54,621 33,044 7/23/1998 1986 36. 6600 North Military Trail Boca Raton FL 3 Suburban 639,830 100.0% 17,283 145,690 133,522 1/11/2011 2008 37. 225 Water Street Jacksonville FL 1 CBD 318,997 41.6% 2,651 19,077 18,919 11/24/2008 1985 38. 9040 Roswell Road Atlanta GA 1 Suburban 178,941 86.2% 2,585 23,221 17,954 8/24/2004 1985 39. Executive Park Atlanta GA 9 Suburban 427,443 70.2% 5,164 63,484 49,947 7/16/2004;7/26/2007 1972 40. The Exchange Atlanta GA 2 Suburban 187,632 79.3% 2,447 17,876 13,647 9/9/2004;9/2/2005 1995 41. 3920 Arkwright Road Macon GA 1 Suburban 196,156 83.3% 2,791 24,811 20,185 4/28/2006 1988 42. 1775 West Oak Commons Court Marietta GA 1 Suburban 79,854 100.0% 1,180 9,915 8,546 9/5/2007 1998 43. 633 Ahua Street Honolulu HI 1 Suburban 120,803 86.8% 1,396 19,305 16,021 12/5/2003 2006 44. 625 Crane Street Aurora IL 1 Suburban 103,683 100.0% 408 3,516 3,479 4/2/2007 1977 45. 905 Meridian Lake Drive Aurora IL 1 Suburban 74,652 100.0% 2,157 15,378 12,855 5/1/2007 1999 46. 1200 Lakeside Drive Bannockburn IL 1 Suburban 260,084 74.6% 4,680 65,038 52,683 12/29/2005 1999 47. 600 West Chicago Avenue Chicago IL 2 CBD 1,511,849 91.9% 44,959 354,258 328,949 8/10/2011 2001 48. 8750 Bryn Mawr Avenue Chicago IL 2 Suburban 631,518 92.1% 15,691 90,713 82,233 10/28/2010 2005 49. Illinois Center Chicago IL 2 CBD 2,090,162 73.2% 46,453 332,360 311,267 5/11/2011;1/9/2012 2001 50. 1717 Deerfield Road Deerfield IL 1 Suburban 141,186 69.5% 2,288 8,497 8,356 12/14/2005 1986 51. 1955 West Field Court Lake Forest IL 1 Suburban 59,130 100.0% 1,176 13,877 10,985 12/14/2005 2001 52. 11350 North Meridian Street Carmel IN 1 Suburban 72,264 71.0% 815 2,756 2,668 6/15/2006 1982 53. 101-115 W. Washington Street Indianapolis IN 1 CBD 634,058 91.0% 11,470 87,630 67,799 5/10/2005 1977 54. 111 Monument Circle Indianapolis IN 2 CBD 1,063,885 82.7% 24,183 172,056 164,369 10/22/2012 1990 55. 5015 S. Water Circle Wichita KS 1 Suburban 113,524 100.0% 581 5,874 5,183 4/2/2007 1995 56. 701 Poydras Street New Orleans LA 1 CBD 1,256,971 95.6% 20,471 94,645 88,034 8/29/2011 2010 57. 109 Brookline Avenue Boston MA 1 CBD 285,556 94.3% 9,547 45,035 28,133 9/28/1995 1915 58. Adams Place Braintree/Quincy MA 2 Suburban 230,259 76.2% 3,774 19,772 19,212 4/3/1998 2006 59. Cabot Business Park Mansfield MA 2 Suburban 252,755 53.0% 1,895 15,986 15,633 8/1/2003 1980 60. Cabot Business Park Land Mansfield MA - Suburban - 0.0% - 1,033 1,033 8/1/2003 - 61. 2300 Crown Colony Drive Quincy MA 1 Suburban 45,974 95.5% 1,002 8,171 5,839 2/24/2004 1999 62. Myles Standish Industrial Park Taunton MA 2 Suburban 74,800 100.0% 1,091 6,816 6,736 8/29/2007 1988 63. 340 Thompson Road Webster MA 1 Suburban 25,000 100.0% 191 3,188 1,937 5/15/1997 1995 64. 100 South Charles Street Baltimore MD 1 CBD 159,616 86.0% 2,776 16,357 9,694 11/18/1997 1988 65. 111 Market Place Baltimore MD 1 CBD 540,854 99.2% 11,500 75,948 54,668 1/28/2003 1990 66. 25 S. Charles Street Baltimore MD 1 CBD 343,815 94.0% 6,834 38,498 27,670 7/16/2004 1972 67. 820 W. Diamond Gaithersburg MD 1 Suburban 134,933 82.1% 2,670 33,371 23,449 3/31/1997 1995 68. 6710 Oxon Hill Oxon Hill MD 1 Suburban 118,336 60.3% 1,683 19,608 12,723 3/31/1997 1992 PROPERTY DETAIL As of September 30, 2014 (1) (sorted by geographic location, dollars in thousands) 25 |

25
|
|
Weighted Average Year Annualized Built or No. of Property Square Leased Rental Undepreciated Net Book Date Substantially Property City State Buildings Location Feet Occupancy Revenue (2) Book Value (3) Value (4) Acquired Renovated (5) 69. Danac Stiles Business Park Rockville MD 3 Suburban 276,637 85.4% 6,728 75,880 59,367 7/20/2004 2002 70. East Eisenhower Parkway Ann Arbor MI 2 Suburban 410,464 92.8% 10,363 55,051 49,848 6/15/2010 2006 71. 8800 Queen Avenue South Bloomington MN 1 Suburban 280,822 92.7% 4,105 13,604 13,392 3/19/1998 1957 72. 2250 Pilot Knob Road Mendota Heights MN 1 Suburban 87,183 100.0% 730 6,426 4,086 3/19/1998 1995 73. 9800 Shelard Parkway Plymouth MN 1 Suburban 46,765 77.1% 808 6,631 4,310 8/3/1999 1987 74. Rosedale Corporate Plaza Roseville MN 3 Suburban 149,116 100.0% 2,938 27,546 19,083 12/1/1999 1987 75. 411 Farwell Avenue South St. Paul MN 1 Suburban 422,727 100.0% 1,980 16,228 13,309 6/2/2004 1970 76. 6200 Glenn Carlson Drive St. Cloud MN 1 Suburban 338,000 100.0% 2,212 15,753 14,028 10/15/2009 2013 77. 1000 Shelard Parkway St. Louis Park MN 1 Suburban 62,499 65.3% 899 8,726 5,777 8/3/1999 1986 78. 525 Park Street St. Paul MN 1 CBD 75,636 84.3% 1,208 8,451 5,416 8/3/1999 1987 79. 1900 Meyer Drury Drive Arnold MO 1 Suburban 65,225 100.0% 1,076 8,610 6,624 2/11/2004 1999 80. 4700 Belleview Avenue Kansas City MO 1 Suburban 80,615 79.1% 1,097 6,628 5,890 7/17/2008 1986 81. 131-165 West Ninth Street N. Kansas City MO 1 Suburban 75,517 100.0% 273 1,753 1,562 7/17/2008 1970 82. 12655 Olive Boulevard St. Louis MO 1 Suburban 98,588 98.6% 2,016 14,580 12,672 10/5/2006 1988 83. 1285 Fern Ridge Parkway St. Louis MO 1 Suburban 66,510 72.4% 967 10,000 7,588 11/7/2003 1998 84. 300 North Greene Street Greensboro NC 1 CBD 324,305 83.7% 6,023 40,550 36,530 9/14/2010 1989 85. 7-9 Vreeland Road Florham Park NJ 1 Suburban 155,891 50.0% 1,518 7,215 6,940 7/31/1998 1979 86. 111 River Street Hoboken NJ 1 CBD 566,215 94.3% 22,496 134,469 117,109 8/11/2009 2002 87. 5 Paragon Drive Montvale NJ 1 Suburban 119,089 100.0% 3,649 17,725 16,451 2/11/2011 2008 88. 1000 Voorhees Drive and 333 and 400 Laurel Oak Drive Voorhees NJ 3 Suburban 152,579 61.3% 1,716 10,921 10,682 5/26/1998 1989 89. One Park Square Albuquerque NM 6 CBD 259,737 86.7% 4,499 29,503 21,312 2/12/2002 1986 90. Widewaters Parkway Dewitt NY 8 Suburban 514,241 72.9% 6,016 24,785 24,223 12/28/1999;3/14/2006 1988 91. 5062 Brittonfield Parkway East Syracuse NY 1 Suburban 40,162 100.0% 1,046 3,764 3,714 3/14/2006 1995 92. Woodcliff Drive Fairport NY 6 Suburban 516,760 79.8% 8,516 46,798 43,567 3/14/2006 1995 93. 1601 Veterans Highway Islandia NY 1 Suburban 63,608 84.2% 1,266 3,513 3,433 6/11/1999 1987 94. Two Corporate Center Drive Melville NY 1 Suburban 291,230 47.8% 3,287 21,821 21,260 7/22/1999 1985 95. Interstate Place North Syracuse NY 2 Suburban 61,399 81.0% 814 2,930 2,877 3/14/2006 1973 96. 1000 Pittsford-Victor Road Pittsford NY 1 Suburban 73,358 53.4% 562 2,922 2,867 3/14/2006 1986 97. 1200 Pittsford - Victor Road Pittsford NY 1 Suburban 18,900 100.0% 367 1,854 1,829 11/30/2004 2003 98. Corporate Crossing Pittsford NY 5 Suburban 216,126 81.9% 3,175 14,241 14,016 11/30/2004 2000 99. Canal View Boulevard Rochester NY 3 Suburban 118,375 100.0% 1,576 11,624 9,937 1/6/2006 2000 100. 14 Classic Street Sherburne NY 1 Suburban 37,084 100.0% 204 1,389 1,123 3/14/2006 2000 101. 110 W Fayette Street Syracuse NY 1 CBD 304,906 82.3% 3,631 20,337 19,904 6/29/1999 2012 102. 251 Salina Meadows Parkway Syracuse NY 1 Suburban 65,617 87.5% 907 2,887 2,806 9/24/1999 1990 103. 11311 Cornell Park Drive Blue Ash OH 1 Suburban 93,413 67.1% 957 6,612 6,472 6/15/2006 1982 104. North Point Office Complex Cleveland OH 2 CBD 873,335 79.3% 15,981 121,885 103,909 2/12/2008 1988 105. 5300 Kings Island Drive Mason OH 1 Suburban 159,421 78.6% 1,706 11,350 10,866 6/10/1998 1994 106. 3 Crown Point Court Sharonville OH 1 Suburban 73,987 100.0% 1,488 9,548 7,687 12/30/2005 1999 107. Raintree Industrial Park Solon OH 12 Suburban 563,182 85.5% 2,081 12,076 11,812 7/16/2004 1975 108. 401 Vine Street Delmont PA 1 Suburban 53,980 100.0% 528 7,117 6,160 10/22/2007 1999 109. 515 Pennsylvania Avenue Fort Washington PA 1 Suburban 82,000 77.0% 1,342 14,657 10,355 9/22/1997 1998 110. 443 Gulph Road King of Prussia PA 1 Suburban 21,000 100.0% 453 4,428 2,925 9/22/1997 1966 111. 4350 Northern Pike Monroeville PA 1 Suburban 503,885 46.5% 4,016 75,237 60,631 9/16/2004 2012 112. Cherrington Corporate Center Moon Township PA 7 Suburban 454,890 67.6% 6,164 69,506 50,962 9/14/1998;8/23/1999 1997 113. 1500 Market Street Philadelphia PA 1 CBD 1,773,967 79.5% 36,113 280,661 214,016 10/10/2002 1974 114. 1525 Locust Street Philadelphia PA 1 CBD 98,009 95.2% 2,245 11,161 7,539 6/11/1999 1987 115. 1600 Market Street Philadelphia PA 1 CBD 825,968 83.4% 17,758 131,447 80,949 3/30/1998 1983 116. 16th and Race Street Philadelphia PA 1 CBD 608,625 0.0% - 50,000 49,129 11/13/1997 1980 117. 1735 Market Street Philadelphia PA 1 CBD 1,290,678 91.8% 37,012 297,429 189,243 6/30/1998 1990 118. Foster Plaza Pittsburgh PA 8 Suburban 727,365 90.0% 13,003 72,637 56,760 9/16/2005 1993 119. 128 Crews Drive Columbia SC 1 Suburban 185,600 100.0% 599 3,747 3,389 4/2/2007 2011 120. 1320 Main Street Columbia SC 1 CBD 334,075 91.2% 7,612 55,046 52,381 9/18/2012 2004 121. 111 Southchase Boulevard Fountain Inn SC 1 Suburban 168,087 100.0% 714 8,309 6,966 5/23/2007 1987 122. 1043 Global Avenue Graniteville SC 1 Suburban 450,000 100.0% 1,510 16,870 13,951 4/2/2007 1998 123. 633 Frazier Drive Franklin TN 1 Suburban 150,000 100.0% 2,139 18,980 16,681 10/22/2007 1999 124. 775 Ridge Lake Boulevard Memphis TN 1 CBD 120,678 79.7% 2,570 20,829 15,912 4/28/2004 2000 125. 1601 Rio Grande Street Austin TX 1 CBD 56,219 85.9% 1,166 8,086 5,273 6/3/1999 1985 126. 206 East 9th Street Austin TX 1 CBD 170,052 100.0% 5,816 48,218 45,940 5/31/2012 1984 127. 4515 Seton Center Parkway Austin TX 1 Suburban 117,265 96.8% 2,672 22,863 14,755 10/8/1999 1997 128. 4516 Seton Center Parkway Austin TX 1 Suburban 120,559 94.8% 2,583 23,272 14,793 10/8/1999 1985 129. 7800 Shoal Creek Boulevard Austin TX 4 Suburban 151,917 92.1% 2,811 20,855 14,216 6/30/1999 1974 130. 812 San Antonio Street Austin TX 1 CBD 59,321 88.4% 1,345 8,472 5,745 8/18/1999 1987 131. 8701 N Mopac Austin TX 1 Suburban 121,901 90.1% 1,735 18,644 12,513 8/3/1999 1982 132. Bridgepoint Parkway Austin TX 5 Suburban 440,007 94.6% 10,792 87,869 53,745 12/5/1997 1995 133. Lakewood on the Park Austin TX 2 Suburban 180,558 94.5% 4,081 37,070 23,731 10/20/1998 1998 134. Research Park Austin TX 4 Suburban 1,110,007 98.0% 11,507 90,596 64,437 10/7/1998 1976 135. 9840 Gateway Boulevard North El Paso TX 1 Suburban 72,000 100.0% 1,170 11,432 9,741 10/22/2007 1999 136. 3003 South Expressway 281 Hidalgo TX 1 Suburban 150,000 100.0% 2,036 17,004 14,296 10/22/2007 1999 137. 3330 N Washington Boulevard Arlington VA 1 Suburban 55,719 15.3% 311 8,845 5,795 8/26/1998 1987 138. Thunderbolt Place Chantilly VA 2 Suburban 100,505 87.9% 1,521 14,562 9,675 9/29/1999 1988 139. 6160 Kempsville Circle Norfolk VA 1 Suburban 129,565 37.1% 946 14,973 10,980 10/25/2002 1987 140. 448 Viking Drive Virginia Beach VA 1 Suburban 75,374 75.7% 1,007 7,556 5,959 6/4/2004 1991 26 |

26
|
|
Weighted Average Year Annualized Built or No. of Property Square Leased Rental Undepreciated Net Book Date Substantially Property City State Buildings Location Feet Occupancy Revenue (2) Book Value (3) Value (4) Acquired Renovated (5) 141. 333 108th Avenue NE Bellevue WA 1 CBD 416,503 100.0% 17,862 152,536 135,015 11/12/2009 2008 142. 600 108th Avenue NE Bellevue WA 1 CBD 243,520 84.2% 5,417 45,101 35,394 7/16/2004 2012 143. 1331 North Center Parkway Kennewick WA 1 Suburban 53,980 100.0% 959 9,187 7,910 10/22/2007 1999 144. 100 East Wisconsin Avenue Milwaukee WI 1 CBD 435,067 94.5% 11,827 80,847 72,575 8/11/2010 1989 145. 111 East Kilbourn Avenue Milwaukee WI 1 CBD 373,669 95.9% 9,062 54,966 46,456 6/12/2008 1988 146. 7 Modal Crescent Canning Vale Australia 1 Suburban 164,160 100.0% 1,427 14,160 13,708 10/7/2010 2001 147. 71-93 Whiteside Road Clayton Australia 1 Suburban 303,488 100.0% 1,950 16,283 15,529 10/7/2010 1965 148. 9-13 Titanium Court Crestmead Australia 1 Suburban 69,664 46.8% 324 5,875 5,592 10/7/2010 2005 149. 16 Rodborough Road Frenchs Forest Australia 1 Suburban 90,525 100.0% 2,261 15,489 14,624 10/7/2010 1987 150. 22 Rodborough Road Frenchs Forest Australia 1 Suburban 43,427 100.0% 894 7,298 6,854 10/7/2010 1997 151. 127-161 Cherry Lane Laverton North Australia 1 Suburban 278,570 100.0% 722 8,721 8,257 10/7/2010 1965 152. 310-314 Invermay Road Mowbray Australia 1 Suburban 47,480 100.0% 188 862 815 10/7/2010 1970 153. 253-293 George Town Road Rocherlea Australia 1 Suburban 143,914 100.0% 976 3,068 2,950 10/7/2010 1970 154. 310-320 Pitt Street Sydney Australia 1 CBD 313,865 100.0% 17,956 146,543 137,478 12/21/2010 1989 155. 44-46 Mandarin Street Villawood Australia 1 Suburban 226,718 82.7% 1,513 14,357 13,552 10/7/2010 1980 156. 19 Leadership Way Wangara Australia 1 Suburban 76,714 100.0% 689 6,361 6,112 10/7/2010 2000 262 42,918,835 85.9% $ 792,268 $ 5,886,364 $ 4,898,041 (1) Excludes properties classified as discontinued operations for the period ended September 30, 2014. Annualized rental revenue is annualized contractual rents from our tenants pursuant to existing leases as of September 30, 2014, plus straight line rent adjustments and estimated recurring expense (2) reimbursements; includes some triple net lease rents and excludes lease value amortization. (3) Represents the carrying value of real estate properties, after purchase price allocations, impairment writedowns and currency adjustments, if any. (4) Represents the carrying value of real estate properties, after depreciation and amortization, purchase price allocations, impairment writedowns and currency adjustments, if any. (5) Weighted based on square feet. (6) Contractual cash payments from one tenant at Arizona Center for 2014 is approximately $8,098 and will decrease to approximately $226 of rent in 2016, excluding variable management fees and reimbursements. Our calculation of Normalized FFO reflects the cash payments received from this tenant. The terms of this tenant's lease require us to classify the lease as a direct financing (or capital) lease, and as such, the revenue recognized on a GAAP basis within our condensed consolidated statements of operations is de minimis. This direct financing lease has an expiration date in |

27
|
|
September 30, September 30, 2014 2013 2014 2013 Revenues: Rental income (1) (16) $ 13,462 $ 14,220 $ 44,096 $ Tenant reimbursements and other income 407 1,697 1,730 5,509 Total revenues 391 15,159 15,950 49,605 Expenses: Operating expenses 261 9,699 7,115 31,291 Depreciation and amortization (2) - 3,842 - 11,725 General and administrative 6 1,088 9 3,544 Total expenses 267 14,629 7,124 46,560 Operating income 124 530 8,826 3,045 Interest and other income 2 1 2 13 Interest expense (31) (436) (608) (1,326) Income from discontinued operations 95 $ 95 $ 8,220 $ 1,732 $ (1) (2) We cease depreciation and amortization when properties are reclassified as held for sale. We report rental income on a straight line basis over the terms of the respective leases; rental income includes non-cash straight line rent adjustments. Rental income also includes non-cash amortization of intangible lease assets and liabilities. CONDENSED CONSOLIDATED STATEMENTS OF OPERATIONS FOR DISCONTINUED OPERATIONS (dollars in thousands) For the Three Months Ended For the Nine Months Ended 28 |

28
|
|
9/30/2014 6/30/2014 3/31/2014 12/31/2013 9/30/2013 Common shares owned: Select Income REIT (1) - 22,000,000 22,000,000 22,000,000 22,000,000 Affiliates Insurance Company (2) - - 20,000 20,000 20,000 Percent owned: Select Income REIT (1) 0.0% 36.7% 44.1% 44.2% 44.2% Affiliates Insurance Company (2) 0.0% 0.0% 12.5% 12.5% 12.5% Percent of total assets (book value): Select Income REIT (1) 0.0% 8.1% 7.8% 7.7% 7.5% Affiliates Insurance Company (2) 0.0% 0.0% 0.1% 0.1% 0.1% Total 0.0% 8.1% 7.9% 7.8% 7.6% Carrying book value on balance sheet: Select Income REIT (1) - $ 531,862 $ 513,099 $ 512,078 $ 511,473 $ Affiliates Insurance Company (2) - - 5,835 5,913 5,781 Total - $ 531,862 $ 518,934 $ 517,991 $ 517,254 $ Market value of shares owned: Select Income REIT (1) - $ 652,080 $ 665,940 $ 588,280 $ 567,600 $ Affiliates Insurance Company (2) N/A N/A N/A N/A N/A Total - $ 652,080 $ 665,940 $ 588,280 $ 567,600 $ 2014 2013 2014 2013 Equity in earnings (loss) of investees: Select Income REIT (1) 1,072 $ 10,428 $ 24,516 $ 10,428 $ Government Properties Income Trust (3) - - - 4,111 Affiliates Insurance Company (2) - 64 (56) 374 1,072 $ 10,492 $ 24,460 $ 14,913 $ FFO from investees: Select Income REIT (1) 1,456 $ 14,031 $ 33,063 $ 14,031 $ Government Properties Income Trust (3) - - - 4,591 Affiliates Insurance Company (2) - 64 (56) 374 1,456 $ 14,095 $ 33,007 $ 18,996 $ (1) (2) (3) SUMMARY OF EQUITY INVESTMENTS (dollars in thousands) For the Three Months Ended For the Nine Months Ended In March 2013, EQC sold all 9,950,000 common shares that it owned of GOV in a public offering for $25.20 per common share, raising gross proceeds of $250,740. EQC recognized a gain on this sale of an equity investment of $66,293 as a result of the per share sale price being above EQC's per share carrying value. On July 2, 2013, SIR issued and sold to the public 10,500,000 of its common shares of beneficial interest in an underwritten public offering. Prior to this offering, EQC's 22,000,000 common shares of SIR represented more than 50% of SIR's outstanding common shares and SIR's financial position and results of operations were consolidated in EQC's financial statements. Beginning on July 2, 2013, EQC no longer consolidates its investment in SIR, but instead accounts for its investment in SIR under the equity method. In addition, in May and June 2014, SIR issued 10,000,000 of its common shares in a public offering, which reduced EQC's ownership interest in SIR to 36.7%. EQC recognized a gain on this sale by an equity investee of $16,911 as a result of the per share sales price of this transaction being above EQC's per share carrying value. On July 9, 2014, EQC sold its entire stake of 22,000,000 common shares of SIR. Affiliates Insurance Company, or AIC, is a private company that, until May 9, 2014, was owned equally by Reit Management & Research LLC, or RMR, and each of the public companies to which RMR provides management services, including EQC and SIR. The amounts presented include SIR's equity investment in AIC from May 2012 until July 2, 2013 when SIR was no longer EQC's consolidated subsidiary. On May 9, 2014, as a result of the change in control of EQC and in accordance with the terms of a shareholders agreement among EQC and the other AIC shareholders, the other AIC shareholders purchased pro rata from EQC all 20,000 shares of AIC that EQC then owned for aggregate proceeds of $5,776. September 30, September 30, 29 |

29
|
|
Funds from Operations (FFO) and Normalized FFO Earnings Before Interest, Taxes, Depreciation and Amortization (EBITDA) and Adjusted EBITDA DEFINITIONS We compute FFO in accordance with standards established by the National Association of Real Estate Investment Trusts (NAREIT). NAREIT defines FFO as net income (loss), calculated in accordance with GAAP, excluding real estate depreciation and amortization, gains (or losses) from sales of depreciable property, impairment of depreciable real estate, and our portion of these items related to equity investees and noncontrolling interests. Normalized FFO begins with FFO and excludes lease value amortization, straight line rent, gains and losses on early extinguishment of debt, gains and losses on the sale of equity investments, gains and losses on the issuance of shares by an equity investee, shareholder litigation and transition-related expenses, acquisition related costs, interest earned from direct financing lease, and our portion of these items related to equity investees and noncontrolling interests. Normalized FFO also includes the minimum cash rent from direct financing lease. We consider FFO and Normalized FFO to be appropriate measures of operating performance for a REIT, along with net income, net income attributable to Equity Commonwealth, net income available for EQC common shareholders, operating income and cash flow from operating activities. We believe that FFO and Normalized FFO provide useful information to investors because by excluding the effects of certain historical amounts, such as depreciation expense, FFO and Normalized FFO may facilitate a comparison of our operating performance between periods and with other REITs. FFO and Normalized FFO are among the factors considered by our Board of Trustees when determining the amount of distributions to our shareholders. FFO and Normalized FFO do not represent cash generated by operating activities in accordance with GAAP and should not be considered as alternatives to net income, net income attributable to Equity Commonwealth, net income available for EQC common shareholders, operating income or cash flow from operating activities, determined in accordance with GAAP, or as indicators of our financial performance or liquidity, nor are these measures necessarily indicative of sufficient cash flow to fund all of our needs. These measures should be considered in conjunction with net income, net income attributable to Equity Commonwealth, net income available for EQC common shareholders, operating income and cash flow from operating activities as presented in our condensed consolidated statements of operations, condensed consolidated statements of comprehensive income (loss) and condensed consolidated statements of cash flows. Other REITs and real estate companies may calculate FFO and Normalized FFO differently than we do. We calculate EBITDA as net income (loss) excluding 1) interest expense, 2) income tax expense, 3) depreciation and amortization, and 4) our portion of these items related to equity investees. We calculate Adjusted EBITDA as EBITDA excluding 1) loss on asset impairment, 2) acquisition related costs, 3) loss on early extinguishment of debt, 4) shareholder litigation costs and transition-related expenses, 5) gains or losses on sale of properties, 6) gains or losses on sale of equity investments, 7) gains or losses on issuance of shares by an equity investee, and 8) our portion of these items related to equity investees. We consider EBITDA and Adjusted EBITDA to be appropriate measures of our operating performance, along with net income, net income attributable to Equity Commonwealth, net income available for EQC common shareholders, operating income and cash flow from operating activities. We believe that EBITDA and Adjusted EBITDA provide useful information to investors because by excluding the effects of certain historical amounts, such as interest, depreciation and amortization expense, EBITDA and Adjusted EBITDA may facilitate a comparison of current operating performance with our past operating performance. EBITDA and Adjusted EBITDA do not represent cash generated by operating activities in accordance with GAAP and should not be considered alternatives to net income, net income attributable to Equity Commonwealth, net income available for EQC common shareholders, operating income or cash flow from operating activities, determined in accordance with GAAP, or as indicators of our financial performance or liquidity, nor are these measures necessarily indicative of sufficient cash flow to fund all of our needs. These measures should be considered in conjunction with net income, net income attributable to Equity Commonwealth, net income available for EQC common shareholders, operating income and cash flow from operating activities as presented in our condensed consolidated statements of operations, condensed consolidated statements of comprehensive income (loss) and condensed consolidated statements of cash flows. Other REITs and real estate companies may calculate EBITDA and Adjusted EBITDA differently than we do. 30 |

30
|
|
Net Operating Income (NOI) and Cash Basis NOI Tenant Improvements Capital expenditures to improve tenants' space or amounts paid directly to tenants to improve their space. Leasing Costs Building Improvements Expenditures to replace obsolete building components and expenditures that extend the useful life of existing assets. We define NOI as income from our real estate including lease termination fees received from tenants less our property operating expenses, which expenses include property marketing costs. NOI excludes amortization of capitalized tenant improvement costs and leasing commissions. We define Cash Basis NOI as NOI less non cash straight line rent adjustments, lease value amortization and lease termination fees. We consider NOI and Cash Basis NOI to be appropriate supplemental measures to net income because they may help both investors and management to understand the operations of our properties. We use NOI and Cash Basis NOI internally to evaluate individual, regional and combined property level performance, and we believe that NOI and Cash Basis NOI provide useful information to investors regarding our results of operations because they reflect only those income and expense items that are incurred at the property level and may facilitate comparisons of our operating performance between periods and with other REITs. The calculations of NOI and Cash Basis NOI exclude certain components of net income in order to provide results that are more closely related to our properties' results of operations. NOI and Cash Basis NOI do not represent cash generated by operating activities in accordance with GAAP, and should not be considered as alternatives to net income, net income attributable to Equity Commonwealth, net income available for EQC common shareholders, operating income or cash flow from operating activities, determined in accordance with GAAP, or as indicators of our financial performance or liquidity, nor are these measures necessarily indicative of sufficient cash flow to fund all of our needs. These measures should be considered in conjunction with net income, net income attributable to Equity Commonwealth, net income available for EQC common shareholders, operating income and cash flow from operating activities as presented in our condensed consolidated statements of operations, condensed consolidated statements of comprehensive income (loss) and condensed consolidated statements of cash flows. Other REITs and real estate companies may calculate NOI and Cash Basis NOI differently than we do. Leasing related costs such as brokerage commissions and related legal expenses. Development, Redevelopment and Other Activities Includes 1) major capital expenditures that are identified at the time of a property acquisition and incurred within a short time period after acquiring the property, and 2) major capital expenditure projects that reposition a property or result in new sources of revenue. 31 |

31