Attached files
| file | filename |
|---|---|
| EX-99 - EX-99 - PUBLIC SERVICE ENTERPRISE GROUP INC | d811037dex99.htm |
| 8-K - FORM 8-K - PUBLIC SERVICE ENTERPRISE GROUP INC | d811037d8k.htm |
 Public Service Enterprise Group
PSEG Earnings Conference Call
3rd Quarter 2014
October 30, 2014
EXHIBIT 99.1 |
| 1
Forward-Looking Statement
Certain of the matters discussed in this report about our and our subsidiaries'
future performance, including, without limitation, future revenues, earnings, strategies, prospects, consequences
and all other statements that are not purely historical constitute
“forward-looking statements” within the meaning of the Private Securities Litigation Reform Act of 1995. Such forward-looking
statements are subject to risks and uncertainties, which could cause actual
results to differ materially from those anticipated. Such statements are based on management's beliefs as well as
assumptions made by and information currently available to management. When
used herein, the words “anticipate,” “intend,” “estimate,” “believe,” “expect,” “plan,” “should,” “hypothetical,”
“potential,” “forecast,” “project,” variations of
such words and similar expressions are intended to identify forward-looking statements. Factors that may cause actual results to differ are often
presented with the forward-looking statements themselves. Other factors
that could cause actual results to differ materially from those contemplated in any forward-looking statements made by
us herein are discussed in filings we make with the United States Securities
and Exchange Commission (SEC), including our Annual Report on Form 10-K and subsequent reports on Form 10-Q
and Form 8-K and available on our website: http://www.pseg.com. These
factors include, but are not limited to: •
adverse changes in the demand for or the price of the capacity and energy that
we sell into wholesale electricity markets, •
adverse changes in energy industry law, policies and regulation, including
market structures and a potential shift away from competitive markets toward subsidized market
mechanisms, capacity market design, transmission planning and cost allocation
rules, including how transmission projects are planned and who is permitted to build transmission in
the future, and reliability standards,
•
any inability of our transmission and distribution businesses to obtain
adequate and timely rate relief and regulatory approvals from federal and state regulators,
•
changes in federal and state environmental regulations and enforcement that
could increase our costs or limit our operations, •
changes in nuclear regulation and/or general developments in the nuclear power
industry, including various impacts from any accidents or incidents experienced at our facilities or
by others in the industry, that could limit operations of our nuclear
generating units, •
actions or activities at one of our nuclear units located on a multi-unit
site that might adversely affect our ability to continue to operate that unit or other units located at the same site,
•
any inability to manage our energy obligations, available supply and risks,
•
adverse outcomes of any legal, regulatory or other proceeding,
settlement, investigation or claim applicable to us and/or the energy industry,
•
any deterioration in our credit quality or the credit quality of our
counterparties, •
availability of capital and credit at commercially reasonable terms and
conditions and our ability to meet cash needs, •
changes in the cost of, or interruption in the supply of, fuel and other
commodities necessary to the operation of our generating units, •
delays in receipt of necessary permits and approvals for our
construction and development activities, •
delays or unforeseen cost escalations in our construction and development
activities, •
any inability to achieve, or continue to sustain, our expected levels of
operating performance, •
any equipment failures, accidents, severe weather events or other incidents
that impact our ability to provide safe and reliable service to our customers, and any inability to obtain
sufficient insurance coverage or recover proceeds of insurance with respect to
such events, •
acts of terrorism, cybersecurity attacks or intrusions that could adversely
impact our businesses, •
increases in competition in energy supply markets as well as competition for
certain transmission projects, •
any inability to realize anticipated tax benefits or retain tax credits,
•
challenges associated with recruitment and/or retention of a qualified
workforce, •
adverse performance of our decommissioning and defined benefit plan trust fund
investments and changes in funding requirements, •
changes in technology, such as distributed generation and micro grids, and
greater reliance on these technologies, and •
changes in customer behaviors, including increases in energy efficiency,
net-metering and demand response. All of the forward-looking
statements made in this report are qualified by these cautionary statements and we cannot assure you that the results or developments anticipated by management
will be realized or even if realized, will have the expected consequences to,
or effects on, us or our business prospects, financial condition or results of operations. Readers are cautioned not
to place undue reliance on these forward-looking statements in making any
investment decision. Forward-looking statements made in this report apply only as of the date of this report. While
we may elect to update forward-looking statements from time to time, we
specifically disclaim any obligation to do so, even if internal estimates change, unless otherwise required by applicable
securities laws.
The forward-looking statements contained in this report are intended to
qualify for the safe harbor provisions of Section 27A of the Securities Act of 1933, as amended, and Section 21E of the
Securities Exchange Act of 1934, as amended. |
 2
GAAP Disclaimer
PSEG presents Operating Earnings in addition to its Net Income reported in
accordance with accounting principles generally accepted in the United
States (GAAP). Operating Earnings is a non-GAAP financial measure that
differs from Net Income because it excludes gains or losses associated with
Nuclear Decommissioning Trust (NDT), Mark-to-Market (MTM) accounting,
and other material one-time items. PSEG presents Operating Earnings
because management believes that it is appropriate for investors
to
consider results excluding these items in addition to the results reported in
accordance with GAAP. PSEG believes that the non-GAAP financial
measure of Operating Earnings provides a consistent and comparable
measure of performance of its businesses to help shareholders understand
performance trends. This information is not
intended to be viewed as an
alternative to GAAP information. The last slide in this presentation includes
a list of items excluded from Net Income to reconcile to Operating Earnings,
with a reference to that slide included on each of the slides where the
non- GAAP information appears.
These
materials
and
other
financial
releases
can
be
found
on
the
pseg.com
website
under the investor tab, or at http://investor.pseg.com/
|
 PSEG
2014 Q3 Review
Ralph Izzo
Chairman, President and Chief Executive Officer |
 4
Q3 Earnings Summary
Quarter ended September 30
$ millions (except EPS)
2014
2013
Operating Earnings
$ 393
$ 385
Reconciling Items, Net of Tax
51
5
Net Income
$ 444
$ 390
EPS from Operating Earnings*
$ 0.77
$ 0.76
* See Slide A for Items excluded from Net Income to reconcile to Operating Earnings. |
 5
Year to Date Earnings Summary
Nine months ended September 30
$ millions (except EPS)
2014
2013
Operating Earnings
$ 1,153
$ 1,061
Reconciling Items, Net of Tax
(111)
(18)
Net Income
$ 1,042
$ 1,043
EPS from Operating Earnings*
$ 2.27
$ 2.09
* See Slide A for Items excluded from Net Income to reconcile to Operating Earnings. |
 6
PSEG –
Q3 2014 Highlights
Operating Earnings of $0.77 vs. $0.76 per share in Q3 2013
Delivered solid results in the quarter as PSE&G’s continuing investment in
transmission drove results
Narrowed 2014 full–year, operating earnings guidance to $2.60-$2.75 per
share, from $2.55-$2.75 per share prior
Executing on operational goals
Continued control of O&M supports full-year expectations
Generation
increase
of
4%
–
with
increased
availability
Executing on our on our capital program
Transmission program of $6.8 billion continues on schedule and on budget
Energy
Strong
investment
underway
–
gas
mains
replacement
prioritized
Power announced a new $100-$120 million investment in the PennEast Pipeline
project Market developments
PJM proposed changes on Capacity Performance, Demand Curve Adjustment and
pending Demand Response (DR) issues supportive of price formation
PJM decision on FERC 1000 Artificial Island solution expected early 2015
Updated
PSEG-Long
Island
“Utility
2.0”
filing
submitted
to
NY
regulators |
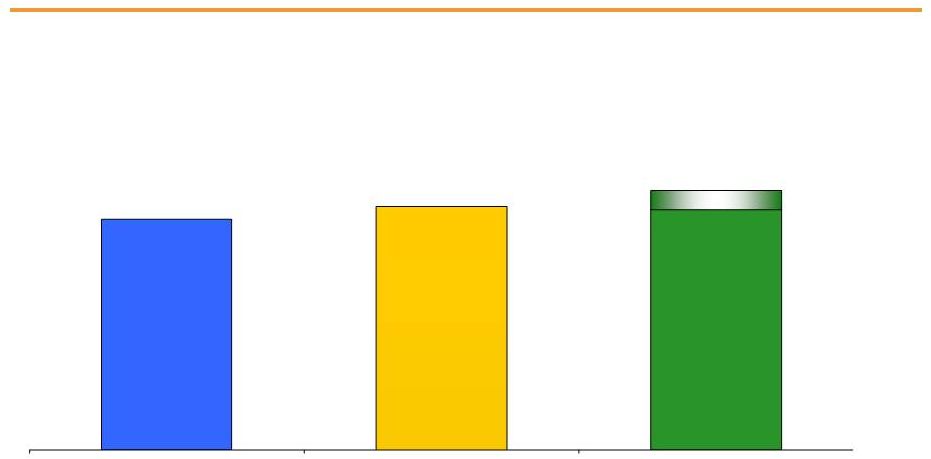 7
$2.60 -
$2.75E
PSEG –
2014 Another Year of Growth
$2.44
$2.58
2014 operating earnings guidance narrowed; forecast full-year at upper
end of range, assuming normal weather and unit operations for rest of
year 2012 Operating Earnings*
2013 Operating Earnings*
2014 Operating Earnings Guidance
* See Slide A for Items excluded from Net Income to reconcile to Operating Earnings. E =
Estimate. |
 PSEG
2014 Q3 Operating Company Review
Caroline Dorsa
EVP and Chief Financial Officer |
 9
Q3 Operating Earnings by Subsidiary
Operating Earnings
Earnings per Share
$ millions (except EPS)
2014
2013
2014
2013
PSE&G
$ 200
$ 168
$ 0.39
$ 0.33
PSEG Power
171
221
0.34
0.43
PSEG Enterprise/Other
22
(4)
0.04
-
Operating Earnings*
$ 393
$ 385
$ 0.77
$ 0.76
Quarter ended September 30
* See Slide A for Items excluded from Net Income to reconcile to Operating Earnings. |
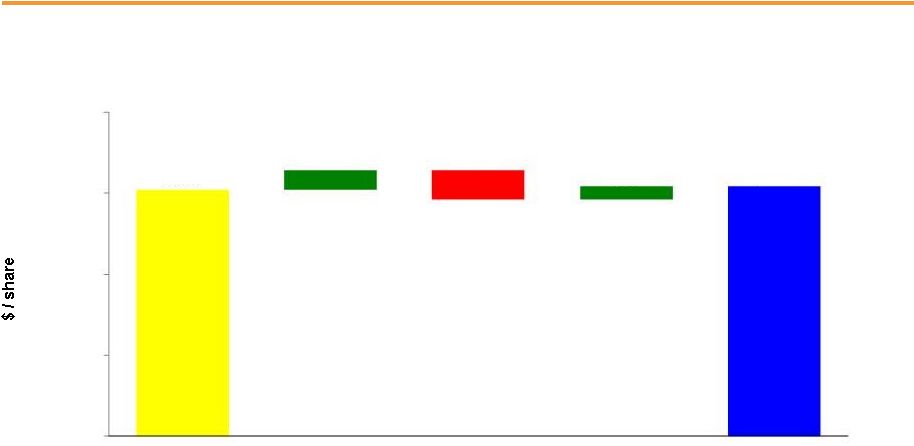 10
PSEG EPS Reconciliation –
Q3 2014 versus Q3 2013
Capacity (0.09)
Re-Contracting
& Market
Pricing (0.04)
Weather (0.03)
O&M 0.06
Taxes &
Other 0.01
Transmission 0.04
Electric Volume
& Demand 0.01
Weather (0.02)
Distribution
O&M 0.02
Interest &
Other 0.01
Q3 2014
Operating
Earnings*
Q3 2013
Operating
Earnings*
PSEG Power
PSE&G
Enterprise/
Other
PSEG Long Island
and Other
$0.76
0.06
0.04
$0.77
(0.09)
0.00
0.25
0.50
0.75
1.00
* See Slide A for Items excluded from Net Income to reconcile to Operating Earnings. |
 11
Year to Date Operating Earnings by Subsidiary
Operating Earnings
Earnings per Share
$ millions (except EPS)
2014
2013
2014
2013
PSE&G
$ 565
$ 468
$ 1.11
$ 0.92
PSEG Power
551
595
1.09
1.17
PSEG Enterprise/Other
37
(2)
0.07
-
Operating Earnings*
$ 1,153
$ 1,061
$ 2.27
$ 2.09
Nine months ended September 30
•
See Slide A for Items excluded from Net Income to reconcile to Operating Earnings. |
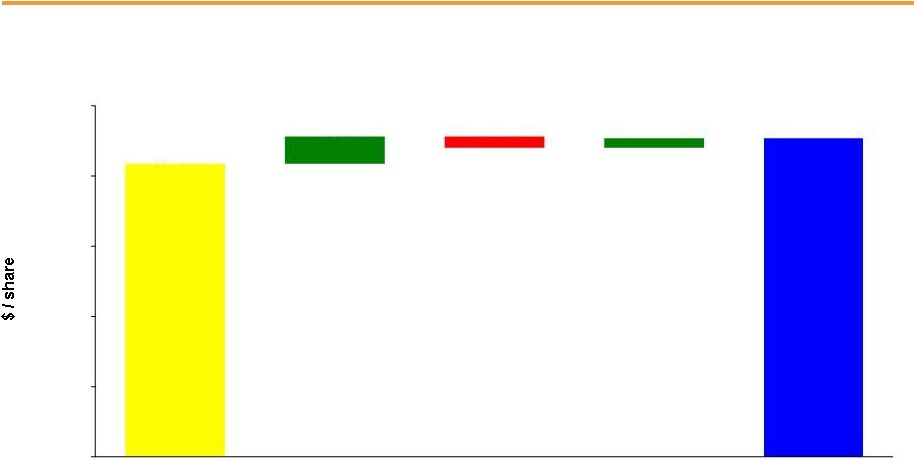 12
PSEG EPS Reconciliation –
YTD 2014 versus YTD 2013
YTD 2014
Operating
Earnings*
YTD 2013
Operating
Earnings*
Capacity 0.05
Re-Contracting
& Market Pricing
(0.07)
Weather (0.03)
Lower Volume (0.01)
O&M (0.02)
D&A, Taxes
and Other 0.00
PSEG Power**
Transmission 0.10
Gas Volume,
Demand & Other
Revenue 0.03
Electric Volume
& Demand 0.01
Weather (0.02)
Distribution
O&M 0.04
Lower Interest
Expense &
Other 0.03
PSE&G
**
Enterprise/
Other
PSEG-Long Island
And Other
0.00
0.50
1.00
1.50
2.00
2.50
$2.09
0.19
0.07
$2.27
(0.08)
*
See Slide A for Items excluded from Net Income to reconcile to Operating Earnings.
**
Prior quarter results for reconciling items may not add to year-to-date (YTD) totals due to
rounding. |
 PSE&G
2014 Q3 Review |
 14
PSE&G –
Q3 Earnings Summary
$ millions (except EPS)
Q3 2014
Q3 2013
Variance
Operating Revenues
$ 1,655
$ 1,666
(11)
Operating Expenses
Energy Costs
668
661
7
Operation & Maintenance
366
408
(42)
Depreciation & Amortization
238
236
2
Taxes Other than Income Taxes
-
15
(15)
Total Operating Expenses
1,272
1,320
(48)
Operating Earnings / Net Income
$ 200
$ 168
32
EPS from Operating Earnings
$ 0.39
$ 0.33
$ 0.06 |
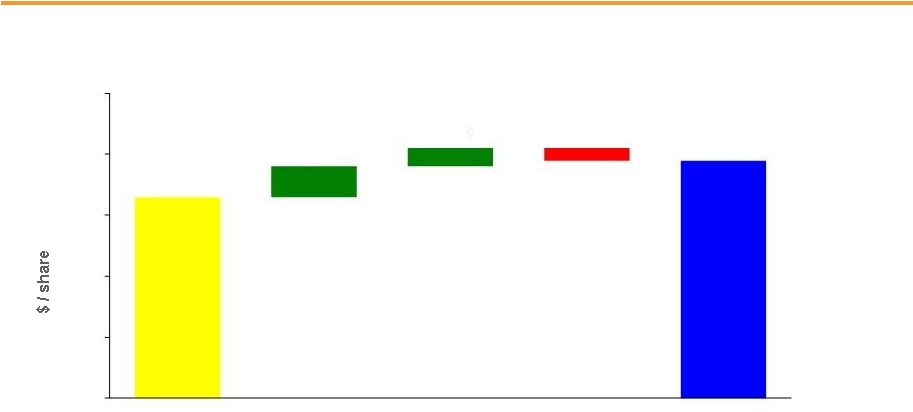 15
PSE&G
EPS
Reconciliation
–
Q3
2014
versus
Q3
2013
Q3 2014
Operating
Earnings
Q3 2013
Operating
Earnings
Transmission 0.04
Electric Volume
& Demand 0.01
Distribution O&M
0.02
Interest &
Other 0.01
Weather
$0.33
0.05
0.03
$0.39
(0.02)
0.00
0.10
0.20
0.30
0.40
0.50 |
   4,587
3,397
2,101
6,977
3,691
1,687
5,213
4,607
1,906
0
1,000
2,000
3,000
4,000
5,000
6,000
7,000
July
August
September
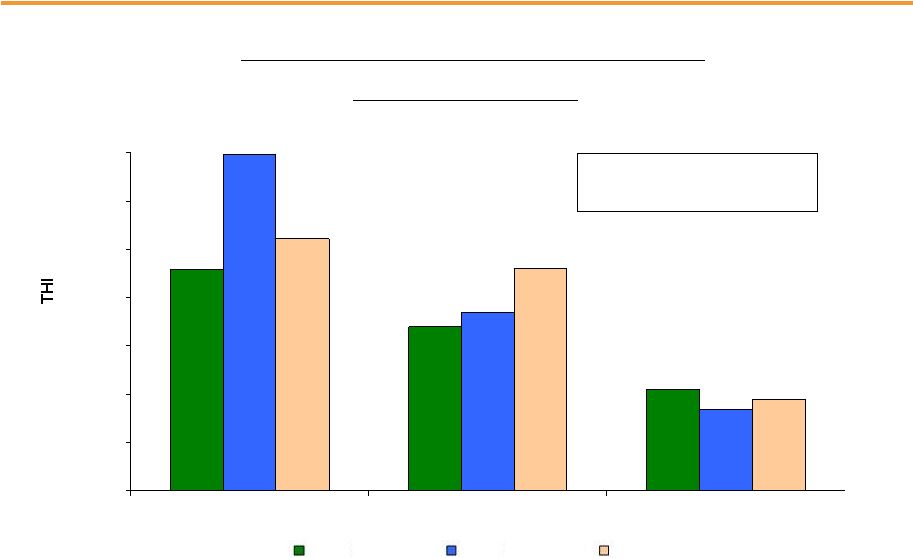
16
PSE&G –
Monthly Summer Weather Data
2014 vs. 2013 vs. Normal
PSE&G Monthly Temperature Humidity Index (THI)
-18.4% Q3 2014 vs. Q3 2013
-14% Q3 2014 vs. Normal
2014
2013
Normal |
 17
PSE&G –
Q3 Operating Highlights
Transmission projects on schedule and on budget
Energy Strong investments underway: Gas mains replacement prioritized
2015 FERC Formula Rate filing submitted
PSE&G lowered gas rates by 9% on 10/1; Additional BGSS rate credits to be
implemented Nov 2014 to
Jan
2015
–
expected
to
further
reduce
winter
heating
bills
Filed Energy Efficiency Ext II program with BPU for ~$100 million; early 2015
decision expected BPU approved settlement finding $366 million of
2010-2012 storm cost expenditures to be prudent: $126 million of capital
costs and $240 million of O&M expenditures to be recoverable in a future rate case
New NJBPU President Mroz (R) and Commissioner Chivukula (D) confirmed by NJ
Senate PSE&G earned its authorized return
Issued $250 million of secured MTNs (due 2019) and $250 million secured MTNs (due
2024); Retired $500 million of debt maturities in Q3
Weather in Q3 2014 was 18% cooler than Q3 2013 and 14% cooler than normal
Transmission revenues added $0.04 per share over Q3 2013
O&M remains under control
Financial
Regulatory and Market
Environment
Operations |
 PSEG
Power 2014 Q3 Review |
 19
PSEG Power –
Q3 Earnings Summary
$ millions (except EPS)
Q3 2014
Q3 2013
Variance
Operating Revenues
$ 1,138
$ 1,174
$ (36)
Operating Earnings
171
221
(50)
Reconciling Items, Net of Tax**
51
5
46
Net Income
222
226
(4)
EPS from Operating Earnings*
$ 0.34
$ 0.43
$ (0.09)
* See Slide A for Items excluded from Net Income to reconcile to Operating Earnings.
**Includes the financial impact from positions with forward delivery months.
|
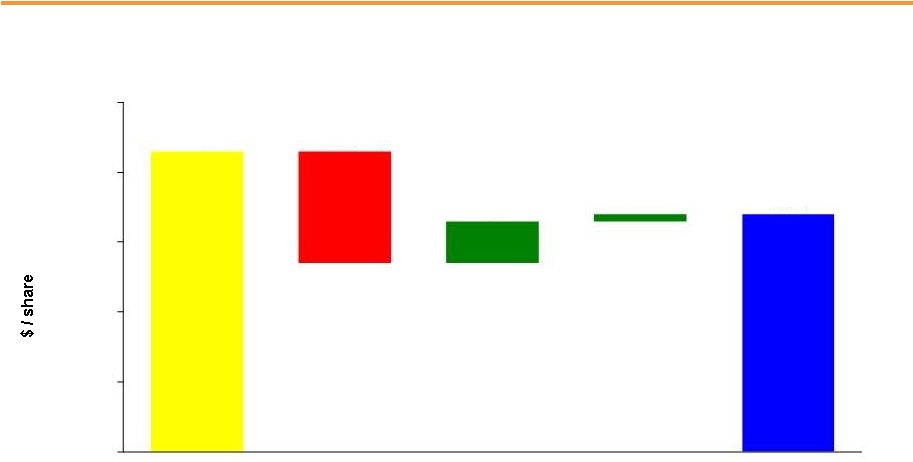 20
Capacity (0.09)
Re-Contracting and
Market Pricing (0.04)
Weather (0.03)
PSEG Power EPS Reconciliation –
Q3 2014 versus Q3 2013
Q3 2014
Operating
Earnings*
Q3 2013
Operating
Earnings*
O&M
Taxes
and
Other
$0.43
0.06
0.01
$0.34
(0.16)
0.00
0.10
0.20
0.30
0.40
0.50
* See Slide A for Items excluded from Income from Net Income to reconcile to Operating Earnings. |
 21
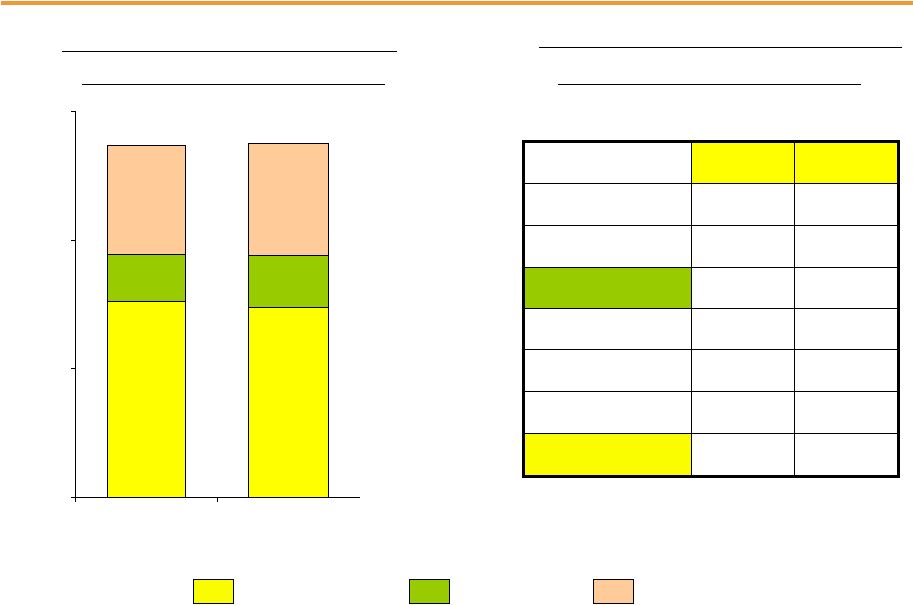
PSEG Power –
Generation Measures
Quarter ended September 30
Total Nuclear
Total Coal*
Oil & Natural Gas
* Includes figures for Pumped Storage. Includes Hudson and Mercer when run on gas.
PSEG Power –
Generation (GWh)
14,111
14,690
Quarter ended September 30
PSEG Power –
Capacity Factors (%)
7,498
7,565
1,936
1,831
4,677
5,294
0
7,500
15,000
2013
2014
2013
2014
Combined
Cycle
PJM and NY
60.4%
67.5%
Coal
NJ (Coal/Gas)
16.3%
21.5%
PA
83.1%
71.8%
CT
11.6%
5.3%
Nuclear
91.0%
92.0% |
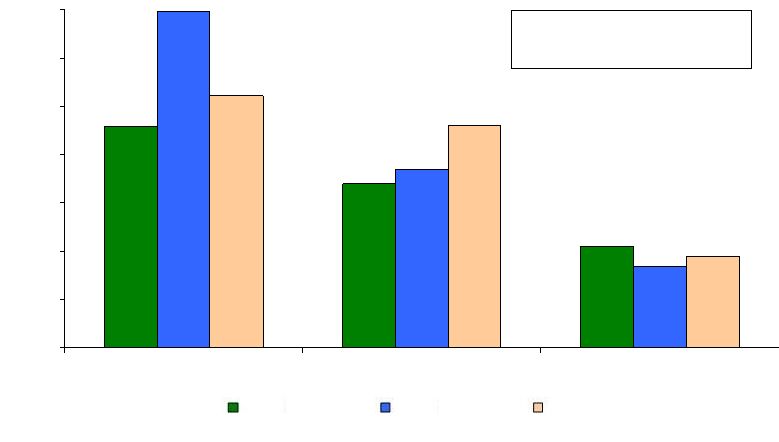
 22
PSEG Power –
Generation Measures
Nine Months ended September 30
Total Nuclear
Total Coal*
Oil & Natural Gas
PSEG Power –
Generation (GWh)
40,986
41,306
Nine Months ended September 30
PSEG Power –
Capacity Factors (%)
22,783
22,152
5,526
6,096
12,677
13,058
0
15,000
30,000
45,000
2013
2014
2013
2014
Combined Cycle
PJM and NY
57.0%
54.7%
Coal*
NJ (Coal/Gas)
14.2%
18.6%
PA
79.4%
78.1%
CT
16.6%
27.1%
Nuclear
93.2%
90.8%
* Includes figures for Pumped Storage. Includes Hudson and Mercer when run on gas. |
 23
PSEG Power –
Fuel Costs
PSEG Power –
Fuel Costs
Quarter ended September 30
($ millions)
2013
2014
Coal
45.1
42.2
Oil & Gas
146.1
139.5
Total Fossil
191.2
181.7
Nuclear
56.5
53.2
Total Fuel Cost
247.7
234.9
Total Generation
(GWh)
14,111
14,690
$ / MWh
17.55
15.99
Nine months ended
September 30
($ millions)
2013
2014
Coal
141.3
169.7
Oil & Gas
483.8
623.4
Total Fossil
625.1
793.1
Nuclear
166.6
161.9
Total Fuel Cost
791.7
955.0
Total Generation
(GWh)
40,986
41,306
$ / MWh
19.32
23.12 |
 24
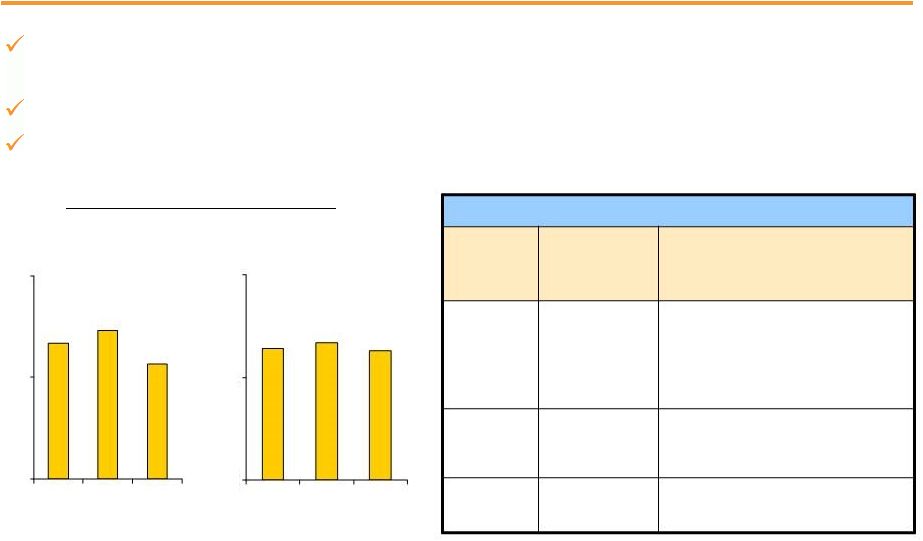
PSEG Power –
Gross Margin Performance
Capacity pricing reset to $166/MW-day on June 1, to remain stable
over multi-year period
Mild summer weather weighed on spot market prices
Lower spark spreads compared with Q3 2013
PSEG Power Gross Margin ($/MWh)
$47
$51
$40
Quarter ended
September 30
Nine months ended
September 30
$45
$47
$44
$0
$35
$70
$0
$35
$70
Regional Performance
Region
Q3 2014
Gross
Margin ($M)
2014 Performance
PJM
$537
Decline in capacity prices and
hedged energy prices
New
England
$20
Lower volume
New York
$24
Increased volume
2012
2013
2014
2012
2013
2014 |
 PSEG
Power expanding supply of low-cost Marcellus gas PSEG plans to
invest $100-$120 million in the to-be-constructed PennEast
Pipeline, a 105.5 mile pipeline that would bring gas
from eastern Pennsylvania to New Jersey
PSEG ER&T would contract for approximately
125mmcf/day of PennEast’s 1 bcf/day
capacity under a 15-year contract; other
project sponsors have committed to offtake
~500mmcf/day
PSEG and its customers would benefit from
the displacement of higher-cost, Gulf Coast
gas supply
Targeted in-service date is November 2017
Proposed PennEast Pipeline Project
25 |
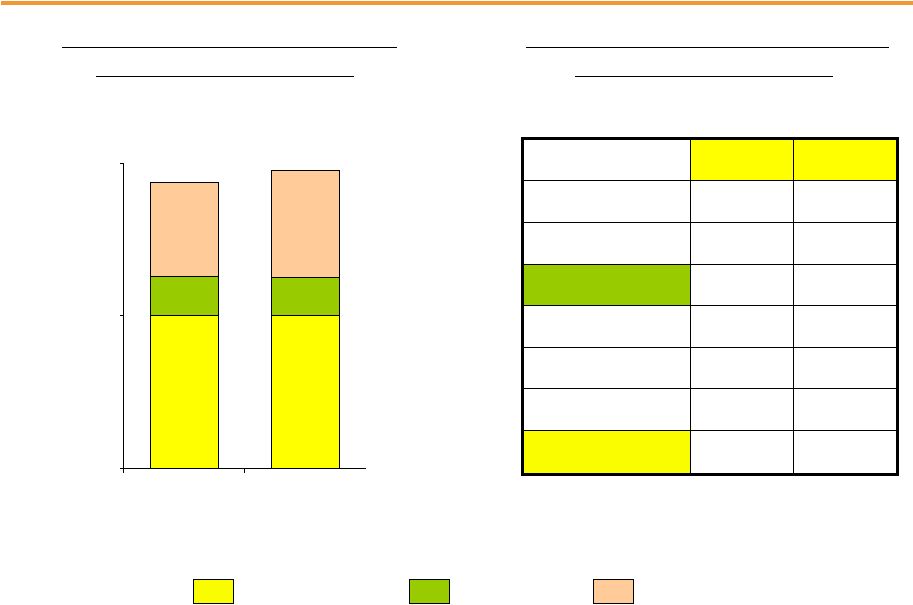
 Volume TWh
8
36
36
Base Load
% Hedged
100%
100%
55-60%
(Nuclear and Base Load Coal)
Price $/MWh
$49
$50
$49
Volume TWh
5
21
21
Intermediate Coal, Combined
% Hedged
50-55%
5-10%
0%
Cycle, Peaking
Price $/MWh
$49
$50
$49
26
Hedging Update…
Contracted Energy*
Oct-Dec
2014
2015
2016
* Hedge percentages and prices as of September 30, 2014. Revenues of full requirement load deals
based on contract price, including renewable energy credits, ancillary, and transmission
components but excluding capacity. Hedges include positions with MTM accounting
treatment and options.
Volume TWh
13
55-57
55-57
Total
% Hedged
80-85%
65-70%
35-40%
Price $/MWh
$49
$50
$49 |
 Regulatory and Market
Environment
PJM active on ensuring future reliability: Capacity Performance proposal, review of
DR participation
in
energy
markets,
and
revision
of
demand
(VRR)
curve
–
all
supportive
of price formation
Average hedge price for 2014 is $48/MWh vs. $50/MWh for
2013 27
PSEG Power –
Q3 2014 Operating Highlights
Q3 output up 4% from Q3 2013
YTD nuclear capacity factor was 91%; Q3 capacity factor was 92%
Salem 1 refueling outage underway
CCGT capacity factor improved 7% from Q3 2013
Operations
New $600 million, 450 MW CCGT at Bridgeport Harbor under consideration
Announced $100-$120 million PennEast Pipeline investment
Power’s total debt as a percentage of capital at September 30 was 32%
Power has been verbally notified by the FERC staff that they have initiated a
preliminary, non-public staff investigation into the matters surrounding
the errors discovered by Power in certain of its cost based bids
Financial |
 PSEG |
 2014
operating earnings guidance narrowed to $2.60 - $2.75 per share
Focused on maintaining operating efficiency and customer reliability
PSE&G’s operating earnings on track to grow at double-digit rate in
2014 PSE&G transmission investment program continues on-track and
on-budget Financial position remains strong
Positive cash from Power and increasing cash flow from PSE&G supports dividend
Debt as a percentage of capital was 42% at September 30
Long history of returning cash to the shareholder through the common
dividend, with opportunity for future growth
PSEG Financial Highlights
29
growth
and
funds
capital
spending
program
without
the
need
to
issue
equity |
 $
millions (except EPS) 2014E
2013
2012
PSE&G
$710 –
$745
$612
$528
PSEG Power
$575 –
$610
$710
$663
PSEG Enterprise/Other
$35 –
$40
$(13)
$45
Operating Earnings*
$1,320 –
$1,395
$1,309
$1,236
Earnings per Share
$2.60 –
$2.75
$2.58
$2.44
30
PSEG 2014 Operating Earnings Guidance -
By Subsidiary
* See Slide A for Items excluded from Net Income to reconcile to Operating Earnings. E =
Estimate. |
 PSEG
Liquidity as of September 30, 2014 31
Expiration
Total
Available
Company
Facility
Date
Facility
Usage
Liquidity
($Millions)
PSE&G
5-year Credit Facility
Mar-18
$600
1
$14
$586
5-Year Credit Facility (Power)
Apr-19
$1,600
$76
$1,524
5-Year Credit Facility (Power)
Mar-18
$1,000
2
$0
$1,000
5-Year Bilateral (Power)
Sep-15
$100
$100
$0
5-year Credit Facility (PSEG)
Apr-19
$500
$8
$492
5-year Credit Facility (PSEG)
Mar-18
$500
3
$0
$500
Total
$4,300
$198
$4,102
1 PSE&G Facility to be reduced by $29M on April 15, 2016
$374
2 Power Facility to be reduced by $48M on April 15, 2016
PSE&G ST Investment
$293
3 PSEG Facility to be reduced by $23M on April 15, 2016
Total Liquidity Available
$4,769
Total Parent / Power Liquidity
$3,890
PSEG /
Power
PSEG Money Pool ST Investment |
 A
Items Excluded from Net Income to Reconcile to Operating Earnings
Please see Slide 2 for an explanation of PSEG’s use of Operating Earnings as a
non-GAAP financial measure and how it differs from Net Income.
2014
2013
2014
2013
2013
2012
Earnings Impact ($ Millions)
Operating Earnings
393
$
385
$
1,153
$
1,061
$
1,309
$
1,236
$
Gain (Loss) on Nuclear Decommissioning Trust (NDT)
Fund Related Activity (PSEG Power)
17
12
40
29
40
52
Gain
(Loss)
on
Mark-to-Market
(MTM)
(a)
(PSEG
Power)
36
3
(138)
(22)
(74)
(10)
Lease Related Activity (PSEG Enterprise/Other)
-
-
-
-
-
36
Storm O&M, net of insurance recoveries (PSEG Power)
(2)
(10)
(13)
(25)
(32)
(39)
Net Income
444
$
390
$
1,042
$
1,043
$
1,243
$
1,275
$
Fully Diluted Average Shares Outstanding (in Millions)
507
508
507
507
508
507
Per Share Impact (Diluted)
Operating Earnings
0.77
$
0.76
$
2.27
$
2.09
$
2.58
$
2.44
$
Gain (Loss) on NDT Fund Related Activity (PSEG Power)
0.04
0.02
0.08
0.06
0.08
0.10
Gain
(Loss)
on
MTM
(a)
(PSEG Power)
0.07
0.01
(0.27)
(0.04)
(0.14)
(0.02)
Lease Related Activity (PSEG Enterprise/Other)
-
-
-
-
-
0.07
Storm O&M, net of insurance recoveries (PSEG Power)
(0.01)
(0.02)
(0.03)
(0.05)
(0.07)
(0.08)
Net Income
0.87
$
0.77
$
2.05
$
2.06
$
2.45
$
2.51
$
(a) Includes the financial impact from positions with forward delivery
months. September 30,
September 30,
December 31,
(Unaudited)
PUBLIC SERVICE ENTERPRISE GROUP INCORPORATED
Reconciling Items, net of tax
Three Months Ended
Nine Months Ended
Year Ended |