Attached files
| file | filename |
|---|---|
| 8-K - FORM 8-K - BANC OF CALIFORNIA, INC. | d811421d8k.htm |
| EX-99.1 - EX-99.1 - BANC OF CALIFORNIA, INC. | d811421dex991.htm |
| EX-10.2 - EX-10.2 - BANC OF CALIFORNIA, INC. | d811421dex102.htm |
| EX-3.1 - EX-3.1 - BANC OF CALIFORNIA, INC. | d811421dex31.htm |
| EX-10.1 - EX-10.1 - BANC OF CALIFORNIA, INC. | d811421dex101.htm |
| EX-14.1 - EX-14.1 - BANC OF CALIFORNIA, INC. | d811421dex141.htm |
 2014 Third
Quarter Earnings October 30, 2014
Investor Presentation
Exhibit 99.2 |
| 1
1
Forward-looking Statements
When used in this presentation and in documents filed with or furnished to the Securities and
Exchange Commission (the “SEC”), or other public shareholder communications,
or in oral statements made with the approval of an authorized executive officer, the words or phrases “believe,” “will,” “should,” “will likely result,” “are
expected to,” “will continue,” “is anticipated,” “estimate,”
“project,” “plans,” or similar expressions are intended to identify “forward-looking statements” within the
meaning of the Private Securities Litigation Reform Act of 1995. You are cautioned not to place
undue reliance on any forward-looking statements, which speak only as of the date
made. These statements may relate to future financial performance, strategic plans or objectives, revenue, expense or earnings projections, or other financial
items of Banc of California Inc. and its affiliates (“BANC,” the
“Company,” “we,” “us” or “our”). By their nature, these statements are subject to numerous uncertainties
that could cause actual results to differ materially from those anticipated in the statements.
Factors that could cause actual results to differ materially from the results anticipated or
projected include, but are not limited to, the following: (i) the occurrence of any
event, change or other circumstance that could give rise to the termination of the purchase
and assumption agreement for the Company's pending acquisition of selected assets and
liabilities from Banco Popular (“BPOP”), or affect consummation of the associated direct registered sale of common stock to entities managed by Oaktree
Capital Management and Patriot Financial Partners, LP (the “Investors”); (ii) the
outcome of any legal proceedings that may be instituted against the Company, BPOP or
the Investors; (iii) the inability to complete the BPOP transaction or the sale of common
stock to the Investors due to the failure to satisfy such transaction's conditions to
completion, including the receipt of regulatory approvals; (iv) risks that the proposed BPOP
transaction, the sale of common stock to the Investors, or the Company’s recently
completed acquisitions, including the acquisitions of The Private Bank of California, CS Financial, Inc., and The Palisades Group, may disrupt current plans and
operations, the potential difficulties in customer and employee retention as a result of those
transactions and the amount of the costs, fees, expenses and charges related to those
transactions; (v) the credit risks of lending activities, which may be affected by further deterioration in real estate markets and the financial condition of
borrowers, may lead to increased loan and lease delinquencies, losses and nonperforming assets
in our loan portfolio, and may result in our allowance for loan and lease losses not
being adequate to cover actual losses and require us to materially increase our loan and lease loss reserves; (vi) the quality and composition of our securities
and loan portfolios; (vii) changes in general economic conditions, either nationally or in our
market areas; (viii) continuation of the historically low short-term interest rate
environment, changes in the levels of general interest rates, and the relative differences
between short- and long-term interest rates, deposit interest rates, our net
interest margin and funding sources; (ix) fluctuations in the demand for loans and leases, the
number of unsold homes and other properties and fluctuations in commercial and
residential real estate values in our market area; (x) results of examinations of us by regulatory authorities and the possibility that any such regulatory
authority may, among other things, require us to increase our allowance for loan and lease
losses, write-down asset values, increase our capital levels, or affect our ability
to borrow funds or maintain or increase deposits, which could adversely affect our liquidity
and earnings; (xi) legislative or regulatory changes that adversely affect our
business, including changes in regulatory capital or other rules; (xii) our ability to control
operating costs and expenses; (xiii) staffing fluctuations in response to product
demand or the implementation of corporate strategies that affect our work force and potential
associated charges; (xiv) errors in our estimates in determining fair value of
certain of our assets, which may result in significant declines in valuation; (xv) the network and computer systems on which we depend could fail or experience a
security breach; (xvi) our ability to attract and retain key members of our senior management
team; (xvii) costs and effects of litigation, including settlements and judgments;
(xviii) increased competitive pressures among financial services companies; (xix) changes in consumer spending, borrowing and saving habits; (xx) adverse
changes in the securities markets; (xxi) earthquake, fire or other natural disasters affecting
the condition of real estate collateral; (xxii) the availability of resources to
address changes in laws, rules or regulations or to respond to regulatory actions; (xxiii)
inability of key third-party providers to perform their obligations to us; (xxiv)
changes in accounting policies and practices, as may be adopted by the financial institution
regulatory agencies or the Financial Accounting Standards Board or their application to
our business or final audit adjustments, including additional guidance and interpretation on accounting issues and details of the implementation of new
accounting methods; (xxv) war or terrorist activities; and (xxvi) other economic, competitive,
governmental, regulatory, and technological factors affecting our operations, pricing,
products and services and the other risks described in this report and from time to time in other documents that we file with or furnish to the SEC. You should not
place undue reliance on forward-looking statements, and we undertake no obligation to
update any such statements to reflect circumstances or events that occur after
the date on which the forward-looking statement is made.
|
 2
2
2014 Third Quarter Highlights
Net Income
Loan and
Deposit
Balances
Net Interest
Income
Noninterest
Income
Capital
Net income of $11.2 million compared to $8.1 million in the prior quarter
Net
income
available
to
common
shareholders
of
$10.3
million,
or
$0.31
per
diluted
share
Return on average assets of 1.0%
Return on average tangible common equity (ROATCE) of 13.2%
Total loan balances increased by $141 million to $3.84 billion, or 4% from the prior
quarter
Total
deposits
increased
by
$284
million
to
$3.63
billion,
or
8%
from
the
prior
quarter
Noninterest-bearing deposit balances increased by $49 million to $458 million, or 12%
from the prior quarter
Net interest income increased by $2.6 million from the prior quarter
Net interest margin for the third quarter was 3.58%, compared with 3.70% from the prior
quarter
Noninterest income for the third quarter was $44.1 million, an increase of $8.7 million
compared to the prior quarter
Gain
on
sale
of
loans
of
$10.3
million
for
the
third
quarter,
an
increase
of
$7.2
million
compared to the prior quarter
Tier 1 Risk-Based Capital Ratio of 14.0%
Tier 1 Leverage Ratio of 9.3%
Tangible Common Equity to Tangible Assets Ratio (TCE/TA) of 7.2%
|
 3
3
Income Statement
3Q 2014
2Q 2014
Net Interest Income
$ 38.2
$ 35.6
Noninterest Income
44.1
35.4
Total Revenue
82.3
70.9
Expenses
(67.6)
(60.5)
Pre-Tax, Pre-Provision Income
14.7
10.5
Provision
(2.8)
(2.1)
Pre-Tax Income
11.9
8.4
Taxes
(0.7)
(0.3)
Net Income
11.2
8.1
Preferred Dividends
(0.9)
(0.9)
Net Income Available to Common
10.3
7.2
Diluted Earnings Per Share
$ 0.31
$ 0.27
ROAA
1.0%
0.8%
ROATCE
13.2%
12.0%
Average shares outstanding for diluted EPS calculation
¹
32.7
26.0
($ in millions except per share data)
* Figures may not foot due to rounding
1 Average shares outstanding include potential TEU conversions to common shares (in
millions) |
 4
4
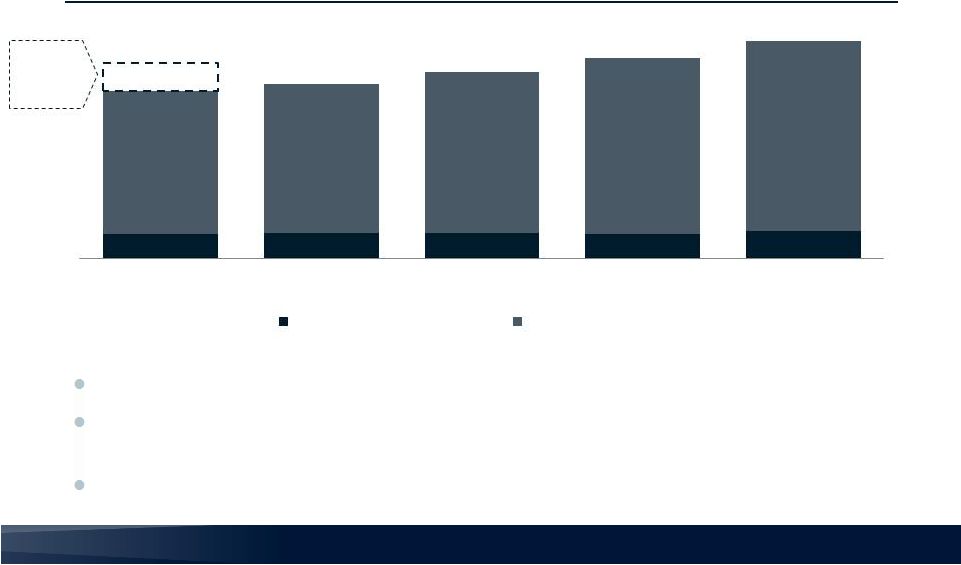
Net Interest Income
Net interest income increased by $2.6 million from the second quarter
Average
interest-earning
assets
increased
by
$370
million,
or
10%
from
the
second
quarter
Average cost of interest-bearing liabilities declined by 5 bps to 0.97%
Average deposit cost of 0.70%, down 4 bps from the second quarter
Net Interest Income
($ in millions)
+7%
$26.9
$33.3
$35.2
$35.6
$38.2
3Q 2013
4Q 2013
1Q 2014
2Q 2014
3Q 2014 |
 5
5
Noninterest Income
Mortgage banking income increased $0.8 million to $26.9 million for the third quarter
Gain
on
sale
of
loans
of
$10.3
million
for
the
third
quarter,
an
increase
of
$7.2
million
compared
to
the
prior
quarter, driven primarily by the sale of $73 million of unpaid principal balance of seasoned
SFR mortgage loan pools with a carrying value of $50 million for a gain of $7.7
million The Palisades Group (TPG) fee income increased $1.5 million compared to the
prior quarter Noninterest Income
($ in millions)
$16.2
$15.0
$17.3
$26.1
$26.9
$4.2
$2.6
$3.0
$10.3
$1.5
$3.2
$5.4
$6.2
$6.9
$12.1
$18.2
$34.5
$25.3
$35.4
$44.1
3Q 2013
4Q 2013
1Q 2014
2Q 2014
3Q 2014
Mortgage Banking
Gain on Sale of Loans
All Other
Branch Sale |
 6
6
887
966
788
749
757
431
418
429
471
504
31
1,318
1,384
1,217
1,220
1,292
3Q 2013
4Q 2013
1Q 2014
2Q 2014
3Q 2014
Residential Lending
Bank / TPG / HoldCo
PCB
Noninterest Expenses
Q3 included $2.4 million of one-time expenses, including expense related to the
acquisition and integration of Popular branches
Volume-related loan expenses¹
increased by $0.9 million during Q3 loan production volumes remained strong
$3.8 million increase in base expenses due higher occupancy costs related to new branch and
loan office expansion, higher professional fees related to SOX and audit processes,
and higher marketing and community development
expense tied to new market expansion
Q3 employee count increase primarily driven by 31 hires³
related to staffing in advance of the Popular transaction in
operations, call center and BSA departments
Noninterest Expense
($ in millions)
Number of Employees
(Headcount)
2
$57.8
$60.5
$57.2
$52.3
1
$67.6
3
1 Includes mortgage-related commissions, bonus and loan-related expenses;
3 Includes staffing in advance of Popular transaction
2 Includes Banc Home Loans, CS Financial, RenovationReady, Portfolio and Warehouse
Lending $43.5
$46.0
$49.1
$48.2
$52.0
$8.8
$11.3
$8.7
$12.3
$13.2
$2.4
3Q 2013
4Q 2013
1Q 2014
2Q 2014
3Q 2014
Base
Volume-Related
Acquisition/Non-core |
 7
7
Balance Sheet
3Q 2014
2Q 2014
Cash and All Deposits in Financial Institutions
$ 187
$ 260
Securities
310
233
Loans Held for Sale
1,127
1,096
Loans Held for Investment
2,712
2,602
ALLL
(25)
(23)
All Other Assets
227
218
Total Assets
$ 4,538
$ 4,387
Deposits
$ 3,632
$ 3,347
FHLB Advances / Fed Funds Purchased
305
450
Notes Payable
96
96
All Other Liabilities
59
53
Total Liabilities
4,091
3,947
Equity
447
439
Total Liabilities and Equity
$ 4,538
$ 4,387
($ in millions, period ending balances)
* Figures may not foot due to rounding |
 Organic Loan
Growth Total Loans (HFS/HFI)
($ in millions)
Gross loan balances +$141 million compared to Q2 (+4% QoQ)
Multifamily balances +$133 million from the prior quarter
Residential mortgage balances (SFR/HFS) +$10 million from the prior quarter
* All Balances Period-End
8
$300
$347
$374
$455
$464
$636
$696
$741
$801
$915
$1,917
$2,003
$2,159
$2,309
$2,318
$110
$116
$123
$134
$142
$2,963
$3,163
$3,397
$3,698
$3,839
C&I/SBA/Leasing
CRE/MF
SFR/HFS
Other Consumer
3Q 2013
4Q 2013
1Q 2014
2Q 2014
3Q 2014 |
 Total Loans:
$4.9B Yield: 4.6%
Total Loans: $3.8B
Yield: 4.6%
Total Loans: $1.1B
Yield: 4.6%
Commercial loans now represent a majority of pro-forma loans
Pro-forma loan mix provides portfolio diversification through lower residential mortgage
concentration, increased CRE and Multi-family balances
Popular branches and relationships provide a platform for continued growth
Pro-Forma
Popular Community Bank CA
(9/30/14 period end)
Banc of California
(9/30/14 period end)
* C&I includes C&I, SBA and Leasing
* CRE includes CRE and Construction
Diversification of Loan Mix Through Popular Transaction
9
Residential
31%
CRE
14%
Multi
family
10%
C&I
12%
Other
4%
HFS
29%
CRE
46%
Multifamily
45%
C&I
6%
Other
3%
Residential
24%
CRE
21%
Multifamily
18%
C&I
11%
Other
3%
HFS
23% |
 10
10
Deposit Portfolio
Total Deposits
($ in billions)
Branch
Sale
$463mln
Deposit balances +$284 million compared to Q2 (+8% QoQ)
Money market balances +$151 million, interest-bearing checking balances +$91 million
and noninterest-bearing checking balances +$49 million compared to the second
quarter Focused on continued growth of core deposit portfolios
$2.8
$2.9
$3.1
$3.3
$3.6
* All Balances September 30, 2014 Period-End
$0.42
$0.43
$0.43
$0.41
$0.46
$2.38
$2.49
$2.68
$2.94
$3.17
3Q 2013
4Q 2013
1Q 2014
2Q 2014
3Q 2014
Noninterest
bearing Deposits
Interest
bearing Deposits |
 11
11
11
Pro-forma deposit base with increased balances
and lower blended cost of deposits
Current pro-forma deposit costs are 5 bps lower
than initial expectation at deal announcement
Continued focus on reducing deposit costs toward
goal of 0.50% (based on current interest rate
environment)
Total Deposits: $4.6B
Cost of Deposits: 0.64%
Lowering Cost of Deposits through Popular Transaction
Total Deposits: $3.5B
Cost of Deposits: 0.70%
Total Deposits: $1.1B
Cost of Deposits: 0.44%
Pro-Forma
Popular Community Bank CA
(9/30/14 period end)
Banc of California
(3Q14 average balance)
Cost of Deposits
0.50%
0.77%
0.76%
0.74%
0.70%
0.64%
4Q 2013
1Q 2014
2Q 2014
3Q 2014
Pro-forma
DDA/Now
34%
Savings
27%
MMDA
19%
CDs
20%
DDA/Now
31%
Savings
9%
MMDA
41%
CDs
19%
DDA/Now
33%
Savings
23%
MMDA
24%
CDs
20% |
 12
12
Strong Capital Position
4Q 2013
1Q 2014
2Q 2014
3Q 2014
Pro-forma
Banc of California, Inc.
Tangible common equity to tangible assets
5.7%
5.1%
7.3%
7.2%
6.4%
Tier 1 leverage ratio
8.0%
7.6%
9.9%
9.3%
8.0%
Tangible book value per share
$10.06
$9.94
$11.45
$11.34
$10.67
Tangible
book
value
per
share,
adjusted
$10.06
$9.94
$9.66
$9.89
$9.49
Banc of California, N.A.
Tier 1 leverage ratio
9.6%
9.4%
9.7%
9.8%
Tier 1 risk based capital ratio
13.6%
13.5%
13.8%
14.8%
Total risk based capital ratio
14.7%
14.5%
14.9%
15.8%
1 Tangible equity per common stock and shares issuable under purchase contracts. Represents
the effect on TBV/share including conversion of TEUs to common shares 2 Pro-forma
for close of Popular transaction and capital commitments from Oaktree and Patriot based on 9/30/14 balance sheet; Includes estimated intangibles of
$13 million for the Popular branch acquisition
1
2 |
 13
13
4Q 2013
1Q 2014
2Q 2014
3Q 2014
Total Loans (HFI + HFS)
$3.2 billion
$3.4 billion
$3.7 billion
$3.8 billion
Delinquent non-PCI loans to total non-PCI
loans
2.43%
2.21%
2.69%
2.08%
Non-performing Loans, excluding PCI loans
$31.6
$32.4
$41.6
$38.3
NPLs / Loans (HFI)
1.29%
1.35%
1.60%
1.41%
NPAs / Assets
0.87%
0.81%
0.96%
0.86%
Net Charge Offs (recoveries)
$0.7
$(0.2)
$(0.3)
$0.2
Provision for Loan Losses
$1.8
$1.9
$2.1
$2.8
ALLL ($)
$18.8
$20.0
$22.6
$25.3
ALLL to Originated Loans
1.45%
1.43%
1.34%
1.33%
ALLL & Discount / Loans
6.99%
6.32%
5.65%
4.45%
ALLL / NPLs
59%
62%
54%
66%
Asset Quality
($ in millions unless otherwise noted) |
 14
14
1%
ROAA
ROATCE
Net
Interest
Margin
Efficiency Ratio
3.75 –
4.00%
Performance Versus Financial Targets
15%
70 –
75%
1 Net Interest Margin shown for Banc of California, N.A. subsidiary. Excludes Holding
Company debt interest expense. Stated Financial Targets
The Board Of Directors appointed Steven Sugarman as CEO of the Company’s principal
operating subsidiary, Banc of California, N.A. in 4Q 2013. During the 4 quarters
since his appointment (4Q13 thru 3Q14) the Company’s consolidated cumulative net
income to common shareholders was $20 million, compared to an $(8) million loss the
prior 4 quarters. This represents a year over year improvement of approximately $28 million.
-1.0%
0.4%
0.1%
0.8%
1.0%
3Q 2013
4Q 2013
1Q 2014
2Q 2014
3Q 2014
-14.8%
6.0%
0.9%
12.0%
13.2%
3Q 2013
4Q 2013
1Q 2014
2Q 2014
3Q 2014
116%
84%
96%
85%
82%
3Q 2013
4Q 2013
1Q 2014
2Q 2014
3Q 2014
3.48%
4.05%
4.19%
3.88%
3.78%
3Q 2013
4Q 2013
1Q 2014
2Q 2014
3Q 2014
1 |