Attached files
| file | filename |
|---|---|
| 8-K - 8-K - Everi Holdings Inc. | a14-22441_18k.htm |
|
|
Investor Presentation October 29, 2014 PRIVILEGED AND CONFIDENTIAL Exhibit 99.1 |
|
|
Disclaimer 2 Forward-Looking Statements; Non-GAAP Financial Measures Throughout this presentation regarding the merger transaction between Global Cash Access Holdings, Inc. (“GCA”) and Multimedia Games Holding Company, Inc. (“Multimedia Games”), we make forward-looking statements within the meaning of the U.S. Private Securities Litigation Reform Act of 1995. Forward-looking statements may be typically identified by such words as “may,” “will,” “should,” “would,” “expect,” “anticipate,” “plan,” “likely,” “believe,” “estimate,” “project,” “intend,” and other similar expressions among others. Although we believe the expectations reflected in any forward-looking statements are reasonable, they involve known and unknown risks and uncertainties, are not guarantees of future performance, and actual results, performance or achievements may differ materially from any future results, performance or achievements expressed or implied by such forward-looking statements and any or all of our forward-looking statements may prove to be incorrect. Consequently, no forward-looking statements may be guaranteed and there can be no assurance that the actual results or developments anticipated by such forward looking statements will be realized or, even if substantially realized, that they will have the expected consequences to, or effects on, GCA or its business or operations. Factors which could cause our actual results to differ from those projected or contemplated in any such forward-looking statements include, but are not limited to, the following factors: (1) the risk that the conditions to the closing of the merger are not satisfied (including a failure of the shareholders of the Multimedia Games to approve, on a timely basis or otherwise, the merger and the risk that regulatory approvals required for the merger are not obtained, on a timely basis or otherwise, or are obtained subject to conditions that are not anticipated); (2) litigation relating to the merger; (3) uncertainties as to the timing of the consummation of the merger and the ability of each of GCA and Multimedia Games to consummate the merger; (4) risks that the proposed transaction disrupts the current plans and operations of GCA; (5) the ability of GCA to retain and hire key personnel; (6) competitive responses to the proposed merger; (7) unexpected costs, charges or expenses resulting from the merger; (8) the failure by us to obtain the necessary debt financing arrangements set forth in the commitment letter received in connection with the merger; (9) potential adverse reactions or changes to business relationships resulting from the announcement or completion of the merger; and (10) legislative, regulatory and economic developments. The foregoing review of important factors that could cause actual events to differ from expectations should not be construed as exhaustive and should be read in conjunction with statements that are included herein and elsewhere, including the risk factors included in GCA’s and Multimedia Games’ most recent Annual Reports on Form 10-K, and our more recent Quarterly Reports on Form 10-Q and Current Reports on Form 8-K filed with the U.S. Securities and Exchange Commission. GCA can give no assurance that the conditions to the merger will be satisfied. Except as required by applicable law, GCA undertakes no obligation to revise or update any forward-looking statement, or to make any other forward-looking statements, whether as a result of new information, future events or otherwise. GCA does not intend, and assumes no obligation, to update any forward-looking statements. Readers are cautioned not to place undue reliance on forward-looking statements, which speak only as of the date of this communication. Additional Notes This presentation may contain industry market data, industry forecasts and other statistical information. Such information has been obtained from publicly available information and industry publications. GCA has not independently verified such information and makes no representations as to the accuracy of such information. Non-GAAP Financial Measures This presentation includes financial measures that were not prepared in accordance with generally accepted accounting principles in the United States (GAAP). As used herein, Adjusted EBITDA is a non-GAAP measurement presented herein as a supplemental disclosure. GCA defines Adjusted EBITDA as earnings before interest income and expense, income taxes, depreciation, amortization, and equity compensation expense. Multimedia Games defines Adjusted EBITDA as net income before net interest expense, income taxes, depreciation, amortization and accretion of contract rights. As shown in this presentation, Adjusted EBITDA for the combined company is presented based on the combination of GCA’s consolidated Adjusted EBITDA and Multimedia Games’ consolidated Adjusted EBITDA for the trailing 12-month period ended June 30, 2014, taking into account synergies GCA expects to achieve. Adjusted EBITDA is presented herein for informational purposes only and does not represent “pro forma” amounts determined in accordance with SEC rules and regulations. |
|
|
Today’s Presenters and Agenda 3 Transaction Rationale Global Cash Access Overview Multimedia Games Overview Investment Highlights Q&A Ram V. Chary President & CEO, Global Cash Access Randy L. Taylor EVP & CFO, Global Cash Access Mark Labay SVP, Strategic Development, Global Cash Access Adam Chibib President & CFO, Multimedia Games Agenda Presenters |
|
|
Transaction Summary 4 Note: Reflects annualized run-rate synergies. Includes fees on the new Revolver, the new Term Loan B and the new Senior Notes, as well as M&A, legal and other transactional fees for both companies. GCA cash is calculated as available cash plus settlement receivables minus settlement liabilities. GCA Adj. EBITDA excludes stock-based compensation. MGAM Adj. EBITDA excludes stock-based compensation and accretion of contract rights. Multiple assumes MGAM adjusted EBITDA which excludes stock-based compensation and accretion of contract rights. 9.1x LTM 6/30/14 Adjusted EV/EBITDA(4) multiple, excluding anticipated synergies 7.2x LTM 6/30/14 Adjusted EV/EBITDA(4) multiple, including synergies Sources Amount New Term Loan B $800 New Senior Notes 400 Draw from Revolver 14 Cash from Balance Sheet (MGAM) 129 Total Sources of Funds $1,343 Uses Amount Purchase MGAM Equity $1,152 Refinance GCA Term Loan 96 Refinance MGAM Term Loan 27 Fees & Expenses (1) 68 Total Uses of Funds $1,343 ($ in millions) GCA Actual MGAM Actual Pro Forma Maturity 6/30/2014 6/30/2014 Adj. 6/30/2014 Cash & Cash Equivalents (2) $12 $129 ($129) $12 New Revolver ($50) 5 Years – – $14 $14 New Term Loan B 7 Years – – 800 800 Existing Term Loan Facility (GCA) 3/1/2016 96 – (96) -- Existing Term Loan Facility (MGAM) 8/3/2016 – 27 (27) -- Secured Debt $96 $27 $691 $814 New Senior Notes 8 Years – – $400 $400 Total Debt $96 $27 $1,091 $1,214 LTM Financials Revenue $582 $218 -- $800 Adj. EBITDA (3) 71 116 -- 187 Synergies – – 30 30 Pro Forma Adj. EBITDA $71 $116 $30 $217 Credit Statistics Secured Debt / Pro Forma Adj. EBITDA 1.3x 0.2x 3.8x Total Debt / Pro Forma Adj. EBITDA 1.3x 0.2x 5.6x Net Debt / Pro Forma Adj. EBITDA 1.2x (0.9x) 5.5x |
|
|
Transaction Rationale |
|
|
Compelling Strategic and Financial Rationale 6 Strategic Rationale Combines the global leader in cash access services with the fastest growing U.S. based manufacturer and supplier of gaming machines and systems to casino operators Accelerates MGAM’s entry into new markets through GCA’s first-class compliance / licensing infrastructure and broader sales / distribution footprint Broadens GCA’s product and service offerings and further enhances recurring revenue Provides significant cross selling potential and leverage across an established sales force and global customer base Financial Rationale Accelerates scale and growth profile ~85%+ recurring revenue provides predictable and stable cash flow generation Creates meaningful synergies with ~80% of estimated annual synergies to be achieved during year 1 Combine back office/administrative operations and field services (Headcount) Duplicative public company costs Other SG&A (e.g. marketing, promotions, insurance, rent, etc.) avings Substantial cash flow will drive material deleveraging Expected ability to utilize GCA NOL’s of ~$110 million over the next 3 years with continued ability to use GCA’s tax deductible goodwill through 2019 Transformational combination positions GCA as a leading provider of unique gaming floor solutions Other SG&A (e.g. marketing, promotions, insurance, rent, etc.) Manufacturing / Assembly cost savings Combine back office/administrative operations and field services (Headcount) Duplicative public company costs Other SG&A (e.g., marketing, promotions, insurance, rent, etc.) Manufacturing / Assembly cost savings |

|
|
Combined Company Products and Services Overview 7 Class II Games: Played on servers, which must be physically located on Tribal Lands. Provide customers with a variety of linked interactive slot games and back-office systems CXC 4.0: Integrated full service solution for ticket redemption, bill breaking and cash access services. Using ATM 3-in-1 Rollover technology, CXC 4.0 offers maximum feature functionality and ease in delivering cash to the casino floor Premium Games “High Rise”: Premium games combine video and traditional mechanical reel games. Developed to look "licensed" without added cost and with more game flexibility JackpotXchange: Automate jackpot payments and process jackpots in system and dispense the proper amount for player payment TournEvent: “Gotta have” slot tournament product with features including streaming video, automated emcee and real-time leaderboards. Significant market share with more than 4,000 units in ~275 casinos E-poker / E-tables: Fast paced, electronic table games NEWave: Suite of anti-money laundering and compliance software for gaming operators |
|
|
Highly Differentiated Products on the Casino Floor 8 Electronic Table Game Electronic Table Game TournEvent Cash Kiosk Integrated Kiosk ATM Electronic Gaming Machines Electronic Gaming Machines |
|
|
Increased Diversification and Scale GCA + MGAM Revenue: $800 million GCA MGAM Revenue: $582 million Revenue: $218 million + = LTM 6/30/14 Revenue by Segment: GCA + MGAM 9 LTM 6/30/2014 Adjusted EBITDA ($mm): GCA + MGAM + + = Adj. EBITDA: $217 million (1) (2) Note: Data as of LTM period ended 6/30/14. MGAM revenue shown on a net basis. Excludes stock-based compensation. Excludes stock-based compensation and accretion of contract rights. Reflects annualized run-rate synergies. Previously identified GCA cost savings to be implemented independent of the transaction. Reflects annualized run-rate synergies. Synergies portion includes previously identified GCA cost savings. (3) (4) 66% 30% 3% Gaming Operations Machine Sales Other 35% 29% 18% 8% 7% 3% ATM Cash Advance Gaming Operations Machine Sales Other Check Services 33% 53% 14% GCA MGAM Synergies $116 MGAM 48% 40% 8% 4% ATM Cash Advance Other Check Services $71 GCA |

|
|
Global Cash Access Overview |
|
|
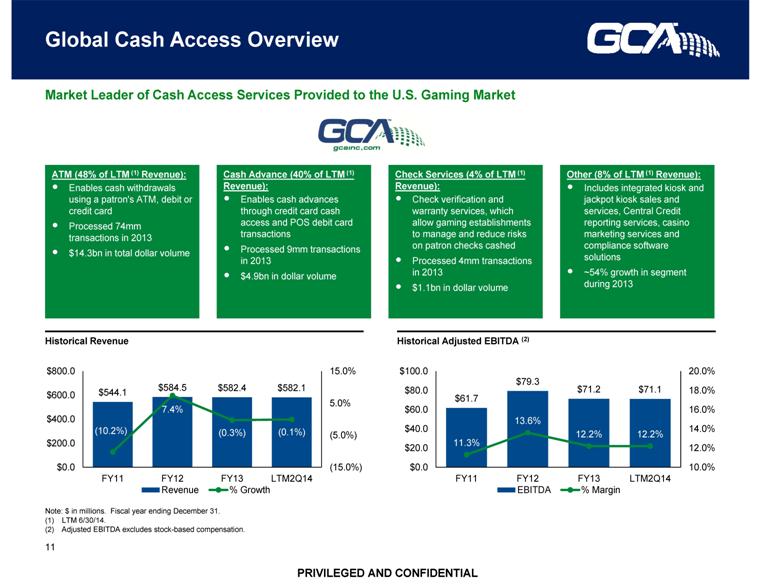
Global Cash Access Overview 11 Note: $ in millions. Fiscal year ending December 31. LTM 6/30/14. Adjusted EBITDA excludes stock-based compensation. Market Leader of Cash Access Services Provided to the U.S. Gaming Market Historical Revenue Historical Adjusted EBITDA (2) ATM (48% of LTM (1) Revenue): Enables cash withdrawals using a patron's ATM, debit or credit card Processed 74mm transactions in 2013 $14.3bn in total dollar volume Check Services (4% of LTM (1) Revenue): Check verification and warranty services, which allow gaming establishments to manage and reduce risks on patron checks cashed Processed 4mm transactions in 2013 $1.1bn in dollar volume Cash Advance (40% of LTM (1) Revenue): Enables cash advances through credit card cash access and POS debit card transactions Processed 9mm transactions in 2013 $4.9bn in dollar volume Other (8% of LTM (1) Revenue): Includes integrated kiosk and jackpot kiosk sales and services, Central Credit reporting services, casino marketing services and compliance software solutions ~54% growth in segment during 2013 |
|
|
ATM Segment 12 Overview Segment revenue driven by volume of ATM withdrawals When ATM withdrawal is processed, GCA is paid on a fixed-fee basis ATM fee is paid to GCA by the patron Reverse interchange fee is paid to GCA from card issuing Bank Commission is paid to the land owner (casino) for the right to operate on the premises ($MM) Revenue & Margin (MM) ($) Selected Financial Metrics Number of Transactions $326.0 $314.6 $283.7 $303.2 $286.0 13.5% 13.1% 12.3% 10.7% 8.9% 0.0% 10.0% 20.0% 30.0% $0.0 $100.0 $200.0 $300.0 $400.0 2009 2010 2011 2012 2013 Revenues (in $MM) Operating Margin 83.4 78.3 68.8 72.3 66.2 $3.91 $4.02 $4.12 $4.19 $4.32 $3.00 $4.00 $5.00 $6.00 0.0 20.0 40.0 60.0 80.0 100.0 2009 2010 2011 2012 2013 Number of transactions completed (in MM) Revenue per Transaction |
|
|
Cash Advance Segment 13 ($MM) (MM) ($) Segment revenue driven by the number of credit card cash access/debit POS transactions and the average value of the transaction Fees charged as a % of cash advanced Overview Selected Financial Metrics Revenue & Margin Number of Transactions $289.3 $244.1 $203.9 $227.5 $231.1 21.9% 20.3% 18.9% 28.0% 26.4% 0.0% 10.0% 20.0% 30.0% 40.0% 50.0% $0.0 $100.0 $200.0 $300.0 $400.0 2009 2010 2011 2012 2013 Revenues (in $MM) Operating Margin 11.7 10.1 8.4 9.0 8.8 $24.73 $24.17 $24.27 $25.28 $26.26 $24.00 $26.00 $28.00 $30.00 0.0 2.0 4.0 6.0 8.0 10.0 12.0 14.0 2009 2010 2011 2012 2013 Number of transactions completed (in MM) Revenue per Transaction |
|
|
Check Services and Other Segments 14 Overview Check Services Segment revenue driven by number of checks presented and accepted Fee paid to GCA is a fixed percentage of check amount warranted Consists of revenue primarily derived from: Kiosk sales, parts and services Western Money Systems (acquired in May 2010) Central Credit reporting services Subscription service providing access to a database of gaming patron credit histories (helps manage credit risk) NEWave (acquired in April 2014) AML and tax filing software used in casino cages Other Selected Financial Metrics ($MM) Revenue & Margin (MM) ($) Number of Transactions Revenue & Margin ($MM) Acquired integrated kiosk company Western Money in 2010, changing segment cost structure. (1) $38.5 $28.4 $26.3 $25.4 $21.6 56.0% 55.7% 54.0% 54.8% 57.2% 40.0% 50.0% 60.0% 70.0% 80.0% $0.0 $15.0 $30.0 $45.0 2009 2010 2011 2012 2013 Revenues (in $MM) Operating Margin 6.3 4.9 4.4 4.3 3.7 $6.11 $5.80 $5.98 $5.91 $5.84 $5.00 $6.00 $7.00 $8.00 0.0 1.0 2.0 3.0 4.0 5.0 6.0 7.0 2009 2010 2011 2012 2013 Number of transactions completed (in MM) Revenue per Transaction $13.9 $18.5 $30.2 $28.4 $43.7 81.9% 61.7% 49.0% 50.9% 45.0% 20.0% 40.0% 60.0% 80.0% 100.0% $0.0 $15.0 $30.0 $45.0 $60.0 2009 2010 2011 2012 2013 Revenues (in $MM) Operating Margin |

|
|
Selected Key Historical Operating Metrics 15 Number of Transactions (mm) Total Transaction Value ($bn) Dollar Volume Per Transaction Revenue Per Transaction ($) (mm) ($bn) 70.0 80.0 90.0 Cash Advance ATM ($) Transaction Commentary 2009 to 2010 decline in patron visits given broader economic downturn Lost Caesars contract in November 2010 Acquired MCA Processing in November 2011 (processor for a portion of Caesars) Lost Mohegan Sun contract in March 2013 General decline in ATM transactions given increase in average service fees However, patrons withdrawing more cash per transaction (higher dollar volume per transaction) Overall cash to gaming floor has remained relatively flat recently 64.8 8.9 6.3 4.9 4.4 4.3 3.7 3.6 11.7 10.1 8.4 9.0 8.8 8.8 83.4 78.3 68.8 72.3 66.2 16.205 0.0 10.0 20.0 30.0 40.0 50.0 2009 2010 2011 2012 2013 LTM $1.5 $1.1 $1.1 $1.2 $1.1 $1.1 $5.7 $5.0 $4.3 $4.8 $4.9 $5.0 $14.5 $13.6 $12.2 $13.6 $12.9 $12.7 $0.0 $5.0 $10.0 $15.0 $20.0 $25.0 2009 2010 2011 2012 2013 LTM |
|
|
New Solution-Based Sales Strategy 16 Implemented by GCA’s new management team to more aggressively cross-sell product suite in response to customer demand Focuses on integrated solution sales approach (e.g. integrated kiosks, ATM, cash advance and compliance software) over individual product transactions Solution-based offering typically yields higher margins and longer term contracts The goal is to transition to a 5 year contract duration from current average 3 year contract duration GCA’s new solution-based strategy has been well received by current clients, as seen with recent renewals, including the Seminole Tribe of Florida, Station Casinos, Foxwoods, Penn National Gaming and others Highlights Global Cash Access’ product differentiation, which creates significant barriers to entry versus the competition |
|
|
Product and Solutions Overview 17 Xchange Kiosks CXC 4.0 Cash Access and Cash Handling Ticket/Multi-Ticket Redemption Bill Breaking ATM, Credit Card, POS Debit Transactions GCA Patented ATM 3-in-1 Rollover Points to Cash/Points to Voucher Ticket Out – Coinless Operation (where approved) Quik Ticket – Slot Ticket or Cash Option (where approved) Integrated Solutions Marketing Intelligence JackpotXchange Automate jackpot payments Process jackpots in system and dispense the proper amount for player payment Selected Products and Solutions Player Loyalty & TITO Interface Gaming payment solutions Broad suite of casino solutions interface with a multitude of player loyalty and Ticket In Ticket Out (TITO) systems of gaming payments Central Credit/Check Warranty Only credit bureau exclusively focused on gaming patrons Established communication link through computer system with Experian and Trans Union Check Warranty Services allows casinos to cash more checks for larger amounts Also designed to collect on delinquent checks Casino Cash Plus ATM Quick and easy casino cash access through simple casino ATM cash withdrawals, casino credit card advance and POS DEBIT card transactions CasinoDirect All International Cards accepted Pay using home currency Higher limits than ATMs Anti-Money Laundering and Tax Compliance Software Suite of cutting-edge compliance software for gaming operators Uses data on patron cash access activity across multiple gaming establishments to help develop, implement and refine gaming operator customer loyalty programs QuikReports - browser-based reporting tool that provides marketing professionals with real-time access to and analysis of information on patron cash access activity Casino Share Intelligence and QuikMarketing - database services that allow GCA to query proprietary patron transaction database using criteria supplied by the gaming establishment |

|
|
Competitive Landscape 18 GCA competitors include providers of cash access products and services, equipment manufacturers, financial institutions and other regional and local banks that operate ATMs on the premises of gaming establishments Cash Access Services Kiosks Information Services Standard ATM 3-in-1 ATM Cash Advance Check Warranty Cash Advance Check Warranty Standard ATM Standard ATM Cash Advance Standard ATM Cash Advance Check Warranty Fully Integrated Kiosks Reporting Marketing Full Service Kiosks Central Credit Marketing Compliance, Audit and Data Services ____________________ (1) On September 30, 2014, Global Payments announced it has agreed to purchase the gaming assets of Certegy’s check services from Fidelity National Information Services. The transaction is expected to close in 2015. (1) |
|
|
Multimedia Games Overview |
|
|
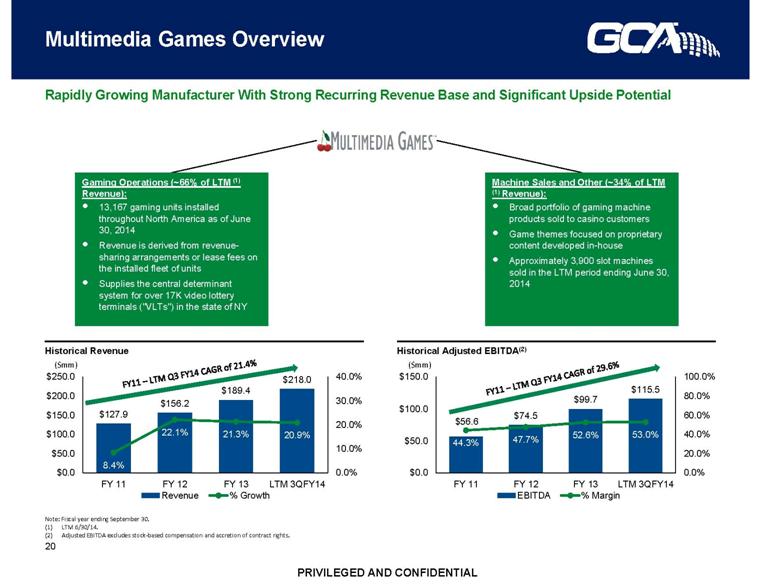
Multimedia Games Overview 20 Note: Fiscal year ending September 30. LTM 6/30/14. Adjusted EBITDA excludes stock-based compensation and accretion of contract rights. Rapidly Growing Manufacturer With Strong Recurring Revenue Base and Significant Upside Potential Historical Revenue Historical Adjusted EBITDA(2) Gaming Operations (~66% of LTM (1) Revenue): 13,167 gaming units installed throughout North America as of June 30, 2014 Revenue is derived from revenue-sharing arrangements or lease fees on the installed fleet of units Supplies the central determinant system for over 17K video lottery terminals ("VLTs") in the state of NY Machine Sales and Other (~34% of LTM (1) Revenue): Broad portfolio of gaming machine products sold to casino customers Game themes focused on proprietary content developed in-house Approximately 3,900 slot machines sold in the LTM period ending June 30, 2014 FY11 – LTM Q3 FY14 CAGR of 29.6% FY11 – LTM Q3 FY14 CAGR of 21.4% ($mm) ($mm) |
|
|
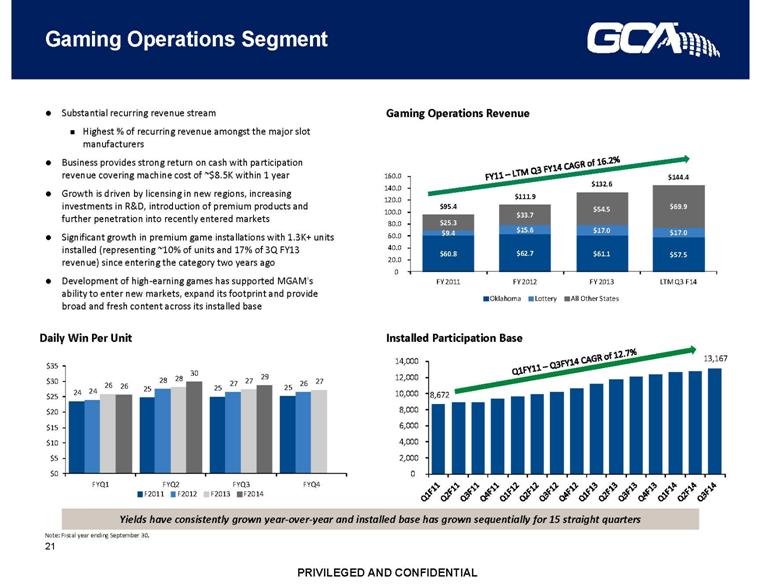
Gaming Operations Segment 21 Substantial recurring revenue stream Highest % of recurring revenue amongst the major slot manufacturers Business provides strong return on cash with participation revenue covering machine cost of ~$8.5K within 1 year Growth is driven by licensing in new regions, increasing investments in R&D, introduction of premium products and further penetration into recently entered markets Significant growth in premium game installations with 1.3K+ units installed (representing ~10% of units and 17% of 3Q FY13 revenue) since entering the category two years ago Development of high-earning games has supported MGAM's ability to enter new markets, expand its footprint and provide broad and fresh content across its installed base Daily Win Per Unit Installed Participation Base Gaming Operations Revenue Q1FY11 – Q3FY14 CAGR of 12.7% FY11 – LTM Q3 FY14 CAGR of 16.2% Yields have consistently grown year-over-year and installed base has grown sequentially for 15 straight quarters Note: Fiscal year ending September 30. 24 25 25 25 24 28 27 26 26 28 27 27 26 30 29 $0 $5 $10 $15 $20 $25 $30 $35 FYQ1 FYQ2 FYQ3 FYQ4 F2011 F2012 F2013 F2014 $60.8 $62.7 $61.1 $57.5 $9.4 $15.6 $17.0 $17.0 $25.3 $33.7 $54.5 $69.9 $95.4 $111.9 $132.6 $144.4 0 20.0 40.0 60.0 80.0 100.0 120.0 140.0 160.0 FY 2011 FY 2012 FY 2013 LTM Q3 F14 Oklahoma Lottery All Other States 8,672 13,167 0 2,000 4,000 6,000 8,000 10,000 12,000 14,000 |
|
|
Machine Sales and Other Segments 22 Outside of historical core markets of Oklahoma and Washington, MGAM's current floor share of ~1.5% is well below recent ship shares of ~3-4% (~10%+ in some states) suggesting significant room for growth as operators continue to refresh slot product MGAM was the largest non-Big 5 vendor and achieved a 3.3% ship share in 2Q CY14 (~24% of non-Big 5 sales) and 4.0% ship share in 1Q CY14 (~29% of non-Big 5 sales)(1) MGAM has achieved strong unit sales growth without the benefit of a replacement sale of a MGAM machine Unit sales revenue has grown at a CAGR of 34.8% from FY2011-LTM Q3 FY14 Strong unit growth with penetration of recently entered markets has driven machine sales revenue growth Average Sales Price (“ASP”) of slot machines has decreased over the past year, which is reflective of a competitive supplier environment and reduced capital spend by operators Other revenue includes gaming systems, maintenance and service contracts, entry fees and partnerships associated with the National TournEvent of Champions, etc. Average Sales Price ($) Annual Unit Sales Machine Sales and Other Revenue ($ mm) FY11 – LTM Q3 FY14 CAGR of 34.8% Note: Fiscal year ending September 30. Source: Eilers-Fantini slot survey. $30.9 $42.8 $54.5 $71.1 $1.5 $1.4 $2.2 $2.5 $32.4 $44.2 $56.7 $73.6 $0.0 $10.0 $20.0 $30.0 $40.0 $50.0 $60.0 $70.0 $80.0 FY11 FY12 FY13 LTM Q3 FY14 Unit Sales Other Revenue 1,150 1,961 2,678 3,892 0 1,000 2,000 3,000 4,000 FY11 FY12 FY13 LTM Q3 FY13 17,780 18,488 18,121 16,973 0 5,000 10,000 15,000 20,000 FY11 FY12 FY13 LTM Q3 FY14 |

|
|
Peer Recurring Revenue and Margin Comparison 23 Source: Company filings, company websites and public investor presentations. Note: Comparables include publicly listed companies only. Pro forma for acquisition of VGT which closed on October 20, 2014. Except where otherwise noted, reflects fiscal year ending September 30, 2013 for Aristocrat and fiscal year ending December 31, 2013 for VGT as provided in VGT acquisition investor presentation. As of March 2014. (3) BYI adjusted to pro forma for full year of operations from SHFL entertainment. Installed recurring revenue unit count includes ~12.5K video lottery devices which typically yield lower revenue per unit than slot machines. (4) SGMS figures include only the gaming segment and exclude the lottery segment. Installed recurring revenue unit count includes UK server-based gaming machines located outside of casino facilities. Color Scheme 0 182 229 204 204 204 106 106 106 58 125 192 0 133 81 0 74 140 (1) (4) MGAM has the highest proportion of recurring revenue and Adj. EBITDA margins amongst its public peers (3) (2) LTM Time Period Jun-14 Jun-14 FY-13 Jun-14 Jun-14 Jun-14 Recurring Revenue Installed Base (Ending) Total Units 13,167 1,989 28,400 60,772 50,500 35,443 LTM Revenue ($mm) $218 $229 $1,001 $1,371 $2,154 $819 Recurring Non-Recurring Total Adjusted EBITDA ($mm) $116 $84 $334 $492 $695 N/A EBITDA Margin 8% 92% 49% 51% 49% 51% 53% 33% 32% 66% 34% 43% 57% 36% |

|
|
Product Evolution 24 Solid Base of Business Class II and Central Determination games/systems leader MGAM has increased its presence and competitiveness across the slot floor with continuous innovation and entry into new product categories E-poker E-tables MGAM has evolved from a Class II supplier focused on the Oklahoma tribal market to a diversified gaming equipment provider with differentiated offerings catering to a diverse customer base To complement its growing product portfolio, MGAM has significantly expanded in-house game production from 21 game releases in FY10 to 65 initial releases in FY14, and 70 initial releases planned for FY15 Class III Mechanical Reel Slots TournEvent Class III Video Slots High Rise Series Maximum Player Experience (MPX) Skyline Texan HDX |

|
|
TournEvent 25 Key Features Solves the casino slot tournament problem by allowing banks of video slots to convert from in-revenue to out-of-revenue in minutes Optional automated emcee Real-time leaderboards Interactive tournament games Sign package Streaming video National TournEvent of Champions MGAM has created a national tournament around the popular product, which has generated buzz and excitement about TournEvent and broader MGAM brands Participants qualify through their player status at local casinos or through special event promotions Phase 1: Semi-Finals (Jan – Sep) In-Casino TournEvent tourneys & promos Reaches over 220,000 players, annually Phase 2: In-Casino-Finals (May – Sep) 50,000-mile cross-country tour across 23 states Reaches over 25,000 players Phase 3: National Championship (Oct) $500K guaranteed cash prize pool with 1st place awarded $200K in 2014 TournEvent is the Category Leader 73% of casino operators stated that TournEvent is the best slot tournament solution on the market "Gotta have" slot product is Multimedia Games' Trojan horse Greater performance and efficiency with in-revenue and out-of-revenue tournament play Each system installation includes, on average, 14-16 machines at $19K+ Over 4,000 units in 275 locations Deployed in ~55% of the Company's customer base and in ~26% of North American casinos Ongoing brand building through the "National TournEvent of Champions" TournEvent Installations (by location) Source: Company information. Eilers-Fantini Quarterly Slot Survey – 2Q CY14. Q3 FY11 – LTM Q3 FY14 CAGR of 107.0% 31 47 60 83 99 117 137 170 188 205 231 252 275 0 50 100 150 200 250 300 Q3 F11 Q4 F11 Q1 F12 Q2 F12 Q3 F12 Q4 F12 Q1 F13 Q2 F13 Q3 F13 Q4 F13 Q1 F14 Q2 F14 Q3 F14 |

|
|
Gaming Operations Footprint Evolution 26 Footprint Mix as % of Gaming Operations Revenue MGAM has rapidly developed its premium games footprint since entering the category two years ago and is poised to continue this trend with the upcoming release of three new premium cabinets (Platinum MPX, Skyline and Texan HDX) Significant potential for further expansion into markets outside of Oklahoma due to the following factors: Continued ramp-up in states such as CA, FL, IL, IN and LA; Further penetration of key markets in which it is in early stages of entry, including NV, NJ and PA; and Receipt of licenses in and entry into new jurisdictions within the next year, including CO, Ontario, Peru, Macau, Bahamas, etc. Premium Game Placements (units) 76.8% 66.4% 52.9% 45.1% 23.2% 32.5% 38.3% 39.6% 0.0% 1.1% 8.8% 15.3% 0% 25% 50% 75% 100% FY11 FY12 FY13 LTM 6/30/14 Oklahoma Standard Games, non - OK Premium Games, non - OK 11 97 198 318 505 713 878 1,059 1,170 1,288 0 350 700 1,050 1,400 Q2 FY12 Q3 FY12 Q4 FY12 Q1 FY13 Q2 FY13 Q3 FY13 Q4 FY13 Q1 FY14 Q2 FY14 Q3 FY14 |
|
|
Market Shares by Market Stage and State 27 Core markets of OK and WA provide earnings foundation and leadership share Early stage of penetration in many markets provides significant growth opportunity Licenses were obtained for key markets including, NV, CA, NJ and PA, over the past few years In NV, license for mechanical reel product is expected to be received in the next few months Additionally, MGAM expects to receive licenses in new jurisdictions within the next year, including CO, SD, Ontario, Peru, Macau, Bahamas and parts of Central America Source: American Gaming Association, State of the States, 2013. Oklahoma 64,786 13.3% Washington 28,007 13.4% California 68,341 3.2% Florida 19,462 4.4% Illinois 13,588 1.2% Indiana 21,963 1.3% Louisiana 40,276 1.6% 2.3% Mississippi 36,032 1.7% Michigan 34,159 1.4% New York 29,145 2.7% Wisconsin 17,997 3.1% Nevada 178,724 0.4% New Jersey 26,883 0.6% Oregon 19,536 0.0% Pennsylvania 26,510 0.6% Other Other States 227,788 1.2% 3,444 1.2% Total 853,197 2.8% MGAM Estimated Market Share Total MGAM Units Cumulative Share by Stage 1,067 Early Entry 12,386 6,590 Mature Market Stage Jurisdiction Estimated Units in State Ramping 13.3% 0.4% |
|
|
Investment Highlights |

|
|
Investment Highlights 29 Significant cross selling opportunity and potential to leverage an established sales force and global customer base Accelerates penetration into key markets and strengthens relationships with gaming operators Highly Differentiated Products on the Casino Floor Significant Recurring Revenue Across Numerous Business Segments Strong Free Cash Flow Generation and Deleveraging Profile Highly Achievable Cost Synergies Substantial Growth Opportunities Accelerated as a Combined Company |
|
|
Substantial Growth Opportunities Accelerated as a Combined Company 30 Global Cash Access [ ] Multimedia Games Select Growth Drivers Expansion of high quality product portfolio and game library 3 new premium cabinets set to launch in fiscal year 2015 8 fully staffed development teams by year end 2014 with potential to release 80+ titles per year Vertical and horizontal growth opportunity for TournEvent, among other popular products and titles Addressable market expansion Continued ship share gains and growth in recently entered markets Near to medium term international opportunities E-tables capabilities with acquisition of PokerTek Online gaming exposure through B2B licensing platform Incremental Revenue Opportunities Broadened domestic and global customer base through GCA Broad licensing footprint Significant cross-selling potential and leverage across an established sales force with longstanding casino management relationships Enhanced distribution for innovative MGAM products, which is expected to accelerate footprint growth across established, recently entered and new markets Single point of contact to service gaming operator payment and casino supply needs GCA’s strengths have the potential to further accelerate MGAM’s growth trajectory Multimedia Games products have been named in Casino Enterprise Management’s Top 10 Slot Floor Products in 2014, 2013, 2011 and 2010 |

|
|
Innovative, turnkey slot tournament solution that generates instant floor-wide buzz, higher floor traffic and increased revenue performance Eliminates hassle of chip changes, machine moves or separate tournament areas for a dynamic and interactive tournament experience Highly Differentiated Products on the Casino Floor 31 Electronic Table Game Electronic Table Game TournEvent Cash Kiosk & Integrated Kiosk Electronic Gaming Machines Electronic Gaming Machines CXC 4.0 Cash Access and Cash Handling 3-in-1 Rollover functionality Multi-function kiosk incorporating the latest cash handling and cash access services, combined with powerful marketing peripherals and high capacity components Delivers maximum velocity and patron interaction JackpotXchange Automate jackpot payments Process jackpots in system and dispense the proper amount for player payment PokerPro Offers a complete poker solution with unparalleled system security, stability and functionality 10-seat electronic poker table that allows operators to offer cash games, single-table tournaments and multi-table tournaments with an extensive game library Jackpot Factory® 5-tier progressive with four bonus features and top screen animation on the 37-inch video top box Austin, Texas headquarters provides unique base of creative talent in the gaming industry, generating fresh game content and new look and feel to gaming machine products |

|
|
Significant Recurring Revenue Across Numerous Business Segments 32 Combined GCA + MGAM ~85%+ Recurring Revenue Recurring Revenue Non-recurring Revenue LTM 6/30/14 Combined Revenue: ~$800 million GCA Contracted Revenue: GCA contracts with gaming operators have an average term life of approximately three years New solution-based contracts yield higher margins and generally have longer terms compared to historic contracts GCA contracts typically cover ATM, Cash Advance and Check Services Other GCA contracted revenue consists of Central Credit and other services GCA has a patent on 3-in-1 Rollover ATM technology that does not expire until 2018, resulting in a competitive advantage Gaming Operations: Gaming operations revenue is primarily derived from participation or daily lease fees on Class II and Class III gaming machines With its largest customer, the Chickasaw Nation, MGAM enters into contracts that generally last for 12 to 83 months (average of ~60 months) With other gaming operations customers, MGAM also receives a % of net win or daily lease fee, though not on a long-term contractual basis MGAM’s contract to supply the central determinant system for the NY Lottery (7-year contract through December 2017) provides recurring revenue from ~17K video lottery terminals Vast majority of recurring revenue is comprised of long term contracts ATM Cash Advance Check Services Other GCA Contracted Revenue Gaming Operations Machine Sales Other 35% 29% 3% 2% 18% 8% 5% ATM Cash Advance Check Services Other GCA Contracted Revenues Gaming Operations Machine Sales Other |

|
|
Strong Free Cash Flow Generation and Deleveraging Profile 33 The pro forma business will generate significant cash flow for deleveraging GCA Adj. EBITDA excludes stock-based compensation. MGAM Adj. EBITDA excludes stock-based compensation and accretion of contract rights. Reflects annualized run-rate synergies. Includes previously identified GCA cost savings to be implemented independent of the transaction. Normalized placement fees assumes $10mm per year based on $50mm of payments to secure Chickasaw unit placement every five years. Reflects pro forma utilization of GCA NOLs which are expected to shield the combined company from federal taxes through 2016. Includes GCA LTM cash usage fees on vault cash and PF interest income and interest expense on new debt. (3) (4) (5) Illustrative Pro Forma LTM 6/30/14 Free Cash Flow Bridge MGAM GCA (1) ($mm) Maintain disciplined approach to deploy capital under new policy Free cash flow prioritized to pay debt Focus on deleveraging, expecting to achieve leverage below 3x within 4 years (2) $71.1 $115.5 $140.4 $66.6 ($10.0) ($12.1) $186.6 $30.0 ($52.2) ($2.0) ($73.8) $0.0 $50.0 $100.0 $150.0 $200.0 $250.0 LTM PF ADJ. EBITDA Anticipated Synergies Combined Capex, R&D and Placement Fee Combined Cash Taxes Cash Flow Available for Debt Service PF Cash Interest LTM PF FCF Available for Debt Repayment |

|
|
Highly Achievable Cost Synergies 34 Total Headcount $17mm Includes salaries and wages, annual incentive bonus, employee benefits & taxes and long term incentive plans 17% reduction in combined headcount $1.7mm related to MGAM executive compensation program Public Company Costs $2mm Includes audit fees, tax fees, board of directors fees, legal fees and D&O liability insurance Duplicative Costs $8mm ~30% reduction in duplicative/overlapping operations Includes COGS, advertising & promotion, dues & subscriptions, insurance, rent, supplies, etc. Previously Identified GCA Cost Savings $3mm $2.2mm in other cost reductions related to SG&A $1.0mm in GCA former executive continuation payments GCA cost savings are not deal related and will be implemented even without the anticipated transaction ~$1mm of GCA related cost savings have already been implemented $30 million $24 million Synergies are ~20% of combined LTM 6/30/14 SG&A and R&D Costs Total Headcount: $11.7 Total Headcount: $16.7 (1) ____________________ Source: GCA management analysis. Note: $ in millions. Reflects annualized run-rate synergies. (1) Previously identified GCA cost savings to be implemented independent of the transaction. $5.5 $5.5 $4.1 $8.0 $2.1 $3.2 $7.1 $7.7 $3.0 $3.2 $2.2 $2.4 Year 1 Year 2 and Beyond Headcount - Executive Headcount - Non - Executive Headcount - Payroll Tax & Benefits Duplicative Costs Previously Identified GCA Cost Savings Public Company Costs |
|
|
Highly Achievable Cost Synergies (Cont’d) 35 Realized at Transaction Close Year 1 Year 2 Synergy Integration Timetable Total Headcount: $6.1 Total Headcount: $6.8 Total Headcount: $10.1 Total Headcount: $11.7 Total Headcount: $16.7 (1) ____________________ Source: GCA management analysis. Note: $ in millions. Reflects annualized run-rate synergies. (1) Previously identified GCA cost savings to be implemented independent of the transaction. $4.7 $4.7 $5.5 $5.5 $5.5 $0.5 $1.0 $2.8 $4.1 $8.0 $0.9 $1.1 $1.8 $2.1 $3.2 $0.9 $1.5 $2.9 $7.1 $7.7 $1.9 $2.4 $3.0 $3.2 $1.7 $1.8 $1.9 $2.2 $2.4 $8.7 $12.0 $17.2 $24.0 $30.0 T=0 T+3mo T+6mo T+12mo T+24mo Headcount - Executive Headcount - Non - Executive Headcount - Payroll Tax & Benefits Duplicative Costs Previously Identified GCA Cost Savings Public Company Costs |
|
|
Q&A |