Attached files
| file | filename |
|---|---|
| 8-K - FORM 8-K - Engility Holdings, Inc. | d810058d8k.htm |
| EX-10.1 - EX-10.1 - Engility Holdings, Inc. | d810058dex101.htm |
| EX-99.5 - EX-99.5 - Engility Holdings, Inc. | d810058dex995.htm |
| EX-99.2 - EX-99.2 - Engility Holdings, Inc. | d810058dex992.htm |
| EX-2.1 - EX-2.1 - Engility Holdings, Inc. | d810058dex21.htm |
| EX-99.4 - EX-99.4 - Engility Holdings, Inc. | d810058dex994.htm |
| EX-99.3 - EX-99.3 - Engility Holdings, Inc. | d810058dex993.htm |
Exhibit 99.1
BUILT FOR
TODAY.
DESIGNED FOR
TOMORROW.
Third Quarter Financial Results and Acquisition of TASC
October 28, 2014
ENGILITY
Your Mission. Our Commitment.
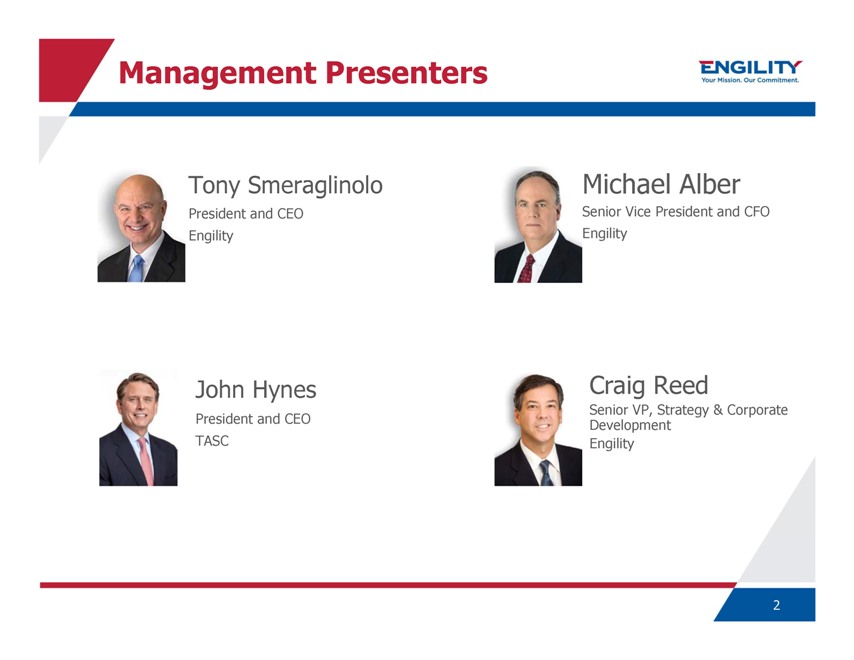
Management Presenters
ENGILITY
Your Mission. Our Commitment.
Tony Smeraglinolo
President and CEO
Engility
John Hynes
President and CEO
TASC
Michael Alber
Senior Vice President and CFO
Engility
Craig Reed
Senior VP, Strategy & Corporate
Development
Engility
2
Forward Looking Statements
ENGILITY
Your Mission. Our Commitment.
This presentation contains forward-looking statements within the meaning of the Private Securities Litigation Reform Act of 1995, including, but not limited to, statements
regarding Engility’s future prospects, projected financial results, estimated integration costs and acquisition related amortization expenses, business plans and the benefits of the business combination transaction involving Engility and TASC,
including future financial and operating results, the combined company’s plans, objectives, expectations and intentions and other statements that are not historical facts. Words such as “may,” “will,” “should,”
“likely,” “anticipates,” “expects,” “intends,” “plans,” “projects,” “believes,” “estimates” and similar expressions are also used to identify these forward-looking
statements. These statements are based on the current beliefs and expectations of Engility’s management and are subject to significant risks and uncertainties. Actual results may differ from those set forth in the forward-looking statements.
Forward-looking statements are made only as of the date hereof, and we undertake no obligation to update or revise the forward-looking statements, whether as a result of new information, future events or otherwise, except as required by law. In
addition, historical information should not be considered as an indicator of future performance. In addition to factors previously disclosed in Engility’s reports filed with the Securities and Exchange Commission (“SEC”), the
following factors among others, could cause actual results to differ materially from forward-looking statements: ability to obtain regulatory approvals and meet other closing conditions to the merger, including approval by Engility and TASC
stockholders and obtaining the requisite financing, on the expected terms and schedule; other delay in closing the merger; difficulties and delays in integrating the Engility and TASC businesses or fully realizing cost savings and other benefits;
business disruption following the proposed transaction; credit and financing risk; the inability to sustain revenue and earnings growth; the increased leverage and interest expense of the combined company, changes in interest rates and capital
markets; inflation; customer borrowing, repayment, investment and deposit practices; customer disintermediation; the introduction, withdrawal, success and timing of business initiatives; competitive conditions; the inability to realize cost savings
or revenues or to implement integration plans and other consequences associated with mergers, acquisitions and divestitures; economic conditions; changes in Engility’s stock price before closing, including as a result of the financial
performance of TASC prior to closing; the reaction to the transaction of the companies’ customers, employees and counterparties; and the impact, extent and timing of technological changes, capital management activities, and legislative and
regulatory actions and reforms.
3
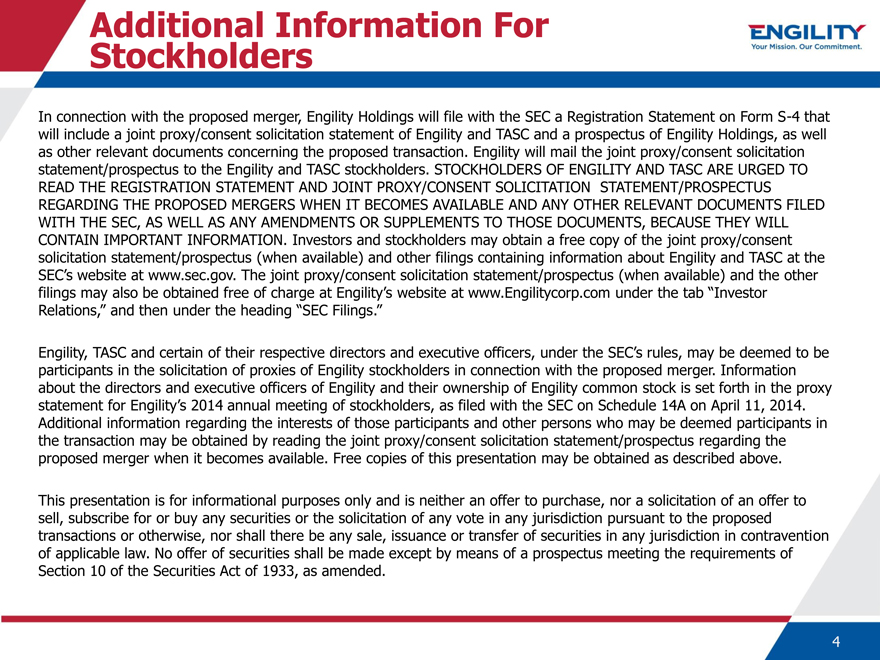
Additional Information For
Stockholders
ENGILITY
Your Mission. Our Commitment.
In connection with the proposed merger, Engility Holdings will
file with the SEC a Registration Statement on Form S-4 that will include a joint proxy/consent solicitation statement of Engility and TASC and a prospectus of Engility Holdings, as well as other relevant documents concerning the proposed
transaction. Engility will mail the joint proxy/consent solicitation statement/prospectus to the Engility and TASC stockholders. STOCKHOLDERS OF ENGILITY AND TASC ARE URGED TO READ THE REGISTRATION STATEMENT AND JOINT PROXY/CONSENT SOLICITATION
STATEMENT/PROSPECTUS
REGARDING THE PROPOSED MERGERS WHEN IT BECOMES AVAILABLE AND ANY OTHER RELEVANT DOCUMENTS FILED WITH THE SEC, AS WELL AS ANY AMENDMENTS OR
SUPPLEMENTS TO THOSE DOCUMENTS, BECAUSE THEY WILL CONTAIN IMPORTANT INFORMATION. Investors and stockholders may obtain a free copy of the joint proxy/consent solicitation statement/prospectus (when available) and other filings containing information
about Engility and TASC at the SEC’s website at www.sec.gov. The joint proxy/consent solicitation statement/prospectus (when available) and the other filings may also be obtained free of charge at Engility’s website at www.Engilitycorp.com
under the tab “Investor Relations,” and then under the heading “SEC Filings.”
Engility, TASC and certain of their respective directors and
executive officers, under the SEC’s rules, may be deemed to be participants in the solicitation of proxies of Engility stockholders in connection with the proposed merger. Information about the directors and executive officers of Engility and
their ownership of Engility common stock is set forth in the proxy statement for Engility’s 2014 annual meeting of stockholders, as filed with the SEC on Schedule 14A on April 11, 2014. Additional information regarding the interests of
those participants and other persons who may be deemed participants in the transaction may be obtained by reading the joint proxy/consent solicitation statement/prospectus regarding the proposed merger when it becomes available. Free copies of this
presentation may be obtained as described above.
This presentation is for informational purposes only and is neither an offer to purchase, nor a solicitation of an
offer to sell, subscribe for or buy any securities or the solicitation of any vote in any jurisdiction pursuant to the proposed transactions or otherwise, nor shall there be any sale, issuance or transfer of securities in any jurisdiction in
contravention of applicable law. No offer of securities shall be made except by means of a prospectus meeting the requirements of Section 10 of the Securities Act of 1933, as amended.
4
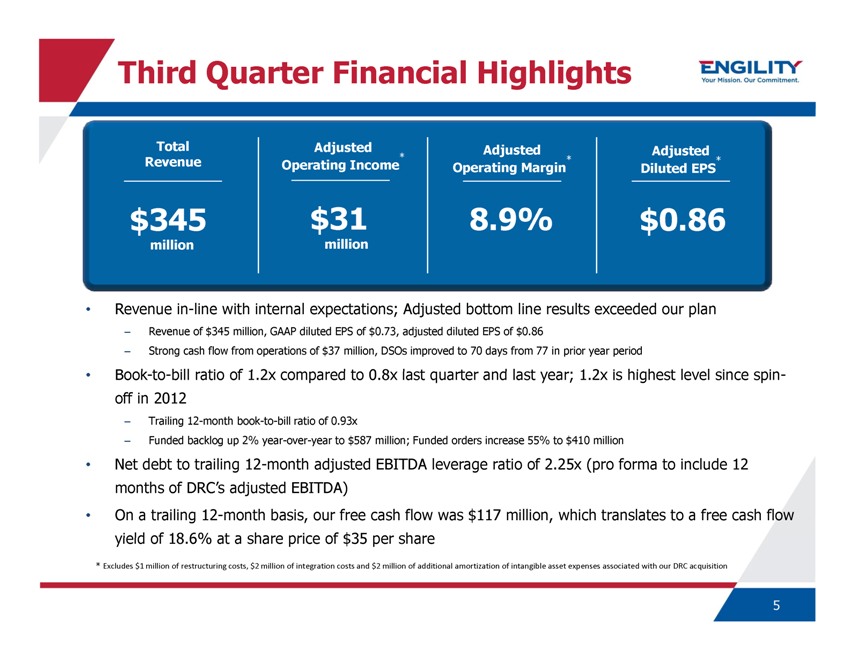
Third Quarter Financial Highlights
ENGILITY
Your Mission. Our Commitment.
Total Revenue
$345 million
Adjusted Operating Income*
$31 million
Adjusted Operating Margin*
8.9%
Adjusted Diluted EPS*
$0.86
Revenue in-line with internal expectations; Adjusted bottom line results exceeded our plan
– Revenue of $345 million, GAAP diluted EPS of $0.73, adjusted diluted EPS of $0.86
– Strong cash flow from operations of $37 million, DSOs improved to 70 days from 77 in prior year period
Book-to-bill ratio of 1.2x compared to 0.8x last quarter and last year; 1.2x is highest level since spinoff in 2012
– Trailing 12-month book-to-bill ratio of 0.93x
– Funded backlog up 2%
year-over-year to $587 million; Funded orders increase 55% to $410 million
Net debt to trailing 12-month adjusted EBITDA leverage ratio of 2.25x (pro forma to
include 12 months of DRC’s adjusted EBITDA)
On a trailing 12-month basis, our free cash flow was $117 million, which translates to a free cash flow yield of
18.6% at a share price of $35 per share
* Excludes $1 million of restructuring costs, $2 million of integration costs and $2 million of additional amortization of
intangible asset expenses associated with our DRC acquisition
5
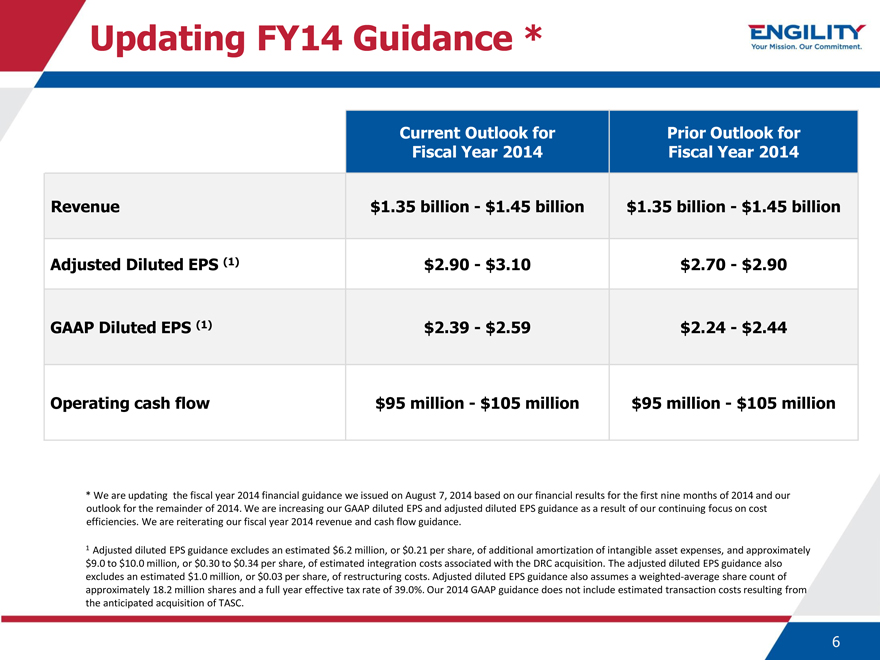
Updating FY14 Guidance *
ENGILITY
Your Mission. Our Commitment.
Current Outlook for Fiscal Year 2014 Prior Outlook for Fiscal Year 2014
Revenue $1.35 billion
- $ 1.45 billion $1.35 billion - $ 1.45 billion
Adjusted Diluted EPS (1) $2.90 - $ 3.10 $2.70 - $ 2.90
GAAP Diluted EPS (1) $2.39 - $ 2.59 $2.24 - $ 2.44
Operating cash flow $95 million - $105
million $95 million - $105 million
* We are updating the fiscal year 2014 financial guidance we issued on August 7, 2014 based on our financial results for the
first nine months of 2014 and our outlook for the remainder of 2014. We are increasing our GAAP diluted EPS and adjusted diluted EPS guidance as a result of our continuing focus on cost efficiencies. We are reiterating our fiscal year 2014 revenue
and cash flow guidance.
1 Adjusted diluted EPS guidance excludes an estimated $6.2 million, or $0.21 per share, of additional amortization of intangible asset
expenses, and approximately $9.0 to $10.0 million, or $0.30 to $0.34 per share, of estimated integration costs associated with the DRC acquisition. The adjusted diluted EPS guidance also excludes an estimated $1.0 million, or $0.03 per share, of
restructuring costs. Adjusted diluted EPS guidance also assumes a weighted-average share count of approximately 18.2 million shares and a full year effective tax rate of 39.0%. Our 2014 GAAP guidance does not include estimated transaction costs
resulting from the anticipated acquisition of TASC.
| 6 |
ENGILITY
Your Mission.
Our Commitment.
Acquisition of TASC
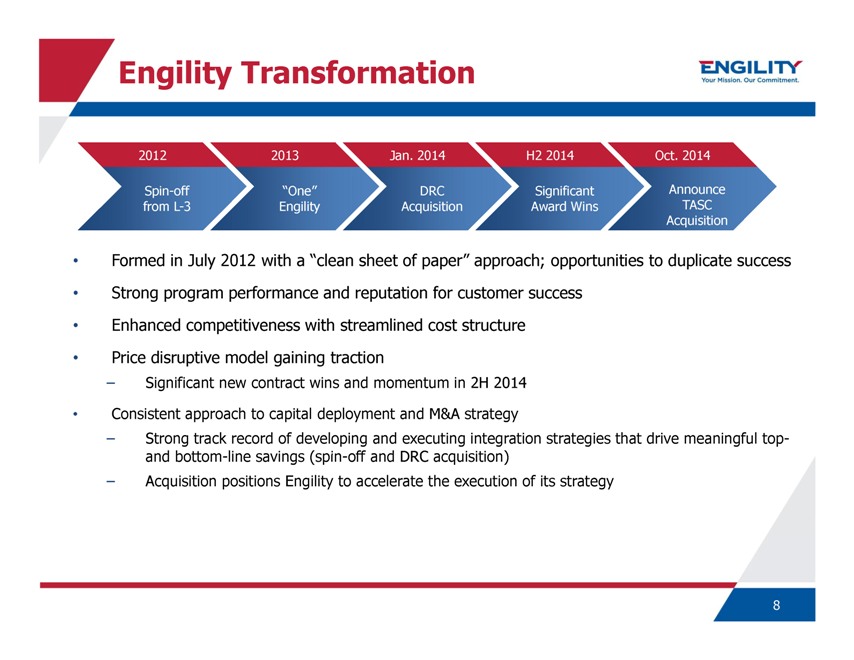
Engility Transformation
ENGILITY
Your Mission. Our Commitment.
2012 2013 Jan. 2014 H2 2014 Oct. 2014
Spin-off from L-3
“One” Engility
DRC Acquisition
Significant Award Wins
Announce TASC Acquisition
Formed in July 2012 with a “clean sheet of paper” approach; opportunities to duplicate success
Strong program performance and reputation for customer success
Enhanced competitiveness with
streamlined cost structure
Price disruptive model gaining traction
–
Significant new contract wins and momentum in 2H 2014
Consistent approach to capital deployment and M&A strategy
– Strong track record of developing and executing integration strategies that drive meaningful top- and bottom-line savings (spin-off
and DRC acquisition)
– Acquisition positions Engility to accelerate the execution of its strategy
8
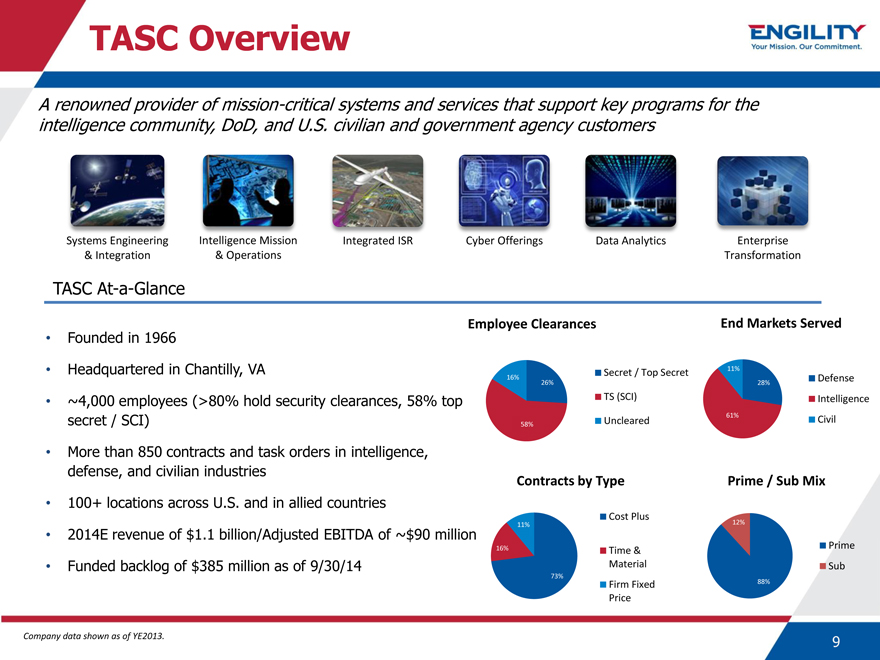
TASC Overview
ENGILITY
Your Mission. Our Commitment.
A renowned provider of mission-critical systems
and services that support key programs for the intelligence community, DoD, and U.S. civilian and government agency customers
Systems Engineering & Integration
Intelligence Mission & Operations
Integrated ISR
Cyber Offerings
Data Analytics
Enterprise Transformation
TASC At-a-Glance
Founded in 1966
Headquartered in Chantilly, VA
~4,000 employees (>80% hold security clearances, 58% top secret / SCI)
More than 850
contracts and task orders in intelligence, defense, and civilian industries
100+ locations across U.S. and in allied countries
2014E revenue of $1.1 billion/Adjusted EBITDA of ~$90 million
Employee Clearances
16% 26%
58%
Secret / Top Secret
TS (SCI)
Uncleared
End Markets Served
11%
28%
61%
Defense
Intelligence
Civil
Contracts by Type
11%
16%
73%
Cost Plus
Time & Material
Firm Fixed Price
Prime / Sub Mix
12%
88%
Prime
Sub
9
Company data shown as of YE2013.
Funded backlog of $385 million as of 9/30/14
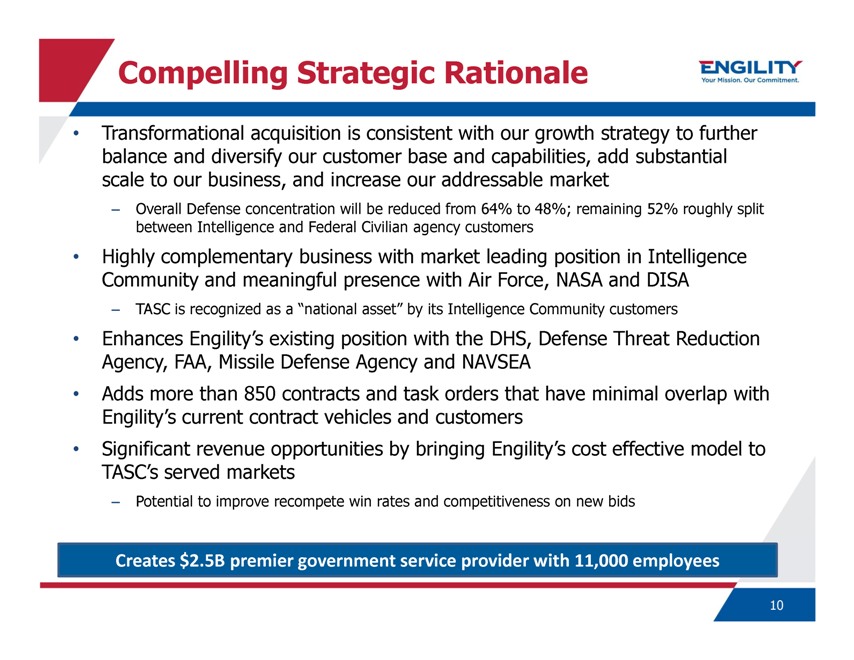
Compelling Strategic Rationale
ENGILITY
Your Mission. Our Commitment.
Transformational acquisition is consistent with our growth strategy to further balance and diversify our customer base and capabilities, add substantial scale to our business, and
increase our addressable market
– Overall Defense concentration will be reduced from 64% to 48%; remaining 52% roughly split between Intelligence and Federal
Civilian agency customers
Highly complementary business with market leading position in Intelligence Community and meaningful presence with Air Force, NASA and
DISA
– TASC is recognized as a “national asset” by its Intelligence Community customers
Enhances Engility’s existing position with the DHS, Defense Threat Reduction Agency, FAA, Missile Defense Agency and NAVSEA
Adds more than 850 contracts and task orders that have minimal overlap with Engility’s current contract vehicles and customers
Significant revenue opportunities by bringing Engility’s cost effective model to TASC’s served markets
– Potential to improve recompete win rates and competitiveness on new bids
Creates $2.5B premier government service provider with 11,000 employees
10
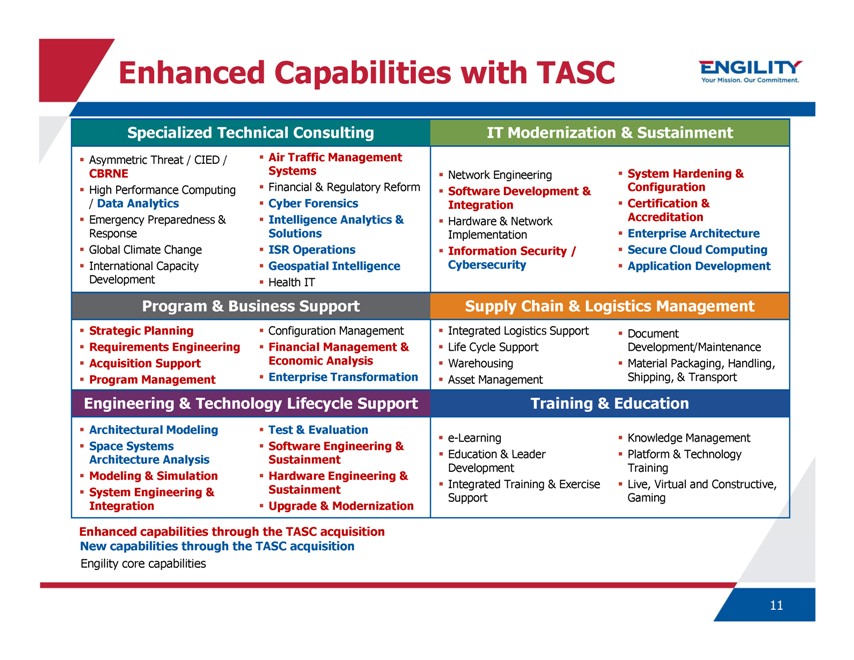
Enhanced Capabilities with TASC
ENGILITY
Your Mission. Our Commitment.
Specialized Technical Consulting
Asymmetric Threat / CIED / CBRNE
High Performance Computing / Data Analytics
Emergency Preparedness & Response
Global Climate Change
International Capacity Development
Air Traffic Management Systems
Financial & Regulatory Reform
Cyber Forensics
Intelligence Analytics & Solutions
ISR Operations
Geospatial Intelligence
Health IT
Program & Business Support
Strategic Planning
Requirements Engineering
Acquisition Support
Program Management
Configuration Management
Financial Management & Economic Analysis
Enterprise Transformation
Engineering & Technology Lifecycle Support
Architectural Modeling
Space Systems Architecture Analysis
Modeling & Simulation
System Engineering & Integration
Test & Evaluation
Software Engineering & Sustainment
Hardware Engineering & Sustainment
Upgrade & Modernization
IT Modernization & Sustainment
Network Engineering
Software Development & Integration
Hardware & Network Implementation
Information Security / Cybersecurity
System Hardening &
Configuration
Certification & Accreditation
Enterprise Architecture
Secure Cloud Computing
Application Development
Supply Chain & Logistics Management
Integrated Logistics Support
Life Cycle Support
Warehousing
Asset Management
Document Development/Maintenance
Material Packaging, Handling, Shipping, & Transport
Training & Education
e-Learning
Education & Leader Development
Integrated Training & Exercise Support
Knowledge Management
Platform & Technology Training
Live, Virtual and Constructive, Gaming
Enhanced capabilities through the TASC acquisition
New capabilities through the TASC
acquisition
Engility core capabilities
11
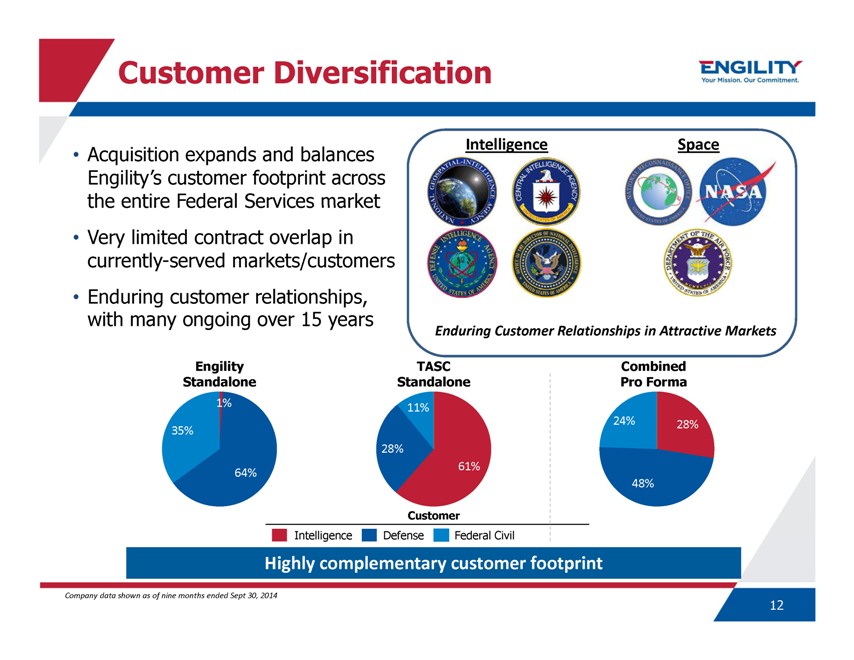
Customer Diversification
ENGILITY
Your Mission. Our Commitment.
Acquisition expands and balances Engility’s customer footprint across the entire Federal Services market
Very limited contract overlap in currently-served markets/customers
Enduring customer
relationships, with many ongoing over 15 years
Intelligence
Space
Enduring Customer Relationships in Attractive Markets
Engility
Standalone
35%
1%
64%
TASC Standalone
11%
61%
28%
Combined Pro Forma
24% 28%
48%
Customer
Intelligence Defense Federal Civil
Highly complementary customer footprint
Company data shown as of nine months ended Sept 30, 2014
12
Compelling Financial Rationale
ENGILITY
Your Mission. Our Commitment.
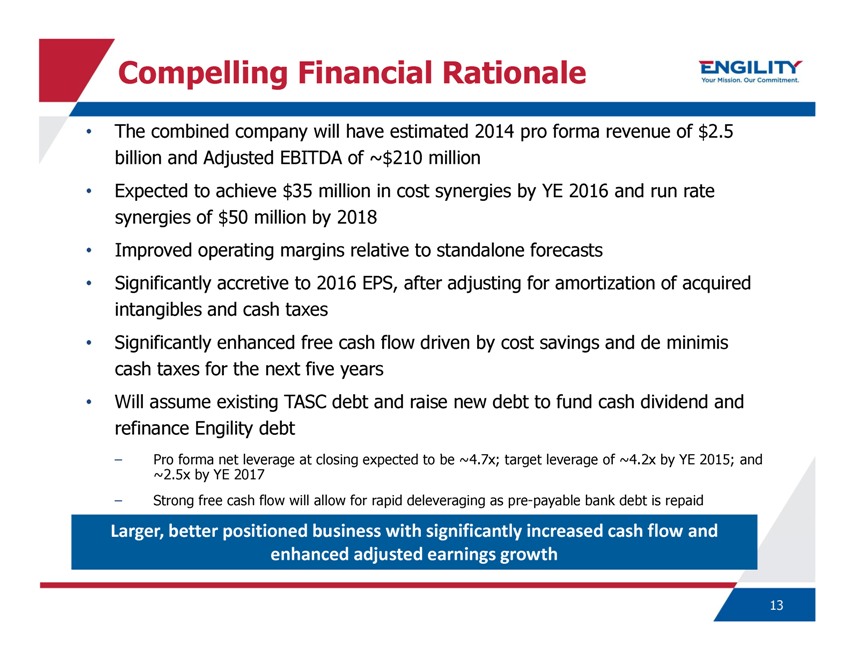
The combined company will have estimated 2014 pro forma revenue of $2.5 billion and Adjusted EBITDA of ~$210 million
Expected to achieve $35 million in cost synergies by YE 2016 and run rate synergies of $50 million by 2018
Improved operating margins relative to standalone forecasts
Significantly accretive to 2016
EPS, after adjusting for amortization of acquired intangibles and cash taxes
Significantly enhanced free cash flow driven by cost savings and de minimis cash taxes
for the next five years
Will assume existing TASC debt and raise new debt to fund cash dividend and refinance Engility debt
– Pro forma net leverage at closing expected to be ~4.7x; target leverage of ~4.2x by YE 2015; and ~2.5x by YE 2017
– Strong free cash flow will allow for rapid deleveraging as pre-payable bank debt is repaid
Larger, better positioned business with significantly increased cash flow and enhanced adjusted earnings growth
13
Transaction Overview
ENGILITY
Your Mission. Our Commitment.
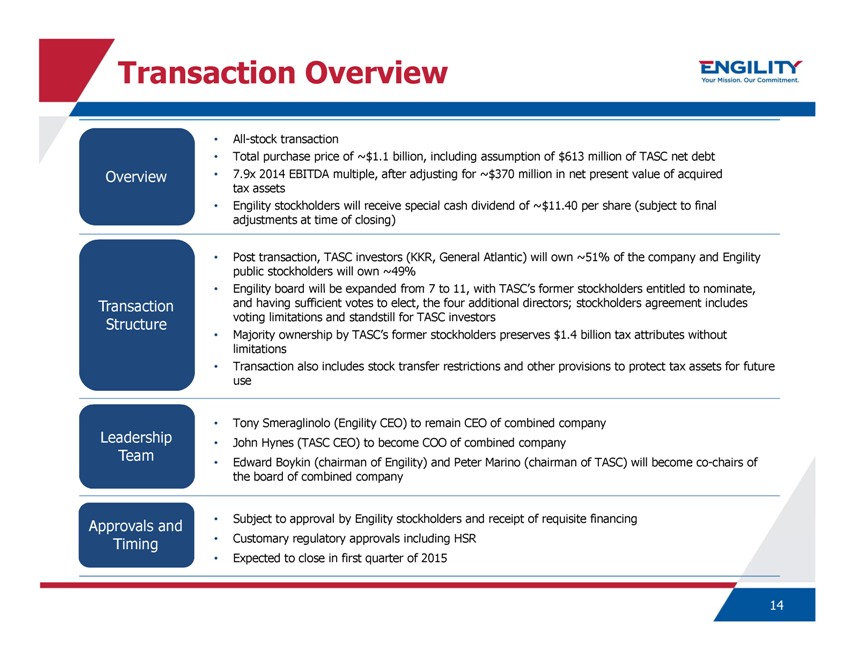
Overview
All-stock transaction
Total purchase price of ~$1.1 billion, including assumption of $613 million of TASC net debt
7.9x 2014 EBITDA multiple, after adjusting for ~$370 million in net present value of acquired tax assets
Engility stockholders will receive special cash dividend of ~$11.40 per share (subject to final adjustments at time of closing)
Transaction Structure
Post transaction, TASC investors (KKR, General Atlantic) will own ~51%
of the company and Engility public stockholders will own ~49%
Engility board will be expanded from 7 to 11, with TASC’s former stockholders entitled to
nominate, and having sufficient votes to elect, the four additional directors; stockholders agreement includes voting limitations and standstill for TASC investors
Majority ownership by TASC’s former stockholders preserves $1.4 billion tax attributes without limitations
Transaction also includes stock transfer restrictions and other provisions to protect tax assets for future use
Leadership Team
Tony Smeraglinolo (Engility CEO) to remain CEO of combined company
John Hynes (TASC CEO) to become COO of combined company
Edward Boykin (chairman of Engility)
and Peter Marino (chairman of TASC) will become co-chairs of the board of combined company
Approvals and Timing
Subject to approval by Engility stockholders and receipt of requisite financing
Customary
regulatory approvals including HSR
Expected to close in first quarter of 2015
14
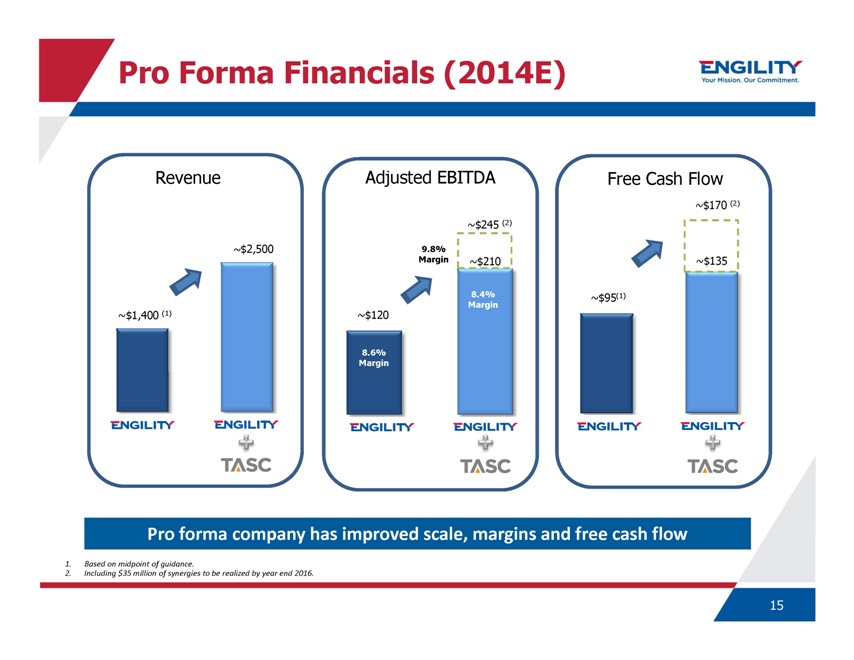
Pro Forma Financials (2014E)
ENGILITY
Your Mission. Our Commitment.
Revenue
~$1,400 (1)
ENGILITY
~$2,500
ENGILITY
+
TASC
Adjusted EBITDA
~$120
8.6%
Margin
ENGILITY
9.8%
Margin
~$245 (2)
~$210
8.4%
Margin
ENGILITY
+
TASC
Free Cash Flow
~$95(1)
ENGILITY
~$170 (2)
~$135
ENGILITY
+
TASC
Pro forma company has improved scale, margins and free cash flow
1. Based on midpoint of guidance.
2. Including $35 million of synergies to be
realized by year end 2016.
15
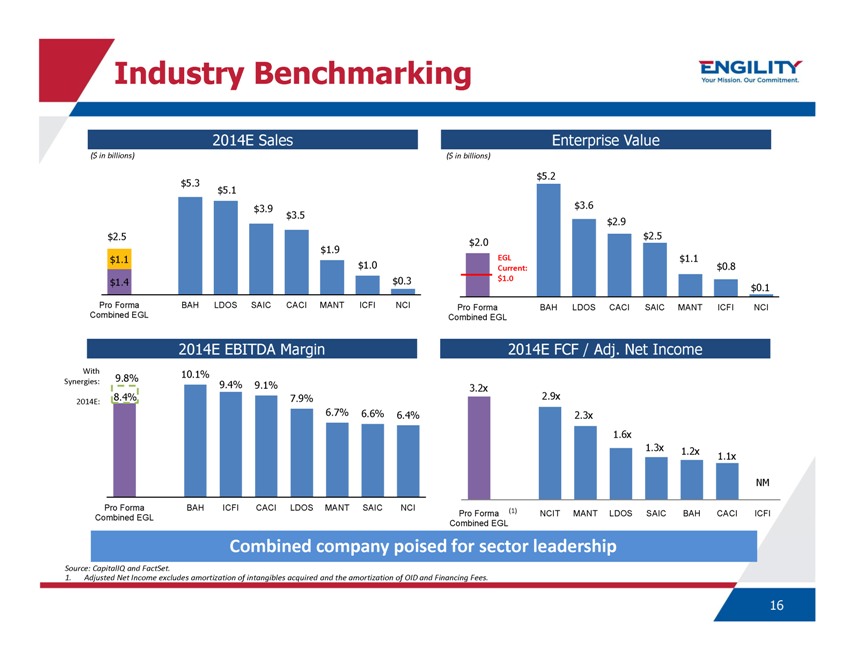
Industry Benchmarking
ENGILITY
Your Mission. Our Commitment.
2014E Sales
($ in billions)
$2.5
$1.1
$1.4
$5.3
$5.1
$3.9
$3.5
$1.9
$1.0
$0.3
Pro Forma
Combined EGL
BAH
LDOS
SAIC
CACI
MANT
ICFI
NCI
2014E EBITDA Margin
With
Synergies:
2014E:
9.8%
8.4%
10.1%
9.4%
9.1%
7.9%
6.7%
6.6%
6.4%
Pro Forma
Combined EGL
BAH
ICFI
CACI
LDOS
MANT
SAIC
NCI
Enterprise Value
($ in billions)
$2.0
EGL
Current:
$1.0
$5.2
$3.6
$2.9
$2.5
$1.1
$0.8
$0.1
Pro Forma
Combined EGL
BAH
LDOS
CACI
SAIC
MANT
ICFI
NCI
2014E FCF / Adj. Net Income
3.2x
2.9x
2.3x
1.6x
1.3x
1.2x
1.1x
NM
Pro Forma (1)
Combined EGL
NCIT
MANT
LDOS
SAIC
BAH
CACI
ICFI
Combined company poised for sector leadership
Source: CapitalIQ and FactSet.
1. Adjusted Net Income excludes amortization of intangibles
acquired and the amortization of OID and Financing Fees.
16
Income Tax Attributes
ENGILITY
Your Mission. Our Commitment.
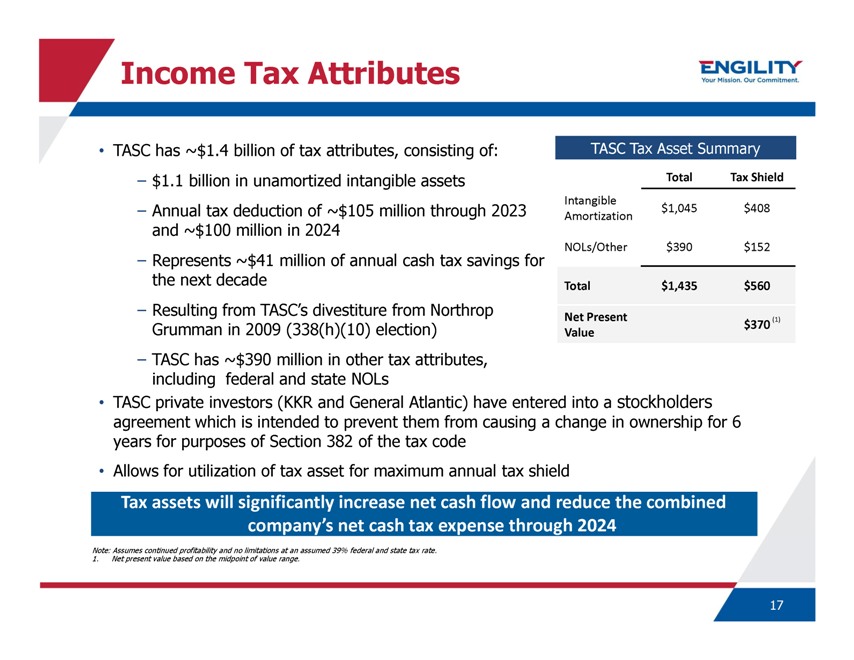
TASC has ~$1.4 billion of tax attributes, consisting of:
– $1.1 billion in unamortized
intangible assets
– Annual tax deduction of ~$105 million through 2023 and ~$100 million in 2024
– Represents ~$41 million of annual cash tax savings for the next decade
– Resulting
from TASC’s divestiture from Northrop Grumman in 2009 (338(h)(10) election)
– TASC has ~$390 million in other tax attributes, including federal and state
NOLs
TASC Tax Asset Summary
Total
Tax Shield
Intangible Amortization
$1,045
$408
NOLs/Other
$390
$152
Total
$1,435
$560
Net Present Value
$370 (1)
TASC private investors (KKR and General Atlantic) have entered into a stockholders agreement which is intended to prevent them from causing a change in ownership for 6 years for
purposes of Section 382 of the tax code
Allows for utilization of tax asset for maximum annual tax shield
Tax assets will significantly increase net cash flow and reduce the combined company’s net cash tax expense through 2024
Note: Assumes continued profitability and no limitations at an assumed 39% federal and state tax rate.
1. Net present value based on the midpoint of value range.
17
Pro Forma Capitalization and Deleveraging Profile
ENGILITY
Your Mission. Our Commitment.
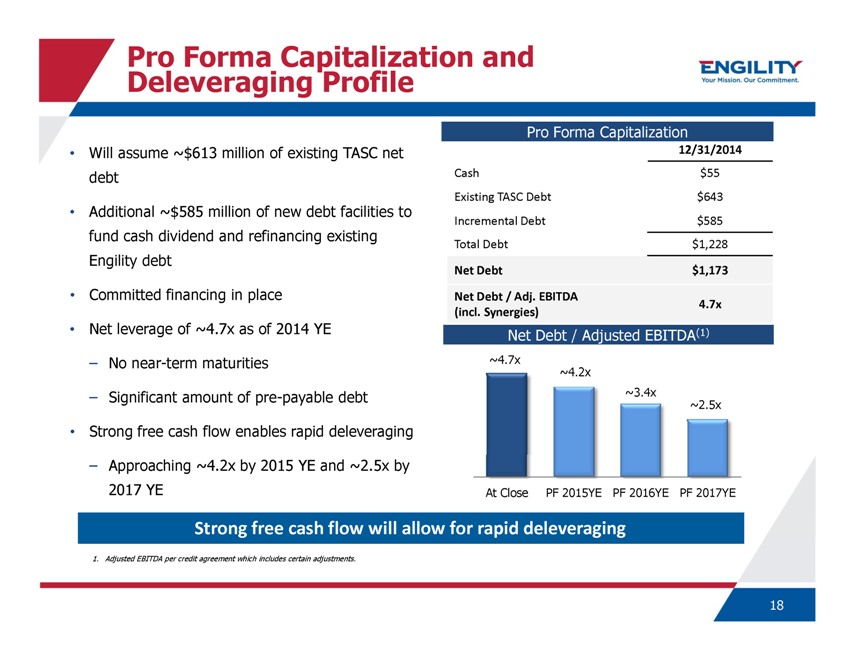
Will assume ~$613 million of existing TASC net debt
Additional ~$585 million of new debt
facilities to fund cash dividend and refinancing existing Engility debt
Committed financing in place
Net leverage of ~4.7x as of 2014 YE
– No near-term maturities
– Significant amount of pre-payable debt
Strong free cash flow enables rapid deleveraging
– Approaching ~4.2x by 2015 YE and ~2.5x by 2017 YE
Pro Forma
Capitalization
12/31/2014
Cash
Existing TASC Debt
Incremental Debt
Total Debt
Net Debt
Net Debt / Adj. EBITDA
(incl. Synergies)
$55
$643
$585
$1,228
$1,173
4.7x
Net Debt / Adjusted EBITDA(1)
~4.7x
~4.2x
~3.4x
~2.5x
At Close
PF 2015YE
PF 2016YE
PF 2017YE
Strong free cash flow will allow for rapid deleveraging
1. Adjusted EBITDA per credit agreement which includes certain adjustments.
18
Stockholders Agreement with TASC Investors
ENGILITY
Your Mission. Our Commitment.
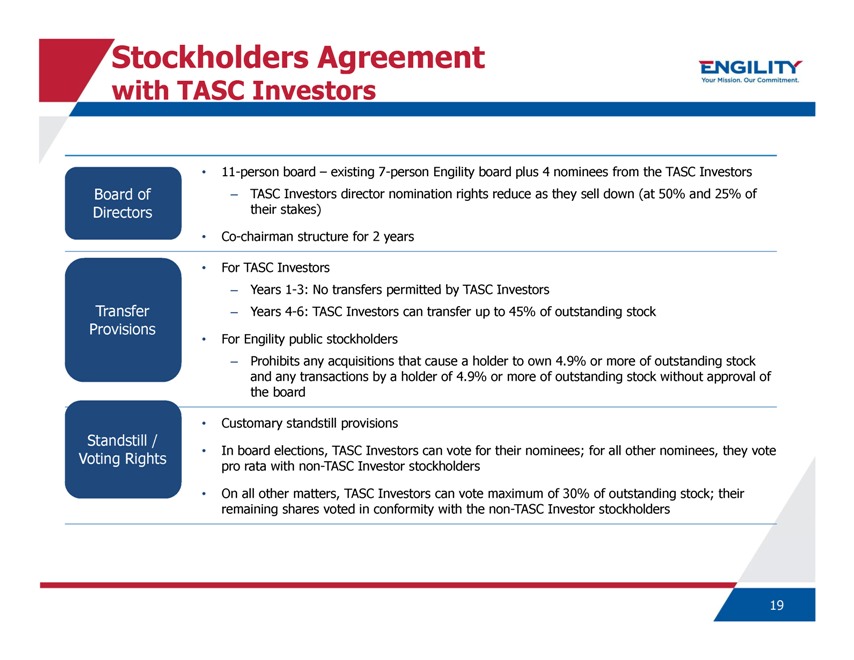
Board of Directors
11-person board – existing 7-person Engility board plus 4 nominees
from the TASC Investors
– TASC Investors director nomination rights reduce as they sell down (at 50% and 25% of their stakes)
Co-chairman structure for 2 years
Transfer Provisions
For TASC Investors
– Years 1-3: No transfers permitted by TASC Investors
– Years 4-6: TASC Investors can transfer up to 45% of outstanding stock
For Engility
public stockholders
– Prohibits any acquisitions that cause a holder to own 4.9% or more of outstanding stock and any transactions by a holder of 4.9% or more
of outstanding stock without approval of the board
Standstill / Voting Rights
Customary standstill provisions
In board elections, TASC Investors can vote
for their nominees; for all other nominees, they vote pro rata with non-TASC Investor stockholders
On all other matters, TASC Investors can vote maximum of 30% of
outstanding stock; their remaining shares voted in conformity with the non-TASC Investor stockholders
19
Summary
ENGILITY
Your Mission. Our Commitment.
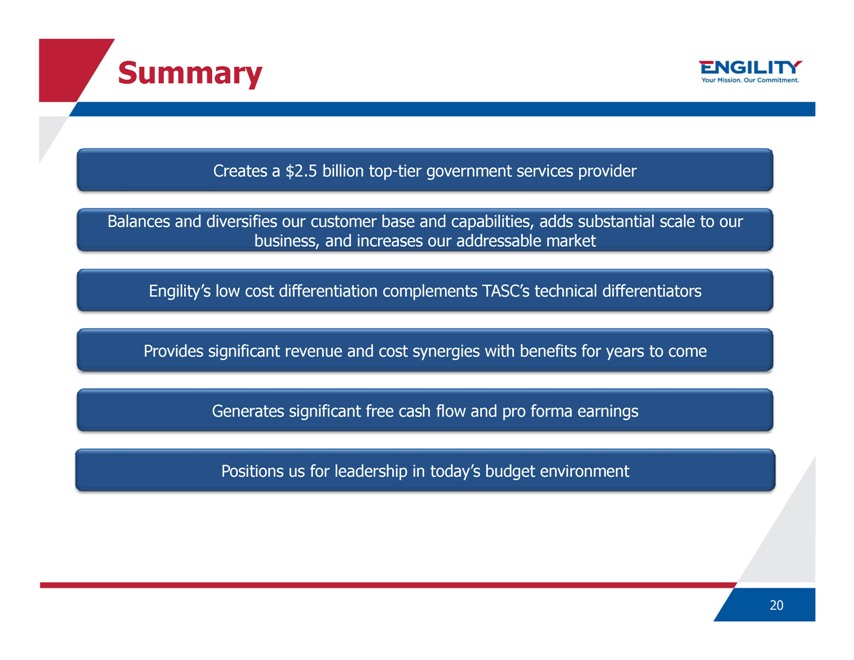
Creates a $2.5 billion top-tier government
services provider
Balances and diversifies our customer base and capabilities, adds substantial scale to our business, and increases our addressable market
Engility’s low cost differentiation complements TASC’s technical differentiators
Provides significant revenue and cost synergies with benefits for years to come
Generates
significant free cash flow and pro forma earnings
Positions us for leadership in today’s budget environment
20
ENGILITY
Your Mission.
Our Commitment.
Appendix
21
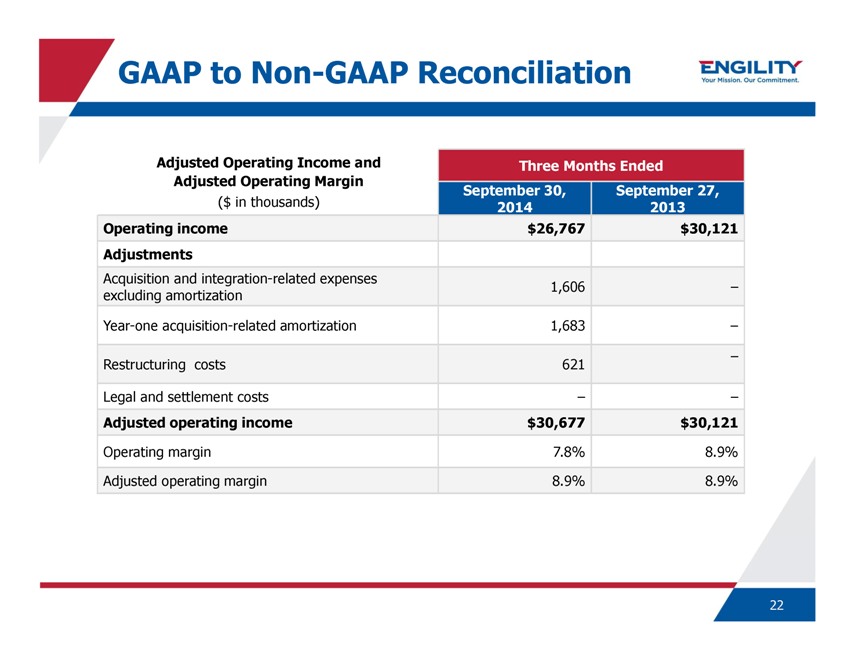
GAAP to Non-GAAP Reconciliation
ENGILITY
Your Mission. Our Commitment.
Adjusted Operating Income and Adjusted Operating Margin
($ in thousands)
Three Months Ended
September 30, September 27,
2014 2013
Operating income $26,767 $30,121
Adjustments
Acquisition and integration-related expenses 1,606 –
excluding amortization
Year-one acquisition-related amortization 1,683 –
Restructuring costs 621 –
Legal and settlement costs – –
Adjusted operating income $30,677 $30,121
Operating margin 7.8% 8.9%
Adjusted operating margin 8.9% 8.9%
22
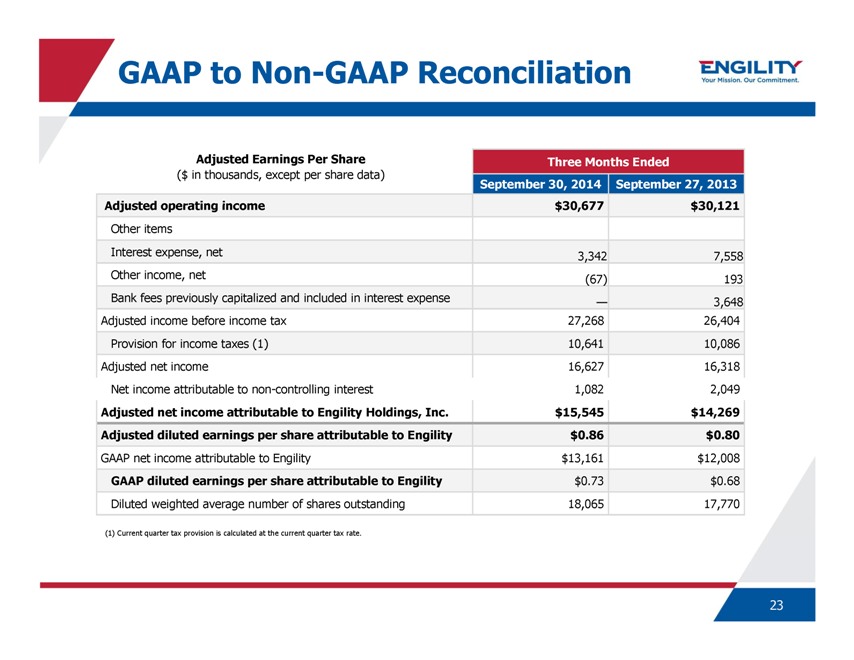
GAAP to Non-GAAP Reconciliation
ENGILITY
Your Mission. Our Commitment.
Adjusted Earnings Per Share
($ in thousands, except per share data)
Three Months Ended
September 30, 2014 September 27, 2013
Adjusted operating income $30,677 $30,121
Other items
Interest expense, net 3,342 7,558
Other income, net (67) 193
Bank fees previously capitalized and included in interest expense — 3,648
Adjusted income
before income tax 27,268 26,404
Provision for income taxes (1) 10,641 10,086
Adjusted net income 16,627 16,318
Net income attributable to non-controlling
interest 1,082 2,049
Adjusted net income attributable to Engility Holdings, Inc. $15,545 $14,269
Adjusted diluted earnings per share attributable to Engility $0.86 $0.80
GAAP net income
attributable to Engility $13,161 $12,008
GAAP diluted earnings per share attributable to Engility $0.73 $0.68
Diluted weighted average number of shares outstanding 18,065 17,770
(1) Current quarter tax
provision is calculated at the current quarter tax rate.
23
GAAP to Non-GAAP Reconciliation
ENGILITY
Your Mission. Our Commitment.
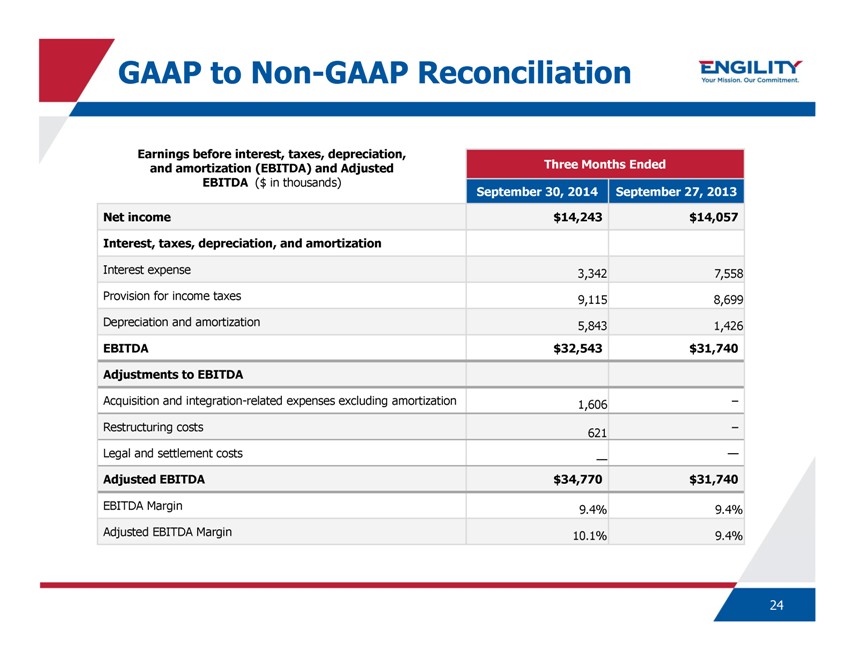
Earnings before interest, taxes, depreciation,
and amortization (EBITDA) and Adjusted
EBITDA ($ in thousands)
Three Months Ended
September 30, 2014 September 27, 2013
Net income $14,243 $14,057
Interest, taxes, depreciation, and amortization
Interest expense 3,342 7,558
Provision for income taxes 9,115 8,699
Depreciation and amortization 5,843 1,426
EBITDA $32,543 $31,740
Adjustments to EBITDA
Acquisition and integration-related expenses excluding amortization 1,606 –
Restructuring
costs –
621
Legal and settlement costs —
—
Adjusted EBITDA $34,770 $31,740
EBITDA Margin 9.4% 9.4%
Adjusted EBITDA Margin 10.1% 9.4%
24