Attached files
| file | filename |
|---|---|
| EXCEL - IDEA: XBRL DOCUMENT - Engility Holdings, Inc. | Financial_Report.xls |
| EX-23.1 - EXHIBIT 23.1 - Engility Holdings, Inc. | eglex23114q4.htm |
| EX-32.1 - EXHIBIT 32.1 - Engility Holdings, Inc. | eglex32114q4.htm |
| EX-21.1 - EXHIBIT 21.1 - Engility Holdings, Inc. | eglex21114q4.htm |
| EX-31.2 - EXHIBIT 31.2 - Engility Holdings, Inc. | eglex31214q4.htm |
| EX-31.1 - EXHIBIT 31.1 - Engility Holdings, Inc. | eglex31114q4.htm |
UNITED STATES
SECURITIES AND EXCHANGE COMMISSION
WASHINGTON, D.C. 20549
_____________________________________
FORM 10-K
_____________________________________
x | ANNUAL REPORT PURSUANT TO SECTION 13 OR 15(d) OF THE SECURITIES EXCHANGE ACT OF 1934 |
For the fiscal year ended December 31, 2014
OR
o | TRANSITION REPORT PURSUANT TO SECTION 13 OR 15(d) OF THE SECURITIES EXCHANGE ACT OF 1934 |
For the transition period from _________ to _________
Commission file number: 001-35487
_____________________________________

ENGILITY HOLDINGS, INC.
(Exact name of registrant as specified in its charter)
_____________________________________
Delaware | 45-3854852 | |
(State or other jurisdiction of incorporation or organization) | (I.R.S. Employer Identification No.) | |
3750 Centerview Drive Chantilly, VA | 20151 | |
(Address of principal executive offices) | (Zip Code) | |
Registrant’s telephone number, including area code: (703) 708-1400
Securities registered pursuant to Section 12(b) of the Act:
Title of each class | Name of each exchange on which registered | |
Common Stock, $0.01 par value per share | The New York Stock Exchange | |
Securities registered pursuant to Section 12(g) of the Act: None
_____________________________________
Indicate by check mark if the registrant is a well-known seasoned issuer, as defined in Rule 405 of the Securities Act. Yes x No o
Indicate by check mark if the registrant is not required to file reports pursuant to Section 13 or Section 15(d) of the Exchange Act. Yes o No x
Indicate by check mark whether the registrant (1) has filed all reports required to be filed by Section 13 or 15(d) of the Securities Exchange Act of 1934 during the preceding 12 months (or for such shorter period that the registrant was required to file such reports), and (2) has been subject to such filing requirements for the past 90 days. Yes x No o
Indicate by check mark whether the registrant has submitted electronically and posted on its corporate Web site, if any, every Interactive Data File required to be submitted and posted pursuant to Rule 405 of Regulation S-T during the preceding 12 months (or for such shorter period that the registrant was required to submit and post such files). Yes x No o
Indicate by check mark if disclosure of delinquent filers pursuant to Item 405 of Regulation S-K is not contained herein, and will not be contained, to the best of registrant’s knowledge, in definitive proxy or information statements incorporated by reference in Part III of this Form 10-K or any amendment to this Form 10-K. x
Indicate by check mark whether the registrant is a large accelerated filer, an accelerated filer, a non-accelerated filer or a smaller reporting company. See the definitions of “large accelerated filer,” “accelerated filer” and “smaller reporting company” in Rule 12b-2 of the Exchange Act.
Large accelerated filer | o | Accelerated filer | x | ||
Non-accelerated filer | o (Do not check if a smaller reporting company) | Smaller reporting company | o | ||
Indicate by check mark whether the registrant is a shell company (as defined in Rule 12b-2 of the Exchange Act). Yes o No x
The aggregate market value of Engility Holdings, Inc. common stock held by non-affiliates of the registrant as of June 30, 2014 was approximately $662,190,776.
As of February 26, 2015, there were issued and outstanding 36,360,959 shares of common stock, par value $0.01 per share.
DOCUMENTS INCORPORATED BY REFERENCE
Document | Parts Into Which Incorporated | |
Proxy Statement for the Annual Meeting of Stockholders expected to be held on May 21, 2015 (Proxy Statement) | Part III | |
ENGILITY HOLDINGS, INC.
INDEX
Description | Page Number |
i
CAUTIONARY STATEMENT REGARDING FORWARD-LOOKING STATEMENTS
This Annual Report on Form 10-K of Engility Holdings, Inc. contains forward-looking statements, including, without limitation, in the sections titled “Business,” “Risk Factors,” and “Management’s Discussion and Analysis of Financial Condition and Results of Operations,” that are based on our management’s beliefs and assumptions and on information currently available to our management. Forward-looking statements include the information concerning our possible or assumed future results of operations, business strategies, financing plans, competitive position, potential growth opportunities, potential operating performance improvements, the effects and expected benefits of acquisitions and competition and the effects of future legislation or regulations. Forward-looking statements include all statements that are not historical facts and can be identified by the use of forward-looking terminology such as the words “believe,” “expect,” “plan,” “intend,” “anticipate,” “estimate,” “predict,” “potential,” “continue,” “may,” “might,” “should,” “could” or the negative of these terms or similar expressions.
Forward-looking statements involve risks, uncertainties and assumptions. Actual outcomes and results may differ materially from what is expressed or forecast in these forward-looking statements. Risks, uncertainties and other factors that might cause such differences, some of which could be material, include, but are not limited to: (a) the loss or delay of a significant number of our contracts; (b) a decline in or a redirection of the U.S. budget for government services, including in particular the U.S. defense budget; (c) future shutdowns of the U.S. government, or a failure of the U.S. Congress to approve increases to the Federal debt ceiling; (d) the Department of Defense’s wide-ranging efficiencies initiative, which targets affordability and cost growth; (e) the intense competition for contracts in our industry, as well as the frequent protests by unsuccessful bidders; (f) our indefinite delivery, indefinite quantity (IDIQ) contracts, which are not firm orders for services, and could generate limited or no revenue; (g) our government contracts, which contain unfavorable termination provisions and are subject to audit and modification; (h) the mix of our cost-plus, time-and-material and fixed-price type contracts; (i) our ability to attract and retain key management and personnel; (j) the impairment of our goodwill, which represent a significant portion of the assets on our balance sheet; (k) changes in regulations or any negative findings from a U.S. government audit or investigation; (l) current and future legal and regulatory proceedings; (m) risks associated with our international operations; (n) information security threats and other information technology disruptions; (o) integration, operational and other risks related to our January 2014 acquisition of Dynamics Research Corporation (DRC) and our February 2015 business combination with TASC Parent Corporation, including difficulties and delays in fully realizing cost savings; (p) the level of debt that we incurred in connection with the Spin-Off and our subsequent acquisitions of DRC and TASC, our ability to comply with the terms of our debt agreements and our ability to finance our future operations, if necessary; (q) U.S. Federal income tax liabilities that relate to the distribution in the Spin-Off of Engility and the acquisition of TASC; and (r) other factors set forth under the heading “Risk Factors” in this Annual Report. There may be other risks and uncertainties that we are unable to predict at this time or that we currently do not expect to have a material adverse effect on our business. Any such risks could cause our results to differ materially from those expressed in forward-looking statements.
You should not put undue reliance on any forward-looking statements in this Annual Report. These forward-looking statements speak only as of the date of this Annual Report and we do not have any intention or obligation to update forward-looking statements after we distribute this Annual Report.
ii
PART I
Item 1. BUSINESS
Overview
Engility Holdings, Inc., a Delaware corporation, supports the missions of the U.S. government by deploying our highly skilled workforce wherever and whenever they are needed. We offer a broad range of services, including specialized technical consulting, program and business support, engineering and technology lifecycle support, information technology modernization and sustainment, supply chain services and logistics management, training and education to the U.S. government personnel worldwide. Our revenue is derived from a diverse mix of activities and services with no single program accounting for more than 10% of our revenue in 2014. For the year ended December 31, 2014, we had revenue of approximately $1.4 billion, 98% of which was derived from the U.S. government.
Prior to our Spin-Off in July 2012, as further described below, Engility Holdings was a subsidiary of L-3 Communications Holdings, Inc. As used in this report, (i) references to “Engility Holdings,” “Engility,” “the Company,” “we,” “us” or “our” refer to Engility Holdings, Inc. and its subsidiaries and (ii) references to “L-3” refer to L-3 Communications Holdings, Inc. and its subsidiaries (which excludes Engility after the Spin-Off).
Engility through our predecessors, has provided mission critical services to the U.S. government for over five decades. We serve the U.S. Department of Defense (DoD), U.S. Department of Justice (DoJ), U.S. Agency for International Development (USAID), U.S. Department of State (DoS), Federal Aviation Administration (FAA), Department of Homeland Security (DHS), and foreign governments. With our recent acquisition of TASC, Inc. (TASC) on February 26, 2015, we have further diversified our portfolio to add leading positions with U.S. national security and public safety agencies, including, the National Geospatial-Intelligence Agency (NGA), National Security Agency (NSA), Defense Intelligence Agency (DIA), and other intelligence community agencies. We also added space-related agencies such as the National Reconnaissance Organization (NRO), National Aeronautical and Space Administration (NASA) and U.S. Air Force. The acquisition of TASC also enhanced our market position with DHS, Defense Threat Reduction Agency (DTRA), FAA and Missile Defense Agency (MDA).
The Business section of this Annual Report on Form 10-K will discuss certain highlights of our business since our spin-off from L-3 Communications Holdings, Inc., including our first quarter 2013 strategic realignment of our organizational structure, the acquisition of Dynamics Research Corporation in 2014, and the acquisition of TASC Parent Corporation in 2015 and our resulting restructuring under a new holding company. Further, this section will discuss the current state of our business including, among other matters:
· Our Business Strategy;
· Our Competitive Strengths;
· Our Organizational Design, Capabilities and Customer; and
· Competition in our Industry.
Spin-Off and Strategic Realignment
On July 17, 2012 (the Distribution Date), L-3 completed the spin-off of Engility Holdings from L-3 through the distribution of 100% of the common stock of Engility Holdings to stockholders of L-3 (the Spin-Off). We paid $335 million as a cash dividend to L-3 on the Distribution Date and on July 18, 2012, after completion of the Spin-Off, our common stock began “regular-way” trading on the New York Stock Exchange under the symbol “EGL.” Following the Spin-Off, we implemented a strategic realignment of our organizational structure and the streamlining of our operations in the first quarter of 2013. We undertook these actions in order to create a business that is more agile, customer-focused and price competitive, and to enable us to maintain and grow our business in a competitive marketplace that is sensitive to U.S. government spending conditions.
DRC Acquisition
On January 31, 2014, we completed the acquisition of Dynamics Research Corporation (DRC), a U.S. government services, information technology and management consulting firm with leading capabilities in healthcare, homeland security, research and development, intelligence, surveillance and reconnaissance (ISR) and financial regulation and reform. Under the terms of the acquisition, which was structured as a tender offer followed by a back-end merger, we acquired all outstanding shares of DRC’s common stock for cash at a price of $11.50 per share for an aggregate purchase price of approximately $121 million in cash, and retired approximately $86 million in DRC debt. We financed the transaction through a $75 million term loan, $115 million of borrowings under our revolving credit facility and $20 million in cash on hand.
1
TASC Acquisition
On February 26, 2015, we completed the acquisition of TASC, Inc., a leading professional services provider to the national security and public safety markets, in an all-stock transaction valued at approximately $1.3 billion, including the assumption of net debt of $614 million. The business combination was effected through a new holding company named New East Holdings, Inc. (New Engility). As a result of the business combination, New Engility succeeded to and continues to operate, directly or indirectly, the existing business of Engility and, indirectly, acquired the existing business of TASC. The combined companies now operate under a new holding company, New East Holdings, Inc. which was renamed “Engility Holdings, Inc.” upon the closing of the acquisition. The New Engility common stock, similar to the predecessor Engility common stock, trades on the New York Stock Exchange (NYSE) under the symbol “EGL.”
As a result of the acquisition of TASC, former TASC stockholders now hold approximately 52% of our shares of common stock outstanding as of February 26, 2015. The holders of Engility common stock immediately prior to the business combination with TASC received a special cash dividend of $207 million, or $11.434 per share.
To finance the transaction and special cash dividend, Engility Corporation (n/k/a Engility LLC) entered into an amended and restated bridge financing letter with respect to an unsecured bridge loan facility in the form of a promissory note in the amount of $585 million, which was repaid in full concurrent with the closing through an increase in TASC’s existing first lien credit agreement (assumed by us as of closing) consisting of (i) new senior secured first lien incremental term loans in an aggregate amount of $435 million, (ii) additional senior secured first lien revolving commitments in an aggregate amount of $65 million, and (iii) new senior secured second lien incremental term loans in an aggregate amount of $150 million.
As a condition to the merger agreement, we entered into a Stockholders Agreement, dated February 26, 2015, with Birch Partners, LP (Birch), and for the limited purposes set forth therein, certain investment funds affiliated with Kohlberg Kravis Roberts & Co. L.P. (KKR) and certain investment funds affiliated with General Atlantic LLC (GA) (the Stockholders Agreement). The Stockholders Agreement establishes certain rights, restrictions and obligations of Birch, KKR and GA, and sets forth certain governance and other arrangements relating to Engility, including the right of Birch to designate (i) four directors for nomination to our 11 member board of directors for so long as each of KKR and GA (including their respective affiliates) beneficially own at least 50% of the shares of our common stock it owned as of the date of the Stockholders Agreement and (ii) two directors for nomination to our 11 member board of directors for so long as each of KKR and GA (including their respective affiliates) beneficially own at least 25% of the shares of our common stock it owned as of the date of the Stockholders Agreement.
Our Business Strategy
Our business strategy is anchored by the following five key objectives:
• | Maintain our positions in enduring customer missions and programs by continuing to deliver superior results. We are focused on maintaining strong customer relationships, performance, and price competitiveness amidst increasing market pressures. We have found that when we perform well and provide our services at the lowest competitive price, we are successful at winning recompetitions for that work and retaining the business. Our history of providing over five decades of services and support within our customer base provides the foundation from which we can grow. |
• | Focus our new business efforts on U.S. and global policy mission and program priorities. We play important roles in assisting our customers in the achievement of their objectives in priority mission areas across DoD, the intelligence community, and Federal civilian agencies. Our personnel assist with current and future missions in such areas as intelligence, space architecture and systems engineering, climate change, international capacity development, air traffic management, asymmetric threats, chemical, biological, radiological, nuclear and explosives (CBRNE) deterrence, emergency preparedness and response, non-kinetic warfare tactics, techniques and procedures, command, control, communications, computing, intelligence, surveillance and reconnaissance (C4ISR) technology sustainment, information technology modernization, modeling and simulation, and training and education. We expect to continue to focus our organic new business efforts in these areas as we believe they will remain a high priority for our customers. |
• | Increase market share by providing our full lifecycle of capabilities to our current and potential new customers at the lowest possible cost. Our organic business development strategy is based upon our ability to build on our existing customer relationships and government-wide or agency-specific contract vehicles in order to expand our role with customers across the full spectrum of our services. In addition, we believe that our lean organizational structure allows us to deliver our differentiated and highly specialized services to our customers at the lowest possible cost. In the current challenging budget environment, we believe that market share growth will primarily come from targeting and taking away business that was previously being performed by a competitor, particularly those competitors whose performance or cost structure places them at a competitive disadvantage. |
2
• | Selectively pursue acquisition opportunities to expand our market footprint with adjacent customers and extend our services offerings to include higher value-added capabilities. While our organic strategy is focused on expanding our market share with current and future missions and customers, we will also selectively pursue acquisitions that could offer channels for growth in new markets. Our acquisition of DRC in January 2014 and TASC in February 2015 provided access to new customers where we were underrepresented from a market presence standpoint. Further, these acquisitions provided additional higher value-added service offerings to our suite of capabilities, added scale, which enhance the potential for cost competitiveness by spreading fixed infrastructure costs across a larger contract base, and provided access to new contract vehicles. We expect that our ability to pursue further significant acquisitions will be limited until we pay down a material portion of our outstanding debt. |
• | Focus on the continued generation of free cash flow to pay down existing debt rapidly. As a result of our acquisition of TASC, our total outstanding debt is approximately $1.2 billion as of the closing date of the transaction. Our acquisition of TASC included a significant tax attributes of approximately $1.3 billion as of December 31, 2014 that will reduce our net cash tax expense through 2024, positioning us to generate substantial free cash flow and accelerate the repayment of our existing debt. For the foreseeable future, we expect to use a significant portion of our free cash flow to service our debt obligations. |
Our Competitive Strengths
Our competitive strengths are derived from combining our diverse portfolio of capabilities, with operating efficiency and a sophisticated understanding of our markets and customers’ needs. Our core strengths include:
• | Proven Performance and Customer Trust. Long term success in the services business is not possible without the trust and confidence of our customers, which is primarily based on past program performance and close working relationships. For over five decades, our employees and ideas have contributed to the success of the U.S. military’s and other government agencies’ missions around the world. The majority of our employees work side-by-side with their government counterparts at locations in the United States and around the world, thus developing those critical working relationships. |
• | Efficient Business Model. Following the completion of our strategic realignment in the first quarter of 2013, we now operate as a single integrated company. We proactively streamlined our organization and cost structure to address the realities of the U.S. government’s constrained budget environment. In January 2015, we continued to evolve our efficient business model and implemented another strategic realignment of the business to provide greater focus on our customers and differentiated technical solutions. This new model, which will serve as the foundation for our organizational design and our planned integration with TASC over the coming year, is discussed in greater detail below. |
• | Breadth of Service Offerings. We are one of the leading U.S. government service providers offering a wide breadth of capabilities to our customers. Our employees have deep domain expertise in specialized technical consulting, program and business support services, IT modernization and sustainment, supply chain services and logistics management, and training and education. Further, our culture of performance enables us to rapidly respond to our customers’ immediate and unforeseen requirements. |
• | Diverse Base of Business. As of December 31, 2014, we had over 1,200 active contracts and task orders in more than 50 countries. We have access to task orders on a large number of U.S. government-wide acquisition and indefinite delivery, indefinite quantity (IDIQ) contract vehicles. We also have strong teaming relationships with our industry peers, which allow us access to numerous other contract vehicles. In addition, our business is composed of an increasingly wide range of service offerings, which enables us to capitalize on both demand and funding from our customer base. For the year ended December 31, 2014, our ten largest contracts represented approximately 41% of our consolidated revenue and no single contract accounted for more than 10% of our consolidated revenue. We generated 77% of our revenue as a prime contractor in fiscal year 2014. |
• | Attractive Business Dynamics. As a leading government services provider, we benefit from strong operating cash flows, low capital expenditure requirements and a large addressable market. During the fiscal year ended December 31, 2014, we generated $102 million in cash flow from operations, and our capital expenditures totaled $5 million. Combined with our low fixed cost structure, we believe this provides us with a substantial degree of operating and financial flexibility. |
• | Experienced Workforce and Leadership Team with Deep Industry and Market Knowledge. Crucial to our success is the composition, commitment and experience of our workforce, which possesses a comprehensive understanding of the operating environment of our core customers. Our senior leadership structure is aligned with the perspectives, strategies and priorities of our primary customers. In addition, our understanding of our |
3
customers’ operating environment, strategic objectives and tactical requirements facilitates our ability to plot a strategic approach to expand our share of the government services market.
Our Organizational Design, Capabilities and Customers
Organizational Design
Effective January 2015, we realigned our organization around customer-oriented accounts, each led by an account executive. We made this change to align more closely with our customer’s missions, increase customer intimacy, and improve customer satisfaction. Under this new model, the customer accounts are supported by an operations organization that coordinates and executes functional support, allowing the account executives to devote more of their time to the customer and growing their respective account portfolios. These account executives are in turn led by our Executive Vice President and Chief Operating Officer, who resides within the Office of the President. TASC, which already operated its business using customer-oriented accounts, is being readily integrated into this business model.
Our organization consists of six customer-facing accounts: (i) U.S. Army and Other DoD (ii) U.S. Navy, U.S. Marine Corps, and U.S. Air Force (excluding Air Force space); (iii) National Intelligence; (iv) Space; (v) Federal Civilian; and (vi) International. We also have a small products-oriented portfolio that consists of legacy programs from L-3 and DRC. These programs, which typically generate higher margins than our services portfolio, require different management oversight than our service offerings, and as a result, are organized in a separate products account.
In addition to these accounts, we created a Technical Solutions Group (TSG) that is focused on working with each customer account to bring differentiated technical solutions to our customers.
Our Customers
We have strong and longstanding relationships with the U.S. Government customers we serve, both domestically and abroad. Through the DRC and TASC acquisitions, we have broadened and diversified our customer base, significantly expanding our presence in the Federal Civilian, Intelligence and Space markets. Many of our customer relationships span over 25 years.
• | U.S. Army and other DoD |
U.S. Army. Since 1988, we have provided mission-critical services to the U.S. Army. Recent examples of services that we have provided include: training and education as a partner on the Warfighter Focus program; software engineering and field support; and program management support on the Logistics Modernization Program (LMP). The Army customers we support include Program Executive Office (PEO) for Simulation, Training, and Instrumentation (STRI), PEO Enterprise Information Systems (PEO EIS), Communications Electronic Systems Command (CECOM), Army Contracting Command-Rock Island, and the Intelligence and Security Command (INSCOM).
Other DoD. We provide mission-specific expertise to a variety of other DoD agencies and offices, including DTRA, Defense Health Agency (DHA), Defense Information Systems Agency (DISA), MDA, Office of the Secretary of Defense (OSD), Joint Interoperability Test Command (JITC) and U.S. Transportation Command (TRANSCOM). The services we provide range from CBRNE systems engineering and technical assistance at DTRA to high performance computing support on the User Productivity Enhancement, Technology Transfer and Training (PETTT) for the DoD High Performance Computing Modernization Program (HPCMP) to healthcare program evaluation at DHA on the TRICARE Evaluation, Analysis, and Management Support (TEAMS) contract.
• | U.S. Navy, U.S. Marine Corps, and U.S. Air Force |
U.S. Navy. For over 40 years, we have provided program support, engineering, information technology, and training services for the U.S. Navy. Our clients include the Naval Air Systems Command (NAVAIR), Space and Naval Warfare Systems Command (SPAWAR), Naval Surface Warfare Center (NSWC) and Naval Sea Systems Command (NAVSEA). Examples of our Navy programs include: C4ISR systems engineering support on the U.S.S. Makin Island (LHD-8); program, acquisition, and systems engineering support on the Air 4.1 program under the Seaport Enhanced (SeaPort-e) contract; and provide modeling and simulation and training to the Navy Tactical Training Group Pacific.
U.S. Marine Corps. We have supported the Marines since the 1970s with weapons and systems integration support services, software development, independent verification and validation (IV&V), program management and training support. Examples of the support we have provided include data management and software support services for the Global Combat Support Systems-Marine Corps (GCSS-MC) Unique Identification (IUID) program, acquisition logistics support to the Extensible MAGTF C2 (EMC2) program, technical engineering and training coordination support to the Marine Corps Intelligence, Surveillance, and Reconnaissance Enterprise (MCISR-E), and power-related engineering, analytical, acquisition, and business support services to the Program Manager Expeditionary Power Systems (PM EPS) program.
4
U.S. Air Force. Engility and its subsidiaries have partnered with the U.S. Air Force on non-space programs for over 50 years, providing logistics and sustainment, cybersecurity operations, systems engineering and integration, and modeling and simulation. We also provide the Air Force with the Joint Range Extension (JRE), a tactical data link (TDL) gateway providing multipoint, interoperable, long-haul communication data exchange. Our customers include Air Force Material Command (AFMC), Air Force Research Lab (AFRL) and Air Combat Command (ACC).
• | National Intelligence. As a result of our acquisition of TASC, we have served the intelligence community for over 30 years, providing support from data collection, to production and dissemination of intelligence information. The agencies we support include the NGA, NSA, DIA, the Office of the Director of National Intelligence (ODNI), and other classified customers. |
• | Federal & Civilian Agencies. |
Department of Veterans Affairs (VA). Our staff provides a wide range of expertise to the VA, including management consulting, health promotion and wellness, preventive medicine, epidemiology, disease surveillance, toxicology, and related laboratory sciences. We also provide the VA with a diverse set of functional capabilities, including software development, strategic human capital, workforce planning, and performance management solutions. On the Veterans Relationship Management program, we provide strategic IT portfolio and program management services. On Veterans Benefits Management System (VBMS), we provide agile software development services to transition the VA to enable a paperless-based environment for the processing of benefit claims.
Department of Justice (DoJ). Through our joint venture with AECOM Government Services, we provide long-term staffing, process implementation, and on-going reporting for the DoJ’s Asset Forfeiture Program. In this role, we work side by side with U.S. Attorneys, the U.S. Federal Bureau of Investigation (FBI), the U.S. Marshal's Service, DHS and the DoJ’s Bureau of Alcohol, Firearms, and Explosives. We also provide international law enforcement training through DoJ’s International Criminal Investigative Training Assistance Program (ICITAP) and provide management systems support to the FBI.
Department of Transportation (DOT). For more than 20 years, we have provided research, analysis, and subject matter expertise to the U.S. DOT’s Volpe Transportation Center and the FAA in support of the NextGen Air Traffic Management System. With the TASC acquisition, we have broadened our support to the FAA, helping the FAA acquire, support and field multiple generations of programs, systems, and portfolios of systems successfully.
Other Federal & Civilian. We also support DHS, Department of Treasury, Department of Health and Human Services (DHHS), state and local governments.
• | Space. Through TASC, we have provided support to the space community since the 1960s. We are recognized as a trusted, independent systems engineering and integration firm for space across the defense and intelligence communities providing enterprise architecture, systems engineering and integration, mission assurance and IV&V services. Our customers include the NRO, Air Force Space and Missile Center, Air Force Space Command and NASA. |
• | International. Currently, we operate in over 50 countries and have experience operating in over 140 countries, primarily for the U.S. government. We partner with our customers to provide them with expertise, analysis, planning, and operational capability in support of global security and U.S. foreign policy missions and priorities. Our projects range from small teams supporting specific technology research and analysis, to more extensive, leading-edge policy and operational implementation. We support a diverse set of customers as they execute complex missions and contend with ever-evolving strategic and tactical requirements. |
U.S. Agency for International Development (USAID). We work with USAID to provide comprehensive, integrated programs that help organizations, institutions, and governments develop the capacity to fulfill their oversight and governance functions. We incorporate learning and capacity development, climate resilience, and policy and governance across all of international development projects to ensure sustainability and lasting impact. Areas of expertise include: Energy; Agriculture and Food Security; Transition and Stability; Disaster Preparedness and Response; and Water and the Environment. Specific projects include the Pakistan Power Distribution Improvement Program; Regional Disaster Assistance Program in Latin America and the Caribbean; and USAID’s Worldwide Training program.
Department of State. Since 1998, we have partnered with the DoS providing training and logistics support abroad. As part of the Africa Contingency Operations Training and Assistance (ACOTA) program, we provide operation-specific training and logistics support. Our expertise in rule of law, capacity development, and military operations provides our customers with assurance that we deeply understand their mission and therefore staffing requirements.
5
Other International. We provide a limited amount of engineering, training and other services directly to foreign governments.
The table below presents a summary of our 2014 and 2013 revenue by end customer and the percent of revenue contributed by each. Direct revenue as a prime contractor represents approximately 77% of our consolidated revenue for 2014, and we were a subcontractor or supplier for the remaining 23%.
2014 Revenue | 2014 % of Total Revenue | 2013 Revenue | 2013 % of Total Revenue | ||||||||||
(in thousands) | (in thousands) | ||||||||||||
Army | $ | 337,565 | 25 | % | $ | 461,022 | 33 | % | |||||
Navy/Marines | 335,354 | 25 | % | 412,899 | 29 | % | |||||||
Air Force | 64,491 | 5 | % | 47,261 | 3 | % | |||||||
Other Defense | 110,729 | 8 | % | 69,110 | 5 | % | |||||||
Total DoD | 848,139 | 63 | % | 990,292 | 70 | % | |||||||
Other U.S. Government | 488,159 | 35 | % | 387,460 | 28 | % | |||||||
Total U.S. Government | 1,336,298 | 98 | % | 1,377,752 | 98 | % | |||||||
Commercial and International | 30,793 | 2 | % | 29,620 | 2 | % | |||||||
Total revenue | $ | 1,367,091 | 100 | % | $ | 1,407,372 | 100 | % | |||||
Our Capabilities
We support our customers with a wide range of specialized technological and mission expertise, including the new capabilities brought by the TASC and DRC transactions. Our portfolio of offerings reflects a continuum or “lifecycle” of capabilities that aligns with how and what our customers buy in terms of services. Our offerings include: specialized technical consulting; program and business support services; engineering and technology lifecycle support; information technology modernization and sustainment; supply chain services and logistics management; and training and education.
Specialized Technical Consulting. We partner with our customers to provide them with expertise, analysis, planning, and operational capability in support of global security and U.S. foreign policy missions and priorities. Our projects range from small teams supporting specific technology research and analysis, to more extensive, leading-edge policy and operational implementation. We support a diverse set of customers as they execute complex missions and contend with ever-evolving strategic and tactical requirements. Examples of our current policy and mission focus areas include: Intelligence Missions and Operations; Healthcare Services & Solutions; International Capacity Development; Transportation Systems; CBRNE and Asymmetric Threat Services; High Performance Computing and Data Analytics; Cyber Forensics; Global Climate Change; Financial and Regulatory Reform; and Geospatial Intelligence.
Program and Business Support Services. We offer a range of program and business support services that complement our mission expertise including strategic planning, acquisition support, program management and enterprise transformation. Our program and business support offerings enable our customers to enhance their capabilities on a cost-effective basis and capitalize on specific expertise to better design, evaluate, and implement their programs simultaneously. Our personnel assist customer program offices to develop and analyze requirements, perform analysis of alternatives, conduct capability assessments, develop program roadmaps, and accomplish core business processes efficiently.
Engineering and Technology Lifecycle Support. We provide engineering and integration solutions that support our customers throughout the acquisition and sustainment lifecycle of their programs. By combining engineering expertise, domain knowledge, disciplined program management, and robust analytical tools and processes, we support the systems life cycle from concept development through deployment and operations. We support C4ISR, mission-specific systems, software, hardware, and platforms in a holistic manner. Our service offerings include systems engineering and integration, modeling and simulation, test and evaluation, software engineering and sustainment, hardware engineering, sustainment, upgrade and modernization.
Information Technology Modernization and Sustainment. Our capabilities in information technology (IT) are primarily focused on project management, software development and integration, hardware and network implementation, network and information security, cybersecurity and information assurance, mobile application development, enterprise architecture, and secure cloud computing. We support several large scale enterprise system implementations utilizing agile software development, service-oriented architecture (SOA), and commercial off the shelf (COTS) integration processes.
Supply Chain and Logistics Management Services. A critical component of our customers’ missions and product support lifecycles is the ability to manage, execute, and maintain their operations effectively and efficiently, often on a global scale. Our supply chain services and logistics management expertise are a key enabler to our other service offerings, especially
6
with our international customers. We provide our customers with logisticians and rapid response or long-term solutions for warehousing, asset management, kitting, shipping, and receiving. We frequently participate in integrated teams for various products, develop and execute logistics staffing plans and coordinate system evaluations.
Training and Education. We support military, law enforcement, other U.S. Federal agencies, and foreign militaries with a wide range of training and education services. Training is critical in order to enable our customers to meet and overcome the challenges of a rapidly changing global environment. Leveraging proven processes, we define, design, develop, implement, and assess training and education solutions for our customers. In 2014 we were recognized as one of the Top 100 Simulation and Training Companies by Military Training Technology.
Competition
We serve a broad range of customers within the government services market and compete against a range of companies that specialize in certain segments of the market as well as others that cut across a broader range of customers. Those competitors that are most like Engility in terms of their breadth of market coverage include services-focused companies such as Booz Allen Hamilton, CACI International Inc., ManTech International Corporation, Vencore, Leidos, SCITOR, Sotera and Science Applications International Corporation (SAIC); operating units of large multi-segment defense contractors and industry conglomerates including AECOM Technology Corporation, BAE Systems, Inc., Computer Sciences Corp, General Dynamics Corporation, Jacobs Engineering Group Inc., Lockheed Martin Corp., Northrop Grumman Corporation and Raytheon Company; as well as many other large and small entities depending on the expertise requirements of government customers.
Intense competition and constrained customer budgets are both key characteristics of our business and the government services industry. Large single award contracts are more limited and have a longer lifecycle from competition to award. Sole source awards do occur but only in certain segments of our business, such as in our intelligence markets, where competition may be much more limited due to the specialized nature of the tasks being performed. It is becoming common in this industry for government customers to award work via multiple award IDIQ contracts under which individual task orders are bid by the prime contractors and their teams. The prime contractor position on the IDIQ contract vehicles is a strategic position. These task orders may be of shorter duration than previous awards providing more funding flexibility to the customer but limiting revenue visibility to the contractor. It is not uncommon to compete for a contract award against a peer company and simultaneously serve as prime contractor or subcontractor of such competitor on other contracts.
Our success in the competitive government services industry depends upon our ability to develop and market our services, as well as our ability to provide the people, planning and resource management, technologies and financial capacity needed to deliver those services with maximum efficiency. Services markets are generally more labor intensive and typically have shorter-duration contracts than many product-oriented markets. At the same time, the nature of most U.S. government programs and services, conducted under binding contracts, allows companies that perform well to benefit from a level of program continuity not common in many industries. Our ability to compete successfully in the services marketplace depends on a number of factors, the most important of which is the capability to deploy skilled professionals at competitive prices across the diverse spectrum of these markets. Accordingly, we have implemented various workforce initiatives to help ensure our success in attracting, developing and retaining sufficient resources to maintain or improve our competitive position within these markets. Moreover, we generally have more ability to control the costs bid on a particular opportunity when we bid as a prime contractor, versus as a subcontractor.
Employees
Our employees are our most valuable resource. We are in continuous competition for highly-skilled professionals in virtually all of our business areas. The success and growth of our business is significantly correlated with our ability to recruit, train, promote and retain high quality people at all levels of the organization. As of December 31, 2014, we employed approximately 6,600 individuals globally and operated in over 50 countries, with approximately 16% of our employees located outside of the United States. As a result of the TASC acquisition, our combined workforce is over 10,000 employees worldwide. We are led by an experienced executive team, which is composed of industry, U.S. military and government veterans. We believe that relations with our employees are positive.
Contracts
Approximately 98% of our revenue is generated from programs (revenue arrangements) that require us to perform services that are not related to production of tangible assets and are covered by accounting standards for revenue arrangements with the U.S. government. This revenue is recognized when there is persuasive evidence of an arrangement, delivery has occurred or services have been performed, the selling price to the buyer is fixed or determinable and collectability is reasonably assured.
Generally, the sales price arrangements for our contracts are cost-plus, time-and-material, or fixed-price type. Commensurate with the greater levels of risk we assume on a fixed-price type contract, a fixed-price type contract typically offers a higher profit margin potential than a cost-plus type or time-and-material type contract.
7
On a cost-plus type contract (revenue arrangement), we are paid our allowable incurred costs plus a profit which can be fixed or variable depending on the contract’s fee arrangement up to predetermined funding levels determined by our customers. Cost-plus type contracts with award fee provisions are our primary variable contract fee arrangement. Award fees provide for a fee based on actual performance relative to contractually specified performance criteria. Revenue and profit on award fees are recorded when awarded by the customer.
On a time-and-material type contract (revenue arrangement), we are paid on the basis of direct labor hours expended at specified fixed-price hourly rates (that include wages, overhead, allowable general and administrative expenses and profit) and materials at cost.
Revenue for fixed-price service contracts that do not contain measurable units of work performed is generally recognized on a straight-line basis over the contractual service period, unless evidence suggests that the revenue is earned, or obligations fulfilled, in a different manner. Revenue for fixed-price service contracts that contains measurable units of work performed is generally recognized when the units of work are completed. Revenue for fixed-price type contracts covered by contract accounting standards is recognized using a ratio of actual cumulative costs incurred to total estimated costs at completion of the contract multiplied by the total estimated contract revenue, less cumulative revenue recognized in prior periods. A single estimated total profit margin is used to recognize profit. Losses on contracts are recognized in the period in which they become evident. The impact of revisions of contract estimates, which may result from contract modifications, performance or other reasons, are recognized on a cumulative catch-up basis in the period in which the revisions are made.
Many of our cost-plus, time-and-material, and fixed price type contracts are task orders awarded through IDIQ type contracts. Revenue from IDIQ contracts was approximately 81% of our revenue in 2014. In most cases, IDIQ contracts are awarded to multiple contractors and the award of an IDIQ contract does not represent a firm order for services. Generally, under an IDIQ contract, the government is not obligated to order a minimum of services or supplies from its contractor, irrespective of the total estimated contract value. Furthermore, under a multi-award IDIQ program, the customer develops requirements for task orders that are competitively bid against all of the contract awardees. However, many contracts also permit the U.S. government to direct work to a specific contractor.
Regulatory Matters
We serve as a prime contractor or major subcontractor for numerous U.S. government programs. As a result, we are subject to extensive regulations and requirements of the U.S. government agencies and entities which govern these programs, including with respect to the award, administration and performance of contracts under such programs. We are also subject to certain unique business risks associated with U.S. government program funding and appropriations and U.S. government contracts, and with supplying technologically advanced, cutting-edge defense-related services and products to the U.S. government.
U.S. government contracts generally are subject to the Federal Acquisition Regulation (FAR), which sets forth policies, procedures and requirements for the acquisition of goods and services by the U.S. government, agency-specific regulations that implement or supplement FAR, such as the DoD’s Defense Federal Acquisition Regulation Supplement, and other applicable laws and regulations. These regulations impose a broad range of requirements, many of which are unique to government contracting, including various procurement, import and export, security, contract pricing and cost, contract termination and adjustment, and audit requirements. A contractor’s failure to comply with these regulations and requirements could result in reductions to the value of contracts, contract modifications or termination, and the assessment of penalties and fines that could lead to suspension or debarment, for cause, from government contracting or subcontracting for a period of time. In addition, government contractors are also subject to routine audits and investigations by U.S. government agencies such as the Defense Contract Audit Agency (DCAA). These agencies review a contractor’s performance under its contracts, cost structure and compliance with applicable laws, regulations and standards. The DCAA also reviews the adequacy of and a contractor’s compliance with its internal control systems and policies, including the contractor’s accounting, purchasing, government property, estimating, and related business systems.
U.S. government programs are generally implemented by the award of individual contracts and subcontracts. Congress generally appropriates funds on a fiscal year basis even though a program may extend across several fiscal years. Consequently, programs are often only partially funded at the outset, and additional funds are committed only as Congress makes further appropriations. The contracts and subcontracts under a program generally are subject to termination for convenience or adjustment if appropriations for such programs are not available or change. The U.S. government is required to equitably adjust a contract price for additions or reductions in scope or other changes ordered by it.
We are also involved in U.S. government programs which are classified by the U.S. government and cannot be specifically described in this Annual Report. The operating results of these classified programs are included in our financial statements. The business risks and considerations associated with these classified programs generally do not differ materially from those of our other U.S. government programs and products, and are subject to the same oversight and internal controls as other U.S. government programs.
8
We are subject to government regulations and contract requirements which may differ from U.S. government regulation with respect to our revenue from non-U.S. customers. Revenue and income from international operations and investments are subject to U.S. government laws, regulations and policies, including the International Traffic in Arms Regulations (ITAR) and the Foreign Corrupt Practices Act (FCPA) and export laws and regulations, as well as foreign government laws, regulations and procurement policies and practices, which may differ from U.S. government regulation, including import-export control, investments, exchange controls, repatriation of earnings and requirements to expend a portion of program funds in-country.
Available Information
Our principal executive offices are located at 3750 Centerview Drive, Chantilly, Virginia 20151. Our telephone number is 703-708-1400. Our annual report on Form 10-K, quarterly reports on Form 10-Q, current reports on Form 8-K, and all amendments to those reports will be made available free of charge through the Investor Relations section of our website (http://www.engilitycorp.com) as soon as practicable after such material is electronically filed with, or furnished to, the Securities and Exchange Commission (SEC). Material contained on our website is not incorporated by reference into this report.
The public may also read and copy any materials that we file with the SEC at the SEC’s Public Reference Room at 100 F Street, NE, Washington, D.C. 20549. The public may obtain information on the operation of the Public Reference Room by calling the SEC at 1-800-SEC-0330. The SEC also maintains an Internet website that contains reports, proxy and information statements and other information regarding issuers, including us, that file electronically with the SEC located at http://www.sec.gov.
9
Item 1A. RISK FACTORS
Our business, financial condition and results of operations are subject to various risks and uncertainties, including those described below and elsewhere in this Annual Report on Form 10-K. This section discusses factors that, individually or in the aggregate, we think could cause our actual results to differ materially from expected and historical results. Our business, financial condition, results of operations, or cash flows could be materially adversely affected by any of these risks.
We note these factors for investors as permitted by the Private Securities Litigation Reform Act of 1995. You should understand that it is not possible to predict or identify all such factors. Consequently, you should not consider the following to be a complete discussion of all potential risks or uncertainties applicable to our business.
Risks Related to our Business
We face the following risks related to the general conditions and trends of the industry in which we operate:
We rely predominantly on contracts with U.S. government entities, and the loss or delay of a significant number of our contracts would have a material adverse effect on our results of operations and cash flows.
Our revenue is derived predominantly from providing services under contracts (revenue arrangements) with agencies of, and prime contractors to, the U.S. government. Although these various agencies and prime contractors are subject to common budgetary pressures and other factors, our customers exercise independent purchasing decisions. The loss or delay of all or a substantial portion of our revenue from the U.S. government would have a material adverse effect on our results of operations and cash flows. Approximately 98% of our revenue for the year ended December 31, 2014 was attributable directly or indirectly to U.S. government departments and agencies. Aggregate revenue from our ten largest contracts amounted to approximately $565 million, or 41%, of our revenue for the year ended December 31, 2014.
In addition to contract cancellations and declines in agency budgets, our backlog and future financial results may be adversely affected by:
• | curtailment of the U.S. government’s use of services providers, including curtailment due to government budget reductions and related fiscal matters; |
• | developments in Iraq, Afghanistan and Pakistan, or other geopolitical events that affect demand for our services; and |
• | longer lead times for the government to fully fund awarded contracts |
Currently, the U.S. government is experiencing a substantial delay in its contract actions, which may result in delays of new awards we depend on for new or increased revenue or a delay in our receipt of revenue under these awards. These delays are caused by a number of factors, including uncertainty among our customers regarding the availability of funds to procure new programs and services, and other factors related to, but not limited to, recent budget and sequestration uncertainties and activities, as discussed below.
Finally, the government services marketplace is characterized by contracts of shorter duration as compared to large productions and systems integration programs. Services contracts may, including options, extend to ten or fifteen years, but most usually last five years or less.
Future declines in the U.S. defense budget, or future government shutdowns or a failure to increase the debt ceiling, could result in a material decrease in our revenue, results of operations and cash flows.
Our government contracts and revenue are primarily correlated and dependent upon the U.S. defense budget which is subject to the congressional budget authorization and appropriations process. Congress usually appropriates funds for a given program on a September 30 fiscal year basis, even though contract periods of performance may extend over many years. Consequently, at the beginning of a major program, the contract is usually partially funded, and additional monies are normally committed to the contract by the procuring agency only as appropriations are made by Congress in future fiscal years. DoD budgets are a function of several factors beyond our control, including, but not limited to, changes in U.S. government procurement policies, budget considerations, current and future economic conditions, presidential administration priorities, changing national security and defense requirements, geo-political developments and actual fiscal year congressional appropriations for defense budgets. Any of these factors could result in a significant decline in, or redirection of, current and future DoD budgets and impact our future results of operations and cash flows.
U.S. Government programs are subject to annual congressional budget authorization and appropriation processes. For many programs, Congress appropriates funds on a fiscal year basis even though the program performance period may extend over several years. Consequently, programs are often partially funded initially and additional funds are committed only as Congress makes further appropriations. If we incur costs in excess of funds obligated on a contract, we may be at risk for reimbursement of those costs unless and until additional funds are obligated to the contract. We cannot predict the extent to
10
which total funding and/or funding for individual programs will be included, increased or reduced as part of the annual budget process ultimately approved by Congress or in separate supplemental appropriations or continuing resolutions, as applicable. Plans adopted by the U.S. Government, along with pressures on, and uncertainty surrounding, the Federal budget, sequestration, the appropriations process, and the permissible Federal debt limit, could adversely affect the funding for individual programs and delay purchasing or payment decisions by our customers. In the event government funding for our significant programs becomes unavailable, or is reduced or delayed, our contract or subcontract under such programs may be terminated or adjusted by the U.S. Government or the prime contractor.
U.S. government appropriations have and likely will continue to be affected by larger U.S. government budgetary issues and related legislation. On March 1, 2013, pursuant to the Budget Control Act of 2011 as amended by the American Taxpayer Relief Act of 2012 (BCA), a sequestration went into effect resulting in a 7.8% reduction to the DoD budget for fiscal year (FY) 2013, excluding funding for military personnel. Under the BCA, over the FY 2013-FY 2021 period, the DoD budget will see a total reduction of approximately $500 billion. The Bipartisan Budget Act of 2013 amended the BCA and reduced the amount of the sequestration by a total of $63 billion for FY 2014 and FY 2015. The final FY 2015 DoD base budget (excluding funding for overseas contingency operations) appropriation enacted into law in January 2015 was approximately $500 billion, which is similar to the level of funding for the DoD in FY 2014, and FY 2016 is expected to be funded at a similar level.
The statutory limit on the amount of permissible Federal debt (the debt ceiling) was suspended until March 15, 2015. If the existing debt ceiling is not raised, we may be required to continue to perform for some period of time on certain of our U.S. government contracts even if the U.S. government is unable to make timely payments. An extended debt ceiling breach could negatively affect the U.S. government's timely payment of our billings, resulting in delayed cash collection, and have significant consequences for our company, our employees, our suppliers and the defense industry. In addition, the U.S. government has been, on a number of occasions, unable to complete its budget and appropriations process before the end of its fiscal year, which resulted in it operating under a continuing resolution (CR) for extended periods, as well as a brief partial shutdown of the U.S. government in October 2013.
Significant delays or reductions in appropriations, an extended debt ceiling breach, and/or future budget and program decisions may negatively impact our business and programs and could have a material adverse effect on our financial position, results of operations and/or cash flows.
The DoD’s wide-ranging efficiencies initiative, which targets affordability and cost growth, could have a material effect on the procurement process and may adversely affect our existing contracts and the awards of new contracts.
The U.S. government has issued guidance regarding changes to the procurement process that is intended to control cost growth throughout the acquisition cycle by developing a competitive strategy for each program. As a result, we expect to engage in more frequent negotiations and re-competitions on a cost or price analysis basis with most competitive bids in which we participate. This initiative is organized into five major areas: affordability and cost growth; productivity and innovation; competition; services acquisition; and processes and bureaucracy. Because this initiative has significantly changed the way the U.S. government solicits, negotiates and manages its contracts, this initiative has resulted in a reduction in expenditures for services we provide to the U.S. government. These initiatives may adversely affect our existing contracts and awards of new contracts and our results of operations and cash flow.
Businesses that we may acquire may fail to perform to expectations, and we may be unable to successfully integrate acquired businesses with our existing business.
Acquisitions of assets or entities designed to accelerate the implementation of our strategic plan are an important element of our long-term strategy. Pursuant to this strategy, we acquired DRC in January 2014 and closed on the acquisition of TASC on February 26, 2015. The acquisition and integration of businesses such as DRC and TASC involve a number of risks.
We may not be able to realize all or a substantial portion of the anticipated benefits of the DRC acquisition, the TASC acquisition and other future acquisitions that we may consummate. DRC, TASC and other future acquired businesses may not achieve expected results of operations, including expected levels of revenue, and may require unanticipated costs and expenditures. In addition, following completion of the DRC acquisition, the TASC acquisition or other future acquisitions, we may not be able to maintain the levels of revenue, earnings or operating efficiency that we and the acquired business have achieved or might achieve separately. DRC, TASC and other acquired businesses may also subject us to liabilities that we were unable to discover in the course of our due diligence, including the failure of a target company to have fulfilled its contractual obligations to the U.S. government or other customers, which may result in additional financial responsibility, harm to our reputation or other adverse effects caused by such liabilities or issues. In addition, the integration of DRC, TASC and other newly acquired businesses may be expensive and time-consuming and may not be entirely successful. Integration of the acquired businesses may also place additional pressures on our systems of internal control over financial reporting. DRC, TASC and other future acquired businesses can also raise potential organizational conflicts of interest (OCI) issues that can impact the nature and timing of the acquisition or our ability to compete for future contracts where the acquired company may have been involved. In addition, the process of integrating the operations of DRC, TASC or those of any other future
11
acquisition could cause an interruption of, or loss of momentum in, the activities of one or more of our combined businesses and the possible loss of key personnel. If we are unable to integrate DRC, TASC and other newly acquired businesses successfully or if DRC, TASC or other acquired businesses fail to produce targeted results, it could have an adverse effect on our results of operations or financial condition.
We assumed significant debt in connection with our acquisitions of TASC and DRC, and we may incur additional debt in the future. Such debt could adversely affect our business, financial condition or results of operations.
In connection with our acquisition of TASC, we incurred and/or assumed approximately $1.2 billion in debt, including the assumption of approximately $614 million of existing TASC net debt, to refinance our existing debt and to finance a portion of a special cash dividend to our stockholders in connection with the acquisition of TASC along with the transaction fees and expenses associated with the acquisition of TASC. During 2014, we incurred and/or assumed approximately $190 million in debt, including to finance the repayment of approximately $86 million in existing DRC debt. We currently depend on cash on hand and cash flows from operations to make scheduled debt payments. The annualized principal and cash interest payments on our debt is approximately $120 million, and we currently have approximately $66 million in cash on hand. We expect to be able to meet the estimated principal and interest payments on our debt through a combination of cash on hand and expected cash flows from operations. Additionally, we may incur further debt in the future for other corporate purposes.
The potentially significant negative consequences on our financial condition and results of operations that could result from our substantial debt include:
• | limitations on our ability to obtain additional debt or equity financing for working capital, capital expenditures, service line development, debt service requirements, acquisitions and general corporate or other purposes; |
• | instances in which we are unable to meet the financial covenants contained in our debt agreements or to generate cash sufficient to make required debt payments, which circumstances would have the potential of accelerating the maturity of some or all of our outstanding debt; |
• | the allocation of a substantial portion of our cash flow from operations to service our debt, thus reducing the amount of our cash flow available for other purposes, including operating costs and capital expenditures, that could improve our competitive position, results of operations or share price; |
• | requiring us to sell debt or equity securities or to sell some of our core assets, possibly on unfavorable terms, to meet payment obligations; |
• | exposing us to the risk of increased interest rates, as certain of our borrowings are at variable rates of interest; |
• | increasing our vulnerability to downturns or adverse changes in general economic, industry or competitive conditions and adverse changes in government regulations; |
• | compromising our flexibility to plan for, or react to, competitive challenges in our business and limiting our ability to adjust to changing market conditions; |
• | the possibility that we could be put at a competitive disadvantage with competitors that do not have as much debt as we do and competitors that may be in a more favorable position to access additional capital resources; and |
• | limitations on our ability to execute business development and acquisition activities to support our strategies. |
Our use of TASC’s net operating loss carryforwards and other tax attributes to offset future taxable income may become limited as a result of the transaction or future transactions in our stock.
We have estimated that TASC had net operating loss (NOL) carryforwards for U.S. Federal income tax purposes of at least $293 million as of December 31, 2014 and that TASC had adjusted tax basis in its amortizable goodwill and other intangible assets of at least $1.0 billion as of December 31, 2014. Under Sections 382 and 383 of the Internal Revenue Code of 1986, as amended (the “Code”), if a corporation undergoes an “ownership change,” the corporation’s ability to use its pre-change net operating loss carryforwards and other pre-change tax attributes, such as its adjusted tax basis in its amortizable goodwill, to offset its post-change income and taxes may be limited. In general, an “ownership change” occurs if there is a cumulative increase in ownership by “5-percent shareholders” (within the meaning of Section 382 of the Code) that exceeds 50 percentage points over a rolling three-year period. If a corporation has a “net unrealized built-in loss,” generally meaning that, immediately before an ownership change, the fair market value of its assets was less than the aggregate tax basis of its assets, then any “built-in loss” recognized during the first five years after the change date (including through amortization deductions) may be limited. In connection with the closing of the TASC transaction, TASC received an opinion from a major national accounting firm to the effect that the business combination involving TASC, taken together with the other transactions contemplated by the merger agreement and occurring on the closing date and taking into account the issuance of the maximum number of shares of Engility common stock issuable following the closing in respect of equity awards outstanding under the
12
Engility stock plans as of the closing date, will not result in an ownership change of TASC within the meaning of Section 382(g) of the Code and that TASC will not have had a cumulative owner shift under Section 382 of the Code of more than 49.1 percentage points during the “testing period” (as defined in Section 382(i) of the Code) ending on the closing date after giving effect to the business combination and the other transactions contemplated by the merger agreement and taking into account the issuance of the maximum number of shares of Engility common stock issuable following the closing in respect of equity awards outstanding under the Engility stock plans as of the closing date. It was a condition to our obligation to complete the business combination that such opinion be in form and substance reasonably acceptable to us. The opinion neither binds the Internal Revenue Service (IRS) nor precludes the IRS from adopting a contrary position. In the event that the IRS were to determine that the business combination caused an ownership change with respect to TASC to occur on the effective date of the business combination, Section 382 of the Code would apply to limit our use of any remaining net operating losses and other pre-change tax attributes after the effective date of the business combination. Usage of our NOLs and other pre-change tax attributes after the effective date of the business combination would also be adversely affected if an ownership change within the meaning of Section 382 of the Code were to occur after the effective date of the business combination. In order to reduce the likelihood of an ownership change after the effective date of the business combination, our common stock is generally subject to certain transfer restrictions as set forth in our charter and as described below under “Anti-takeover provisions in our organizational documents and Delaware law, and restrictions on our charter related to our acquisition of TASC, could delay or prevent a change in control”. However, there can be no assurances that these restrictions will prevent an ownership change from occurring in the future.
As a result of the consummation of the acquisition of TASC, we may not be able to participate in a potential consolidation in our industry for several years.
Under Section 382 of the Code, if a corporation undergoes an “ownership change” as defined in that section, the corporation’s ability to use its pre-change NOLs and other pre-change tax attributes to offset its post-change income may become subject to significant limitations. As a result, it may be more difficult for us to be acquired or to engage in strategic acquisitions because such transactions could result in a limitation on the utilization of our NOLs and other tax attributes. For example, our ability to use equity as consideration in a strategic transaction may be limited because such an equity issuance could result in an ownership change. If an ownership change were to occur, our ability to use any NOLs and certain other tax attributes existing at that time could be significantly limited.
There is intense competition for contracts in our industry and awards are frequently protested by unsuccessful bidders. Thus, we may not be able to win competitively awarded contracts and, when we win, such awards may still be delayed or canceled. Increased competition may reduce our revenue and require us to accept lower profit margins on our awarded contracts, which could have a material adverse effect on our business, financial condition, results of operations and future prospects.
We may not be able to continue to win competitively awarded contracts at our historic levels. The markets in which our businesses operate are highly competitive and our government contracts are usually subject to competitive bidding. We expect increased competition because of the uncertainty of future U.S. defense and government service budgets. Furthermore, the current competitive environment has resulted in an increase of bid protests from unsuccessful bidders, which typically extends the time until work on a contract can begin and, in some cases, can result in cancellation of the protested contract award. Additionally, some of our competitors are larger than we are and have more financial and other resources than we have. In addition, the revenue and profit margins on our awarded contracts may not be sufficient to maintain our current levels of profitability. We are also subject to risks associated with the substantial time, effort and experience required to prepare bids and proposals for competitively awarded contracts that may not be awarded to us.
We believe the principal points of competition in our markets are price, performance, reliability and responsiveness, domain knowledge, and reputation. Maintaining and improving our competitive position will require continued investment by us in marketing, customer service and support. We may not be successful in maintaining our competitive position. Our competitors may develop more efficient or effective methods of providing services or may adapt more quickly than we do to evolving customer requirements. Additionally, increased competition could increase pricing pressures resulting in margin decline to stay competitive. Failure to continue competing successfully could adversely affect our business, financial condition, results of operations and cash flow.
Our IDIQ contracts are not firm orders for services, and we may generate limited or no revenue from these contracts which could adversely affect our operating performance.
Revenue from IDIQ contracts was 81% of our revenue in 2014. IDIQ contracts are typically awarded to multiple contractors and the award of an IDIQ contract does not represent a firm order for services. Generally, under an IDIQ contract, the government is not obligated to order a minimum of services or supplies from its contractor, irrespective of the total estimated contract value. Furthermore, following an award under a multi-award IDIQ program, the customer develops requirements for task orders that are competitively bid against all of the contract awardees. However, many contracts also
13
permit the U.S. government to direct work to a specific contractor. Notwithstanding our cost reduction measures and strategic realignment, we may not win new task orders under these contracts for various reasons, including price, past performance and responsiveness, among others, which would have an adverse effect on our operating performance and may result in additional expenses and loss of revenue. There can be no assurance that our existing IDIQ contracts will result in actual revenue during any particular period or at all.
Our government contracts contain unfavorable termination and suspension provisions and are subject to audit and modification. If a termination or suspension right is exercised by the government, it could have a material adverse effect on our business, financial condition, results of operations and cash flows.
Companies engaged primarily in supplying defense-related services to U.S. government agencies are subject to certain industry specific risks including the ability of the U.S. government to unilaterally:
• | terminate existing contracts; |
• | reduce the value of existing contracts; |
• | audit our contract-related costs and fees, including allocated indirect costs; |
• | control and potentially prohibit the export of our services and associated products; and |
• | suspend us from receiving new contracts pending resolution of alleged violations of procurement laws or regulations. |
All of our U.S. government contracts can be terminated by the U.S. government either for its convenience or if we default by failing to perform under the contract. Termination for convenience provisions provide only for our recovery of costs incurred or committed settlement expenses and profit on the work completed prior to termination. Termination for default provisions provide for the contractor to be liable for excess costs incurred by the U.S. government in procuring undelivered items from another source and could damage our reputation, and impair our ability to compete for future contracts. Our contracts with foreign governments generally contain similar provisions relating to termination at the convenience of the customer.
U.S. government agencies, including the DCAA and various agency Inspectors General, routinely audit and investigate our costs and performance on contracts, as well as our accounting, business systems and general business practices. Based on the results of such audits, the U.S. government may reduce our contract related costs and fees, including allocated indirect costs. In addition, under U.S. government purchasing regulations, some of our costs, including certain business acquisition costs, certain legal costs, most financing costs, and certain marketing expenses may not be reimbursable under U.S. government contracts.
Our results of operations and cash flows are substantially affected by our mix of cost-plus, time-and-material and fixed-price type contracts.
Our revenue is transacted using written revenue arrangements, or contracts, which are generally cost-plus, time-and-material, or fixed-price. For a description of our revenue recognition policies, see Note 1 to our Consolidated and Combined Financial Statements.
On a cost-plus type contract (revenue arrangement), we are paid our allowable incurred costs plus a profit which can be fixed or variable depending on the contract’s fee arrangement up to predetermined funding levels determined by our customers. Cost-plus type contracts with award fee provisions are our primary variable contract fee arrangement. Award fees provide for a fee based on actual performance relative to contractually specified performance criteria.
On a time-and-material type contract (revenue arrangement), we are paid on the basis of direct labor hours expended at specified fixed-price hourly rates (that include wages, overhead, allowable general and administrative expenses and profit) and materials at cost.
On a fixed-price type service contract (revenue arrangement), we agree to perform the contractual statement of work for a predetermined sales price. Although a fixed-price type contract generally permits us to retain profits if the total actual contract costs are less than the estimated contract costs, we bear the risk that increased costs may reduce our profit or cause us to sustain losses on the contract. This may result in greater risk to our business than under a cost-plus type and time-and-material type contracts where we generally do not bear the risks of unexpected cost overruns, provided that we do not incur costs that exceed the predetermined funded amounts.
If we are unable to attract and retain key management and personnel, we may become unable to operate our business effectively.
Our future success is dependent upon the continued contributions of our management, and our ability to attract and retain highly qualified management and technical personnel, including employees who have U.S. government security
14
clearances, particularly clearances of top-secret and above. We do not maintain any key person life insurance policies for members of our management. We face competition for management and technical personnel from other companies and organizations. Failure to attract and retain such personnel would damage our future prospects.
Goodwill and other intangible assets represent significant assets on our balance sheet and we may experience further impairments.
If we experience additional impairments in our goodwill, or if our other intangible assets become impaired, then we will be required to take further non-cash charges against earnings. In connection with the preparation of our third quarter 2012 financial statements, we recorded a non-cash impairment charge of $426 million following an interim test of our goodwill. While this charge had no impact on our business operations, cash balances or operating cash flows, it resulted in a significant loss from operations during the period. Following this charge, goodwill remains the largest asset on our balance sheet, with an aggregate balance of $645 million and $478 million at December 31, 2014 and 2013, respectively. During 2013 and 2014, we did not record any charges relating to impairment of goodwill or other intangible assets. Since goodwill impairment calculations are based on estimates, including external factors that are outside of our control such as future market and economic conditions, it is possible that we may need to take additional goodwill impairment charges in the future. Goodwill may be further impaired if the estimated fair value of our reporting units’ goodwill is less than the carrying value of the units’ goodwill. We also perform an analysis of our intangible assets to test for impairment whenever events occur that indicate impairment could exist. Examples of such events are: significant adverse changes in the intangible asset’s market value, useful life, or in the business climate that could affect its value; a current-period operating or cash flow loss or a projection or forecast that demonstrates continuing losses associated with the use of the intangible asset; and a current expectation that, more likely than not, the intangible asset will be sold or otherwise disposed of before the end of its previously estimated useful life.
As a U.S. government contractor, we are subject to a number of procurement regulations and could be adversely affected by changes in regulations or any negative findings from a U.S. government audit or investigation.
U.S. government contractors must comply with many significant procurement regulations and other requirements. These regulations and requirements, although customary in government contracts, increase our costs of compliance and, commensurately, the cost of performance. If any such regulations or procurement requirements change, our costs of complying with them could increase and reduce our margins.
We operate in a highly regulated environment and are routinely audited and reviewed by the U.S. government and its agencies such as the DCAA and Defense Contract Management Agency. These agencies review our performance under our contracts, our cost structure, our incurred costs and our compliance with applicable laws, regulations and standards, as well as the adequacy of, and our compliance with, our internal control systems and policies. As a result of our recent business acquisitions, currently we have eight former business units that could be subject to DCAA audit, going back as far as 2002 for certain of these business units. Systems that are subject to review include, but are not limited to incurred cost audits, our accounting systems, purchasing systems, billing systems, property management and control systems, cost estimating systems, compensation systems and management information systems. Any costs found to be unallowable or improperly allocated to a specific contract will not be reimbursed or must be refunded if already reimbursed. If an audit uncovers improper or illegal activities, we may be subject to civil and criminal penalties and administrative sanctions, which may include termination of contracts, forfeiture of profits, suspension of payments, fines and suspension, or prohibition from doing business with the U.S. government. Whether or not illegal activities are alleged, the U.S. government also has the ability to decrease or withhold certain payments when it deems business systems subject to its review to be inadequate or if it believes it is in the government’s best interests during the pendency of a dispute. In addition, we could suffer serious reputational harm if allegations of impropriety were made against us.
Effective January 1, 2013, we implemented a strategic realignment that included material changes in our cost structure. Changes in cost accounting practices are subject to a required procedure for determining the cost impact of any accounting changes. The Federal government is generally protected from paying increased costs resulting from a contractor’s accounting changes. Were the government to require further changes to our cost structure, it could have a material adverse effect on our financial position, results of operations, or cash flows.
From time to time, we are also subject to U.S. government investigations relating to our operations, and we are subject to or expected to perform in compliance with a vast array of Federal laws and regulations, including but not limited to the Truth in Negotiations Act, the False Claims Act, the Procurement Integrity Act, Cost Accounting Standards, the ITAR promulgated under the Arms Export Control Act, the Close the Contractor Fraud Loophole Act and the FCPA. An indictment of the Company by a Federal grand jury, or an administrative finding against us as to our present responsibility to be a U.S. government contractor or subcontractor, could result in us being suspended for a period of time from eligibility for awards of new government contracts or task orders or in a loss of export privileges. In addition, a conviction, or an administrative finding against us that rises to the requisite level of seriousness, could result in debarment from contracting with the U.S. government for a specific term and could result in civil and/or criminal sanctions, as well as reductions of the value of contracts, contract
15
modifications or termination and the assessment of penalties and fines, compensatory or treble damages, which could have a material adverse effect on our financial position, results of operations, or cash flows. We are also limited in our ability to provide information about our classified programs, their risks or any disputes or claims relating to these programs. Classified programs are subject to security restrictions and preclude the dissemination of information that is classified for national security purposes. As a result, investors have less insight into our classified programs than our other businesses and therefore less ability to fully evaluate the risks related to our classified business.
Pension funding and costs are dependent upon several economic assumptions which if changed may cause our future earnings and cash flow to fluctuate significantly.
As a result of the acquisition of DRC, which closed on January 31, 2014, we assumed the obligations under DRC’s then existing defined benefit pension plan (the Pension Plan). The impact of the Pension Plan on our U.S. generally accepted accounting principles (GAAP) earnings may be volatile in that the amount of expense we record for the Pension Plan may materially change from year to year because those calculations are sensitive to funding levels as well as changes in several key economic assumptions, including interest rates, rates of return on plan assets, and other actuarial assumptions including participant mortality estimates. Changes in these factors also affect our plan funding, cash flow, and stockholders’ equity. In addition, the funding of the Pension Plan may be subject to changes caused by legislative or regulatory actions.
We will make contributions to fund the Pension Plan when considered necessary or advantageous to do so. The macro-economic factors discussed above, including the return on assets and the minimum funding requirements established by government funding or taxing authorities, or established by other agreement, may influence future funding requirements. A significant decline in the fair value of the assets in the Pension Plan, or other adverse changes to the Pension Plan could require us to make significant funding contributions and affect cash flows in future periods.
U.S. Government Cost Accounting Standards govern the extent to which postretirement costs and plan contributions are allocable to and recoverable under contracts with the U.S. government. On December 27, 2011 the U.S. Government’s Cost Accounting Standards Board (CASB) published a final rule that harmonizes Cost Accounting Standards (CAS) pension cost reimbursement rules with the Pension Protection Act of 2006 (PPA) funding requirements. The rule is expected to eventually mitigate the mismatch between CAS costs and PPA-amended Employee Retirement Income Security Act of 1974 (ERISA) minimum funding requirements, and result in an acceleration of allowable CAS pension costs as compared to the prior rules. We anticipate that government contractors will be entitled to an equitable adjustment for any additional CAS contract costs resulting from the final rule. As a result, we have sought and expect to continue to seek reimbursement from the U.S. government for a portion of our postretirement costs and plan contributions. For additional information related to our pension funding and costs, see Note 11 to the Consolidated and Combined Financial Statements in this Form 10-K for additional information
We are subject to the risks of current and future legal and regulatory proceedings, which could have a material adverse effect on our business, financial condition, results of operations, cash flows and future prospects.
We are subject to potential liability relating to claims, complaints and proceedings as well as various laws, ordinances, regulations and other requirements of government authorities in foreign countries and in the United States, any violations of which could potentially create a substantial liability for us, and also could cause harm to our reputation. Changes in laws, ordinances, regulations or other government policies, the nature, timing, and effect of which are uncertain, may significantly increase our expenses and liabilities.
From time to time, we are involved in legal proceedings that are incidental to the operation of our businesses. We may become subject to significant claims of which we are currently unaware, or the claims of which we are aware may result in our incurring a significantly greater liability than we anticipate or can estimate. Additionally, we may receive fines or penalties if a regulatory agency determines that we have failed to comply with laws, regulations or orders applicable to our business.
Misconduct, fraud or other improper activities by our employees, subcontractors, agents or business partners could also have a significant adverse impact on our business and reputation. Such misconduct could include the failure to comply with Federal, state or local government procurement regulations, regulations regarding the protection of classified information, legislation regarding the pricing of labor and other costs in government contracts, laws and regulations relating to bribery of foreign government officials, import-export control, lobbying or similar activities, and any other applicable laws or regulations.
Misconduct involving data security lapses resulting in the compromise of personal information or the improper use of our customer’s sensitive or classified information could result in remediation costs, regulatory sanctions against us and serious harm to our reputation. Other examples of potential misconduct include falsifying time or other records and violations of the U.S. Anti-Kickback Act. Although we have implemented policies, procedures and controls to prevent and detect these activities, these precautions may not prevent all misconduct and as a result, we could face unknown risks or losses. Our failure to comply with applicable laws or regulations or misconduct by any of our employees, subcontractors, agents or business partners could subject us to fines and penalties, loss of security clearance, loss of current and future customer contracts and
16
suspension or debarment from contracting with Federal, state or local government agencies, any of which would adversely affect our business, our reputation and our future results.
Although we maintain insurance policies, these policies may not be adequate to protect us from all material judgments and expenses related to current or future claims and may not cover the conduct that is the subject of the litigation. Desired levels of insurance may not be available in the future at economical prices or at all. In addition, we believe that while we have valid defenses with respect to legal matters pending against us, the results of litigation can be difficult to predict, including those involving jury trials. Accordingly, our current judgment as to the likelihood of our loss (or our current estimate as to the potential range of loss, if applicable) with respect to any particular litigation matter may turn out to be wrong. A significant judgment against us, arising out of any of our current or future legal proceedings and litigation, could have a material adverse effect on our business, financial condition, results of operations, cash flows and future prospects.
We are subject to risks associated with operating internationally.
Our business operations are subject to a variety of risks associated with conducting business internationally, including:
• | Changes in or interpretations of foreign laws or policies that may adversely affect the performance of our services; |
• | Political instability in foreign countries; |
• | Imposition of inconsistent laws or regulations; |
• | Conducting business in places where laws, business practices and customs are unfamiliar or unknown; and |
• | Imposition of limitations on or increase of withholding and other taxes on payments by foreign subsidiaries or joint ventures. |
In addition, our U.S. and foreign operations are subject to the FCPA and similar worldwide anti-corruption laws, including the U.K. Bribery Act of 2010, which generally prohibit companies and their intermediaries from making improper payments to non-U.S. officials for the purpose of obtaining or retaining business. Our internal policies mandate compliance with these anti-corruption laws. We operate in many parts of the world that have experienced governmental corruption to some degree and, in certain circumstances, strict compliance with anti-corruption laws may conflict with local customs and practices. Despite our training and compliance programs, we cannot assure that our internal control policies and procedures always will protect us from reckless or criminal acts committed by our employees or agents. Our continued expansion outside the U.S., including in developing countries, could increase the risk of such violations in the future. Violations of these laws, or allegations of such violations, could disrupt our business and result in a material adverse effect on our results of operations or financial condition.
Any violation related to the foregoing could result in substantial fines, disgorgement, sanctions, civil and/or criminal penalties, curtailment of operations in certain jurisdictions, and might adversely affect our business, results of operations or financial condition. In addition, actual or alleged violations could damage our reputation and ability to do business. Furthermore, detecting, investigating, and resolving actual or alleged violations is expensive and can consume significant time and attention of our senior management. Although such risks have not significantly impacted our business to date, we do not know the impact that these regulatory, geopolitical and other factors could have on our business in the future.
Our business could be negatively impacted by security threats, including cyber security attacks, and other disruptions.
As a U.S. defense contractor, we face a number of significant potential security threats, including cyber security attacks to our information technology infrastructure, attempts to gain access to our proprietary or classified information as well as threats to the physical security of our facilities and employees. Although we utilize various procedures and controls to monitor and mitigate these threats, there can be no assurance that these procedures and controls will be sufficient to prevent disruptions in mission critical systems, the unauthorized access to or release of confidential information and corruption of data. Accordingly, any significant operational delays, or any destruction, unauthorized access to, manipulation or improper use of our data, information systems or networks could adversely affect our financial results and damage the reputation for our services.
We may be responsible for U.S. Federal income tax liabilities that relate to the distribution.
L-3 received the IRS Ruling stating that L-3 and its shareholders will not recognize any taxable income, gain or loss for U.S. Federal income tax purposes as a result of the Spin-Off, except to the extent of cash received in lieu of fractional shares. In addition, the Spin-Off was conditioned on the receipt of an opinion of tax counsel as to the satisfaction of certain requirements necessary for the Spin-Off to receive tax-free treatment upon which the IRS will not rule. While generally binding upon the IRS, the IRS Ruling is based on certain factual statements and representations. If any such factual statements or representations are incomplete or untrue in any material respect, or if the facts on which the IRS Ruling is based are materially different from the facts at the time of the Spin-Off, the IRS could modify or revoke the IRS Ruling retroactively.
17
As discussed above, certain requirements for tax-free treatment that were not covered in the IRS Ruling are addressed in the opinion of tax counsel. An opinion of tax counsel is not binding on the IRS. Accordingly, the IRS may reach conclusions with respect to the Spin-Off that are different from the conclusions reached in the opinion. Like the IRS Ruling, the opinion was based on certain factual statements and representations, which, if incomplete or untrue in any material respect, could alter tax counsel’s conclusions.
At the time of the Spin-Off, L-3 was not aware of any facts or circumstances that would cause any such factual statements or representations in the IRS Ruling or the opinion of tax counsel to be incomplete or untrue or cause the facts on which the IRS Ruling is based, or the opinion will be based, to be materially different from the facts at the time of the Spin-Off. Notwithstanding the receipt of the IRS ruling and the opinion of tax counsel, if the IRS were to determine the Spin-Off to be taxable, L-3 would recognize a substantial tax liability.
Even if the Spin-Off otherwise qualifies as a tax-free transaction for U.S. Federal income tax purposes, the distribution would be taxable to L-3 (but not to L-3 shareholders) pursuant to Section 355(e) of the Code if there are one or more acquisitions (including issuances) of the stock of either us or L-3, representing 50% or more, measured by vote or value, of the then-outstanding stock of either corporation and the acquisition or acquisitions are deemed to be part of a plan or series of related transactions that include the distribution. Any acquisition of our common stock within two years before or after the distribution (with exceptions, including public trading by less-than-5% shareholders and certain compensatory stock issuances) generally will be presumed to be part of such a plan unless that presumption is rebutted. The resulting tax liability may have a material adverse effect on our business, financial condition, results of operations or cash flows.
We have agreed not to enter into any transaction that could cause any portion of the Spin-Off to be taxable to L-3, including under Section 355(e). Pursuant to a Tax Matters Agreement with L-3, we also agreed to indemnify L-3 for any tax liabilities resulting from such transactions, and L-3 agreed to indemnify us for any tax liabilities resulting from such transactions entered into by L-3. In addition, under U.S. Treasury regulations, each member of the L-3 consolidated group at the time of the Spin-Off (including us and our subsidiaries) would be severally liable for the resulting U.S. Federal income tax liability if all or a portion of the Spin-Off does not qualify as a tax-free transaction. These obligations may discourage, delay or prevent a change of control of our company.
We have entered into a stockholders agreement with Birch Partners, certain investment funds affiliated with KKR and certain investment funds affiliated with General Atlantic, which provides them with certain rights over company matters.
At the closing of the acquisition of TASC, we entered into a stockholders agreement with Birch Partners, certain investment funds affiliated with KKR and certain investment funds affiliated with GA. The stockholders agreement establishes certain rights, restrictions and obligations of Birch Partners, certain investment funds affiliated with KKR and certain investment funds affiliated with GA, and sets forth other arrangements relating to us, including the right of Birch Partners to designate up to four directors for nomination to our 11 member board of directors and the right of its designees to participate on board committees, subject to KKR and GA maintaining certain beneficial ownership of our common stock. The interests of the parties to the stockholders agreement may differ from those of other holders of our common stock
Risks Relating to Our Common Stock
You face the following risks in connection with ownership of our common stock:
The market price of our common stock may fluctuate significantly.
The market price of our common stock may fluctuate widely, depending on many factors, some of which may be beyond our control, including:
• | changes in DoD budget levels and procurement priorities; |
• | actual or anticipated fluctuations in our operating results due to factors related to our business; |
• | wins and losses on contract re-competitions and new business pursuits; |
• | success or failure of our business strategy; |
• | our quarterly or annual earnings, or those of other companies in our industry; |
• | our ability to obtain financing as needed; |
• | announcements by us or our competitors of significant acquisitions or dispositions; |
• | changes in accounting standards, policies, guidance, interpretations or principles; |
• | the number of securities analysts to cover our common stock; |
• | changes in earnings estimates by securities analysts or our ability to meet those estimates; |
18
• | the operating and stock price performance of other comparable companies; |
• | investor perception of our company and the defense industry, including changing priorities or reductions in the U.S. government defense budget; |
• | results from any material litigation or government investigation; |
• | the availability of government funding and changes in customer requirements for our products and services; |
• | natural or environmental disasters that investors believe may affect us; |
• | overall market fluctuations; |
• | fluctuations in the budget of Federal, state and local governmental entities around the world; |
• | changes in laws and regulations affecting our business; and |
• | general economic conditions and other external factors. |
Stock markets in general have experienced volatility that has often been unrelated to the operating performance of a particular company. These broad market fluctuations could adversely affect the trading price of our common stock.
Anti-takeover provisions in our organizational documents and Delaware law, and restrictions on our charter related to our acquisition of TASC, could delay or prevent a change in control.
Certain provisions of our amended and restated certificate of incorporation and our amended and restated bylaws may delay or prevent a merger or acquisition that a shareholder may consider favorable. For example, our amended and restated certificate of incorporation and our amended and restated bylaws, among other things, provide for a classified board and require advance notice for shareholder proposals and nominations. In addition, our amended and restated certificate of incorporation authorizes our Board of Directors to issue one or more series of preferred stock and certain provisions restricting the transferability of our common stock (as described below). These provisions may also discourage acquisition proposals or delay or prevent a change in control, which could harm our stock price. Delaware law also imposes some restrictions on mergers and sales or other dispositions of 10% or more of the assets of the corporation with or to an interested shareholder.
In connection with the TASC acquisition, we also incorporated certain transfer restrictions in our amended and restated certificate of incorporation that could have potential anti-takeover effects. If a corporation undergoes an “ownership change,” within the meaning of section 382 of the Code, the corporation’s ability to use its pre-change net operating loss carryforwards and other pre-change tax attributes, such as its adjusted tax basis in its amortizable goodwill, to offset its post-change income and taxes may be limited. In order to reduce the likelihood that future transactions in Engility’s securities will result in an ownership change under Section 382 of the Code, the Company’s amended and restated Certificate of Incorporation contains transfer restrictions that apply to acquisitions and dispositions by direct and indirect holders of (or persons who would become direct or indirect holders of) 4.9% or more of New Engility common stock or certain other interests in New Engility that are treated as stock for tax purposes.
We do not plan to pay regular dividends on our common stock and our outstanding debt could limit our ability to pay dividends on our common stock in the future.
Currently, we do not plan to pay a regular dividend on our common stock. The declaration of any future cash dividends and the amount of any such dividends, if declared, will be subject to our financial condition, earnings, capital requirements, financial covenants and other contractual restrictions and to the discretion of our Board of Directors. Additionally, our credit agreement places significant restrictions on our ability to pay dividends. Our Board of Directors may take into account such matters as general business conditions, industry practice, our financial condition and performance, our future prospects, our cash needs and capital investment plans, income tax consequences applicable law and such other factors as our Board of Directors may deem relevant. There can be no assurance that we will pay a dividend in the future or continue to pay any dividend if we do commence the payment of dividends
The acquisition of TASC may not be accretive and may cause dilution to our earnings per share, which may negatively affect the market price of our common stock.
Currently, we currently anticipate that the acquisition of TASC will be accretive to our earnings per share in fiscal year 2016, after adjusting for, among other things, amortization of acquired intangibles and cash taxes. This expectation is based on preliminary estimates, which may materially change. We could also encounter additional transaction and integration-related costs or other factors such as the failure to realize all of the benefits anticipated from the acquisition of TASC. All of these factors could cause dilution to our adjusted earnings per share or decrease or delay the expected accretive effect of the acquisition of TASC and cause a decrease in the market value of our common stock.
19
Charges to earnings resulting from the application of the purchase method of accounting may adversely affect the market value of our common stock as a result of our acquisition of TASC.
In accordance with GAAP, we were considered the acquiror of TASC for accounting purposes. We will account for the acquisition of TASC using the purchase method of accounting, which will result in charges to our earnings that could adversely affect the market value of our common stock. Under the purchase method of accounting, we will allocate the total purchase price to the assets acquired and liabilities assumed from TASC based on their fair values as of the date of the completion of the acquisition of TASC, and record any excess of the purchase price over those fair values as goodwill. For certain tangible and intangible assets, reevaluating their fair values as of the completion date of the acquisition of TASC will result in the incurrence by us of additional depreciation and/or amortization expense that exceeds the combined amounts recorded by Engility and TASC prior to our acquisition of TASC. We will record this increased expense over the useful lives of the underlying assets. In addition, to the extent the value of goodwill or intangible assets were to become impaired, we may be required to incur charges relating to the impairment of those assets.
Item 1B. UNRESOLVED STAFF COMMENTS
None.
Item 2. PROPERTIES
As of December 31, 2014, we leased properties in the U.S. related to our operations in approximately 66 locations consisting of approximately 1.1 million square feet and owned properties related to our operations at two locations consisting of approximately 42,600 square feet. We also lease a number of small facilities internationally. Management believes that all of our properties have been well maintained, are in good condition, and are adequate to meet our current contractual requirements.
As of December 31, 2014, we had major operations at the following locations:
• | Aberdeen, Maryland; Lexington Park, Maryland; Chantilly, Virginia; Andover, Massachusetts; and Alexandria, Virginia. |
Item 3. LEGAL PROCEEDINGS
The Company is subject to investigations, litigation, proceedings, claims or assessments and various contingent liabilities incidental to its businesses. Furthermore, in connection with certain business acquisitions, the Company has assumed some or all claims against, and liabilities of, such acquired businesses, including both asserted and unasserted claims and liabilities. Although we cannot predict the outcome of these and other proceedings with certainty, we believe that they will not have a material adverse effect on our consolidated financial position, results of operations or cash flows.
Item 4. MINE SAFETY DISCLOSURES
Not applicable.
20
PART II
Item 5. MARKET FOR REGISTRANT'S COMMON EQUITY, RELATED STOCKHOLDER MATTERS AND ISSUER PURCHASES OF EQUITY SECURITIES
Engility Holdings, Inc. Common Stock
Our common stock is publicly traded under the symbol “EGL”. Since July 18, 2012, our common stock has been trading on the New York Stock Exchange (NYSE). The following table sets forth the high and low sale prices for our common stock for the fiscal periods indicated as reported by the NYSE during the indicated quarters.
2014 | 2013 | ||||||||||||||
High | Low | High | Low | ||||||||||||
First Quarter | $ | 45.86 | $ | 32.30 | $ | 25.08 | $ | 18.30 | |||||||
Second Quarter | $ | 46.25 | $ | 37.53 | $ | 28.77 | $ | 21.39 | |||||||
Third Quarter | $ | 39.92 | $ | 30.46 | $ | 35.21 | $ | 28.13 | |||||||
Fourth Quarter | $ | 44.27 | $ | 30.22 | $ | 34.16 | $ | 27.87 | |||||||
On February 26, 2015, the closing price of our common stock on the NYSE was $46.45 per share. As of February 26, 2015, there were 433 holders of record of our common stock. This does not include the number of persons whose stock is in nominee or “street” name accounts through brokers.
In conjunction with the acquisition of TASC, we paid a $207 million special cash dividend, or $11.434 per share of common stock, to shareholders of record as of the close of business on February 25, 2015 that held their shares through the close of business on February 26, 2015. After taking into account the payment of this special cash dividend, on February 27, 2015, the closing price of our common stock on the NYSE was $36.10 per share. We do not anticipate paying any cash dividends on our common stock in the foreseeable future. The declaration of any future cash dividends and the amount of any such dividends, if declared, will be subject to our financial condition, earnings, capital requirements, financial covenants and other contractual restrictions and to the discretion of our Board of Directors. Our Board of Directors may take into account such matters as general business conditions, industry practice, our financial condition and performance, our future prospects, our cash needs and capital investment plans, income tax consequences, applicable law and such other factors as our Board of Directors may deem relevant.
Equity Compensation Plan Information
See Part III, “Item 12—Security Ownership of Certain Beneficial Owners and Management and Related Stockholder Matters” for information regarding securities authorized for issuance under our equity compensation plans.
Issuer Purchases of Company Stock
We did not repurchase any of our equity securities during the year ended December 31, 2014.
21
Performance Graph
The following graph compares the cumulative total stockholder return on our common stock during the period from July 18, 2012 (the first day our stock began trading on the NYSE) through December 31, 2014 with the cumulative total return on the Russell 2000 Index and an index of our industry peers. Our peer group consists of the following U.S. Federal government service providers with whom we compete: Booz Allen Hamilton Holding Corporation, CACI International Inc., ICF International, Inc., ManTech International Corporation, NCI, Inc., and SAIC. The comparison assumes that $100 was invested on July 18, 2012 in our common stock and in each of the foregoing indices and assumes reinvestment of dividends, if any, and with respect to our index of industry peers, returns are weighted according to the stock market capitalization of such companies.
COMPARISON OF CUMULATIVE TOTAL RETURN
ASSUMES INITIAL INVESTMENT OF $100
DECEMBER 31, 2014
ASSUMES $100 INVESTED ON JULY 18, 2012
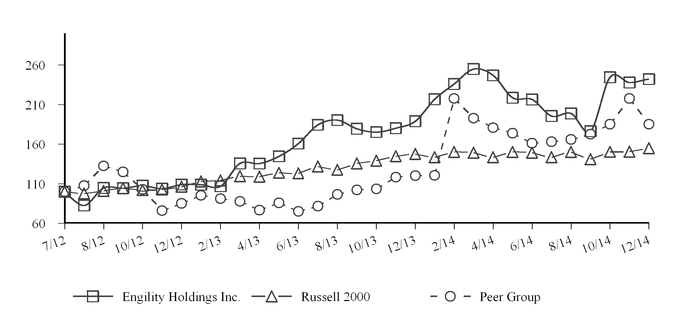
July 18, 2012 | December 31, 2014 | ||||||
Engility Holdings, Inc. | $ | 100.00 | $ | 242.08 | |||
Russell 2000 Index | $ | 100.00 | $ | 154.77 | |||
Index of our industry peers | $ | 100.00 | $ | 213.54 | |||
* Stock performance for SAIC is only included from September 30, 2013, the date that SAIC began regular way trading on the NYSE following its spin-off from its parent company.
22
Item 6. SELECTED FINANCIAL DATA
The following table presents the selected historical consolidated and combined financial data for Engility. The Consolidated and Combined Statement of Operations for each of the years ended December 31, 2014, 2013, and 2012 and Consolidated Balance Sheet data as of December 31, 2014 and 2013 set forth below are derived from Engility’s audited Consolidated and Combined Financial Statements included in this Annual Report on Form 10-K. The Combined Statement of Operations for the year ended December 31, 2011 and 2010 and Balance Sheet data as of December 31, 2011 and 2010 are derived from Engility’s audited combined financial statements that are not included in this Annual Report on Form 10-K. The financial information may not be indicative of our future performance and does not necessarily reflect what the financial position and results of operations would have been had we operated as a separate, stand-alone entity during the periods presented, including changes that occurred as a result of the Spin-Off.
The selected historical consolidated and combined financial data presented below should be read in conjunction with Engility’s Consolidated and Combined Financial Statements and accompanying notes and “Item 7—Management’s Discussion and Analysis of Financial Condition and Results of Operations” included in this Annual Report.
As of and for the year ended December 31, | |||||||||||||||||||
2014 (4) | 2013 | 2012 | 2011 | 2010 | |||||||||||||||
(in thousands, except per share data) | |||||||||||||||||||
Statement of Operations Data | |||||||||||||||||||
Revenue | 1,367,091 | $ | 1,407,372 | $ | 1,655,344 | $ | 2,070,781 | $ | 2,374,296 | ||||||||||
Income (loss) from continuing operations (1) | $ | 40,010 | 54,717 | (344,795 | ) | 26,027 | (7,975 | ) | |||||||||||
Net income (loss) attributable to Engility (1) | $ | 35,423 | 49,527 | (350,373 | ) | 25,859 | (8,866 | ) | |||||||||||
Income (loss) from continuing operations per common share - Basic (2) | $ | 2.07 | 2.94 | (21.48 | ) | 1.42 | (0.63 | ) | |||||||||||
Income (loss) from continuing operations per common share - Diluted (2) | $ | 1.97 | 2.81 | (21.48 | ) | 1.42 | (0.63 | ) | |||||||||||
Weighted average number of shares - basic (2) | 17,100 | 16,873 | 16,281 | 16,118 | 16,118 | ||||||||||||||
Weighted average number of shares - diluted (2) | 18,018 | 17,653 | 16,281 | 16,118 | 16,118 | ||||||||||||||
Balance Sheet Data | |||||||||||||||||||
Working capital | $ | 85,825 | $ | 141,748 | $ | 162,796 | $ | 160,007 | $ | 196,821 | |||||||||
Goodwill | 644,554 | 477,604 | 477,604 | 904,040 | 980,640 | ||||||||||||||
Total assets | 1,122,636 | 930,054 | 1,027,450 | 1,503,247 | 1,666,490 | ||||||||||||||
Long-term debt (3) (4) | 279,500 | 187,500 | 284,750 | — | — | ||||||||||||||
Total equity | $ | 476,753 | $ | 443,154 | $ | 388,311 | $ | 1,093,603 | $ | 1,227,428 | |||||||||
___________________________________
(1) | The years ended December 31, 2012, 2011, and 2010 include a non-cash goodwill impairment charge of $426 million, $77 million and $172 million, respectively. |
(2) | For the periods prior to the Spin-Off, basic and diluted earnings per share were calculated using 16.1 million shares of our common stock that were distributed to L-3 shareholders on July 17, 2012. |
(3) | On July 17, 2012, we borrowed $335 million under the 2012 Credit Facility to pay a cash dividend to L-3 in the amount of $335 million. |
(4) | On January 31, 2014, we completed the acquisition of DRC for $207 million in cash. We borrowed $190 million to finance the DRC acquisition. |
23
Item 7. MANAGEMENT'S DISCUSSION AND ANALYSIS OF FINANCIAL CONDITION AND RESULTS OF OPERATIONS
You should read the following discussion of our results of operations and financial condition together with the audited historical Consolidated and Combined Financial Statements, and the notes thereto included in this Annual Report on Form 10-K (Annual Report) as well as the discussion in the section of this Annual Report titled “Business.” This discussion contains forward-looking statements that involve risks and uncertainties. The forward-looking statements are not historical facts, but rather are based on current expectations, estimates, assumptions and projections about our industry, business and future financial results. Our actual results could differ materially from the results contemplated by these forward-looking statements due to a number of factors, including those discussed in the sections of this Annual Report titled “Risk Factors” and “Cautionary Statement Regarding Forward-Looking Statements.” The financial information discussed below and included in this Annual Report may not necessarily reflect what our financial condition, results of operations or cash flow would have been had we been a stand-alone company during the periods presented or what our financial condition, results of operations and cash flows may be in the future.
Except as otherwise indicated or unless the context otherwise requires, the information included in this discussion and analysis assumes the completion of all the transactions referred to in this Annual Report in connection with the separation and distribution.
Overview
Our business is focused on supporting the mission success of our customers by providing a full range of engineering, technical, analytical, advisory, training, logistics and support services. Our service offerings are organized around six core competencies: (i) specialized technical consulting; (ii) program and business support services; (iii) engineering and technology lifecycle support; (iv) information technology modernization and sustainment; (v) supply chain services and logistics management; and (vi) training and education.
Through its subsidiaries and their predecessors Engility has provided mission-critical services to the U.S. Government for over six decades. Our primary customers include the U.S. Department of Defense (DoD), U.S. Department of Justice (DoJ), U.S. Agency for International Development (USAID), U.S. Department of State (DoS), Federal Aviation Administration (FAA), U.S. Department of Homeland Security (DHS), U.S. Department of Veterans Affairs, and allied foreign governments. With our recent acquisition of TASC, Inc. on February 26, 2015, we have further diversified our portfolio to add leading positions with U.S. national security and public safety customers, including , the National Geospatial-Intelligence Agency (NGA), National Security Agency (NSA), Defense Intelligence Agency (DIA), and other intelligence agencies, and space agencies such as the National Reconnaissance Organization (NRO), National Aeronautical and Space Administration (NASA) and Air Force. The transaction also enhanced our market position with our existing DHS, Defense Threat Reduction Agency (DTRA), FAA and Missile Defense Agency (MDA) customers. We attribute the strength of our customer relationships to our singular focus on services, our strengths in program planning and management, superior past performance, and the experience of our people and their commitment to our customers’ missions.
Executive Summary
Our revenue is spread over a diverse mix of activities and services with no single program accounting for more than 10% of our revenue for the years ended December 31, 2014, 2013, and 2012. Revenue for the year ended December 31, 2014 was $1,367 million, a decrease of $40 million compared to the year ended December 31, 2013. This decrease was primarily the result of a $142 million decreased in DoD-related revenue, offset in part by a $101 million increase in Federal civilian-related revenue. The decrease in DoD-related revenue was primarily the result of a reduction of (i) $104 million in revenue related to the drawdown in Afghanistan and (ii) $161 million in other legacy Engility DoD program revenue, offset in part by $123 million of DRC-related DoD revenue. The increase in Federal civilian-related revenue was primarily the result of $87 million of DRC-related contract revenue and an increase of $14 million in legacy Engility Federal civilian contracts for the year ended December 31, 2014 as compared to the year ended December 31, 2013.
Selling, general and administrative expenses for the year ended December 31, 2014 were $115 million, an increase of $30 million compared with the year ended December 31, 2013. The increase in selling, general and administrative expenses, including as a percentage of revenue, resulted primarily from an increase of (i) $23 million in acquisition, integration, and amortization expense related to TASC and DRC and (ii) approximately $23 million of additional selling, general, and administrative expenses related to DRC. This was offset in part by a decrease of $7 million of restructuring costs and $4 million in legal and settlement costs, in each case as compared to the prior year.
Operating income for the year ended December 31, 2014 was $83 million, a decrease of $25 million compared with the year ended December 31, 2013. The decrease in operating income and operating margin was due primarily to the $30 million of additional selling, general and administrative expenses and the decline in revenue described above, partially offset by an increase in gross margin.
24
Economic Opportunities, Challenges, and Risks
We generate substantially all of our revenue from contracts with the U.S. Government. For the year ended December 31, 2014, $848 million or 63% of our total revenue were from contracts with the DoD. This compared to $990 million, or 70%, for the year ended December 31, 2013. The decrease in DoD-related revenue reflects our strategy to increase our presence in the Federal civilian and non-defense-related contracts, in anticipation of continued declines in overall defense-related spending. This strategy is highlighted by our January 2014 acquisition of DRC, which generated approximately 44% of its revenue from non-DoD customers in 2014, and our February 2015 acquisition of TASC, which generated approximately 72% of its revenue in 2014 from non-DoD customers.
The U.S. Government services market continues to face significant uncertainty in terms of budgets, funding, changing mission priorities, and political and legislative challenges, which has adversely impacted spending by both our DoD and Federal agency customers. This has increased substantially the competitive pressures in our industry, as the overall market for U.S. Government services continues to contract. Trends in the U.S. Government contracting process, including a shift towards multiple-award contracts (in which certain contractors are preapproved using indefinite delivery/indefinite quantity and General Services Administration contract vehicles) and awarding contracts on a low price, technically acceptable basis, have also increased competition for U.S. Government contracts. In response to these pressures, we continue to take steps to reduce indirect labor and other costs in our business. We have also increased our focus on our business development efforts to win new business, as evidenced by our increased bid and proposal expenditures in 2014.
Despite the budget and competitive pressures impacting the industry, we believe that our focus on reducing costs and increasing our presence in enduring markets has positioned us to expand our customer penetration and benefit from opportunities that we have not previously pursued. We will also seek to continue to add necessary scale and competencies to our business through selective acquisitions, as evidenced by our acquisitions of DRC and TASC. Going forward, we expect companies in our industry will continue to use acquisitions for similar reasons, and the dynamics associated with the current decline in U.S. Government budgets and funding for services could lead to continued consolidation in our industry. We believe long-term competitiveness will likely require companies to offer highly specialized, enduring capabilities in niche markets and/or have sufficient breadth and size to weather future market volatility while continuing to provide cost-effective services.
DRC Acquisition
On January 31, 2014, we completed the acquisition of DRC, a U.S. government services, information technology and management consulting firm with leading capabilities in healthcare, homeland security, research and development, ISR and financial regulation and reform. We acquired DRC for an aggregate purchase price of approximately $121 million, and retired approximately $86 million in DRC debt. We financed the transaction through a $75 million term loan, $115 million of borrowings under our revolving credit facility, as amended, and $20 million in cash on hand.
TASC Acquisition
On February 26, 2015, we completed the acquisition of TASC, Inc., a leading professional services provider to the national security and public safety markets, in an all-stock transaction valued at approximately $1.3 billion, including the assumption of net debt of $614 million. The business combination was effected through a new holding company named New East Holdings, Inc. (New Engility). As a result of the business combination, New Engility succeeded to and continues to operate, directly or indirectly, the existing business of Engility and, indirectly, acquired the existing business of TASC. The combined companies now operate under a new holding company, New East Holdings, Inc. which was renamed “Engility Holdings, Inc.” upon the closing of the acquisition. The New Engility common stock, similar to the predecessor Engility common stock, trades on the NYSE under the symbol “EGL.”
As a result of the acquisition of TASC, former TASC stockholders now hold approximately 52% of our shares of common stock outstanding as of February 26, 2015. The holders of Engility common stock immediately prior to the business combination with TASC received a special cash dividend of $207 million, or $11.434 per share.
To finance the transaction and special cash dividend, Engility Corporation (n/k/a Engility LLC) entered into an amended and restated bridge financing letter with respect to an unsecured bridge loan facility in the form of a promissory note in the amount of $585 million, which was repaid in full concurrent with the closing through an increase in TASC’s existing first lien credit agreement (assumed by us as of closing) consisting of (i) new senior secured first lien incremental term loans in an aggregate amount of $435 million, (ii) additional senior secured first lien revolving commitments in an aggregate amount of $65 million, and (iii) new senior secured second lien incremental term loans in an aggregate amount of $150 million.
As a condition to the merger agreement, we entered into a Stockholders Agreement, dated February 26, 2015, with Birch Partners, LP, and for the limited purposes set forth therein, certain investment funds affiliated with Kohlberg Kravis Roberts & Co. L.P. and certain investment funds affiliated with General Atlantic LLC. The Stockholders Agreement establishes certain rights, restrictions and obligations of Birch, KKR and GA, and sets forth certain governance and other arrangements relating to
25
Engility, including the right of Birch to designate (i) four directors for nomination to our 11 member board of directors for so long as each of KKR and GA (including their respective affiliates) beneficially own at least 50% of the shares of our common stock it owned as of the date of the Stockholders Agreement and (ii) two directors for nomination to our 11 member board of directors for so long as each of KKR and GA (including their respective affiliates) beneficially own at least 25% of the shares of our common stock it owned as of the date of the Stockholders Agreement.
Separation from L-3
On July 12, 2011, the Board of Directors of L-3 approved the Spin-Off, pursuant to which part of L-3’s Government Services segment was transferred into a new company named Engility Holdings, Inc., following which Engility became an independent, publicly traded company. Before the Spin-Off, we entered into a Distribution Agreement and several other agreements with L-3 related to the Spin-Off. These agreements governed the relationship between us and L-3 after completion of the Spin-Off and provided for the allocation between us and L-3 of various assets, liabilities, rights and obligations (including employee benefits, insurance and tax-related assets and liabilities). On July 17, 2012, L-3 completed the Spin-Off of Engility Holdings through the distribution of 100% of the common stock of Engility Holdings to stockholders of L-3.
For periods prior to the Spin-Off, the Combined Financial Statements presented herein, and discussed below, were derived from the accounting records of L-3 as if we operated on a stand-alone basis for all the periods presented. The Combined Financial Statements are prepared in conformity with accounting principles generally accepted in the United States of America (U.S. GAAP) and reflect the financial position, results of operations and cash flows of our businesses.
Prior to the Spin-Off, the Combined Statements of Operations include expense allocations for corporate functions provided to us by L-3. These expenses were allocated to us on the basis of direct usage when identifiable, with the remainder allocated on the basis of revenue or headcount. While we believe these allocations have been made on a consistent basis and are reasonable, such expenses may not be indicative of the actual expenses that would have been incurred if Engility had been operating as a separate and independent business.
Key Performance Indicators
Funded Backlog
As of December 31, | |||||||
2014 | 2013 | ||||||
(in millions) | |||||||
Funded backlog | $ | 602 | $ | 602 | |||
We define funded backlog as the value of funded orders received from customers, less the cumulative amount of revenue recognized on such orders.
Funded Orders and Book-to-Bill
For the Year Ended December 31, | |||||||||||
2014 | 2013 | 2012 | |||||||||
(in millions) | |||||||||||
Funded orders | $ | 1,254 | $ | 1,153 | $ | 1,707 | |||||
Book-to-Bill | 0.9 | x | 0.8 | x | 1.0 | x | |||||
We define funded orders as orders received during the current period less orders that have been canceled or reduced. This term could also be defined as “net orders.”
We define orders as the value of contract awards received for which funds have been appropriated.
Our book-to-bill ratio is calculated as funded orders divided by revenue.
26
Days Sales Outstanding
Days sales outstanding (DSO) as of December 31, 2014 was 74 days as compared to 73 days as of December 31, 2013.
DSO is calculated as net receivables less advance payments and billings in excess of costs incurred, divided by daily revenue (total revenue for the quarter divided by 90 days).
Prime Contractor Revenue
For the Year Ended December 31, | ||||||||
2014 | 2013 | 2012 | ||||||
Prime | 76.6 | % | 69.0 | % | 70.0 | % | ||
Subcontractor | 23.4 | 31.0 | 30.0 | |||||
Total | 100.0 | % | 100.0 | % | 100.0 | % | ||
Revenue by Customer
For the Year Ended December 31, | ||||||||
2014 | 2013 | 2012 | ||||||
Department of Defense | 62.0 | % | 70.4 | % | 75.3 | % | ||
Federal Civilian | 35.7 | 27.5 | 23.2 | |||||
Commercial and other | 2.3 | 2.1 | 1.5 | |||||
Total | 100.0 | % | 100.0 | % | 100.0 | % | ||
Revenue by Contract Type
For the Year Ended December 31, | ||||||||
2014 | 2013 | 2012 | ||||||
Cost-plus | 47.0 | % | 52.7 | % | 48.0 | % | ||
Time-and-material | 27.8 | 26.1 | 26.0 | |||||
Fixed price | 25.2 | 21.2 | 26.0 | |||||
Total | 100.0 | % | 100.0 | % | 100.0 | % | ||
The significant changes in revenue percentages for contract type, prime contractor, and customer for year ended December 31, 2014 as compared to the year ended December 31, 2013 are primarily a result of the DRC acquisition.
Results of Operations — Years ended December 31, 2014, 2013 and 2012
The following information should be read in conjunction with our audited Consolidated and Combined Financial Statements included herein.
2014 Compared with 2013
The tables below provide selected financial data for Engility for the years ended December 31, 2014 compared with 2013.
For the Years Ended December 31, | ||||||||||||||||||||
2014 | 2013 | Dollar Change | Percentage Change | |||||||||||||||||
(in thousands, except percentages) | ||||||||||||||||||||
Total revenue | $ | 1,367,091 | 100.0 | % | $ | 1,407,372 | 100.0 | % | $ | (40,281 | ) | (2.9 | )% | |||||||
Revenue: For the year ended December 31, 2014, revenue was $1,367 million, which included $218 million from DRC, versus $1,407 million for the year ended December 31, 2013. In total, revenue declined $40 million, or 2.9%, compared to the year ended December 31, 2013. This decrease was primarily the result of a $142 million decrease in DoD-related revenue, offset in part by a $101 million increase in Federal civilian-related revenue. The decrease in DoD-related revenue was primarily the result of a reduction of (i) $104 million in revenue related to the drawdown in Afghanistan and (ii) $161 million in other legacy Engility DoD program revenue, offset in part by $123 million of DRC-related DoD revenue.
For the year ended December 31, 2014, revenue related to Afghanistan was $104 million as compared to $225 million for the year ended December 31, 2013. We expect revenue related to Afghanistan to continue to decline as U.S. military
27
continues to drawdown forces in Afghanistan. The decrease in DoD-related revenue has been offset in part by an increase in Federal civilian and non-defense-related contract revenue, resulting from our acquisition of DRC. We expect that this shift towards Federal civilian and non-defense-related contract revenue will continue as a result of our recent acquisition of TASC.
The increase in Federal civilian revenue was primarily the result of $87 million of DRC-related contract revenue and an increase of $14 million in legacy Engility Federal civilian contract revenue for the year ended December 31, 2014 as compared to the year ended December 31, 2013.
For the Years Ended December 31, | ||||||||||||||||||||
2014 | 2013 | Dollar Change | Percentage Change | |||||||||||||||||
(in thousands, except percentages) | ||||||||||||||||||||
Cost of revenue | $ | 1,169,281 | 85.5 | % | $ | 1,214,581 | 86.3 | % | $ | (45,300 | ) | (3.7 | )% | |||||||
Cost of revenue: Total cost of revenue was $1,169 million for the year ended December 31, 2014, a decrease of 3.7%, compared to $1,215 million for the year ended December 31, 2013. Cost of revenue as a percentage of total revenue decreased to 85.5% for the year ended December 31, 2014 compared to 86.3% for the year ended December 31, 2013. The decrease in cost of revenue as a percentage of total revenue was due primarily to increased efficiencies in our fixed price labor contracts, spread over a higher concentration of fixed price contracts resulting mostly from the DRC acquisition.
For the Years Ended December 31, | |||||||||||||||||||
2014 | 2013 | Dollar Change | Percentage Change | ||||||||||||||||
(in thousands, except percentages) | |||||||||||||||||||
Selling, general and administrative expenses | 114,890 | 8.4 | % | $ | 84,635 | 6.0 | % | $ | 30,330 | 35.8 | % | ||||||||
Selling, general and administrative expenses: For the year ended December 31, 2014, selling, general and administrative expenses were $115 million, compared to $85 million for the year ended December 31, 2013. Selling, general and administrative expenses as a percentage of revenue increased to 8.4% for the year ended December 31, 2014, compared to 6.0% for the year ended December 31, 2013. The increase in selling, general and administrative expenses, including as a percentage of revenue, resulted primarily from an increase of (i) $23 million in acquisition, integration, and amortization expense related to TASC and DRC and (ii) approximately $23 million of additional selling, general, and administrative expenses related to DRC. This was offset in part by a decrease of $7 million of restructuring costs and $4 million in legal and settlement costs, in each case as compared to the prior year.
For the Years Ended December 31, | ||||||||||||||||||||
2014 | 2013 | Dollar Change | Percentage Change | |||||||||||||||||
(in thousands, except percentages) | ||||||||||||||||||||
Operating income | $ | 82,919 | 6.1 | % | $ | 108,156 | 7.7 | % | $ | (25,237 | ) | (23.3 | )% | |||||||
Operating income and operating margin: Operating income for the year ended December 31, 2014 was $83 million, a decrease of $25 million compared to the year ended December 31, 2013. Operating margin decreased to 6.1% for the year ended December 31, 2014, compared to 7.7% for the year ended December 31, 2013. The decrease in operating income and operating margin was due primarily to the $30 million of additional selling, general and administrative expenses described above and the decline in revenue partially offset by an increase in gross margin.
For the Years Ended December 31, | ||||||||||||||||||||
2014 | 2013 | Dollar Change | Percentage Change | |||||||||||||||||
(in thousands, except percentages) | ||||||||||||||||||||
Interest expense, net | $ | 12,799 | 0.9 | % | $ | 21,648 | 1.5 | % | $ | (8,849 | ) | (40.9 | )% | |||||||
Interest expense: During the year ended December 31, 2014, net interest expense was $13 million compared with $22 million in net interest expense for the year ended December 31, 2013, which included an expense of $4 million of previously capitalized bank fees related to the 2013 debt refinancing. The reduction in interest expense was due primarily to a reduction in interest rates resulting from our 2013 debt refinancing and lower debt fee amortization.
28
During the year ended December 31, 2014, we had a weighted average outstanding loan balance of $342 million, which accrued interest at a weighted average borrowing rate of approximately 2.9%.
During the year ended December 31, 2013, we had a weighted average outstanding loan balance of $287 million, which accrued interest at a weighted average borrowing rate of approximately 4.7%.
For the Years Ended December 31, | ||||||||||||||||||||
2014 | 2013 | Dollar Change | Percentage Change | |||||||||||||||||
(in thousands, except percentages) | ||||||||||||||||||||
Income before income taxes | $ | 70,647 | 5.2 | % | $ | 87,301 | 6.2 | % | $ | (16,654 | ) | (19.1 | )% | |||||||
Provision for income taxes | $ | 30,637 | 2.2 | $ | 32,584 | 2.3 | $ | (1,947 | ) | (6.0 | )% | |||||||||
Net income | $ | 40,010 | 3.0 | % | $ | 54,717 | 3.9 | % | $ | (14,707 | ) | (26.9 | )% | |||||||
Effective tax rate after discrete items | 43.4 | % | 37.3 | % | ||||||||||||||||
Effective income tax rate: The effective income tax rate for the year ended December 31, 2014 was 43.4%, compared to 37.3% for the year ended December 31, 2013 including discrete items. The increase in income tax rate was primarily the result of the non-deductible portion of the TASC and DRC transaction costs that were incurred and recorded during the year ended December 31, 2014.
For the Years Ended December 31, | ||||||||||||||||||||
2014 | 2013 | Dollar Change | Percentage Change | |||||||||||||||||
(in thousands, except percentages) | ||||||||||||||||||||
Net income | $ | 40,010 | 2.9 | % | $ | 54,717 | 3.9 | % | $ | (14,707 | ) | (26.9 | )% | |||||||
Less: Net income attributable to non-controlling interest | $ | 4,587 | 0.3 | $ | 5,190 | 0.4 | $ | (603 | ) | (11.6 | )% | |||||||||
Net income attributable to Engility | $ | 35,423 | 2.6 | % | $ | 49,527 | 3.5 | % | $ | (14,104 | ) | (28.5 | )% | |||||||
Net income attributable to Engility: Net income attributable to Engility was $35 million for the year ended December 31, 2014 compared to $50 million for the year ended December 31, 2013. The decrease of $14 million in net income attributable to Engility during the year ended December 31, 2014 as compared to the year ended December 31, 2013 was due primarily to a$25 million decrease in operating profit, offset by $9 million of reduced interest expense, and $2 million of reduced income taxes.
2013 Compared with 2012
The tables below provide selected financial data for Engility for the years ended December 31, 2013 compared with 2012.
Year Ended December 31, | ||||||||||||||||||
2013 | 2012 | Dollar Change | Percentage Change | |||||||||||||||
(in thousands, except percentages) | ||||||||||||||||||
Revenue | 1,407,372 | 100.0 | % | 1,655,344 | 100.0 | % | $ | (247,972 | ) | (15.0 | )% | |||||||
Revenue: For the year ended December 31, 2013, revenue was $1,407 million, a decrease of $248 million, or 15%, compared to the year ended December 31, 2012. This decrease was primarily the result of (i) $82 million in reduced demand for services on certain major contracts supporting military efforts in Afghanistan and Iraq, which resulted from the drawdown of U.S. military forces in these countries, (ii) $21 million of revenue reductions related to OCI constraints in place prior to the Spin-Off, and (iii) $199 million of revenue reductions due to a reduction in the scope of individual projects or task orders, as well as other contracts and task orders that ended, as our customers faced the prospects of a government shutdown, sequestration impacts and continued budget uncertainty. To a lesser extent, our revenue were also negatively impacted by the shift from fixed price-type contracts to cost plus-type contracts. These revenue decreases were offset in part by $54 million of additional revenue from new contract awards.
29
Year Ended December 31, | ||||||||||||||||||
2013 | 2012 | Dollar Change | Percentage Change | |||||||||||||||
(in thousands, except percentages) | ||||||||||||||||||
Cost of revenue | 1,214,581 | 86.3 | % | 1,415,386 | 85.5 | % | $ | (200,805 | ) | (14.2 | )% | |||||||
Cost of revenue: Total cost of revenue was $1,215 million for the year ended December 31, 2013; a decline of 14%, compared to $1,415 million for the year ended December 31, 2012. Cost of revenue as a percentage of total revenue was 86% for the years ended December 31, 2013 and 2012. The increase in cost of revenue as a percentage of total revenue was driven primarily by an increase in the proportion of lower margin cost-plus contracts making up our contract base. This trend was partially offset by cost savings resulting from our organizational realignment in 2013, as well as decreased expenses from our FSA joint venture.
Year Ended December 31, | ||||||||||||||||||
2013 | 2012 | Dollar Change | Percentage Change | |||||||||||||||
(in thousands, except percentages) | ||||||||||||||||||
Selling, general and administrative expenses | 84,635 | 6.0 | % | 142,440 | 8.6 | % | $ | (57,805 | ) | 40.5 | % | |||||||
Selling, general, and administrative expenses: For the year ended December 31, 2013, selling, general and administrative expenses were $85 million, compared to $142 million for the year ended December 31, 2012. Selling, general and administrative expenses as a percentage of revenue decreased to 6% for the year ended December 31, 2013, compared to 9% for the year ended December 31, 2012. The decrease in selling, general and administrative expenses, including as a percentage of revenue, resulted primarily from $33 million in cost reductions from our strategic realignment realized during the year ended December 31, 2013, and the absence of $17 million in Spin-Off-related transaction costs incurred during the year ended December 31, 2012.
Year Ended December 31, | ||||||||||||||||||||
2013 | 2012 | Dollar Change | Percentage Change | |||||||||||||||||
(in thousands, except percentages) | ||||||||||||||||||||
Goodwill impairment charge | $ | — | — | % | $ | 426,436 | 25.8 | % | $ | (426,436 | ) | (100.0 | )% | |||||||
Goodwill impairment charge: For the year ended December 31, 2012, we recorded a non-cash goodwill impairment charge of $426 million due to a decline in the estimated fair value of certain of our former reporting units. During the year ended December 31, 2013, we did not record an impairment charge to goodwill and there was no change in the balance of goodwill.
Year Ended December 31, | ||||||||||||||||||
2013 | 2012 | Dollar Change | Percentage Change | |||||||||||||||
(in thousands, except percentages) | ||||||||||||||||||
Operating income (loss) | 108,156 | 7.7 | % | (328,918 | ) | (19.9 | )% | $ | 437,074 | (132.9 | )% | |||||||
Operating income (loss) and operating margin: Operating income for the year ended December 31, 2013 was $108 million, an increase of $437 million compared to the year ended December 31, 2012. Operating margin increased to 7.7% for the year ended December 31, 2013, compared to (19.9)% for the year ended December 31, 2012. The increase in operating income and operating margin was due primarily to a goodwill impairment charge of $426 million, $17 million in Spin-Off-related transaction costs incurred during the year ended December 31, 2012, and $33 million in cost reductions from our strategic realignment realized during the year ended December 31, 2013. This increase was offset in part by the shift of 5% of our contract revenue from fixed price-type contracts to cost plus-type contracts. Fixed price contracts often produce better operating margins and greater operating income than cost plus contracts as we receive the benefit of any cost savings that we achieve.
30
Year Ended December 31, | ||||||||||||||||||
2013 | 2012 | Dollar Change | Percentage Change | |||||||||||||||
(in thousands, except percentages) | ||||||||||||||||||
Interest expense, net | 21,648 | 1.5 | % | 10,857 | 0.7 | % | $ | 10,791 | 99.4 | % | ||||||||
Interest expense: During the year ended December 31, 2012, we borrowed $335 million under our 2012 Credit Facility in the form of a five-year term loan. We then distributed the $335 million to our prior parent. Our results for the year ended December 31, 2012 reflect that, prior to the Distribution Date, we had no debt and nominal interest expense. During this same period, we had a weighted average outstanding loan balance of $336 million, which accrued interest at a weighted average borrowing rate of approximately 5.8%.
During the year ended December 31, 2013, we borrowed $313 million under our 2013 Credit Facility to refinance our debt under the 2012 Credit Facility. During this same period, we had a weighted average outstanding loan balance of $287 million, which accrued interest at a weighted average borrowing rate of approximately 4.7%.
During the year ended December 31, 2013, net interest expense was approximately $22 million, which included the recognition of approximately $4 million of bank fees related to the 2012 Credit Facility that we had previously capitalized in connection with the 2012 Credit Facility. During the year ended December 31, 2012, net interest expense was approximately $11 million.
Year Ended December 31, | ||||||||||||||||||||
2013 | 2012 | Dollar Change | Percentage Change | |||||||||||||||||
(in thousands, except percentages) | ||||||||||||||||||||
Income from continuing operations before income taxes | 87,301 | 6.2 | % | (339,639 | ) | (20.5 | )% | $ | 426,940 | (125.7 | )% | |||||||||
Provision for income taxes | 32,584 | 2.3 | % | 5,156 | (0.3 | )% | $ | 27,428 | 532.0 | % | ||||||||||
Income from continuing operations | $ | 54,717 | 3.9 | % | $ | (344,795 | ) | (20.8 | )% | $ | 399,512 | (115.9 | )% | |||||||
Effective tax rate after discrete items | 37.3 | % | (1.5 | )% | ||||||||||||||||
Effective income tax rate: The effective income tax rate including discrete items for the year ended December 31, 2013 was 37.3%, compared to (1.5)% for the year ended December 31, 2012. The increase in rate was primarily the result of the non-deductible portion of the goodwill impairment charge and the Spin-Off related expenses that were incurred and recorded during the year ended December 31, 2012.
Year Ended December 31, | ||||||||||||||||||||
2013 | 2012 | Dollar Change | Percentage Change | |||||||||||||||||
(in thousands, except percentages) | ||||||||||||||||||||
Net income | $ | 54,717 | 3.9 | % | $ | (345,421 | ) | (20.9 | )% | $ | 400,138 | (115.8 | )% | |||||||
Less: Net income attributable to non-controlling interest | 5,190 | 0.4 | 4,952 | 0.3 | % | $ | 238 | 4.8 | % | |||||||||||
Net income attributable to Engility | $ | 49,527 | 3.5 | % | $ | (350,373 | ) | (21.2 | )% | $ | 399,900 | (114.1 | )% | |||||||
Net income (loss) attributable to Engility: Net income attributable to Engility was $50 million for the year ended December 31, 2013 compared to a net loss attributable to Engility of $350 million for the year ended December 31, 2012. The increase of $400 million in net income attributable to Engility during the year ended December 31, 2013 as compared to the year ended December 31, 2012 was primarily due to a goodwill impairment charge of $426 million and $17 million in Spin-Off-related transaction costs incurred during the year ended December 31, 2012 and $33 million in cost reduction from our strategic realignment during the year ended December 31, 2013 as compared to December 31, 2012 and offset in part by $11 million of additional interest expense incurred during the year ended December 31, 2013. The increase was offset in part by the shift of 5% of our contract revenue from fixed price-type contracts to cost plus-type contracts, which reduced our net income attributable to Engility.
Quarterly Financial Data
31
2014 | First Quarter | Second Quarter | Third Quarter | Fourth Quarter | Total Year | ||||||||||||||
(in thousands, except per share data) | |||||||||||||||||||
Total revenue | $ | 338,824 | $ | 363,690 | $ | 345,061 | $ | 319,516 | $ | 1,367,091 | |||||||||
Operating income | 19,685 | 23,112 | 26,767 | 13,356 | 82,920 | ||||||||||||||
Net income attributable to Engility | 8,871 | 10,905 | 13,161 | 2,486 | 35,423 | ||||||||||||||
Earnings per share attributable to Engility - Basic | 0.52 | 0.64 | 0.77 | 0.14 | 2.07 | ||||||||||||||
Earnings per share attributable to Engility - Diluted | 0.50 | 0.61 | 0.73 | 0.14 | 1.97 | ||||||||||||||
2013 | First Quarter | Second Quarter | Third Quarter | Fourth Quarter | Total Year | ||||||||||||||
(in thousands, except per share data) | |||||||||||||||||||
Total revenue | $ | 361,675 | $ | 377,332 | $ | 339,302 | $ | 329,063 | $ | 1,407,372 | |||||||||
Operating income | 29,887 | 29,293 | 30,121 | 18,855 | 108,156 | ||||||||||||||
Net income attributable to Engility | 13,778 | 13,062 | 12,008 | 10,679 | 49,527 | ||||||||||||||
Earnings per share attributable to Engility - Basic | 0.82 | 0.77 | 0.71 | 0.63 | 2.94 | ||||||||||||||
Earnings per share attributable to Engility - Diluted | 0.79 | 0.74 | 0.68 | 0.60 | 2.81 | ||||||||||||||
Liquidity and Capital Resources
Liquidity
Our primary cash needs are for working capital, debt service, and strategic investments or acquisitions. Accounts receivable is the principal component of our working capital and is generally driven by our level of revenue with other short-term fluctuations related to payment practices by our customers. Our accounts receivable reflect amounts billed to our customers as well as the revenue that was recognized in the preceding month, which is generally billed in the following month as of each balance sheet date.
The total amount of our accounts receivable can vary significantly over time, but is generally very sensitive to recent revenue levels. Total accounts receivable typically range from 70 to 80 DSO, calculated on trailing three months of revenue. Our accounts receivable DSO was 74 and 73 as of December 31, 2014 and 2013, respectively.
This table represents cash flows from continuing operations for the periods indicated.
Year Ended December 31, | |||||||||||
2014 | 2013 | 2012 | |||||||||
(in thousands) | |||||||||||
Net cash provided by operating activities | $ | 102,359 | $ | 150,840 | $ | 33,984 | |||||
Net cash used in investing activities | (212,686 | ) | (3,336 | ) | (1,484 | ) | |||||
Net cash provided by (used in) financing activities | 88,447 | (145,522 | ) | (19,167 | ) | ||||||
Cash provided by Operating Activities
2014 Compared with 2013. We generated $102 million of cash from operating activities during the year ended December 31, 2014 compared with $151 million during the year ended December 31, 2013. For the year ended December 31, 2014, net income and non-cash items added $70 million to cash from operations as compared to $80 million for the year ended December 31, 2013. Net working capital changes for the year ended December 31, 2014 increased cash from operations by $32 million as compared to $70 million for the year ended December 31, 2013. The single largest contributor was the reduction of accounts receivable collections for $37 million.
2013 Compared with 2012. We generated $151 million from operating activities during the year ended December 31, 2013, an increase of $117 million as compared with $34 million generated during the year ended December 31, 2012. The increase was due primarily to a decrease in our outstanding accounts receivable of $81 million, a reduction of deferred income taxes of $62 million, and an increase in accounts payable for the year ended December 31, 2013 as compared to the year ended
32
December 31, 2012. These increases were offset in part by a reduction in net income, net of the goodwill impairment charge, of $27 million.
Cash used in Investing Activities
During the year ended December 31, 2014, we used $207 million to purchase DRC. During the fiscal years ended December 31, 2014, 2013, and 2012, we used $5 million, $3 million, and $2 million, respectively, of cash for capital expenditures.
Cash provided by (used in) Financing Activities
Net cash provided by financing activities for the year ended December 31, 2014 was $88 million. During 2014, we borrowed $190 million to purchase DRC and we used $96 million in net repayments on our debt.
Net cash used in financing activities for the year ended December 31, 2013 was $146 million, compared to net cash used in financing activities for the year ended December 31, 2012 of $19 million. This increase in net cash used was attributable primarily to $138 million in net repayments on our debt.
On August 9, 2013, we replaced the 2012 Credit Facility with the 2013 Credit Facility that provides for (i) a $200 million term loan facility maturing on August 9, 2018, and (ii) a $250 million revolving credit facility that terminates on August 9, 2018, with a $50 million letter of credit sublimit and a $25 million swing line loan sublimit. As of December 31, 2014, our outstanding principal balance under the 2013 Credit Facility was $293 million, consisting of the term loan, and our availability under the revolving credit facility was $161 million (net of outstanding letters of credit).
Credit Facility
2013 Credit Facility
On August 9, 2013, Engility Corporation entered into the 2013 Credit Facility with Bank of America, N.A. (as administrative agent, swing line lender and letter of credit issuer) and each of the several lenders from time to time party thereto. The 2013 Credit Facility, which replaced the 2012 Credit Facility, provided for (i) a $200 million term loan facility maturing on August 9, 2018, and (ii) a $250 million revolving credit facility that terminates on August 9, 2018, with a $50 million letter of credit sublimit and a $25 million swing line loan sublimit. The 2013 Credit Facility also contained an accordion feature that permitted us to arrange with the lenders for the provision of up to $150 million in additional commitments.
On January 31, 2014, we acquired DRC for total consideration of approximately $207 million (including the retirement of approximately $86 million of debt of DRC) as described in Note 3 to the accompanying Consolidated and Combined Financial Statements. We financed the DRC acquisition in part by drawing down on the $150 million Accordion under the 2013 Credit Facility, utilizing an incremental term loan of $75 million and an incremental revolving facility of $75 million. We amended the 2013 Credit Facility on this same date to (i) provide for the incremental term loan and incremental revolving credit facility and (ii) replenish the $150 million availability under the Accordion. Pursuant to the amendment, the incremental term loan facility matures on August 9, 2018 and the incremental revolving credit facility terminates on August 9, 2018. The amendment did not change the interest rate under the 2013 Credit Facility.
Maturity, Interest Rate and Fees. All borrowings under the 2013 Credit Facility bore interest at a variable rate per annum equal to an applicable margin, plus, at our option (other than for swing line loans), either (1) a base rate determined by reference to the highest of (a) the prime rate of Bank of America, N.A., (b) the Federal funds effective rate plus 0.50% and (c) a London Interbank Offer Rate (LIBOR) determined by reference to the cost of funds for U.S. dollar deposits for the interest period of one month plus 1.00% or (2) a LIBOR rate determined by reference to the costs of funds for U.S. dollar deposits for the interest period relevant to such borrowing. All swing line loans bore interest at a variable rate per annum equal to an applicable margin, plus a base rate determined as described in the immediately preceding sentence. The applicable margins for the borrowings under the 2013 Credit Facility depended on the consolidated leverage ratio of Engility Holdings, Inc., Engility Corporation and its subsidiaries. The applicable LIBOR margin varied between 2.25% and 3.25%, and the applicable base rate margin varies between 1.25% and 2.25%.
Amortization and Final Maturity. Beginning March 31, 2014, we were required to make scheduled quarterly payments equal to 1.25% of the original principal amount of the combined term loan facility and incremental term loan facility, or $3.4 million per quarter, with the balance to be due and payable on the fifth anniversary of the closing date, August 9, 2018.
Guarantees and Security. All obligations under the 2013 Credit Facility were unconditionally guaranteed by Engility Holdings, Inc. and certain of our direct or indirect wholly owned domestic subsidiaries. All obligations under the 2013 Credit Facility, and the guarantees of those obligations, were secured, subject to certain exceptions, by substantially all of the assets of Engility Corporation and the assets of Engility Holdings, Inc. and Engility Corporation’s subsidiary guarantors.
33
Covenants and Events of Default. The 2013 Credit Facility contained a number of covenants that, among other things and subject to certain exceptions, restricted our ability to incur additional debt; pay dividends on our capital stock or redeem, repurchase or retire our capital stock or other debt; make investments, loans and acquisitions; create restrictions on the payment of dividends or other amounts by Engility Corporation’s subsidiaries to Engility Corporation or to any guarantor; engage in transactions with Engility Corporation’s affiliates; sell assets; materially alter the business Engility Corporation conducts; consolidate, merge, dissolve or wind up our business; incur liens; and prepay or amend subordinated or unsecured debt. Engility Holdings, Inc. is also subject to a passive holding company covenant that limits our ability to engage in certain activities. In addition, the 2013 Credit Facility required that Engility Corporation maintain a minimum consolidated debt service coverage ratio of no less than 1.25:1.00 as of the end of any fiscal quarter of Engility Corporation, and as a result of the DRC acquisition a maximum consolidated leverage ratio of no greater than 3.75:1.00 as of the end of any fiscal quarter of Engility Corporation, with step-downs to 3.50:1.00 beginning with the fiscal quarter ended December 31, 2014, 3.25:1.00 beginning with the fiscal quarter ending March 31, 2015, and 3.00:1.00 beginning with the fiscal quarter ending December 31, 2015. We believe our most restrictive covenant under the 2013 Credit Facility was the maximum consolidated leverage ratio, which as of December 31, 2014 was 2.24:1.00. The Consolidated Leverage Ratio is the ratio of (a) (i) Consolidated Funded Indebtedness as of such date minus (ii) the Designated Cash Balances as of such date to (b) Consolidated EBITDA (as such terms are defined in the 2013 Credit Facility) for the period of the four fiscal quarters most recently ended. The 2013 Credit Facility also contains customary provisions relating to the events of default. As of December 31, 2014, we were in compliance with the covenants under the 2013 Credit Facility.
The carrying value of the principal amount outstanding under the term loan, which approximates fair value, was $259 million as of December 31, 2014. The fair value of the term loan is based on interest rates prevailing on debt with substantially similar risks, terms and maturities and is considered to be a Level 3 input, measured under U.S. GAAP hierarchy. As of December 31, 2014, we had $35 million outstanding on our revolving line of credit and our availability under the revolving portion of the 2013 Credit Facility was $161 million.
The table below summarizes our net debt and available liquidity as of December 31, 2014 and 2013.
December 31, 2014 | (in thousands) December 31, 2013 | Change in Net Debt | |||||||||
Net Debt | |||||||||||
Term loan balance | $ | 258,750 | $ | 197,500 | $ | 61,250 | |||||
Revolver loan balance | 34,500 | — | 34,500 | ||||||||
Cash | (7,123 | ) | (29,003 | ) | 21,880 | ||||||
Net debt | $ | 286,127 | $ | 168,497 | $ | 117,630 | |||||
Available Liquidity | |||||||||||
Cash | $ | 7,123 | $ | 29,003 | $ | (21,880 | ) | ||||
Revolver loan availability | 160,546 | 248,000 | (87,454 | ) | |||||||
Total available liquidity | $ | 167,669 | $ | 277,003 | $ | (109,334 | ) | ||||
Assumption of TASC Credit Facility
As previously disclosed, on February 26, 2015, we completed our acquisition of TASC. In connection with this transaction, which included the payment of a special cash dividend and the repayment of outstanding debt under our 2013 Credit Facility, we borrowed $585 million under a promissory note issued by Engility Corporation and guaranteed by the Company and certain other Engility subsidiaries (the Engility Bridge Loan). In addition, we guaranteed the debt of TASC which, as of February 26, 2015, consisted of (a)(i) a $395 million senior secured first lien term loan facility, (ii) a $50 million senior secured revolving credit facility and (iii) a $250 million senior secured second lien term loan facility (the existing facilities in clauses (a)(i) through (a)(iii), collectively, the TASC Existing Credit Facilities) and (b)(i) a new $435 million senior secured first lien term loan facility, (ii) additional senior secured revolving credit capacity in an aggregate principal amount of $65 million and (iii) a new $150 million senior secured second lien term loan facility (the incremental facilities in clauses (b)(i) through (iii), collectively, the TASC Incremental Facilities), in each case the TASC Incremental Facilities were incurred under and pursuant to increases in the TASC Existing Credit Facilities with Barclays as administrative agent. After repayment in full of the Engility Bridge Loan in connection with the closing of the business combination with TASC, as of February 26, 2015, we, through the TASC Existing Credit Facilities and the TASC Incremental Facilities, had $828 million outstanding under the first lien indebtedness and $400 million outstanding under the second lien indebtedness
We currently depend on cash on hand and cash flows from operations to make scheduled debt payments. The annualized principal and cash interest payments on our debt is approximately $120 million, and we currently have approximately $66
34
million in cash on hand. We expect to be able to meet the estimated principal and interest payments on our debt through a combination of cash on hand and expected cash flows from operations. For the foreseeable future, we expect to use a significant portion of our free cash flow to service our debt obligation.
Contractual Obligations
The table below presents our estimated total contractual obligations at December 31, 2014, including the amounts expected to be paid or settled for each of the periods indicated below.
Payments Due by Period | |||||||||||||||||||
Total | Less Than 1 Year | 1 – 3 Years | 3 – 5 Years | More Than 5 Years | |||||||||||||||
(in thousands) | |||||||||||||||||||
Long-term debt obligations (1) (5) | $ | 321,672 | $ | 22,191 | $ | 43,174 | $ | 256,307 | $ | — | |||||||||
Non-cancellable operating leases (2) | 91,291 | 26,168 | 40,487 | 17,462 | 7,174 | ||||||||||||||
Purchase obligations (3) | 53,505 | 53,505 | — | — | — | ||||||||||||||
Total (4) | $ | 466,468 | $ | 101,864 | $ | 83,661 | $ | 273,769 | $ | 7,174 | |||||||||
(1) | Represents term loan and outstanding borrowing under our revolving line of credit and $28.4 million of expected interest payments. Interest expense was estimated using an assumed interest rate of 2.93%. |
(2) | Non-cancellable operating leases. |
(3) | Represents open purchase orders at December 31, 2014 for amounts expected to be paid for goods or services that are legally binding. |
(4) | Excludes all income tax obligations, a portion of which represents unrecognized tax benefits in connection with uncertain tax positions taken, or expected to be taken on our income tax returns as of December 31, 2014 since we cannot determine the time period of future tax consequences. For additional information regarding income taxes, see Note 8 to the Consolidated and Combined Financial Statements. |
(5) | As previously discussed, upon the acquisition of TASC in February 2015, we assumed and guaranteed the debt of TASC. As a result, our long term debt obligations will total $112 million, $234 million, $228 million and $1,126 million for the periods “Less than 1 Year,” “1-3 Years,” “3-5 Years,” and “More than 5 Years” in the above table, respectively, for total long term debt obligations of $1,701 million. |
Off-Balance Sheet Arrangements
At December 31, 2014, we had no significant off-balance sheet arrangements other than $3 million of outstanding letters of credit with financial institutions covering performance and financial guarantees per contractual requirements with certain customers. These letters of credit may be drawn upon in the event of Engility’s nonperformance.
Quantitative and Qualitative Disclosures About Market Risk
See “Item 7A—Quantitative and Qualitative Disclosures About Market Risk” for a discussion of our market risk.
Legal Proceedings and Contingencies
We are engaged in providing services under contracts with the U.S. government and, to a lesser degree, under foreign government contracts, some of which are funded by the U.S. government. All such contracts are subject to extensive legal and regulatory requirements, and, periodically, agencies of the U.S. government investigate whether such contracts were and are being conducted in accordance with these requirements. Under U.S. government procurement regulations, an indictment by a Federal grand jury, or an administrative finding against us as to our present responsibility to be a U.S. government contractor or subcontractor, could result in the suspension for a period of time from eligibility for awards of new government contracts or task orders or in a loss of export privileges. A conviction, or an administrative finding that satisfies the requisite level of seriousness, could result in debarment from contracting with the U.S. government for a specified term.
We are also subject to investigations, litigation, proceedings, claims or assessments and various contingent liabilities incidental to our businesses. Furthermore, in connection with certain business acquisitions, we have assumed some or all claims against, and liabilities of, such acquired businesses, including both asserted and unasserted claims and liabilities. For a description of our legal proceedings and contingencies, see “Item 3—Legal Proceedings” as well as Note 10 to the Consolidated and Combined Financial Statements.
35
Critical Accounting Policies
Our significant accounting policies are described in Note 1 to the Consolidated and Combined Financial Statements. The preparation of financial statements in conformity with U.S. GAAP requires us to make estimates using assumptions that affect the reported amounts of assets and liabilities and disclosure of contingent assets and liabilities at the date of the financial statements and the reported amounts of revenue and cost of revenue during the reporting period. The most significant of these estimates relate to the recoverability, useful lives and valuation of identifiable intangible assets and goodwill, income taxes and contingencies. Actual amounts will differ from these estimates and could differ materially. We believe that our critical accounting estimates have the following attributes: (1) we are required to make assumptions about matters that are uncertain and inherently judgmental at the time of the estimate; (2) use of reasonably different assumptions could have changed our estimates, particularly with respect to recoverability of assets, and (3) changes in the estimate could have a material effect on our financial condition or results of operations. We believe the following critical accounting policies contain the more significant judgments and estimates used in the preparation of our financial statements.
Revenue Recognition: Substantially all of our revenue is generated from written contractual revenue arrangements. A substantial majority of our contractual (revenue) arrangements have a period of performance of 12 months or less and, given their short duration, generally have few contract modifications. The sales price for our revenue arrangements are generally either cost-plus fixed fee, cost-plus award fee, time-and-material or fixed-price type. Depending on the contractual scope of work, we utilize either accounting standards for revenue arrangements with commercial customers or contract accounting standards for these contracts.
Revenue and profits on cost-plus type contracts are recognized as allowable costs are incurred on the contract, at an amount equal to the allowable costs plus the earned fees on those costs as the Company becomes contractually entitled to reimbursement of the costs and the applicable fees. The fee on a cost-plus type contract is fixed or variable based on the contractual fee arrangement. Cost-plus type contracts with award fee provisions are our primary variable contract fee arrangement. Award fees provide for a fee based on actual performance relative to contractually specified criteria. Revenue and profit on award fees are recorded when awarded by the customer.
Revenue and profits on time-and-material type contracts are recognized on the basis of direct labor hours expended multiplied by the contractual fixed rate per hour, plus the actual costs of materials and other direct non-labor costs.
Revenue for fixed-price service contracts that do not contain measurable units of work performed are generally recognized on a proportional-performance basis over the contractual service period, unless evidence suggests that the revenue is earned, or obligations are fulfilled, in a different manner. Revenue on fixed-price service contracts that contain measurable units of work performed is generally recognized when the units of work are completed.
Revenue for fixed-price type contracts covered by contract accounting standards are recognized using a ratio of actual cumulative costs incurred to total estimated costs at completion of the contract multiplied by the total estimated contract revenue, less cumulative revenue recognized in prior periods. Contract accounting requires significant judgment relative to assessing risks, estimating contract revenue and costs, and making assumptions for schedule and technical issues. A single estimated total profit margin is used to recognize profit. Losses on contracts are recognized in the period in which they become evident. The impact of revisions of contract estimates, which may result from contract modifications, performance or other reasons, are recognized on a cumulative catch-up basis in the period in which the revisions are made.
Revenue and profit in connection with contracts to provide services to the U.S. government that contain collection risk because the contracts are incrementally funded and subject to the availability of funds appropriated, are deferred until a contract modification is obtained, indicating that adequate funds are available to the contract or task order.
Goodwill: We record goodwill in connection with the acquisition of businesses when the purchase price exceeds the fair values of the assets acquired and liabilities assumed. Generally, the largest intangible assets from the businesses that we acquire are the assembled workforces, which includes the human capital of the management, administrative, marketing and business development, engineering and technical employees of the acquired businesses. Since intangible assets for assembled workforces are part of goodwill in accordance with the accounting standards for business combinations, the substantial majority of the intangible assets for our business acquisitions are recognized as goodwill.
We review goodwill for impairment annually as of November 30 and whenever events or changes in circumstances indicate that the carrying amount may not be recoverable using a two-step process for each reporting unit.
The first step in the process is to identify any potential impairment by comparing the carrying value of a reporting unit including goodwill and its fair value. We use a hybrid method valuation approach to determine the fair value of our reporting units which includes (1) the Income Approach (also referred to as a discounted cash flow or DCF), which is dependent upon estimates for future revenue, operating income, depreciation and amortization, income tax payments, working capital changes, and capital expenditures, as well as, expected long-term growth rates for cash flows; (2) the Guideline Public Company Method, which uses valuation metrics from similar publicly traded companies (i.e., small-to-mid-cap providers of services to
36
the U.S. Federal and local governments); and (3) the Guideline Transaction Method which uses valuation multiples from actual transactions in the Aerospace and Defense industry. All of these approaches are affected by economic conditions related to the U.S. defense industry, as well as, conditions in the U.S. capital markets. If a potential impairment is identified, the second step is to measure the impairment loss by comparing the implied fair value of goodwill with the carrying value of goodwill of the reporting unit.
The fair value measurement was calculated using unobservable inputs to the discounted cash flow method, which are classified as Level 3 within the fair value hierarchy under U.S. GAAP. The key assumptions we used to estimate the fair values of our reporting units are:
• | Discount rates; |
• | Compounded annual revenue growth rates; |
• | Average operating margins; and |
• | Terminal value capitalization rate (capitalization rate). |
• | Guideline Company valuations |
• | Guideline Transactions |
Of the key assumptions, the discount rates and the capitalization rate are market-driven. These rates are derived from the use of market data and employment of the capital asset pricing model. The company-dependent key assumptions are the compounded annual revenue growth rates and the average operating margins and are subject to much greater influence from our actions. We used discount rates that are commensurate with the risk and uncertainty inherent in the respective reporting units and in our internally-developed forecasts. Actual results may differ from those assumed in our forecasts and changes in assumptions or estimates could materially affect the determination of the fair value of a reporting unit, and therefore could affect the amount of potential impairment.
We validate our estimate of the fair value of each reporting unit under the income approach by comparing the resulting values to fair value estimates using a market approach.
Inherent in our development of the present value of future cash flow projections are assumptions and estimates derived from a review of our expected revenue growth rates, profit margins, business plans, cost of capital and tax rates. We also make assumptions about future market conditions, market prices, interest rates, and changes in business strategies. Changes in our assumptions or estimates could materially affect the determination of the fair value of a reporting unit and, therefore, could eliminate the excess of fair value over the carrying value of a reporting unit entirely and, in some cases, could result in impairment. Such changes in assumptions could be caused by a loss of one or more significant contracts, reductions in government and/or private industry spending, or a decline in the demand of our services due to changing economic conditions. Given the contractual nature of our business, if we are unable to win or renew contracts; are unable to estimate and control our contract costs; fail to perform adequately to our clients’ expectations; fail to procure third-party subcontractors, or fail to secure adequate funding for our projects, our profits, revenue and growth over the long-term would decline and such a decline could significantly affect the fair value assessment of our reporting units and cause our goodwill to become impaired.
To determine fair value as of November 30, 2014 and 2013, we used the Income Approach, Guideline Public Company Method and the Guideline Transaction Method weighted 50%, 50%, and 0%, respectively. The three methods returned value indications that were supportive of one another and corroborative of the value conclusion. For the November 30, 2013 measurement, we determined to eliminate the results of the Guideline Transaction Method result as the companies were less comparable to ours.
In connection with the preparation of our third quarter financial statements, we conducted an interim test of our goodwill as of September 28, 2012. Our decision to conduct this review was a result of multiple events following the spin-off, including the change in our cost of capital as a stand-alone company.
In performing our analysis to determine fair value we applied the same weightings used in our 2012 impairment analysis, which resulted in a higher fair value than those used in our determination of fair value in 2013. To determine fair value as of November 30, 2012 and September 28, 2012, we used the Income Approach, Guideline Public Company Method and the Guideline Transaction Method weighted 75%, 12.5%, and 12.5%, respectively.
Since the completion of the Realignment on January 1, 2013, our chief executive and chief operating decision maker only receives and evaluates consolidated financial information in order to allocate resources and assess performance. As a result, we determined that we have a single operating and reportable segment and consequently do not aggregate any operating segments. During the years ended December 31, 2014 and 2013, we did not record an impairment charge to goodwill. During the year ended December 31, 2014, we acquired DRC which added $167 million to our balance of goodwill. Prior to our strategic
37
realignment, we had five reporting units. During the year ended December 31, 2012, we reduced goodwill by $426 million due to an impairment charge for five reporting units.
2014 and 2013 Goodwill Measurement
The more significant assumptions used in our DCF valuation to determine the fair value of our reporting unit in connection with the goodwill valuation assessment at November 30, 2014 and 2013 were: (1) detailed three-year cash flow projections for our reporting unit, which are based primarily on our estimates of future revenue, operating income and cash flows, (2) an expected long-term growth rate for our reporting unit, which reflects the expected long-term growth rate for the U.S. economy and respective areas of the U.S. defense industry in which our reporting units operate and (3) risk adjusted discount rates, which represents the estimated weighted-average cost of capital (WACC) for the reporting unit and includes the estimated risk-free rate of return that is used to discount future cash flow projections to their present values.
The reporting unit WACC was comprised of: (1) an estimated required rate of return on equity based on publicly traded companies with business and economic risk characteristics comparable to our reporting unit (Market Participants) and (2) an after-tax rate of return on Market Participants’ debt, each weighted by the relative percentages of Market Participants’ equity and debt. The WACC is based on a number of market inputs that are outside of our control and are updated annually to reflect changes to such market inputs as of the date of our annual goodwill impairment assessments, including changes to: (1) the estimated required rate of return on equity based on historical returns on common stock securities of Market Participants and the Standard & Poor’s 500 Index (referred to as beta), (2) the risk free rate of return based on the prevailing market yield on the 20-year U.S. Treasury bond, (3) the Moody’s 20 year Baa rate, and (4) the relative percentages of Market Participants’ equity and debt.
We consider several factors consistently to determine expected future annual cash flows for our reporting unit, including historical multi-year average cash flow trends and the expected future cash flow growth rates primarily based on our estimates of future revenue, operating income, and working capital changes. Furthermore, the majority of our reporting unit is dependent primarily upon the DoD budget and spending. We closely monitor changes in these factors and their impact on the expected cash flow of our reporting unit.
Our DCF valuation is dependent upon several assumptions and is subject to uncertainties due to uncontrollable events, including future DoD budgets, U.S. government spending priorities for services and general economic conditions. A change in any one or combination of the assumptions used in our DCF valuation could negatively impact the fair value, resulting in additional goodwill impairments.
For the November 30, 2014 and 2013 goodwill impairment tests the long-term growth rate developed by management for purposes of our goodwill impairment analysis was 3% and 4%, respectively, and the weighted average cost of capital (WACC) used was 10% for both periods. The long term growth rate was evaluated considering the discrete projection period and long-term industry and economic factors. For the November 30, 2014 and 2013 goodwill impairment tests, fair value exceeded book value by 107% and 66%, respectively. For the November 30, 2014 and 2013 goodwill impairment tests, a 1% change in the long-term growth rate would change fair value of the reporting unit by approximately $96 million and $67 million, respectively. For the November 30, 2014 and 2013 goodwill impairment tests, a 1% change in the WACC would change fair value of the reporting unit by approximately $131 million and $95 million, respectively.
2012 Goodwill Measurement
We determined our reporting units based on each division of our operating segments. Each division represented a business, which had discrete financial information available, whose operating results were regularly reviewed by division management. In connection with the preparation of our third quarter financial statements, we conducted an interim test of our goodwill as of September 28, 2012. Our decision to conduct this review was a result of multiple events following the spin-off, including the change in our cost of capital as a stand-alone company.
For the November 30, 2012 and September 28, 2012 measurement dates, the aggregate long-term growth rate developed by management for purposes of our goodwill impairment analysis was 2% for both periods and the aggregate weighted average cost of capital (WACC) used was 16% for both periods. Following our review, we recorded a goodwill impairment charge of approximately $426 million for the quarterly period ended September 28, 2012 due to a decline in the estimated fair value of four reporting units. The remaining reporting unit, LOTS, had no goodwill recorded in its carrying value. The long term growth rate was evaluated considering the discrete projection period and long-term industry and economic factors.
We also performed our annual goodwill impairment review of our reporting units as of November 30, 2012. Following this annual review, we concluded that the carrying amounts of the reporting units’ goodwill were not impaired as of November 30, 2012.
The 2012 goodwill impairment charge of $426 million was due to a decline in the estimated fair value of each reporting unit. The decline in fair value was due primarily to a change in the discount rate from the prior year and the elimination of a
38
potential tax structure from our business unit valuation model, which increased the fair value of our reporting units in prior years. The change in the discount rate from 7.1% to 15.0% or 16.5% depending on the reporting unit was due to our increased costs as a stand-alone company compared to L-3. Our prior year assessment of goodwill as of November 30, 2011 included the fair value of a potential tax structure, which assumed that each reporting unit could be sold as a separate asset. There are substantial tax savings available to a purchaser for an asset sale as opposed to the purchaser of an entire entity by stock purchase or merger. As a result of our strategic realignment, announced in September 2012 and implemented during the first quarter of 2013, Engility began operating as a single company and we no longer included the fair value of this potential tax structure. Accordingly, our assessment of goodwill does not use the estimated tax savings from a potential asset sale to increase the fair value of the reporting units.
Identifiable Intangible Assets: As part of the accounting for our business acquisitions, identifiable intangible assets are recognized as assets if they arise from contractual or other legal rights, or if they are capable of being separated or divided from the acquired business and sold, transferred, licensed, rented or exchanged. The most significant identifiable intangible asset that is recognized separately for our business acquisitions is customer contractual relationships. All of our customer relationships are established through written customer contracts (revenue arrangements). The fair value for customer contractual relationships is determined, as of the date of the acquisition, based on estimates and judgments regarding expectations for the estimated future after-tax earnings and cash flows arising from the follow-on revenue on contract (revenue arrangement) renewals expected from the customer contractual relationships over their estimated lives, including the probability of expected future contract renewals and revenue, less a contributory assets charge, all of which is discounted to present value. Identifiable intangible assets are: (1) tested for impairment whenever events or changes in circumstances indicate that the carrying amount of these assets may not be recoverable and (2) amortized over their estimated useful lives as the economic benefits are consumed, ranging from 4 to 30 years. We review and update our estimates of the duration of our customer contractual relationships and consistently consider several factors specific to our existing contracts, including DoD budgets and spending priorities. If such estimates indicate that the duration of our customer contractual relationships have decreased compared to the estimates made as of the date we acquired these intangible assets, then we accelerate the amortization period for our customer contractual relationships over their remaining useful economic life. Depending on the outcome of declining DoD budgets that could reduce funding for some of our revenue arrangements and increase competition for our services due to the uncertainty of future U.S. defense budgets, the value of our customer contractual relationships and their estimated useful lives could be adversely affected.
Income Taxes: We account for income taxes using the asset and liability method. Under this method, deferred tax assets and liabilities are recorded for the future tax consequences attributable to differences between the financial statement carrying amounts of assets and liabilities and their respective tax bases. Deferred tax assets and liabilities are measured using enacted tax rates expected to apply to taxable income in the years in which those temporary differences are expected to be recovered or settled. The effect of a tax rate change on deferred tax assets and liabilities is recognized in income in the period that includes the enactment date. We record valuation allowances to reduce net deferred tax assets to the amount considered more likely than not to be realized. Changes in estimates of future taxable income can materially change the amount of such valuation allowances. We also recognize liabilities for uncertain tax positions when it is more likely than not that a tax position will not be sustained upon ultimate settlement with a taxing authority. If a tax position does not meet the “more-likely-than-not” recognition threshold, despite our belief that our filing position is supportable, the benefit of that tax position is not recognized. At December 31, 2014, we had deferred tax assets of $96 million and deferred tax liabilities of $98 million. Deferred income taxes are determined separately for each of our tax-paying entities in each tax jurisdiction. In assessing the need for a valuation allowance, we considered all available positive and negative evidence, including the future reversal of existing temporary timing differences (deferred tax liabilities), taxable income in carryback years, the feasibility of tax planning strategies and estimated future taxable income. Based on our deferred tax liabilities and our estimates of the amounts and timing of future taxable income, we believe that it is more likely than not that we will be able to realize our deferred tax assets. A change in the ability of our operations to continue to generate future taxable income could affect our ability to realize the future tax deductions underlying our deferred tax assets, and require us to provide a valuation allowance against our deferred tax assets. The recognition of a valuation allowance would result in a reduction to net income and, if significant, could have a material impact on our effective tax rate, results of operations and financial position in any given period.
Pension Obligations: Accounting and reporting for our pension plan requires the use of assumptions, including the discount rate and expected rate of return on assets. These assumptions are used by our independent actuary to determine the value of our pension obligations and allocate this cost to the service periods. The actuarial assumptions used to calculate pension costs are determined and reviewed annually by management after consulting with outside investment advisors and actuaries.
The discount rate represents the estimated rate at which we could effectively settle our pension benefit obligations. In order to estimate this rate for 2014 future expected cash flows of the plan were matched against the Towers Watson RATE:Link yield curve to produce a single discount rate. As of December 31, 2014, the pension plan's measurement date, the weighted average
39
discount rate used to determine the benefit obligations and the net periodic benefit costs was 3.94% and 4.49%, respectively. A decrease of 50 basis points in the discount rate would have resulted in an increase of $0.2 million in annual pension expense.
The assumed expected rate of return on plan assets, which is the average return expected on the funds invested or to be invested to provide future benefits to pension plan participants, is determined by an annual review of historical long-term asset returns and consultation with outside investment advisors. The weighted average expected rate of return for the year ended December 31, 2014 was 8.15%. A decrease of 50 basis points in the expected rate of return would have resulted in an increase in annual pension expense by approximately $0.3 million.
If assumptions differ materially from actual results in the future, our obligations under the pension plan could also differ materially, potentially requiring us to record an additional pension liability and record additional pension costs. An actuarial valuation of the pension plan is performed each year. The results of this actuarial valuation are reflected in the accounting for the pension plan upon determination. As of December 31, 2014, we have a pension liability of $28 million recorded which represented the underfunded benefit obligation.
Liabilities for Pending and Threatened Litigation: We are subject to litigation, government investigations, proceedings, claims or assessments and various contingent liabilities incidental to our business or assumed in connection with certain business acquisitions. In accordance with the accounting standards for contingencies, we accrue a charge for a loss contingency when we believe it is both probable that a liability has been incurred and the amount of the loss can be reasonably estimated. If the loss is within a range of specified amounts, the most likely amount is accrued, and if no amount within the range represents a better estimate we accrue the minimum amount in the range. Generally, we record the loss contingency at the amount we expect to pay to resolve the contingency and the amount is generally not discounted to the present value. Amounts recoverable under insurance contracts are recorded as assets when recovery is deemed probable. Contingencies that might result in a gain are not recognized until realizable. Changes to the amount of the estimated loss, or resolution of one or more contingencies could have a material impact on our results of operations, financial position and cash flows. For a description of our legal proceedings and contingencies, see “Item 3—Legal Proceedings” as well as Note 10 to the Consolidated and Combined Financial Statements.
New Accounting Standards Implemented and Accounting Standards Issued and Not Yet Implemented
In May 2014, the Financial Accounting Standards Board (FASB) issued Accounting Standards Update (ASU) No. 2014-09, Revenue from Contracts with Customers (Topic 606). ASU 2014-09 outlines a single comprehensive model for entities to use when accounting for revenue arising from contracts with customers and supersedes all current revenue recognition guidance, including industry-specific guidance. This new guidance is effective for annual reporting periods (including interim reporting periods within those periods) beginning after December 15, 2016; early adoption is not permitted. Entities have the option of using either a full retrospective or a modified approach to adopt the guidance. This update could impact the timing and amounts of revenue recognized. Currently, we are currently evaluating the effect that implementation of this update will have on our consolidated financial position and results of operations upon adoption.
In June 2014, the FASB issued ASU No. 2014-12, Compensation - Stock Compensation (Topic 718) - Accounting for Share-based Payments when Terms of an award Provide That a Performance Target Could be Achieved after the Requisite Service Period. The Amendments in ASU 2014-12 require that a performance target that affects vesting and that could be achieved after the requisite service period be treated as a performance condition. ASU 2014-12 is effective for interim and annual reporting periods beginning after December 15, 2015, with early adoption permitted. We do not expect this pronouncement to have a material impact on our financial statements.
In August 2014, the FASB issued ASU 2014-15, Presentation of Financial Statements - Going Concern (Subtopic 205-40): Disclosure of Uncertainties about an Entity’s Ability to Continue as a Going Concern. The guidance requires an entity to evaluate whether there are conditions or events, in the aggregate, that raise substantial doubt about the entity’s ability to continue as a going concern within one year after the date that the financial statements are issued (or within one year after the financial statements are available to be issued when applicable) and to provide related footnote disclosures in certain circumstances. The guidance is effective for the annual period ending after December 15, 2016, and for annual and interim periods thereafter. Early application is permitted. We do not believe the adoption of this guidance will have a significant impact on our consolidated financial statements.
Item 7A. QUANTITATIVE AND QUALITATIVE DISCLOSURES ABOUT MARKET RISK
As of December 31, 2014, our exposure to market risk related to changes in interest rates for borrowings under our 2013 Credit Facility. A hypothetical 1% increase in interest rates would have increased our interest expense by approximately $3 million for the year ended December 31, 2014, the period for which we had outstanding borrowings under the 2013 Credit Facility, and likewise decreased our income and cash flows.
40
We are subject to credit risks associated with our cash and cash equivalents, and accounts receivable. We believe that the concentration of credit risk with respect to cash and cash equivalents is limited due to the high credit quality of these investments. Also, we also believe that our credit risk associated with accounts receivable is limited as they are primarily with the U.S. Federal government or prime contractors working for the U.S. Federal government.
We have limited exposure to foreign currency exchange risk as the substantial majority of the business is conducted in U.S. dollars.
41
Item 8. FINANCIAL STATEMENTS AND SUPPLEMENTARY DATA
Index to the Consolidated Financial Statements
Page | |
42
Report of Independent Registered Public Accounting Firm
To the Board of Directors and Stockholders of Engility Holdings, Inc.:
In our opinion, the accompanying consolidated balance sheets and the related consolidated and combined statements of operations, comprehensive income, changes in stockholders’ equity and cash flows present fairly, in all material respects, the financial position of Engility Holdings, Inc. and its subsidiaries at December 31, 2014 and 2013, and the results of their operations and their cash flows for each of the three years in the period ended December 31, 2014 in conformity with accounting principles generally accepted in the United States of America. Also in our opinion, the Company maintained, in all material respects, effective internal control over financial reporting as of December 31, 2014, based on criteria established in Internal Control - Integrated Framework (2013) issued by the Committee of Sponsoring Organizations of the Treadway Commission (COSO). The Company's management is responsible for these financial statements, for maintaining effective internal control over financial reporting and for its assessment of the effectiveness of internal control over financial reporting, included in Management's Report on Internal Control over Financial Reporting appearing under Item 9A. Our responsibility is to express opinions on these financial statements and on the Company's internal control over financial reporting based on our audits (which were integrated audits in 2014 and 2013). We conducted our audits in accordance with the standards of the Public Company Accounting Oversight Board (United States). Those standards require that we plan and perform the audits to obtain reasonable assurance about whether the financial statements are free of material misstatement and whether effective internal control over financial reporting was maintained in all material respects. Our audits of the financial statements included examining, on a test basis, evidence supporting the amounts and disclosures in the financial statements, assessing the accounting principles used and significant estimates made by management, and evaluating the overall financial statement presentation. Our audit of internal control over financial reporting included obtaining an understanding of internal control over financial reporting, assessing the risk that a material weakness exists, and testing and evaluating the design and operating effectiveness of internal control based on the assessed risk. Our audits also included performing such other procedures as we considered necessary in the circumstances. We believe that our audits provide a reasonable basis for our opinions.
A company’s internal control over financial reporting is a process designed to provide reasonable assurance regarding the reliability of financial reporting and the preparation of financial statements for external purposes in accordance with generally accepted accounting principles. A company’s internal control over financial reporting includes those policies and procedures that (i) pertain to the maintenance of records that, in reasonable detail, accurately and fairly reflect the transactions and dispositions of the assets of the company; (ii) provide reasonable assurance that transactions are recorded as necessary to permit preparation of financial statements in accordance with generally accepted accounting principles, and that receipts and expenditures of the company are being made only in accordance with authorizations of management and directors of the company; and (iii) provide reasonable assurance regarding prevention or timely detection of unauthorized acquisition, use, or disposition of the company’s assets that could have a material effect on the financial statements.
Because of its inherent limitations, internal control over financial reporting may not prevent or detect misstatements. Also, projections of any evaluation of effectiveness to future periods are subject to the risk that controls may become inadequate because of changes in conditions, or that the degree of compliance with the policies or procedures may deteriorate.
As described in Management's Report on Internal Control over Financial Reporting appearing under Item 9A, management has excluded Dynamics Research Corporation from its assessment of internal control over financial reporting as of December 31, 2014 because it was acquired by the Company in a purchase business combination during 2014. We have also excluded Dynamics Research Corporation from our audit of internal control over financial reporting. Dynamics Research Corporation is a wholly-owned subsidiary whose total assets and total revenue represent 22% and 17%, respectively, of the related consolidated financial statement amounts as of and for the year ended December 31, 2014.
/s/ PricewaterhouseCoopers LLP
McLean, Virginia
March 3, 2015
43
ENGILITY HOLDINGS, INC.
CONSOLIDATED BALANCE SHEETS
(in thousands)
December 31, | |||||||
2014 | 2013 | ||||||
ASSETS | |||||||
Current assets: | |||||||
Cash and cash equivalents | $ | 7,123 | $ | 29,003 | |||
Receivables, net | 286,403 | 286,272 | |||||
Other current assets | 27,784 | 25,892 | |||||
Total current assets | 321,310 | 341,167 | |||||
Property, plant and equipment, net | 19,839 | 11,895 | |||||
Goodwill | 644,554 | 477,604 | |||||
Identifiable intangible assets, net | 123,549 | 92,205 | |||||
Other assets | 13,384 | 7,183 | |||||
Total assets | $ | 1,122,636 | $ | 930,054 | |||
LIABILITIES AND EQUITY | |||||||
Current liabilities: | |||||||
Current portion of long-term debt | $ | 13,750 | $ | 10,000 | |||
Accounts payable, trade | 49,121 | 28,286 | |||||
Accrued employment costs | 47,824 | 49,582 | |||||
Accrued expenses | 71,582 | 63,843 | |||||
Advance payments and billings in excess of costs incurred | 22,300 | 19,087 | |||||
Deferred income taxes, current and income taxes payable | 9,810 | 10,693 | |||||
Other current liabilities | 21,098 | 17,928 | |||||
Total current liabilities | 235,485 | 199,419 | |||||
Long-term debt | 279,500 | 187,500 | |||||
Income tax payable | 79,713 | 77,494 | |||||
Other liabilities | 51,185 | 22,487 | |||||
Total liabilities | 645,883 | 486,900 | |||||
Commitments and contingencies (see Note 10) | |||||||
Equity: | |||||||
Preferred stock, par value $0.01 per share, 25,000 shares authorized, none issued or outstanding as of December 31, 2014 or December 31, 2013 | — | — | |||||
Common stock, par value $0.01 per share, 175,000 shares authorized, 17,592 and 17,238 shares issued and outstanding as of December 31, 2014 and 2013, respectively | 176 | 172 | |||||
Additional paid in capital | 770,764 | 761,119 | |||||
Accumulated deficit | (295,543 | ) | (330,911 | ) | |||
Accumulated other comprehensive loss | (9,018 | ) | — | ||||
Non-controlling interest | 10,374 | 12,774 | |||||
Total equity | 476,753 | 443,154 | |||||
Total liabilities and equity | $ | 1,122,636 | $ | 930,054 | |||
See notes to Consolidated and Combined Financial Statements
44
ENGILITY HOLDINGS, INC.
CONSOLIDATED AND COMBINED STATEMENTS OF OPERATIONS
(in thousands, except per share data)
Year Ended December 31, | |||||||||||
2014 | 2013 | 2012 | |||||||||
Revenue | $ | 1,367,091 | $ | 1,407,372 | $ | 1,555,310 | |||||
Revenue from affiliated entities | — | — | 100,034 | ||||||||
Total revenue | 1,367,091 | 1,407,372 | 1,655,344 | ||||||||
Costs and expenses | |||||||||||
Cost of revenue | 1,169,281 | 1,214,581 | 1,315,352 | ||||||||
Cost of revenue from affiliated entities | — | — | 100,034 | ||||||||
Total cost of revenue | 1,169,281 | 1,214,581 | 1,415,386 | ||||||||
Selling, general and administrative expenses | 114,890 | 84,635 | 142,440 | ||||||||
Goodwill impairment charge | — | — | 426,436 | ||||||||
Total costs and expenses | 1,284,171 | 1,299,216 | 1,984,262 | ||||||||
Operating income (loss) | 82,920 | 108,156 | (328,918 | ) | |||||||
Interest expense, net | 12,799 | 21,648 | 10,857 | ||||||||
Other income, net | 526 | 793 | 136 | ||||||||
Income (loss) from continuing operations before income taxes | 70,647 | 87,301 | (339,639 | ) | |||||||
Provision for income taxes | 30,637 | 32,584 | 5,156 | ||||||||
Income (loss) from continuing operations | 40,010 | 54,717 | (344,795 | ) | |||||||
Loss from discontinued operations before income taxes | — | — | (1,017 | ) | |||||||
Benefit for income taxes | — | — | (391 | ) | |||||||
Loss from discontinued operations, net of tax | — | — | (626 | ) | |||||||
Net income (loss) | $ | 40,010 | $ | 54,717 | $ | (345,421 | ) | ||||
Less: Net income attributable to non-controlling interest | 4,587 | 5,190 | 4,952 | ||||||||
Net income (loss) attributable to Engility | $ | 35,423 | $ | 49,527 | $ | (350,373 | ) | ||||
Net Income (loss) per share allocable to Engility Holdings, Inc. common shareholders - basic | |||||||||||
Net income (loss) per share from continuing operations less non-controlling interest | $ | 2.07 | $ | 2.94 | $ | (21.48 | ) | ||||
Net loss per share from discontinued operations | $ | — | $ | — | $ | (0.04 | ) | ||||
Net income (loss) per share attributable to Engility | $ | 2.07 | $ | 2.94 | $ | (21.52 | ) | ||||
Net Income (loss) per share allocable to Engility Holdings, Inc. common shareholders - diluted | |||||||||||
Net income (loss) per share from continuing operations less non-controlling interest | $ | 1.97 | $ | 2.81 | $ | (21.48 | ) | ||||
Net loss per share from discontinued operations | $ | — | $ | — | $ | (0.04 | ) | ||||
Net income (loss) per share attributable to Engility | $ | 1.97 | $ | 2.81 | $ | (21.52 | ) | ||||
Weighted average number of shares outstanding | |||||||||||
- Basic | 17,100 | 16,873 | 16,281 | ||||||||
- Diluted | 18,018 | 17,653 | 16,281 | ||||||||
See notes to Consolidated and Combined Financial Statements
45
ENGILITY HOLDINGS, INC.
CONSOLIDATED AND COMBINED STATEMENTS OF COMPREHENSIVE INCOME
(in thousands)
Year Ended December 31, | |||||||||||
2014 | 2013 | 2012 | |||||||||
Net income (loss) | $ | 40,010 | $ | 54,717 | $ | (345,421 | ) | ||||
Pension liability adjustment, net of tax benefit of $5,782 | (9,018 | ) | — | — | |||||||
Comprehensive income (loss) | 30,992 | 54,717 | (345,421 | ) | |||||||
Less: Net income attributable to non-controlling interest | 4,587 | 5,190 | 4,952 | ||||||||
Comprehensive income (loss) available to Engility | $ | 26,405 | $ | 49,527 | $ | (350,373 | ) | ||||
See notes to Consolidated and Combined Financial Statements
46
ENGILITY HOLDINGS, INC.
CONSOLIDATED AND COMBINED STATEMENTS OF CHANGES IN STOCKHOLDERS' EQUITY
For the Years Ended December 31, 2014, 2013 and 2012
(in thousands)
Common Stock | Prior Parent Company Investment | Additional Paid-in Capital | Accumulated Deficit | Accumulated Other Comprehensive Income | Non-Controlling Interest | Total Stockholders' Equity | ||||||||||||||||||||||||
Shares | Amount | |||||||||||||||||||||||||||||
Balance at January 1, 2012 | — | $ | — | $ | 1,083,237 | $ | — | $ | — | $ | — | $ | 10,366 | $ | 1,093,603 | |||||||||||||||
Issuance of common stock in connection with Spin-Off | 16,118 | 161 | — | (161 | ) | — | — | — | — | |||||||||||||||||||||
Conversion of prior parent company investment to additional paid-in capital | — | — | (748,335 | ) | 750,113 | — | — | — | 1,778 | |||||||||||||||||||||
Share-based compensation | 501 | 6 | — | 6,239 | — | — | — | 6,245 | ||||||||||||||||||||||
Proceeds from share-based payment arrangements | 84 | 1 | — | 1,225 | — | — | — | 1,226 | ||||||||||||||||||||||
Payment of employee withholding taxes on restricted stock units | — | — | — | (1,778 | ) | — | — | — | (1,778 | ) | ||||||||||||||||||||
Net transfer to prior parent company, including discontinued operations | — | — | (364,967 | ) | — | — | — | — | (364,967 | ) | ||||||||||||||||||||
Net income from January 1, 2012 to July 17, 2012 | — | — | 30,065 | — | — | — | 30,065 | |||||||||||||||||||||||
Net loss from July 18, 2012 to December 31, 2012 | — | — | — | — | (380,438 | ) | — | — | (380,438 | ) | ||||||||||||||||||||
Net income attributable to non-controlling member | — | — | — | — | — | — | 4,952 | 4,952 | ||||||||||||||||||||||
Distribution to non-controlling interest member | — | — | — | — | — | — | (2,375 | ) | (2,375 | ) | ||||||||||||||||||||
Balance at December 31, 2012 | 16,703 | $ | 168 | $ | — | $ | 755,638 | $ | (380,438 | ) | $ | — | $ | 12,943 | $ | 388,311 | ||||||||||||||
Conversion of prior parent company investment to additional paid-in capital | — | — | — | (2,934 | ) | — | — | — | (2,934 | ) | ||||||||||||||||||||
Share-based compensation | 479 | 3 | — | 8,691 | — | — | — | 8,694 | ||||||||||||||||||||||
Proceeds from share-based payment arrangements | 56 | 1 | — | 936 | — | — | — | 937 | ||||||||||||||||||||||
Payment of employee withholding taxes on restricted stock units | — | — | — | (1,106 | ) | — | — | — | (1,106 | ) | ||||||||||||||||||||
Net income | — | — | — | — | 49,527 | — | — | 49,527 | ||||||||||||||||||||||
Net income attributable to non-controlling member | — | — | — | — | — | — | 5,190 | 5,190 | ||||||||||||||||||||||
Distribution to non-controlling interest member | — | — | — | — | — | — | (5,359 | ) | (5,359 | ) | ||||||||||||||||||||
Other | — | $ | — | $ | — | $ | (106 | ) | $ | — | $ | — | $ | — | $ | (106 | ) | |||||||||||||
Balance at December 31, 2013 | 17,238 | $ | 172 | $ | — | $ | 761,119 | $ | (330,911 | ) | $ | — | $ | 12,774 | $ | 443,154 | ||||||||||||||
Share-based compensation | 272 | 3 | — | 8,830 | — | — | — | 8,833 | ||||||||||||||||||||||
Proceeds from share-based payment arrangements | 82 | 1 | — | 1,479 | — | — | — | 1,480 | ||||||||||||||||||||||
Payment of employee withholding taxes on restricted stock units | — | — | — | (2,371 | ) | — | — | — | (2,371 | ) | ||||||||||||||||||||
Excess tax deduction from share-based payment arrangements | — | — | — | 1,707 | — | — | — | 1,707 | ||||||||||||||||||||||
Net income | — | — | — | — | 35,423 | — | — | 35,423 | ||||||||||||||||||||||
Net income attributable to non-controlling member | — | — | — | — | — | — | 4,587 | 4,587 | ||||||||||||||||||||||
Distribution to non-controlling interest member | — | — | — | — | — | — | (6,987 | ) | (6,987 | ) | ||||||||||||||||||||
Other comprehensive loss | — | — | — | — | — | (9,018 | ) | — | (9,018 | ) | ||||||||||||||||||||
Other | — | — | — | — | (55 | ) | — | — | (55 | ) | ||||||||||||||||||||
Balance at December 31, 2014 | 17,592 | $ | 176 | $ | — | $ | 770,764 | $ | (295,543 | ) | $ | (9,018 | ) | $ | 10,374 | $ | 476,753 | |||||||||||||
See notes to Consolidated and Combined Financial Statements
47
ENGILITY HOLDINGS, INC.
CONSOLIDATED AND COMBINED STATEMENTS OF CASH FLOWS
(in thousands)
Year Ended December 31, | |||||||||||
2014 | 2013 | 2012 | |||||||||
Operating activities: | |||||||||||
Net income (loss) | $ | 40,010 | $ | 54,717 | $ | (345,421 | ) | ||||
Less: Loss from discontinued operations, net of tax | — | — | (626 | ) | |||||||
Income (loss) from continuing operations | 40,010 | 54,717 | (344,795 | ) | |||||||
Goodwill impairment charge | — | — | 426,436 | ||||||||
Share-based compensation | 8,830 | 8,691 | 7,487 | ||||||||
Depreciation and amortization | 20,953 | 12,106 | 16,410 | ||||||||
Amortization of bank debt fees | 1,634 | 6,264 | 1,662 | ||||||||
Deferred income tax benefit | (1,355 | ) | (1,377 | ) | (63,375 | ) | |||||
Changes in operating assets and liabilities, excluding acquired amounts: | |||||||||||
Receivables | 43,115 | 79,964 | 28,606 | ||||||||
Other current assets | 4,611 | 7,590 | (122 | ) | |||||||
Accounts payable, trade | 5,399 | 11,425 | (32,574 | ) | |||||||
Accrued employment costs | (18,603 | ) | (13,696 | ) | (9,263 | ) | |||||
Accrued expenses | 3,004 | (13,614 | ) | 3,351 | |||||||
Advance payments and billings in excess of costs incurred | 2,904 | (8,443 | ) | 1,944 | |||||||
Other liabilities | (8,143 | ) | 7,213 | (1,783 | ) | ||||||
Net cash provided by operating activities from continuing operations | 102,359 | 150,840 | 33,984 | ||||||||
Investing activities: | |||||||||||
Purchase of business, net of cash acquired | (207,250 | ) | — | — | |||||||
Capital expenditures | (5,436 | ) | (3,336 | ) | (2,164 | ) | |||||
Proceeds from sale of property, plant, and equipment | — | — | 680 | ||||||||
Net cash used in investing activities from continuing operations | (212,686 | ) | (3,336 | ) | (1,484 | ) | |||||
Financing activities: | |||||||||||
Gross borrowings from issuance of long-term debt | 75,000 | 200,000 | 335,000 | ||||||||
Repayments of long-term debt | (13,750 | ) | (337,500 | ) | — | ||||||
Gross borrowings from revolving credit facility | 482,500 | 196,000 | 30,690 | ||||||||
Repayments of revolving credit facility | (448,000 | ) | (196,000 | ) | (30,690 | ) | |||||
Debt issuance costs | (1,131 | ) | (2,493 | ) | (11,005 | ) | |||||
Distributions to non-controlling interest member | (6,987 | ) | (5,359 | ) | (2,374 | ) | |||||
Proceeds from share-based payment arrangements | 1,479 | 936 | 1,225 | ||||||||
Excess tax deduction on share-based payment arrangements | 1,707 | — | — | ||||||||
Payment of employee withholding taxes on share-based compensation | (2,371 | ) | (1,106 | ) | (1,778 | ) | |||||
Dividend to prior parent company | — | — | (335,000 | ) | |||||||
Net transfers to prior parent company | — | — | (5,235 | ) | |||||||
Net cash provided by (used in) financing activities from continuing operations | 88,447 | (145,522 | ) | (19,167 | ) | ||||||
Discontinued Operations: | |||||||||||
Net cash provided by operating activities | — | — | 25,952 | ||||||||
Net cash used in financing activities | — | — | (25,974 | ) | |||||||
Cash balance of discontinued operations | — | — | 22 | ||||||||
Net cash provided by discontinued operations | — | — | — | ||||||||
Net increase (decrease) in cash and cash equivalents | (21,880 | ) | 1,982 | 13,333 | |||||||
Cash and cash equivalents, beginning of the year | 29,003 | 27,021 | 13,688 | ||||||||
Cash and cash equivalents, end of the year | $ | 7,123 | $ | 29,003 | $ | 27,021 | |||||
Supplemental cash flow disclosure: | |||||||||||
Cash paid for taxes | $ | 20,256 | $ | 31,503 | $ | 15,972 | |||||
Cash paid for interest | $ | 11,470 | $ | 14,623 | $ | 9,167 | |||||
See notes to Consolidated and Combined Financial Statements
48
ENGILITY HOLDINGS, INC.
NOTES TO CONSOLIDATED AND COMBINED FINANCIAL STATEMENTS
(amounts in thousands except per share data or where specified)
1. Basis of Presentation
Spin-Off from L-3: On July 17, 2012, L-3 Communications Holdings, Inc. completed the spin-off of Engility Holdings, Inc. from L-3 (the Spin-Off). We retained the systems engineering and technical assistance (SETA), training and operational support services businesses that were previously part of L-3’s Government Services segment. For the periods prior to July 17, 2012, Engility Holdings was a subsidiary of L-3 Communications Holdings, Inc. Unless the context indicates otherwise, (i) references to Engility, the Company, we, us or our refer to Engility Holdings, Inc. and its subsidiaries and (ii) references to L-3 refer to L-3 Communications Holdings and its subsidiaries.
On July 17, 2012, our common stock was distributed, on a pro rata basis, to L-3’s stockholders of record as of the close of business on July 16, 2012. Our common stock began “regular-way” trading on the New York Stock Exchange on July 18, 2012 under the symbol “EGL.”
Description of Business: Engility, through its predecessors, has provided mission-critical services to the U.S. government for over five decades. For the year ended December 31, 2014, our customers include the U.S. Department of Defense (DoD), U.S. Department of Justice (DoJ), U.S. Agency for International Development (USAID), U.S. Department of State (DoS), Federal Aviation Administration (FAA), Department of Homeland Security (DHS), and allied foreign governments. We attribute the strength of our customer relationships to our singular focus on services, our industry-leading capabilities in program planning and management, superior past performance, and the experience of our people and their commitment to our customers’ missions. As of December 31, 2014, we employed approximately 6,600 individuals globally and operated in over 50 countries. We are led by a seasoned executive team, which is composed of industry, U.S. military and government veterans.
We offer a broad range of services, including specialized technical consulting, program and business support, engineering and technology lifecycle support, information technology modernization and sustainment, supply chain services and logistics management and training and education to the U.S. government worldwide.
Summary of Significant Accounting Policies
Principles of Consolidation and Combination and Basis of Presentation: The Consolidated and Combined Financial Statements are prepared in conformity with accounting principles generally accepted in the United States of America (U.S. GAAP) and reflect the financial position, results of operations and cash flows of Engility as a separate stand-alone entity beginning July 18, 2012. For the period presented prior to the Spin-Off, the accompanying combined financial statements of Engility are derived from the accounting records of L-3 as if it operated on a stand-alone basis. All significant intercompany transactions between the combined businesses that comprise Engility were eliminated.
For the period prior to the Spin-Off, the Combined Statements of Operations include expense allocations for the corporate functions provided to the Company by L-3, including, but not limited to, executive management, finance, legal, human resources, employee benefits administration, treasury, tax, internal audit, information technology, communications, ethics and compliance, insurance, and share-based compensation. These expenses were allocated to the Company for such periods on the basis of direct usage when identifiable, with the remainder allocated on the basis of revenue or headcount. We believe these allocations have been made on a consistent basis and are a reasonable reflection of the utilization of the services received by, or benefits provided to Engility by L-3 during the periods presented. Management believes, based on the current and historical organizational and information technology structure, that the costs allocated by L-3 approximate the costs required for Engility to operate as a stand-alone public company. However, actual costs that may have been incurred, had Engility been a stand-alone company prior to the Spin-Off, would have depended on a number of factors, including the stand-alone organizational structure, what functions were outsourced or performed by employees and strategic decisions made in areas such as information technology and infrastructure.
For the period prior to the Spin-Off, transactions between Engility and L-3 have been included in the Combined Financial Statements, were considered to be effectively settled for cash at the time the transaction is recorded, and therefore are included as financing activities in the Combined Statements of Cash Flows.
See Note 7 for a further description of the transactions between Engility and L-3.
Non-controlling Interest: Engility holds a 50.1% majority interest in Forfeiture Support Associates J.V. (FSA). The results of operations of FSA are included in Engility’s Consolidated and Combined Statements of Operations. The non-controlling interest reported on the Consolidated Balance Sheets represents the portion of FSA’s equity that is attributable to the non-controlling interest.
49
ENGILITY HOLDINGS, INC.
NOTES TO CONSOLIDATED AND COMBINED FINANCIAL STATEMENTS
(amounts in thousands except per share data or where specified)
Accounting Estimates: The preparation of financial statements in conformity with U.S. GAAP requires management to make estimates using assumptions that affect the reported amounts of assets and liabilities and disclosure of contingent assets and liabilities at the date of the financial statements and the reported amounts of revenue and expenses during the reporting periods. The most significant of these estimates include the recoverability, useful lives and valuation of identifiable intangible assets and goodwill, income taxes and contingencies. Actual results experienced by the Company may differ materially from management's estimates.
Revenue Recognition: Substantially all of our revenue is generated from written contractual revenue arrangements. A substantial majority of our contractual (revenue) arrangements have a period of performance of 12 months or less and, given their short duration, generally have few contract modifications. The sales price for our revenue arrangements are either cost-plus fixed fee, cost-plus award fee, time-and-material or fixed-price type. Depending on the contractual scope of work, we utilize either accounting standards for revenue arrangements with commercial customers or contract accounting standards for these contracts.
Revenue and profits on cost-plus type contracts are recognized as allowable costs are incurred on the contract, at an amount equal to the allowable costs plus the earned fees on those costs as the Company becomes contractually entitled to reimbursement of the costs and the applicable fees. The fee on a cost-plus type contract is fixed or variable based on the contractual fee arrangement. Cost-plus type contracts with award fee provisions are our primary variable contract fee arrangement. Award fees provide for a fee based on actual performance relative to contractually specified criteria. Revenue and profit on award fees are recorded when awarded by the customer.
Revenue and profits on time-and-material type contracts are recognized on the basis of direct labor hours expended multiplied by the contractual fixed rate per hour, plus the actual costs of materials and other direct non-labor costs.
Revenue for fixed-price service contracts that do not contain measurable units of work performed are generally recognized on a proportional-performance basis over the contractual service period, unless evidence suggests that the revenue is earned, or obligations are fulfilled, in a different manner. Revenue on fixed-price service contracts that contain measurable units of work performed is generally recognized when the units of work are completed.
Revenue for fixed-price type contracts covered by contract accounting standards are recognized using a ratio of actual cumulative costs incurred to total estimated costs at completion of the contract multiplied by the total estimated contract revenue, less cumulative revenue recognized in prior periods. Contract accounting requires significant judgment relative to assessing risks, estimating contract revenue and costs, and making assumptions for schedule and technical issues. A single estimated total profit margin is used to recognize profit. Losses on contracts are recognized in the period in which they become evident. The impact of revisions of contract estimates, which may result from contract modifications, performance or other reasons, are recognized on a cumulative catch-up basis in the period in which the revisions are made.
Revenue and profit in connection with contracts to provide services to the U.S. government that contain collection risk because the contracts are incrementally funded and subject to the availability of funds appropriated, are deferred until a contract modification is obtained, indicating that adequate funds are available to the contract or task order.
Cost of Revenue: Cost of revenue primarily consists of compensation expenses for program personnel, the fringe benefits associated with this compensation, other direct expenses incurred to complete programs, including cost of materials and subcontract efforts.
Selling, General, and Administrative Expenses: Selling, general and administrative expenses are expensed as incurred.
Share-Based Compensation: Certain key employees of Engility participate in share-based compensation plans. We follow the fair value based method of accounting for share-based employee compensation, which requires us to expense all share-based employee compensation. We issue performance shares, restricted stock units and non-qualified stock options under our existing plans to employees of the Company. Compensation expense is recognized for the entire award, net of estimated forfeitures, on a straight line basis over the requisite service period, which is generally three years, based on the grant date fair value.
Income Taxes: Prior to the Spin-Off, our operations had historically been included in L-3’s U.S. Federal and state income tax returns and all income taxes have been paid by L-3. Income taxes are presented in these Consolidated and Combined Financial Statements as if we filed our own tax returns on a standalone basis. Following the Spin-Off, we file our income taxes as a stand-alone entity.
We account for income taxes using the asset and liability method. Under this method, deferred tax assets and liabilities are recorded for the future tax consequences attributable to differences between the financial statement carrying amounts of
50
ENGILITY HOLDINGS, INC.
NOTES TO CONSOLIDATED AND COMBINED FINANCIAL STATEMENTS
(amounts in thousands except per share data or where specified)
assets and liabilities and their respective tax bases. Deferred tax assets and liabilities are measured using enacted tax rates expected to apply to taxable income in the years in which those temporary differences are expected to be recovered or settled. The effect of a tax rate change on deferred tax assets and liabilities is recognized in income in the period that includes the enactment date. We record valuation allowances to reduce net deferred tax assets to the amount considered more likely than not to be realized. Changes in estimates of future taxable income can materially change the amount of such valuation allowances. We also recognize liabilities for uncertain tax positions when it is more likely than not that a tax position will not be sustained upon ultimate settlement with a taxing authority. If a tax position does not meet the “more-likely-than-not” recognition threshold, despite our belief that our filing position is supportable, the benefit of that tax position is not recognized. At December 31, 2014, we had deferred tax assets of $96 million and deferred tax liabilities of $98 million. Deferred income taxes are determined separately for each of our tax-paying entities in each tax jurisdiction. In assessing the need for a valuation allowance, we considered all available positive and negative evidence, including the future reversal of existing temporary timing differences (deferred tax liabilities), taxable income in carryback years, the feasibility of tax planning strategies and estimated future taxable income. Based on our deferred tax liabilities and our estimates of the amounts and timing of future taxable income, we believe that it is more likely than not that we will be able to realize our deferred tax assets. A change in the ability of our operations to continue to generate future taxable income could affect our ability to realize the future tax deductions underlying our deferred tax assets, and require us to provide a valuation allowance against our deferred tax assets. The recognition of a valuation allowance would result in a reduction to net income and, if significant, could have a material impact on our effective tax rate, results of operations and financial position in any given period.
Our accounting policy is to record the highest amount of tax benefit for uncertain tax positions that meet the recognition criteria based on the Company’s evaluation of the facts, circumstances and information available as of the reporting date. For uncertain tax positions that do not meet the recognition criteria, we record either a current or long term tax liability based on the timing of when the uncertain tax position is expected to be resolved. We include any interest and penalties associated with uncertain tax positions in our income tax provision.
Cash and Cash Equivalents: Cash and cash equivalents represent cash that is directly attributable to the Company. Cash equivalents consist of highly liquid investments with an original maturity of three months or less at the time of purchase.
Property, Plant and Equipment: Property, plant and equipment are stated at cost, less accumulated depreciation. Depreciation is computed by applying the straight-line method to the estimated useful lives of the related assets. Useful lives for buildings are 30 years. Useful lives for leasehold improvements range from 5 to 23 years and useful lives for machinery, equipment, furniture and fixtures range from 2 to 15 years. Leasehold improvements are amortized over the shorter of the lease term or the estimated useful life of the improvements. When property or equipment is retired or otherwise disposed of, the net book value of the asset is removed from our balance sheet and the net gain or loss is included in the determination of operating income. Maintenance and repairs are charged to expense as incurred.
Goodwill: We record goodwill in connection with the acquisition of businesses when the purchase price exceeds the fair values of the assets acquired and liabilities assumed. Generally, the largest intangible assets from the businesses that we acquire are the assembled workforces, which includes the human capital of the management, administrative, marketing and business development, engineering and technical employees of the acquired businesses. The success of our businesses, including our ability to retain existing business (revenue arrangements) and to compete successfully for and win new business (revenue arrangements), is primarily dependent on the management, marketing and business development, contracting, engineering and technical skills and knowledge of our employees, rather than on productive capital (plant and equipment, and technology and intellectual property). Additionally, for a significant portion of its businesses, our ability to attract and retain employees who have U.S. government security clearances, particularly those of top-secret and above, is critical to our success, and is often a prerequisite for retaining existing revenue arrangements and pursuing new ones. Therefore, because intangible assets for assembled workforces are part of goodwill in accordance with the accounting standards for business combinations, the substantial majority of the intangible assets for our business acquisitions are recognized as goodwill. Additionally, the value assigned to goodwill for our business acquisitions also includes the value that we expect to realize from cost reduction measures that we implement for our acquired businesses.
The carrying value of goodwill is not amortized, but is tested for impairment annually as of November 30 as well as whenever events or changes in circumstances indicate that the carrying amount may not be recoverable using a two-step process for each reporting unit. A reporting unit is an operating segment, as defined by the segment reporting accounting standards, or a component of an operating segment. A component of an operating segment is a reporting unit if the component constitutes a business for which discrete financial information is available and is reviewed by operating segment management. As of January 1, 2013, we operate in one reporting unit. The first step in the process is to identify any potential impairment by comparing the carrying value of a reporting unit including goodwill and its fair value. We determine the fair value of our
51
ENGILITY HOLDINGS, INC.
NOTES TO CONSOLIDATED AND COMBINED FINANCIAL STATEMENTS
(amounts in thousands except per share data or where specified)
reporting unit using a discounted cash flow valuation approach. If a potential impairment is identified, the second step is to measure the impairment loss by comparing the implied fair value of goodwill with the carrying value of goodwill of the reporting unit.
Identifiable Intangible Assets: As part of the accounting for our business acquisitions, identifiable intangible assets are recognized as assets if they arise from contractual or other legal rights, or if they are capable of being separated or divided from the acquired business and sold, transferred, licensed, rented or exchanged. We do not recognize any intangible assets apart from goodwill for the assembled workforces of our business acquisitions.
Identifiable intangible assets include customer contractual relationships, technology and favorable leasehold interests. The initial measurement of these intangible assets is based on their fair values. The most significant identifiable intangible asset that is separately recognized for our business acquisitions is customer contractual relationships. All of our customer relationships are established through written customer contracts (revenue arrangements). The fair value for customer contractual relationships is determined, as of the date of acquisition, based on estimates and judgments regarding expectations for the estimated future after-tax earnings and cash flows (including cash flows for working capital) arising from the follow-on revenue on contract (revenue arrangement) renewals expected from the customer contractual relationships over their estimated lives, including the probability of expected future contract renewals and revenue, less a contributory assets charge, all of which is discounted to present value.
Identifiable intangible assets are: (1) tested for impairment whenever events or changes in circumstances indicate that the carrying amount of these assets may not be recoverable and (2) amortized over their estimated useful lives as the economic benefits are consumed, ranging from 4 to 28 years.
Defined Benefit Pension Plan: The Company measures plan assets and benefit obligations as of the date of its fiscal year end. Accounting and reporting for the Company's pension plan requires the use of assumptions, including but not limited to, a discount rate and an expected return on assets. These assumptions are reviewed at least annually based on reviews of current plan information and consultation with the Company's independent actuary and the plan's investment advisor. If these assumptions differ materially from actual results, the Company's obligations under the pension plan could also differ materially, potentially requiring the Company to record an additional pension liability. The Company's pension liability is developed from an actuarial valuation, which is performed each year.
Fair Value Measurements: The Company's financial assets and liabilities are measured at fair value which is defined as the price that would be received to sell an asset, or paid to transfer a liability, in an orderly transaction between market participants. Valuation techniques are based on observable or unobservable inputs. Observable inputs reflect market data obtained from independent sources, while unobservable inputs reflect the Company's market assumptions.
These two types of inputs have created the following fair value hierarchy:
• | Level 1 — Quoted prices for identical instruments in active markets. |
• | Level 2 — Quoted prices for similar instruments in active markets; quoted prices for identical or similar instruments in markets that are not active; and model-derived valuations in which significant value drivers are observable. |
• | Level 3 — Valuations derived from valuation techniques in which significant value drivers are unobservable. |
The carrying values of cash and cash equivalents, contract receivables and accounts payable approximate fair value because of the short-term nature of these instruments. The carrying value of the senior term loan approximates fair value because the interest rate is variable and therefore deemed to reflect a market rate of interest.
Accounts Payable: Accounts payable as of December 31, 2014 and 2013 includes $26 million and $1 million of checks outstanding.
Earnings (loss) per Share: Basic EPS are computed by dividing net income (loss) by the weighted average number of common shares outstanding for the period. Diluted EPS reflect the weighted-average effect of all potentially dilutive securities outstanding during the periods. Diluted EPS include the incremental effect of the employee stock purchase plan, restricted stock units, and stock options calculated using the treasury stock method. For the years ended December 31, 2014, 2013, and 2012, 0 shares, 9,266 shares and 139,728, shares, respectively, were not included in diluted EPS due to their anti-dilutive effects.
52
ENGILITY HOLDINGS, INC.
NOTES TO CONSOLIDATED AND COMBINED FINANCIAL STATEMENTS
(amounts in thousands except per share data or where specified)
Year Ended December 31, | |||||||||||
2014 | 2013 | 2012 | |||||||||
Net income (loss) attributable to Engility from continuing operations less non-controlling interest | $ | 35,423 | $ | 49,527 | $ | (349,747 | ) | ||||
Net loss attributable to Engility from discontinued operations | $ | — | $ | — | $ | (626 | ) | ||||
Net income (loss) attributable to Engility | $ | 35,423 | $ | 49,527 | $ | (350,373 | ) | ||||
Weighted average number of shares outstanding (in thousands)—Basic | 17,100 | 16,873 | 16,281 | ||||||||
Dilutive effect of share-based compensation outstanding after application of the treasury stock method | 918 | 780 | — | ||||||||
Weighted average number of shares outstanding (in thousands)—Diluted | 18,018 | 17,653 | 16,281 | ||||||||
Earnings (loss) per share attributable to Engility—basic | |||||||||||
Net income (loss) per share from continuing operations less non-controlling interest | $ | 2.07 | $ | 2.94 | $ | (21.48 | ) | ||||
Net income (loss) per share from discontinued operations | $ | — | $ | — | $ | (0.04 | ) | ||||
Net income (loss) per share attributable to Engility | $ | 2.07 | $ | 2.94 | $ | (21.52 | ) | ||||
Earnings (loss) per share attributable to Engility—diluted | |||||||||||
Net income (loss) per share from continuing operations less non-controlling interest | $ | 1.97 | $ | 2.81 | $ | (21.48 | ) | ||||
Net income (loss) per share from discontinued operations | $ | — | $ | — | $ | (0.04 | ) | ||||
Net income (loss) per share attributable to Engility | $ | 1.97 | $ | 2.81 | $ | (21.52 | ) | ||||
2. | New Accounting Pronouncements |
In May 2014, the Financial Accounting Standards Board (FASB) issued Accounting Standards Update (ASU) No. 2014-09, Revenue from Contracts with Customers (Topic 606). ASU 2014-09 outlines a single comprehensive model for entities to use when accounting for revenue arising from contracts with customers and supersedes all current revenue recognition guidance, including industry-specific guidance. This new guidance is effective for annual reporting periods (including interim reporting periods within those periods) beginning after December 15, 2016; early adoption is not permitted. Entities have the option of using either a full retrospective or a modified approach to adopt the guidance. This update could impact the timing and amounts of revenue recognized. Currently, we are evaluating the effect that implementation of this update will have on our consolidated financial position and results of operations upon adoption.
In June 2014, the FASB issued ASU No. 2014-12, Compensation - Stock Compensation (Topic 718) - Accounting for Share-based Payments when Terms of an award Provide That a Performance Target Could be Achieved after the Requisite Service Period. The Amendments in ASU 2014-12 require that a performance target that affects vesting and that could be achieved after the requisite service period be treated as a performance condition. ASU 2014-12 is effective for interim and annual reporting periods beginning after December 15, 2015, with early adoption permitted. We do not expect this pronouncement to have a material impact on our financial statements.
In August 2014, the FASB issued ASU 2014-15, Presentation of Financial Statements - Going Concern (Subtopic 205-40): Disclosure of Uncertainties about an Entity’s Ability to Continue as a Going Concern. The guidance requires an entity to evaluate whether there are conditions or events, in the aggregate, that raise substantial doubt about the entity’s ability to continue as a going concern within one year after the date that the financial statements are issued (or within one year after the financial statements are available to be issued when applicable) and to provide related footnote disclosures in certain circumstances. The guidance is effective for the annual period ending after December 15, 2016, and for annual and interim periods thereafter. Early application is permitted. We do not believe the adoption of this guidance will have a significant impact on our consolidated financial statements.
53
ENGILITY HOLDINGS, INC.
NOTES TO CONSOLIDATED AND COMBINED FINANCIAL STATEMENTS
(amounts in thousands except per share data or where specified)
3. | Business Acquisition |
On January 31, 2014, we completed the acquisition of DRC pursuant to a definitive agreement dated December 20, 2013. We paid $11.50 per share for DRC, for an aggregate purchase price of approximately $207 million in cash (including the retirement of approximately $86 million of debt of DRC). As a result of the acquisition, DRC is now a wholly-owned subsidiary of Engility.
DRC is a leading provider of innovative management consulting, engineering, technical, information technology services and solutions to Federal and state governments. Founded in 1955 and headquartered in Andover, Massachusetts, DRC had approximately 1,100 employees located throughout the United States as of December 31, 2013.
We acquired DRC to create a stronger, more efficient organization to support our customers with a wider range of specialized technology and mission expertise. This acquisition is consistent with our strategy to expand our addressable market, customer base and capabilities. In addition, it increased our access to additional key contract vehicles, added scale to our business and further diversified our revenue base.
The final allocation of purchase price is as follows:
Cash consideration | $ | 207,250 | |
Receivables | $ | 43,246 | |
Other current assets | 2,135 | ||
Property, plant and equipment | 8,604 | ||
Other assets | 5,985 | ||
Accounts payable, trade | (15,436 | ) | |
Accrued employment costs | (16,845 | ) | |
Accrued expenses | (4,735 | ) | |
Advance payments and billings in excess of costs incurred | (309 | ) | |
Deferred income taxes, current and income taxes payable | 1,208 | ||
Other current liabilities | (4,041 | ) | |
Income tax payable | (800 | ) | |
Other long-term liabilities | (24,912 | ) | |
Identifiable intangible assets | 46,200 | ||
Goodwill | 166,950 | ||
$ | 207,250 | ||
The goodwill arising from the DRC acquisition consists largely of the specialized nature of the workforce as well as the synergies and economies of scale expected from combining the operations of Engility and DRC and its subsidiaries. The goodwill arising from the DRC acquisition is not tax deductible.
The valuation of the identified intangible assets acquired is summarized below:
Useful Life (years) | |||||
Customer contractual relationships | 16 | $ | 42,100 | ||
Contractual backlog | 1 | 4,100 | |||
Total intangible assets | $ | 46,200 | |||
From the date of acquisition through December 31, 2014 , DRC generated $218 million of revenue and pre-tax net income of $9.4 million. DRC's pre-tax net income includes the impact of $6.2 million of amortization of customer contracts and customer relationships, as well as $8.0 million in expenses associated with severance and integration-related costs. Engility incurred expenses of approximately $0.9 million and $0.3 million to acquire DRC during the years ended December 31, 2013 and 2014, respectively, which were included in selling, general and administrative expenses. DRC’s pre-tax net income does not include the impact of acquisition-related expenses incurred by Engility.
54
ENGILITY HOLDINGS, INC.
NOTES TO CONSOLIDATED AND COMBINED FINANCIAL STATEMENTS
(amounts in thousands except per share data or where specified)
The following pro forma results of operations have been prepared as though the acquisition of DRC had occurred on January 1, 2013. These pro forma results include adjustments for (1) interest expense and amortization of deferred financing costs on the term loan used to finance the transaction, (2) amortization expense for the identifiable intangible asset determined in the preliminary independent appraisal, (3) the removal of historical DRC amortization and interest expense, and (4) the effect of income taxes on these adjustments. This pro forma information does not purport to be indicative of the results of operations that would have been attained had the acquisition been made as of January 1, 2013, or of results of operations that may occur in the future.
Year Ended December 31, | |||||||
2014 | 2013 | ||||||
(Unaudited) | |||||||
Revenue | $ | 1,387,966 | $ | 1,681,159 | |||
Net income attributable to Engility | $ | 36,579 | $ | 47,649 | |||
Earnings per share attributable to Engility | |||||||
Basic | $ | 2.14 | $ | 2.82 | |||
Diluted | $ | 2.03 | $ | 2.70 | |||
4. Receivables
Our receivables principally relate to contracts with the U.S. government and prime contractors or subcontractors of the U.S. government. Revenue from the U.S. government under prime contracts and subcontracts, as compared to total revenue, was approximately 98%, 98%, and 99% for the years ended December 31, 2014, 2013 and 2012, respectively. The components of contract receivables are presented in the table below.
December 31, | |||||||
2014 | 2013 | ||||||
Billed receivables | $ | 115,500 | $ | 126,041 | |||
Unbilled receivables | 172,385 | 161,641 | |||||
Allowance for doubtful accounts | (1,482 | ) | (1,410 | ) | |||
Total receivables, net | $ | 286,403 | $ | 286,272 | |||
Unbilled receivables principally consist of amounts to be billed within the next month, generally from cost-plus type contracts and time-and-material type contracts due to the timing of preparation of invoices to customers. Revenue recorded in excess of milestone billings on fixed-price type contracts consist of amounts not expected to be billed within the next month. Such amounts are converted to billed receivables when invoiced to customers according to contractual billing terms, which generally occur when performance milestones are completed. We believe that significantly all of the unbilled contract receivables at December 31, 2014 will be billed and collected within one year.
We do not believe that we have significant exposure to credit risk as accounts receivable and the related unbilled amounts are due primarily from the U.S. government. The Company has credit risk with respect to non-U.S. Government customers which comprise less than 5% of total receivables. The allowance for doubtful accounts primarily represents our estimate for exposure to compliance, contractual issues and bad debts related to prime contractors and commercial customers.
The following table details the Allowance for Doubtful Accounts for the years ended December 31, 2014, 2013 and 2012:
Year ended December 31, | |||||||||||
2014 | 2013 | 2012 | |||||||||
Balance at beginning of year | $ | 1,410 | $ | 4,054 | $ | 2,393 | |||||
Change to due to discontinued operations | — | — | (210 | ) | |||||||
Charged to expense | 441 | 563 | 2,573 | ||||||||
Deductions | (369 | ) | (3,207 | ) | (702 | ) | |||||
Balance at end of year | $ | 1,482 | $ | 1,410 | $ | 4,054 | |||||
55
ENGILITY HOLDINGS, INC.
NOTES TO CONSOLIDATED AND COMBINED FINANCIAL STATEMENTS
(amounts in thousands except per share data or where specified)
5. Goodwill and Identifiable Intangible Assets
Goodwill Impairment Review
We review goodwill for impairment annually as of November 30 and whenever events or changes in circumstances indicate that the carrying amount may not be recoverable using a two-step process for each reporting unit.
The first step in the process is to identify any potential impairment by comparing the carrying value of a reporting unit including goodwill and its fair value. We use a hybrid method valuation approach to determine the fair value of our reporting units which includes (1) the Income Approach (also referred to as a discounted cash flow or DCF), which is dependent upon estimates for future revenue, operating income, depreciation and amortization, income tax payments, working capital changes, and capital expenditures, as well as, expected long-term growth rates for cash flows; (2) the Guideline Public Company Method, which uses valuation metrics from similar publicly traded companies (i.e., small-to-mid-cap providers of services to the U.S. Federal and local governments); and (3) the Guideline Transaction Method which uses valuation multiples from actual transactions in the Aerospace and Defense industry. All of these approaches are affected by economic conditions related to the U.S. defense industry, as well as, conditions in the U.S. capital markets. If a potential impairment is identified, the second step is to measure the impairment loss by comparing the implied fair value of goodwill with the carrying value of goodwill of the reporting unit.
The fair value measurement was calculated using unobservable inputs to the discounted cash flow method, which are classified as Level 3 within the fair value hierarchy under U.S. GAAP. The key assumptions we used to estimate the fair values of our reporting units are:
• | Discount rates; |
• | Compounded annual revenue growth rates; |
• | Average operating margins; and |
• | Terminal value capitalization rate (capitalization rate). |
• | Guideline Company valuations |
• | Guideline Transactions |
Of the key assumptions, the discount rates and the capitalization rate are market-driven. These rates are derived from the use of market data and employment of the capital asset pricing model. The company-dependent key assumptions are the compounded annual revenue growth rates and the average operating margins and are subject to much greater influence from our actions. We used discount rates that are commensurate with the risk and uncertainty inherent in the respective reporting units and in our internally-developed forecasts. Actual results may differ from those assumed in our forecasts and changes in assumptions or estimates could materially affect the determination of the fair value of a reporting unit, and therefore could affect the amount of potential impairment.
We validate our estimate of the fair value of each reporting unit under the income approach by comparing the resulting values to fair value estimates using a market approach.
Inherent in our development of the present value of future cash flow projections are assumptions and estimates derived from a review of our expected revenue growth rates, profit margins, business plans, cost of capital, and tax rates. We also make assumptions about future market conditions, market prices, interest rates, and changes in business strategies. Changes in our assumptions or estimates could materially affect the determination of the fair value of a reporting unit and, therefore, could eliminate the excess of fair value over the carrying value of a reporting unit entirely and, in some cases, could result in impairment. Such changes in assumptions could be caused by a loss of one or more significant contracts, reductions in government and/or private industry spending, or a decline in the demand of our services due to changing economic conditions. Given the contractual nature of our business, if we are unable to win or renew contracts; are unable to estimate and control our contract costs; fail to perform adequately to our clients’ expectations; fail to procure third-party subcontractors, or fail to secure adequate funding for our projects, our profits, revenue and growth over the long-term would decline and such a decline could significantly affect the fair value assessment of our reporting units and cause our goodwill to become impaired.
To determine fair value as of November 30, 2014 and 2013, we used the Income Approach, Guideline Public Company Method and the Guideline Transaction Method weighted 50%, 50%, and 0%, respectively. The three methods returned value indications that were supportive of one another and corroborative of the value conclusion. For the November 30, 2013
56
ENGILITY HOLDINGS, INC.
NOTES TO CONSOLIDATED AND COMBINED FINANCIAL STATEMENTS
(amounts in thousands except per share data or where specified)
measurement, we determined to eliminate the results of the Guideline Transaction Method result as the companies were less comparable to ours.
In connection with the preparation of our third quarter financial statements, we conducted an interim test of our goodwill as of September 28, 2012. Our decision to conduct this review was a result of multiple events following the spin-off, including the change in our cost of capital as a stand-alone company.
In performing our analysis to determine fair value we applied the same weightings used in our 2012 impairment analysis, which resulted in a higher fair value than those used in our determination of fair value in 2013. To determine fair value as of November 30, 2012 and September 28, 2012, we used the Income Approach, Guideline Public Company Method and the Guideline Transaction Method weighted 75%, 12.5%, and 12.5%, respectively.
Since the completion of the Realignment on January 1, 2013, our chief executive and chief operating decision maker, Mr. Smeraglinolo only receives and evaluates consolidated financial information in order to allocate resources and assess performance. As a result, we determined that we have a single operating and reportable segment and consequently do not aggregate any operating segments. Prior to our strategic realignment, we had five reporting units.
2014 and 2013 Goodwill Measurement
The more significant assumptions used in our DCF valuation to determine the fair value of our reporting unit in connection with the goodwill valuation assessment at November 30, 2014 and 2013 were: (1) detailed three-year cash flow projections for our reporting unit, which are based primarily on our estimates of future revenue, operating income and cash flows, (2) an expected long-term growth rate for our reporting unit, which reflects the expected long-term growth rate for the U.S. economy and respective areas of the U.S. defense industry in which our reporting units operate and (3) risk adjusted discount rates, which represents the estimated weighted-average cost of capital (WACC) for the reporting unit and includes the estimated risk-free rate of return that is used to discount future cash flow projections to their present values.
The reporting unit WACC was comprised of: (1) an estimated required rate of return on equity based on publicly traded companies with business and economic risk characteristics comparable to our reporting unit (Market Participants) and (2) an after-tax rate of return on Market Participants’ debt, each weighted by the relative percentages of Market Participants’ equity and debt. The WACC is based on a number of market inputs that are outside of our control and are updated annually to reflect changes to such market inputs as of the date of our annual goodwill impairment assessments, including changes to: (1) the estimated required rate of return on equity based on historical returns on common stock securities of Market Participants and the Standard & Poor’s 500 Index (referred to as beta), (2) the risk free rate of return based on the prevailing market yield on the 20-year U.S. Treasury bond, (3) the Moody’s 20 year Baa rate, and (4) the relative percentages of Market Participants’ equity and debt.
We consistently consider several factors to determine expected future annual cash flows for our reporting unit, including historical multi-year average cash flow trends and the expected future cash flow growth rates primarily based on our estimates of future revenue, operating income, and working capital changes. Furthermore, the majority of our reporting unit is primarily dependent upon the DoD budget and spending. We closely monitor changes in these factors and their impact on the expected cash flow of our reporting units.
Our DCF valuation is dependent upon several assumptions and is subject to uncertainties due to uncontrollable events, including future DoD budgets, U.S. government spending priorities for services and general economic conditions. A change in any one or combination of the assumptions used in our DCF valuation could negatively impact the fair value, resulting in additional goodwill impairments.
For the November 30, 2014 and 2013 goodwill impairment tests the long-term growth rate developed by management for purposes of our goodwill impairment analysis was 3% and 4%, respectively, and the weighted average cost of capital (WACC) used was 10% for both periods. The long term growth rate was evaluated considering the discrete projection period and long-term industry and economic factors. For the November 30, 2014 and 2013 goodwill impairment tests, fair value exceeded book value by 107% and 66%, respectively. For the November 30, 2014 and 2013 goodwill impairment tests, a 1% change in the long-term growth rate would change fair value of the reporting unit by approximately $96 million and $67 million, respectively. For the November 30, 2014 and 2013 goodwill impairment tests, a 1% change in the WACC would change fair value of the reporting unit by approximately $131 million and $95 million, respectively.
2012 Goodwill Measurement
We determined our reporting units based on each division of our operating segments. Each division represented a business, which had discrete financial information available, whose operating results were regularly reviewed by division
57
ENGILITY HOLDINGS, INC.
NOTES TO CONSOLIDATED AND COMBINED FINANCIAL STATEMENTS
(amounts in thousands except per share data or where specified)
management. In connection with the preparation of our third quarter financial statements, we conducted an interim test of our goodwill as of September 28, 2012. Our decision to conduct this review was a result of multiple events following the spin-off, including the change in our cost of capital as a stand-alone company.
For the November 30, 2012 and September 28, 2012 measurement dates, the aggregate long-term growth rate developed by management for purposes of our goodwill impairment analysis was 2% for both periods and the WACC used was 16% for both periods. The long term growth rate was evaluated considering the discrete projection period and long-term industry and economic factors. Following this review, we recorded a goodwill impairment charge of approximately $426 million for the quarterly period ended September 28, 2012 due to a decline in the estimated fair value of four reporting units. The remaining reporting units, LOTS, had no goodwill recorded in its carrying value. We also performed our annual goodwill impairment review of our reporting units as of November 30, 2012. Following this annual review, we concluded that the carrying amounts of the reporting units’ goodwill were not impaired as of November 30, 2012.
The 2012 goodwill impairment charge of $426 million was due to a decline in the estimated fair value of each reporting unit. The decline in fair value was primarily due to a change in the discount rate from the prior year and the elimination of a potential tax structure from our business unit valuation model, which increased the fair value of our reporting units in prior years. The change in the discount rate from 7.1% to 15.0% or 16.5% depending on the reporting unit was due to our increased costs as a stand-alone company compared to L-3. Our prior year assessment of goodwill as of November 30, 2011 included the fair value of a potential tax structure, which assumed that each reporting unit could be sold as a separate asset. There are substantial tax savings available to a purchaser for an asset sale as opposed to the purchaser of an entire entity by stock purchase or merger. As a result of our strategic realignment announced in September 2012 and implemented during the first quarter of 2013, Engility began operating as a single company going and we no longer include the fair value of this potential tax structure. Accordingly, our assessment of goodwill does not use the estimated tax savings from a potential asset sale to increase the fair value of the reporting units.
The changes in the carrying amounts of goodwill during fiscal years 2014, 2013, and 2012 were as follows (in thousands):
Balance as of December 31, 2011 | $ | 904,040 | |
Goodwill impairment charge | (426,436 | ) | |
Balance as of December 31, 2012 | 477,604 | ||
Balance as of December 31, 2013 | 477,604 | ||
DRC acquisition | 166,950 | ||
Balance as of December 31, 2014 | $ | 644,554 | |
Information on our identifiable intangible assets that are subject to amortization is presented in the table below.
December 31, | |||||||||||||||||||||||||
2014 | 2013 | ||||||||||||||||||||||||
Weighted Average Amortization Period | Gross Carrying Amount | Accumulated Amortization | Net Carrying Amount | Gross Carrying Amount | Accumulated Amortization | Net Carrying Amount | |||||||||||||||||||
(in years) | |||||||||||||||||||||||||
Customer contractual relationships | 28 | $ | 220,730 | $ | 97,523 | $ | 123,207 | $ | 178,630 | $ | 86,436 | $ | 92,194 | ||||||||||||
Favorable leasehold interests | 4 | 1,827 | 1,827 | — | 1,827 | 1,816 | 11 | ||||||||||||||||||
Contractual backlog | 1 | 4,100 | 3,758 | 342 | — | — | — | ||||||||||||||||||
Total | $ | 226,657 | $ | 103,108 | $ | 123,549 | $ | 180,457 | $ | 88,252 | $ | 92,205 | |||||||||||||
Identifiable Intangible Assets
Our recorded amortization expense for our identifiable intangible assets is presented in the table below.
58
ENGILITY HOLDINGS, INC.
NOTES TO CONSOLIDATED AND COMBINED FINANCIAL STATEMENTS
(amounts in thousands except per share data or where specified)
Year Ended December 31, | |||||||||||
2014 | 2013 | 2012 | |||||||||
Amortization expense | $ | 14,856 | $ | 8,723 | $ | 13,106 | |||||
Based on gross carrying amounts at December 31, 2014, our estimate of amortization expense for identifiable intangible assets for the years ending December 31, 2015 through 2019 are presented in the table below.
Year Ended December 31, | |||||||||||||||||||
2019 | 2018 | 2017 | 2016 | 2015 | |||||||||||||||
Amortization expense | $ | 10,295 | $ | 10,295 | $ | 10,295 | $ | 10,833 | $ | 11,550 | |||||||||
6. Property, Plant and Equipment
December 31, | |||||||
2014 | 2013 | ||||||
Land | $ | 2,200 | $ | 2,200 | |||
Buildings and improvements | 5,652 | 2,766 | |||||
Machinery, equipment, furniture and fixtures | 27,900 | 29,512 | |||||
Leasehold improvements | 12,930 | 10,383 | |||||
Gross property, plant and equipment | 48,682 | 44,861 | |||||
Accumulated depreciation and amortization | (28,843 | ) | (32,966 | ) | |||
Property, plant and equipment, net | $ | 19,839 | $ | 11,895 | |||
Year Ended December 31, | |||||||||||
2014 | 2013 | 2012 | |||||||||
Depreciation expense | $ | 6,097 | $ | 3,382 | $ | 3,233 | |||||
7. Related Party Transactions and Prior Parent Company Investment
Allocation of Corporate Expenses: Prior to the Spin-Off, the Combined Statements of Operations include L-3 corporate expense allocations for corporate functions provided to the Company, which are reported within selling, general and administrative expenses, totaling $15 million for the year ended December 31, 2012. The remaining corporate allocations of $22 million for the year ended December 31, 2012 represent direct corporate expenses. Direct corporate expenses include employee benefits, share-based compensation, insurance, and treasury expenses that have been allocated based on direct usage by the Company.
Related Party Revenue and Cost of Revenue: Prior to the Spin-Off, we were a party to transactions to purchase and sell products and services to and from other L-3 subsidiaries and divisions. Revenue earned from these formerly affiliated entities was $100 million for the year ended December 31, 2012.
Prior Parent Company Investment: Net transfers to prior parent company are included within prior parent company investment on the Consolidated and Combined Statements of Changes in Stockholders' Equity. The components of our net transfers to prior parent company are presented in the table below.
Year Ended December 31, 2012 | |||
Intercompany revenue and purchases, net | $ | (90,915 | ) |
Cash pooling and general financing activities | 40,624 | ||
Corporate allocations | 37,748 | ||
Income taxes | 33,282 | ||
Net transfers related to GSS | (25,974 | ) | |
Total net transfers to prior parent company | $ | (5,235 | ) |
59
ENGILITY HOLDINGS, INC.
NOTES TO CONSOLIDATED AND COMBINED FINANCIAL STATEMENTS
(amounts in thousands except per share data or where specified)
8. Income Taxes
Prior to the Spin-Off, our operations were historically included in L-3’s U.S. Federal and state income tax returns. Income taxes are presented in these Combined Financial Statements as if we filed our own tax returns on a standalone basis. These amounts may not reflect tax positions taken or to be taken by L-3, and have been available for use by L-3 and may remain with L-3 after the separation from L-3. Following the Spin-Off, we file our tax returns as a stand-alone entity.
Income from continuing operations before income taxes is summarized in the table below.
Year Ended December 31, | |||||||||||
2014 | 2013 | 2012 | |||||||||
Domestic | $ | 70,267 | $ | 86,892 | $ | (340,613 | ) | ||||
Foreign | 380 | 409 | 974 | ||||||||
Income (loss) from continuing operations before income taxes | $ | 70,647 | $ | 87,301 | $ | (339,639 | ) | ||||
The components of our current and deferred portions of the provision for income taxes from continuing operations are presented in the table below.
Year Ended December 31, | |||||||||||
2014 | 2013 | 2012 | |||||||||
Current income tax provision: | |||||||||||
Federal | $ | 22,111 | $ | 30,262 | $ | 39,096 | |||||
State and local | 4,462 | 4,252 | 6,014 | ||||||||
Foreign | (592 | ) | 2,156 | 292 | |||||||
Subtotal | 25,981 | 36,670 | 45,402 | ||||||||
Deferred income tax provision (benefit) : | |||||||||||
Federal | 3,785 | (3,475 | ) | (34,918 | ) | ||||||
State and local | 871 | (611 | ) | (5,328 | ) | ||||||
Subtotal | 4,656 | (4,086 | ) | (40,246 | ) | ||||||
Total provision for income taxes | $ | 30,637 | $ | 32,584 | $ | 5,156 | |||||
A reconciliation of the statutory Federal income tax rate to our effective income tax rate from continuing operations is presented in the table below.
Year Ended December 31, | ||||||||
2014 | 2013 | 2012 | ||||||
Statutory Federal income tax rate | 35.0 | % | 35.0 | % | 35.0 | % | ||
State and local income taxes, net of Federal income tax benefit | 4.9 | 2.8 | 3.3 | |||||
Goodwill impairment | — | — | (38.9 | ) | ||||
Minority interest | (2.3 | ) | (2.1 | ) | (0.5 | ) | ||
Non-deductible acquisition costs | 3.7 | 0.2 | (0.7 | ) | ||||
Uncertain tax positions | 2.6 | 0.2 | (0.6 | ) | ||||
Other, net | (0.5 | ) | 1.2 | 0.9 | ||||
Effective income tax rate | 43.4 | % | 37.3 | % | (1.5 | )% | ||
60
ENGILITY HOLDINGS, INC.
NOTES TO CONSOLIDATED AND COMBINED FINANCIAL STATEMENTS
(amounts in thousands except per share data or where specified)
The significant components of our deferred tax assets and liabilities are presented in the table below. Our acquisition of DRC on January 31, 2014 resulted in a change in ownership under IRC section 382. Accordingly, the annual utilization of the DRC net operating loss on our consolidated Federal return is limited to $4.2 million annually. These net operating losses were generated during the 2014 pre-acquisition short tax year and will expire in 2034. Due to the large value of the limitation relative to the amount of remaining net operating losses, we anticipate full utilization of these losses.
December 31, | |||||||
2014 | 2013 | ||||||
Deferred tax assets: | |||||||
Compensation and benefits | $ | 15,660 | $ | 16,102 | |||
Unrecognized tax benefits | 37,695 | 36,447 | |||||
Fixed assets | — | 1,225 | |||||
Deferred revenue | 8,759 | 7,351 | |||||
Reserves | 9,409 | 9,893 | |||||
Pension | 11,011 | — | |||||
Net operating losses | 4,657 | — | |||||
Other | 8,931 | 6,261 | |||||
Gross deferred tax assets | $ | 96,122 | $ | 77,279 | |||
Deferred tax liabilities: | |||||||
Goodwill and other intangible assets | $ | 59,363 | $ | 45,835 | |||
Income recognition on contracts in process | 35,549 | 37,739 | |||||
Other | 3,332 | 1,499 | |||||
Gross deferred tax liabilities | $ | 98,244 | $ | 85,073 | |||
The following table presents the classification of our net deferred tax liabilities.
December 31, | |||||||
2014 | 2013 | ||||||
Current net deferred tax liabilities | $ | (6,928 | ) | $ | (9,933 | ) | |
Non-current net deferred tax liabilities | 4,806 | 2,139 | |||||
Total net deferred tax liabilities | $ | (2,122 | ) | $ | (7,794 | ) | |
As of December 31, 2014, the total amount of unrecognized tax benefits, including interest and penalty, was $80 million, $20 million which would significantly reduce the effective income tax rate, if recognized. A reconciliation of the change in unrecognized income tax benefits, excluding potential interest and penalties, is presented in the table below.
Year Ended December 31, | |||||||||||
2014 | 2013 | 2012 | |||||||||
Balance at January 1 | $ | 67,559 | $ | 58,973 | $ | 50,417 | |||||
Additions/reductions for tax positions related to the current year | 890 | (123 | ) | 1,240 | |||||||
Additions/reductions for tax positions related to prior years | 51 | 44,525 | 7,889 | ||||||||
Decrease for settlement with tax authorities | — | (1,033 | ) | — | |||||||
Lapse of statute of limitations | (573 | ) | (34,783 | ) | (573 | ) | |||||
Balance at December 31 | $ | 67,927 | $ | 67,559 | $ | 58,973 | |||||
We and our subsidiaries filed income tax returns in various state and foreign jurisdictions. The statutes of limitations for our U.S. Federal income tax returns for the years ended December 31, 2012 and December 31, 2013 were open as of December 31, 2014. The statute of limitations for the L-3’s U.S. Federal income tax returns for the years ended December 31, 2010 through 2012 were open as of December 31, 2014. The statute of limitations for our foreign income tax returns were open for
61
ENGILITY HOLDINGS, INC.
NOTES TO CONSOLIDATED AND COMBINED FINANCIAL STATEMENTS
(amounts in thousands except per share data or where specified)
tax years 2006 to 2013 and for our state income tax returns for years 2009 to 2013. The statute of limitations for DRC's U.S. Federal and state income tax returns for the years ended December 31, 2011 through December 31, 2013 were open as of December 31, 2014. As of December 31, 2014, we anticipate that uncertain tax positions will decrease by approximately $3.7 million over the next 12 months due to potential resolution of uncertain tax positions involving several jurisdictions and closing of tax statutes. The actual amount could vary significantly depending on the ultimate timing and nature of any settlements.
As of December 31, 2014 and 2013, non-current income taxes payable included accrued potential interest of $11.8 million and $9.9 million, respectively. With respect to the interest related items, our income tax expense included an expense of $1.9 million, $0.2 million and $1.9 million for the years ended December 31, 2014, 2013, and 2012, respectively.
9. Share-Based Compensation
Long Term Performance Plan
Following the Spin-Off, certain of our employees participate in our 2012 Long Term Performance Plan (2012 LTPP), which is substantially similar to the L-3 2008 Long Term Performance Plan (2008 LTPP). Immediately prior to the Spin-Off, certain of our employees participated in the following L-3 share-based compensation plans: 2008 LTPP, 1999 Long Term Performance Plan and 1997 Stock Option Plan (collectively, the L-3 Plans). Following our Spin-Off from L-3, we assumed under the 2012 LTPP each outstanding option to purchase L-3 common stock and each L-3 Restricted Stock Unit (RSU) held by our employees.
In connection with the Spin-Off, we adopted a 2012 Directors Stock Incentive Plan (DSIP) that permitted us to make equity grants to the non-executive members of our Board of Directors.
During 2013, we amended and merged the 2012 LTPP and the DSIP into the Amended and Restated 2012 Long Term Performance Plan (the Amended 2012 LTPP).
Stock Options. The exercise price of Engility stock options granted under the Amended 2012 LTPP may not be less than the fair market value of Engility’s common stock on the date of grant. Options expire after 10 years from the date of grant and vest ratably over a three years period on the annual anniversary of the date of grant. All unvested options are subject to forfeiture upon termination of employment (subject to customary exceptions for death or disability). All of the stock option awards issued under the Plans are non-qualified stock options for U.S. income tax regulations.
Stock Option Fair Value Estimation Assumptions. The fair value of stock options was estimated at the date of the grant using the Black-Scholes option-pricing valuation model. The valuation model is affected by Engility’s stock price as well as weighted average assumptions for a number of subjective variables described below. For periods prior to the Spin-Off, the assumptions used L-3’s stock price and related data to value the options granted.
• | Expected Holding Period. The expected holding period of stock options granted represents the period of time that stock options granted are expected to be outstanding until they are exercised. The Company uses historical stock option exercise data to estimate the expected holding period. |
• | Expected Volatility. Expected volatility is based on Engility’s historical share price volatility matching the expected holding period. |
• | Expected Dividend Yield. Expected dividend yield is based on Engility’s anticipated dividend payments and historical pattern of dividend increases over the expected holding period. |
• | Risk-Free Interest Rate. The risk-free interest rates for stock options are based on U.S. Treasuries for a maturity matching the expected holding period. |
The table below presents a summary of our stock option activity changes for the year ended December 31, 2014.
62
ENGILITY HOLDINGS, INC.
NOTES TO CONSOLIDATED AND COMBINED FINANCIAL STATEMENTS
(amounts in thousands except per share data or where specified)
Number of Options | Weighted- Average Exercise Price per Share | Remaining Contractual Term (in years) | Aggregate Intrinsic Value | |||||||||
Outstanding at December 31, 2013 | 125 | $ | 17.63 | 4.7 | $ | 4,171 | ||||||
Granted | — | — | ||||||||||
Forfeited | — | — | ||||||||||
Exercised | (82 | ) | 18.03 | |||||||||
Outstanding at December 31, 2014 | 43 | $ | 16.86 | 6.8 | $ | 1,109 | ||||||
Vested and expected to vest at December 31, 2014 | 43 | $ | 16.86 | 6.8 | $ | 1,109 | ||||||
Exercisable at December 31, 2014 | 29 | $ | 16.87 | 6.6 | $ | 762 | ||||||
Restricted Stock Units: During the year ended December 31, 2014, we granted 74,086 RSUs to certain of our employees with a grant date fair value of $44.33. 68,633 of these RSUs vest ratably over a term of three years from the grant date, 25% on the first anniversary of the grant date, 25% on the second anniversary of the grant date and 50% on the third anniversary of the grant date. 1,217 of these RSUs cliff vest on the third anniversary of the grant date. 4,236 of these RSUs, which were only provided to non-executive employees, cliff vest on the first anniversary of the grant date. These RSUs automatically convert into shares of Engility common stock upon vesting, and are subject to forfeiture until certain restrictions have lapsed.
During the year ended December 31, 2014, we granted 11,790 RSUs to the non-management members of our Board of Directors with a grant date fair value of $38.16 per share. These RSUs vest after one year from the grant date, but will not be converted to shares of Engility common stock until the earlier of (i) the date on which the person ceases to be a director of the company or (ii) a change of control of the Company.
The table below presents a summary of our nonvested RSU awards under the Amended 2012 LTPP as of December 31, 2014 and changes for the year then ended.
Number of Units | Weighted-Average Grant Date Fair Value | |||||
Nonvested balance at December 31, 2013 | 736 | $ | 18.94 | |||
Granted | 86 | 43.21 | ||||
Forfeited | (49 | ) | 26.89 | |||
Vested | (167 | ) | 20.42 | |||
Nonvested balance at December 31, 2014 | 606 | 22.11 | ||||
Director RSUs vested but not issued at December 31, 2014 | 44 | 20.47 | ||||
Performance Shares: Performance shares are grants of restricted stock that generally cliff vest after three years based on our performance at the end of the three-year period calendar year beginning the year of grant. The number of shares of our common stock that are ultimately vested and delivered in respect of these performance shares will range from 0% to 200% of the target amount depending on the Company’s performance against a peer group, as approved by the Compensation Committee of the Board of Directors, based on the following two metrics, each of which are weighted equally: relative revenue (based on a compounded annual growth rate) and relative total stockholder return (TSR). TSR is calculated as growth in share price plus accumulated dividends. No shares will vest or be delivered to holders of performance shares, including with respect to relative revenue, if we do not achieve at least the threshold level of performance for TSR.
Compensation expense for performance shares is based on the fair value of the shares at the grant date. Fair value is determined on a binomial valuation technique (the Monte Carlo valuation model) and recognized on a straight-line basis over the requisite service period for both the relative revenue metric and the relative TSR metric. Compensation expense related to the relative revenue metric is adjusted each reporting period based on management’s estimate of probability of achievement.
63
ENGILITY HOLDINGS, INC.
NOTES TO CONSOLIDATED AND COMBINED FINANCIAL STATEMENTS
(amounts in thousands except per share data or where specified)
Number of Shares | Weighted-Average Grant Date Fair Value | |||||
Nonvested balance at December 31, 2013 | 138 | $ | 28.24 | |||
Granted | 103 | 56.14 | ||||
Forfeited | (24 | ) | 43.20 | |||
Vested | — | — | ||||
Nonvested balance at December 31, 2014 | 217 | $ | 39.46 | |||
Employee Stock Purchase Plan
Effective July 17, 2012, we adopted the 2012 Employee Stock Purchase Plan (2012 ESPP). Under the 2012 ESPP, eligible employees are offered options to purchase shares of our common stock at the end of each six-month offering period at 95% of fair market value based on the average of the highest and lowest sales prices for our stock on the purchase date. Eligible employees generally include all employees of Engility. Offering periods begin on the first trading day in January and July of each calendar year and end on the last trading day in June and December of each calendar year. Share purchases are funded through payroll deductions of up to 10% of an employee’s eligible compensation for each payroll period, or $25,000 each calendar year. There were purchases of stock under the 2012 ESPP for 2014 in the amount of $1 million. During 2014 in conjunction with our acquisition of TASC (see note 16), we terminated the 2012 ESPP.
Share-based compensation expense is summarized in the table below.
2014 | 2013 | 2012 | |||||||||
Share-based compensation | $ | 8,470 | $ | 7,726 | $ | 3,547 | |||||
Income taxes | (3,453 | ) | (2,963 | ) | (3,684 | ) | |||||
Total after income taxes | $ | 5,017 | $ | 4,763 | $ | (137 | ) | ||||
As of December 31, 2014, there was $8.1 million of total unrecognized compensation cost of unvested stock compensation arrangements. This cost is expected to be fully amortized over the next three years, with $4.9 million, $2.5 million, and $0.7 million, amortized during 2015, 2016 and 2017, respectively. These future costs include an estimated forfeiture rate. Our stock compensation costs may differ based on actual experience. The cost of stock compensation is included in the Consolidated and Combined Statements of Operations before, or in conjunction with, the vesting of options.
10. Commitments and Contingencies
Non-Cancellable Operating Leases
We lease certain facilities and equipment under agreements expiring at various dates through 2020. Certain leases contain renewal options or escalation clauses providing for increased rental payments based upon maintenance, utility and tax increases. No lease agreement imposes a restriction on our ability to pay dividends, engage in debt or equity financing transactions, or enter into further lease agreements.
The following table presents future minimum payments under non-cancellable operating leases with initial or remaining terms in excess of one year at December 31, 2014.
Real Estate | Equipment | Total | |||||||||
2015 | $ | 25,984 | $ | 184 | $ | 26,168 | |||||
2016 | 22,608 | 64 | 22,672 | ||||||||
2017 | 17,805 | 10 | 17,815 | ||||||||
2018 | 11,136 | — | 11,136 | ||||||||
2019 | 6,326 | — | 6,326 | ||||||||
Thereafter | 7,174 | — | 7,174 | ||||||||
Total minimum payments required | 91,033 | 258 | 91,291 | ||||||||
Less: Sublease rentals under non-cancellable leases | 2,683 | — | 2,683 | ||||||||
Net minimum payments required | $ | 88,350 | $ | 258 | $ | 88,608 | |||||
64
ENGILITY HOLDINGS, INC.
NOTES TO CONSOLIDATED AND COMBINED FINANCIAL STATEMENTS
(amounts in thousands except per share data or where specified)
Year Ended December 31, | |||||||||||
2014 | 2013 | 2012 | |||||||||
Rent expense | $ | 23,812 | $ | 22,074 | $ | 23,005 | |||||
Letters of Credit
We enter into standby letters of credit with financial institutions covering performance and financial guarantees pursuant to contractual arrangements with certain customers. We had total outstanding letters of credit aggregating $3 million at December 31, 2014. These letters of credit may be drawn upon in the event of our nonperformance. The letters of credit reduce the borrowing capacity of our revolving line of credit dollar-for-dollar.
Procurement Regulations
A substantial majority of our revenue are generated from providing services and products under legally binding agreements or contracts with U.S. government and foreign government customers. U.S. government contracts are subject to extensive legal and regulatory requirements, and from time to time, agencies of the U.S. government investigate whether such contracts were and are being conducted in accordance with these requirements. Currently we are cooperating with the U.S. government on several investigations from which civil or administrative proceedings have or could result and give rise to fines, penalties, compensatory and treble damages, restitution and/or forfeitures. Currently, we do not anticipate that any of these investigations will have a material adverse effect, individually or in the aggregate, on our consolidated financial position, results of operations or cash flows. However, under U.S. government regulations, our indictment by a Federal grand jury, or an administrative finding against us as to our present responsibility to be a U.S. government contractor or subcontractor, could result in our being suspended for a period of time from eligibility for awards of new government contracts or task orders or in a loss of export privileges. A conviction, or an administrative finding against us that satisfies the requisite level of seriousness, could result in debarment from contracting with the U.S. government for a specified term. In addition, all of our U.S. government contracts: (1) are subject to audit and various pricing and cost controls, (2) include standard provisions for termination for the convenience of the U.S. government or for default, and (3) are subject to cancellation if funds for contracts become unavailable. Foreign government contracts generally include comparable provisions relating to terminations for convenience and default, as well as other procurement clauses relevant to the foreign government.
Litigation Matters
We are also subject to litigation, proceedings, claims or assessments and various contingent liabilities incidental to our businesses. Furthermore, in connection with certain business acquisitions, we have assumed some or all claims against, and liabilities of, such acquired businesses, including both asserted and unasserted claims and liabilities.
In accordance with the accounting standard for contingencies, we record a liability when management believes that it is both probable that a liability has been incurred and we can reasonably estimate the amount of the loss. Generally, the loss is recorded at the amount we expect to resolve the liability. The estimated amounts of liabilities recorded for pending and threatened litigation are recorded in other current liabilities in the Consolidated Balance Sheets. Amounts recoverable from insurance contracts or third parties are recorded as assets when deemed probable. At December 31, 2014, we did not record any amounts for recoveries from insurance contracts or third parties in connection with the amount of liabilities recorded for pending and threatened litigation. Legal defense costs are expensed as incurred. We believe that we have recorded adequate provisions for our litigation matters. We review these provisions quarterly and adjusts these provisions to reflect the impact of negotiations, settlements, rulings, advice of legal counsel and other information and events pertaining to a particular matter. Although we believe that we have valid defenses with respect to legal matters and investigations pending against us, the results of litigation can be difficult to predict, particularly those involving jury trials. Accordingly, our current judgment as to the likelihood of our loss (or our current estimate as to the potential range of loss, if applicable) with respect to any particular litigation matter may turn out to be wrong. Therefore, it is possible that our financial position, results of operations or cash flows could be materially adversely affected in any particular period by the unfavorable resolution of one or more of these or other contingencies.
65
ENGILITY HOLDINGS, INC.
NOTES TO CONSOLIDATED AND COMBINED FINANCIAL STATEMENTS
(amounts in thousands except per share data or where specified)
11. Employee Benefits
L-3 Employee Savings Plan. Prior to the Spin-Off, under the L-3 Communications Master Savings Plan (the L-3 Savings Plan), the Company’s participating employees were eligible to receive Company matching or other contributions, in the form of L-3 common stock or cash, up to designated levels. The extent and form of the Company contributions and the applicable vesting terms varied among the businesses that comprise Engility. Company contributions were paid to the plan in cash, and for those employees who receive contributions in the form of L-3 common stock, the plan purchased shares from L-3 at fair market value. The Company’s contributions under the L-3 Savings Plan were $8 million for the years ended December 31, 2012.
Engility Employee Savings Plan. In connection with the Spin-Off, we adopted the Engility Master Savings Plan (the Engility Savings Plan), which replaced and is substantially similar to the L-3 Savings Plan. As a result, following the Spin-Off, our employees were no longer eligible to participate in the L-3 Savings Plan. The Company contributions under the Engility Savings Plan were $0, $1 million and $5 million for the years ended December 31, 2014, 2013 and 2012, respectively.
Dynamics Research Corporation Deferred Savings Plan. DRC maintained a deferred savings plan (DRC Plan). All DRC employees were eligible to elect to defer a portion of their salary and contribute the deferred portion to the DRC Plan. The DRC Plan provides for a Company matching contribution for 100% of the first 2% of the employee contribution and an additional 50% of the next 4% of the employee contribution. The Company’s contributions are subject to forfeitures of any non-vested portion if termination occurs. The Company’s total 401(k) contributions were $3 million for the period January 31, 2014, the date of the DRC acquisition, to December 31, 2014. Effective January 1, 2015, the DRC plan was merged into the Engility Employee Savings Plan.
Defined Benefit Pension Plan. Upon the acquisition of DRC, we assumed DRC's Defined Benefit Pension Plan (the Pension Plan), which is non-contributory, covering substantially all employees of DRC who had completed a year of service prior to July 1, 2002. The balance of the Pension Plan liability was $17 million as of the acquisition. Membership in the Pension Plan was frozen effective July 1, 2002 and participants’ calculated pension benefit was frozen effective December 31, 2006.
Our funding policy is to contribute at least the minimum amount required by the Employee Retirement Income Security Act of 1974. Additional amounts are contributed to assure that plan assets will be adequate to provide retirement benefits. We expect to make contributions of $1 million during 2015 to fund the pension plan.
Net Periodic Pension Cost
For the period from January 31, 2014 to December 31, 2014 | |||
Interest cost | $ | 3,589 | |
Expected return on plan assets | (5,339 | ) | |
Recognized actuarial loss | — | ||
Net periodic pension benefit | $ | (1,750 | ) |
66
ENGILITY HOLDINGS, INC.
NOTES TO CONSOLIDATED AND COMBINED FINANCIAL STATEMENTS
(amounts in thousands except per share data or where specified)
Obligations and Funded Status
Change in benefit obligation: | |||
Benefit obligation on January 31, 2014 | $ | 89,519 | |
Interest cost | 3,589 | ||
Benefits paid | (4,637 | ) | |
Actuarial loss | 14,557 | ||
Benefit obligation at December 31, 2014 | 103,028 | ||
Change in plan assets: | |||
Fair value of plan assets at January 31, 2014 | 72,704 | ||
Actual return on plan assets | 5,097 | ||
Employer contributions | 1,883 | ||
Benefits paid | (4,637 | ) | |
Fair value of plan assets at December 31, 2014 | 75,047 | ||
Unfunded status | $ | (27,981 | ) |
Amounts recognized in the consolidated balance sheets consist of:
December 31, | |||
2014 | |||
Accrued compensation and employee benefits | $ | 1,415 | |
Other long-term liabilities | 26,566 | ||
Net amount recognized | $ | 27,981 | |
The projected benefit obligation for the Pension Plan was $103 million at December 31, 2014.
The reconciliation of the other comprehensive loss was as follows:
Beginning Balance | Amortization | Experience Loss | Ending Balance | ||||||||||||
2014 | $ | — | $ | — | $ | 14,800 | $ | 14,800 | |||||||
The amounts recognized in other comprehensive loss are reflected, net of related tax effects, as a component of accumulated other comprehensive loss as part of stockholders’ equity in the accompanying consolidated Balance Sheets. The Company expects to recognize amortization expense related to the net actuarial loss of approximately $0.2 million in 2015.
67
ENGILITY HOLDINGS, INC.
NOTES TO CONSOLIDATED AND COMBINED FINANCIAL STATEMENTS
(amounts in thousands except per share data or where specified)
Assumptions
The discount rate represents the estimated rate at which we could effectively settle our pension benefit obligations. In order to estimate this rate, future expected cash flows of the plan were matched against the Towers Watson RATE:Link yield curve to produce a single discount rate.
The assumed long-term rate of return on plan assets, which is the average return expected on the funds invested or to be invested to provide future benefits to pension plan participants, is determined by an annual review of historical plan assets returns and consultation with outside investment advisors. In selecting the expected long-term rate of return on assets, the Company considered its investment return goals stated in the Pension Plan’s investment policy. The Company, with input from the Pension Plan’s professional investment managers, also considered the average rate of earnings expected on the funds invested or to be invested to provide Pension Plan benefits. This process included determining expected returns for the various asset classes that comprise the Pension Plan’s target asset allocation.
The following assumptions were used to determine the benefit obligations and net periodic benefit costs:
December 31, | ||
2014 | ||
Used to determine benefit obligations: | ||
Discount rate | 3.94 | % |
Rate of compensation increase | N/A | |
Period Ended December 31, | ||
2014 | ||
Used to determine net periodic benefit costs: | ||
Discount rate | 4.49 | % |
Expected rate of return on assets | 8.15 | % |
Rate of compensation increase | N/A | |
Plan Assets
During 2014, the Company’s overall investment strategy for plan assets was to achieve a long-term rate of return of 8.15%, with a wide diversification of asset types, fund strategies and fund managers. The target allocation for the plan assets are 55% in equity securities, 38% in fixed income securities, 5% in other types of investments and 2% in cash and cash equivalents. The risk management practices include regular evaluations of fund managers to ensure the risk assumed is commensurate with the given investment style and objectives. Prohibited investments include, but are not limited to margin transactions. The Pension Plan’s assets did not include any of the Company’s common stock at December 31, 2014.
68
ENGILITY HOLDINGS, INC.
NOTES TO CONSOLIDATED AND COMBINED FINANCIAL STATEMENTS
(amounts in thousands except per share data or where specified)
The Company’s investment policy includes a periodic review of the Pension Plan’s investment in the various asset classes. The fair value measurement of the Company’s plan assets by asset category are as follows:
Quoted Prices in Active Markets for Identical Assets | Significant Other Observable Inputs | Significant Unobservable Inputs | ||||||||||||||
Asset Category | Total | (Level 1) | (Level 2) | (Level 3) | ||||||||||||
At December 31, 2014: | ||||||||||||||||
Cash | $ | 272 | $ | 272 | $ | — | $ | — | ||||||||
Money market funds | 2,190 | — | 2,190 | — | ||||||||||||
Equity securities: | ||||||||||||||||
Common equity securities | 10,059 | 10,059 | — | — | ||||||||||||
Preferred equity securities | 163 | 163 | — | — | ||||||||||||
Equity mutual funds | 29,623 | 29,623 | — | — | ||||||||||||
Real estate investment trusts | 2,671 | 2,671 | — | — | ||||||||||||
Corporate and foreign bonds | 21,743 | — | 21,743 | — | ||||||||||||
Other type of investments: | ||||||||||||||||
Managed futures | 1,884 | — | — | 1,884 | ||||||||||||
Hedge funds | 6,442 | — | — | 6,442 | ||||||||||||
Total | $ | 75,047 | $ | 42,788 | $ | 23,933 | $ | 8,326 | ||||||||
A reconciliation of the beginning and ending balances of Level 3 assets is as follows:
Fair Value Measurement Using Significant Unobservable Inputs (Level 3) | |||||||||||
Managed Futures | Hedge Fund(s) | Total | |||||||||
Balance at January 31, 2014 | $ | 1,655 | $ | 6,141 | $ | 7,796 | |||||
Actual returns on plan assets related to assets still held at the reporting date | 229 | 130 | 359 | ||||||||
Purchases | — | 171 | 171 | ||||||||
Sales | — | — | — | ||||||||
Balance at December 31, 2014 | $ | 1,884 | $ | 6,442 | $ | 8,326 | |||||
The managed futures consist of units of limited partnership interests through the allocation of assets of multiple commodity trading advisors. These commodity trading advisors engage in speculative trading in U.S. and international markets for currencies, interest rates, stock indices, agricultural and energy products, and precious base metals. The fair value of managed futures is estimated based on the investments net asset value at the reporting period as the fair value is not readily determinable and the investment fund meets the criteria of an investment company. Redemptions can only be made monthly and require ten days prior notice to the general partner of the fund.
The Company’s plan assets consist of interests in two hedge funds. One of the hedge funds is a fund of funds that combines diversified multi-strategy methods to achieve investment objectives during a three to five year investment cycle. Strategy methods may consist of conventional long-term equity and fixed income investments or derivative investments, including, total return swaps, options and forwards. The second hedge fund is a multi-strategy equity hedge fund with a focus on investment strategies that exploit market inefficiencies to produce absolute returns with low correlation to global capital markets. For both, the fair value of the hedge funds are estimated based on the investments net asset value at the reporting period as the fair value is not readily determinable and the investment fund meets the criteria of an investment company. Redemptions of the interests in both funds can be made quarterly based on the discretion of the investment company’s Board of Directors.
69
ENGILITY HOLDINGS, INC.
NOTES TO CONSOLIDATED AND COMBINED FINANCIAL STATEMENTS
(amounts in thousands except per share data or where specified)
Estimated Future Benefit Payments
The following table sets forth the expected timing of benefit payments:
Year ending December 31: | |||
2015 | $ | 4,802 | |
2016 | $ | 4,934 | |
2017 | $ | 5,115 | |
2018 | $ | 5,343 | |
2019 | $ | 5,565 | |
Five subsequent fiscal years | $ | 30,035 | |
Supplemental Executive Retirement Plan
Upon the acquisition of DRC, we assumed DRC's Supplemental Executive Retirement Plan (SERP) for certain former key employees providing for annual benefits commencing on the sixth anniversary of the executive's retirement. The cost of these benefits is being charged to expense and accrued using a projected unit credit method. Expenses related to this plan were approximately $0.1 million for the period from the date of acquisition, January 31, 2014, to December 31, 2014. The liability related to the SERP, which is unfunded, was $0.4 million as of December 31, 2014 . These amounts represent the amounts the Company estimates to be the present value of the obligation at each respective date.
12. Debt
2012 Credit Facility
In connection with our Spin-Off from L-3, on July 17, 2012, we entered into the 2012 Credit Facility, which provides for total aggregate borrowings of $400 million under a $335 million senior secured term loan facility and a $65 million senior secured revolving credit facility with Bank of America, N.A., as administrative agent, and the other lenders party thereto. On July 17, 2012, we borrowed $335 million under the 2012 Credit Facility term loan and paid $335 million as a cash dividend to L-3. We incurred $11 million in fees in establishing this credit facility.
Maturity, Interest Rate and Fees. The loans under the 2012 Credit Facility are due and payable on July 17, 2017 and bear interest at a rate per annum equal to an applicable margin, plus, at our option (other than with respect to swingline loans, which must be base rate loans), either (a) a base rate determined by reference to the highest of (1) the prime rate of Bank of America, N.A., (2) the Federal funds effective rate plus 0.5%, (3) a LIBOR rate determined by reference to the costs of funds for U.S. dollar deposits for an interest period of one month adjusted for certain additional costs which shall not be less than 1.25%, plus 1.00% and (4) 2.25% or (b) a LIBOR rate determined by reference to the costs of funds for U.S. dollar deposits for the interest period relevant to such borrowing adjusted for certain additional costs which shall be no less than 1.25%.
Amortization and Final Maturity. Beginning April 1, 2013, we were required to make scheduled quarterly payments equal to 3.75% of the original principal amount of the term loan, or approximately $12.6 million per quarter, with the balance to be due and payable on the fifth anniversary of the closing date, July 17, 2017. The 2012 Credit Facility was terminated and repaid in full upon entering the 2013 Credit Facility (as described below).
2013 Credit Facility
On August 9, 2013, we, through our wholly owned subsidiary, Engility Corporation, entered into a credit facility among the Company, Engility Corporation, Bank of America, N.A. (as administrative agent, swing line lender and letter of credit issuer) and each of the several lenders from time to time party thereto (the 2013 Credit Facility). The 2013 Credit Facility, which replaced the 2012 Credit Facility, provides for (1) a $200 million term loan facility maturing on August 9, 2018, and (2) a $250 million revolving credit facility that terminates on August 9, 2018, with a $50 million letter of credit sublimit and a $25 million swing line loan sublimit. The 2013 Credit Facility also contains an accordion feature that permits us to arrange with the lenders for the provision of up to $150 million in additional commitments. In conjunction with replacing our 2012 Credit Facility, we expensed $4 million in previously capitalized bank fees relating to the 2012 Credit Facility.
On January 31, 2014, we acquired DRC for total consideration of approximately $207 million (including the retirement of approximately $86 million of debt of DRC) as described in Note 3 to the accompanying Consolidated and Combined Financial Statements. We financed the DRC acquisition in part by drawing down on the $150 million Accordion under the 2013 Credit Facility, utilizing an incremental term loan of $75 million and an incremental revolving facility of $75 million. We amended the
70
ENGILITY HOLDINGS, INC.
NOTES TO CONSOLIDATED AND COMBINED FINANCIAL STATEMENTS
(amounts in thousands except per share data or where specified)
2013 Credit Facility on this same date to (i) provide for the incremental term loan and incremental revolving credit facility and (ii) replenish the $150 million availability under the Accordion. Pursuant to the amendment, the incremental term loan facility matures on August 9, 2018 and the incremental revolving credit facility terminates on August 9, 2018. The amendment did not change the interest rate under the 2013 Credit Facility.
Maturity, Interest Rate and Fees. All borrowings under the 2013 Credit Facility bear interest at a variable rate per annum equal to an applicable margin, plus, at our option (other than for swing line loans), either (1) a base rate determined by reference to the highest of (a) the prime rate of Bank of America, N.A., (b) the Federal funds effective rate plus 0.50% and (c) a LIBOR rate determined by reference to the cost of funds for U.S. dollar deposits for the interest period of one month plus 1.00% or (2) a LIBOR rate determined by reference to the costs of funds for U.S. dollar deposits for the interest period relevant to such borrowing. All swing line loans bear interest at a variable rate per annum equal to an applicable margin, plus a base rate determined as described in the immediately preceding sentence. The applicable margins for the borrowings under the 2013 Credit Facility depend on the consolidated leverage ratio of Engility Holdings, Inc., Engility Corporation and its subsidiaries. The applicable LIBOR margin varies between 2.25% and 3.25%, and the applicable base rate margin varies between 1.25% and 2.25%.
Amortization and Final Maturity. Beginning March 31, 2014, we were required to make scheduled quarterly payments equal to 1.25% of the original principal amount of the combined term loan facility and incremental term loan facility, or $3.4 million per quarter, with the balance to be due and payable on the fifth anniversary of the closing date, August 9, 2018.
Guarantees and Security. All obligations under the 2013 Credit Facility are unconditionally guaranteed by Engility Holdings, Inc. and certain of our direct or indirect wholly owned domestic subsidiaries. All obligations under the 2013 Credit Facility, and the guarantees of those obligations, are secured, subject to certain exceptions, by substantially all of the assets of Engility Corporation and the assets of Engility Holdings, Inc. and Engility Corporation’s subsidiary guarantors.
Covenants and Events of Default. The 2013 Credit Facility contains a number of covenants that, among other things and subject to certain exceptions, restrict our ability to incur additional debt; pay dividends on our capital stock or redeem, repurchase or retire our capital stock or other debt; make investments, loans and acquisitions; create restrictions on the payment of dividends or other amounts by Engility Corporation’s subsidiaries to Engility Corporation or to any guarantor; engage in transactions with Engility Corporation’s affiliates; sell assets; materially alter the business Engility Corporation conducts; consolidate, merge, dissolve or wind up our business; incur liens; and prepay or amend subordinated or unsecured debt. Engility Holdings, Inc. is also subject to a passive holding company covenant that limits our ability to engage in certain activities. In addition, the 2013 Credit Facility requires that Engility Corporation maintain a minimum consolidated debt service coverage ratio of no less than 1.25:1.00 as of the end of any fiscal quarter of Engility Corporation, and as a result of the DRC acquisition a maximum consolidated leverage ratio of no greater than 3.75:1.00 as of the end of any fiscal quarter of Engility Corporation, with step-downs to 3.50:1.00 beginning with the fiscal quarter ended December 31, 2014, 3.25:1.00 beginning with the fiscal quarter ending March 31, 2015, and 3.00:1.00 beginning with the fiscal quarter ending December 31, 2015. We believe our most restrictive covenant under the 2013 Credit Facility is the maximum consolidated leverage ratio, which as of December 31, 2014 was 2.24:1.00. The Consolidated Leverage Ratio is the ratio of (a) (i) Consolidated Funded Indebtedness as of such date minus (ii) the Designated Cash Balances as of such date to (b) Consolidated EBITDA (as such terms are defined in the 2013 Credit Facility) for the period of the four fiscal quarters most recently ended. The 2013 Credit Facility also contains customary provisions relating to the events of default. As of December 31, 2014, we were in compliance with the covenants under the 2013 Credit Facility.
The carrying value of the principal amount outstanding under term loan, which approximates fair value, is $259 million. The fair value of the term loan is based on interest rates prevailing on debt with substantially similar risks, terms and maturities and is considered to be a Level 3 input, measured under U.S. GAAP hierarchy. Our availability under the revolving portion of the 2013 Credit Facility was $161 million as of December 31, 2014, with $3 million outstanding under letters of credit.
71
ENGILITY HOLDINGS, INC.
NOTES TO CONSOLIDATED AND COMBINED FINANCIAL STATEMENTS
(amounts in thousands except per share data or where specified)
The following table presents our minimum debt payments on our term loan portion of our 2013 Credit Facility.
2015 | $ | 13,750 | |
2016 | 13,750 | ||
2017 | 13,750 | ||
2018 | 252,000 | ||
Total minimum payments required | $ | 293,250 | |
13. Fair Value Measurements
Assets and Liabilities Measured at Fair Value on a Recurring Basis
The following tables present our assets and liabilities that are measured at fair value on a recurring basis:
Fair Value Measurements At December 31, 2014 | |||||||||||||||
Balance Sheet Classification | Level 1 | Level 2 | Level 3 | Total | |||||||||||
Assets: | |||||||||||||||
Investments held in Rabbi Trusts | Other non-current assets | $ | 1,985 | — | — | $ | 1,985 | ||||||||
14. Discontinued Operations
During the year ended December 31, 2012, the Global Security Solutions (GSS) business unit, which had been managed by us historically, was retained by L-3 as part of its National Security Solutions business in connection with the Spin-Off. The GSS results of operations are presented as discontinued operations in the Consolidated and Combined Financial Statements.
15. Realignment and Restructuring Costs
2013 Restructuring Costs
During the fourth quarter of 2013, we classified several leased facilities as abandoned and recorded a charge of $8 million. This expense will be amortized as we make scheduled lease payments or settle the leases with the landlord.
2012 Realignment Costs
On September 12, 2012, we announced a strategic realignment of our organizational structure and a streamlining of our operations, which we completed in the first quarter of 2013. This strategic realignment included a reduction of our total workforce by 4% through a voluntary separation of employment program and additional reductions in force.
The activity and balance of the liability accounts for the years ended December 31, 2014, 2013, and 2012 are as follows:
72
ENGILITY HOLDINGS, INC.
NOTES TO CONSOLIDATED AND COMBINED FINANCIAL STATEMENTS
(amounts in thousands except per share data or where specified)
Severance and Related Costs | Professional and Other Fees | Total | |||||||||
Balance as of January 1, 2012 | $ | — | $ | — | $ | — | |||||
Additions | 6,708 | 852 | 7,560 | ||||||||
Adjustments | (297 | ) | 960 | 663 | |||||||
Cash payments | (2,177 | ) | (776 | ) | (2,953 | ) | |||||
Balance as of December 31, 2012 | $ | 4,234 | $ | 1,036 | $ | 5,270 | |||||
Additions | 406 | 7,533 | 7,939 | ||||||||
Adjustments | (544 | ) | — | (544 | ) | ||||||
Cash payments | (3,759 | ) | (1,036 | ) | (4,795 | ) | |||||
Balance as of December 31, 2013 | $ | 337 | $ | 7,533 | $ | 7,870 | |||||
Additions | 1,134 | — | 1,134 | ||||||||
Cash payments | (1,103 | ) | (1,497 | ) | (2,600 | ) | |||||
Balance as of December 31, 2014 | $ | 368 | $ | 6,036 | $ | 6,404 | |||||
Amounts contained in the current liabilities section of our balance sheet as of December 31, 2014 | $ | 368 | $ | 1,352 | $ | 1,720 | |||||
Amounts contained in the other liabilities section of our balance sheet as of December 31, 2014 | $ | — | $ | 4,684 | $ | 4,684 | |||||
These expenses are contained within the selling, general and administrative expense line in the accompanying Consolidated and Combined Statement of Operations for the years ended December 31, 2014, 2013, and 2012.
16. Subsequent Event – TASC acquisition
On February 26, 2015, we completed the acquisition of TASC, Inc., a leading professional services provider to the national security and public safety markets, in an all-stock transaction valued at approximately $1.3 billion, including the assumption of net debt of $614 million. The business combination was effected through a new holding company named New East Holdings, Inc. (New Engility). As a result of the business combination, New Engility succeeded to and continues to operate, directly or indirectly, the existing business of Engility and, indirectly, acquired the existing business of TASC. The combined companies now operate under a new holding company, New East Holdings, Inc. which was renamed “Engility Holdings, Inc.” upon the closing of the acquisition. The New Engility common stock, similar to the predecessor Engility common stock, trades on the New York Stock Exchange (NYSE) under the symbol “EGL.”
As a result of the acquisition of TASC, former TASC stockholders now hold approximately 52% of our shares of common stock outstanding as of February 26, 2015. The holders of Engility common stock immediately prior to the business combination with TASC received a special cash dividend of $207 million, or $11.434 per share.
To finance the transaction and special cash dividend, Engility Corporation (n/k/a Engility LLC) entered into an amended and restated bridge financing letter with respect to an unsecured bridge loan facility in the form of a promissory note in the amount of $585 million, which was repaid in full concurrent with the closing through an increase in TASC’s existing first lien credit agreement (assumed by us as of closing) consisting of (i) new senior secured first lien incremental term loans in an aggregate amount of $435 million, (ii) additional senior secured first lien revolving commitments in an aggregate amount of $65 million, and (iii) new senior secured second lien incremental term loans in an aggregate amount of $150 million.
As a condition to the merger agreement, we entered into a Stockholders Agreement, dated February 26, 2015, with Birch Partners, LP (Birch), and for the limited purposes set forth therein, certain investment funds affiliated with Kohlberg Kravis Roberts & Co. L.P. (KKR) and certain investment funds affiliated with General Atlantic LLC (GA) (the Stockholders Agreement). The Stockholders Agreement establishes certain rights, restrictions and obligations of Birch, KKR and GA, and sets forth certain governance and other arrangements relating to Engility, including the right of Birch to designate (i) four directors for nomination to our 11 member board of directors for so long as each of KKR and GA (including their respective affiliates) beneficially own at least 50% of the shares of our common stock it owned as of the date of the Stockholders Agreement and (ii) two directors for nomination to our 11 member board of directors for so long as each of KKR and GA (including their respective affiliates) beneficially own at least 25% of the shares of our common stock it owned as of the date of the Stockholders Agreement.
73
Item 9. CHANGES IN AND DISAGREEMENTS WITH ACCOUNTANTS ON ACCOUNTING AND FINANCIAL DISCLORE
None.
Item 9A. CONTROLS AND PROCEDURES
Conclusion Regarding the Effectiveness of Disclosure Controls and Procedures
An evaluation was performed under the supervision and with the participation of our management, including our Chief Executive Officer and Chief Financial Officer, of the effectiveness of our disclosure controls and procedures (as defined in Rules 13a-15(e) and 15d-15(e) under the Securities Exchange Act of 1934, as amended) as of the end of the period covered by this report. Based on that evaluation, the Chief Executive Officer and Chief Financial Officer concluded that these disclosure controls and procedures were effective as of December 31, 2014.
Management’s Report on Internal Control Over Financial Reporting
Management is responsible for establishing and maintaining adequate internal control over financial reporting, as such term is defined in Rule 13a-15(f) under the Securities Exchange Act of 1934, as amended. Our internal control over financial reporting is a process designed to provide reasonable assurance regarding the reliability of our financial reporting and the preparation of financial statements for external purposes in accordance with generally accepted accounting principles.
Because of its inherent limitations, internal control over financial reporting may not prevent or detect misstatements. Also, projections of any evaluation of effectiveness to future periods are subject to the risk that controls may become inadequate because of changes in conditions, or that the degree of compliance with the policies or procedures may deteriorate.
Under the supervision and with the participation of our management, including the Chief Executive Officer and Chief Financial Officer, we assessed the effectiveness of our internal control over financial reporting as of December 31, 2014. In making this assessment, management used the criteria set forth by the Committee of Sponsoring Organizations of the Treadway Commission (COSO) in Internal Control - Integrated Framework (2013). Based on our assessment, management concluded that our internal control over financial reporting was effective as of December 31, 2014 based on criteria set forth by COSO in Internal Control - Integrated Framework (2013).
Management’s assessment of and conclusion on the effectiveness of internal control over financial reporting did not include the internal controls of DRC which was acquired January 31, 2014 (see Note 3 to the consolidated financial statements). The financial results of DRC, which are included in the 2014 consolidated and combined financial statements of Engility, constituted 22% of total assets and 17% of total revenue of the related consolidated financial statement amounts as of and for the year ended December 31, 2014. Our independent registered public accounting firm’s attestation report regarding our internal control over financial reporting also did not include an evaluation of the internal control over financial reporting of DRC.
The attestation report concerning the effectiveness of our internal control over financial reporting as of December 31, 2014, issued by PricewaterhouseCoopers, LLP, the independent registered public accounting firm who also audited our consolidated financial statements, is included herein.
Changes in Internal Control Over Financial Reporting
There has been no change in our internal control over financial reporting (as defined in Rules 13a-15(e) and 15d-15(e) under the Securities Exchange Act of 1934, as amended) during the fourth quarter of 2014 that has materially affected, or is reasonably likely to materially affect, our internal control over financial reporting.
Item 9B. OTHER INFORMATION
None.
PART III
Item 10. DIRECTORS, EXECUTIVE OFFICERS AND CORPORATE GOVERNANCE
The information set forth under the captions “Corporate Governance,” and “Section 16(a) Beneficial Ownership Reporting Compliance” in our Proxy Statement for our 2014 Annual Meeting of Stockholders scheduled to be held on May 21, 2015, which we intend to file within 120 days after our fiscal year-end, is incorporated herein by reference.
Item 11. EXECUTIVE COMPENSATION
74
The information set forth under the caption “Executive Compensation” and “Corporate Governance - Director Compensation” in our Proxy Statement for our 2014 Annual Meeting of Stockholders scheduled to be held on May 21, 2015, which we intend to file within 120 days after our fiscal year-end, is incorporated herein by reference.
Item 12. SECURITY OWNERSHIP OF CERTAIN BENEFICIAL OWNERS AND MANAGEMENT AND RELATED STOCKHOLDER MATTERS
The information set forth under the caption “Stock Ownership of Certain Beneficial Owners and Management” in our Proxy Statement for our 2014 Annual Meeting of Stockholders scheduled to be held on May 21, 2015, which we intend to file within 120 days after our fiscal year-end, is incorporated herein by reference.
The following table provides certain information as of December 31, 2014 with respect to our equity compensation plans:
EQUITY COMPENSATION PLAN INFORMATION (1)
(a)(2) | (b)(3) | (c)(4) | |||||||
Number of Securities to be Issued Upon Exercise of Outstanding Options, Warrants and Rights | Weighted- Average Exercise Price of Outstanding Options, Warrants and Rights | Number of Securities Remaining Available for Future Issuance Under Equity Compensation Plans (Excluding Securities Reflected in Column (a)) | |||||||
Equity compensation plans approved by security holders | 1,126,742 | $ | 16.87 | 2,600,037 | |||||
Equity compensation plans not approved by security holders | — | — | — | ||||||
Total | 1,126,742 | 2,600,037 | |||||||
___________________________________
(1) | Includes the Amended 2012 LTPP. For additional information concerning our equity compensation plans, see the discussion in Note 9 to the Consolidated and Combined Financial Statements in this Annual Report on Form 10-K. |
(2) | Represents awards, including RSUs and performance share awards, granted under our Amended 2012 LTPP (which includes awards originally granted under our 2012 LTPP and DSIP, which were merged into our Amended 2012 LTPP) as well as awards, including stock options and RSUs, granted by L-3 under the L-3 Plans prior to the Spin-Off, which we assumed under each outstanding option to purchase L-3 common stock and each L-3 RSU held by our employees. The number of shares of our common stock to be issued in respect of performance share awards has been calculated based on the assumption that the maximum levels of performance applicable to the performance share awards will be achieved. |
(3) | The calculation of the weighted average exercise price excludes the effect of RSU awards and performance share awards, which were granted to our employees at no cost. |
(4) | Includes 2,600,037 shares of our common stock available for future issuance under the Amended 2012 LTPP. Each share of our common stock issued under a “full value” award (i.e., all awards other than stock options or stock appreciation rights) after March 26, 2013 under the Amended 2012 LTPP is counted as 1.68 shares for purposes of calculating the number of shares available for future issuance under the Amended 2012 LTPP. |
Item 13. CERTAIN RELATIONSHIPS AND RELATED TRANSACTIONS, AND DIRECTOR INDEPENDENCE
The information set forth under the captions “Corporate Governance – Director Independence” and “Certain Relationships and Related Party Transactions” in our Proxy Statement for our 2014 Annual Meeting of Stockholders scheduled to be held on May 21, 2015, which we intend to file within 120 days after our fiscal year-end, is incorporated herein by reference.
Item 14. PRINCIPAL ACCOUNTING FEES AND SERVICES
The information set forth under our proposal “Ratification of Independent Registered Public Accounting Firm” in our Proxy Statement for our 2014 Annual Meeting of Stockholders scheduled to be held on May 21, 2015, which we intend to file within 120 days after our fiscal year-end, is incorporated herein by reference.
75
PART IV
Item 15. EXHIBITS AND FINANCIAL STATEMENT SCHEDULES
The following documents are filed as part of this report:
1. | Financial Statements—See Index to Consolidated and Combined Financial Statements at Item 8 of this Annual Report on Form 10-K. |
2. | Financial Statement Schedules—Supplemental schedules are not provided because of the absence of conditions under which they are required or because the required information is given in the financial statements or notes thereto. |
3. | Exhibits—The following exhibits required by Item 601 of Regulation S-K are listed in the Index of Exhibits are incorporated by reference herein. |
SIGNATURES
Pursuant to the requirements of Section 13 or 15(d) of the Securities Exchange Act of 1934, the registrant has duly caused this report to be signed on its behalf by the undersigned, thereunto duly authorized.
ENGILITY HOLDINGS, INC. | |
March 3, 2015 | /s/ Anthony Smeraglinolo |
Anthony Smeraglinolo President and Chief Executive Officer | |
Pursuant to the requirements of the Securities Exchange Act of 1934, this report has been signed below by the following persons on behalf of the registrant and in the capacities and on the dates indicated.
76
Signature | Capacity | Date | ||
/s/ Anthony Smeraglinolo | Director, President and Chief Executive Officer (Principal Executive Officer) | March 3, 2015 | ||
Anthony Smeraglinolo | ||||
/s/ Wayne M. Rehberger | Senior Vice President and Chief Financial Officer (Principal Financial Officer) | March 3, 2015 | ||
Wayne M. Rehberger | ||||
/s/ Richard B. Harkey | Vice President, Corporate Controller and Chief Accounting Officer (Principal Accounting Officer) | March 3, 2015 | ||
Richard B. Harkey | ||||
/s/ Peter A. Marino | Co-Chairman | March 3, 2015 | ||
Peter A. Marino | ||||
/s/ David A. Savner | Co-Chairman | March 3, 2015 | ||
David A. Savner | ||||
/s/ Edward P. Boykin | Director | March 3, 2015 | ||
Edward P. Boykin | ||||
/s/ Steven A. Denning | Director | March 3, 2015 | ||
Steven A. Denning | ||||
/s/ Lynn A. Dugle | Director | March 3, 2015 | ||
Lynn A. Dugle | ||||
/s/ Darryll J. Pines | Director | March 3, 2015 | ||
Darryll J. Pines | ||||
/s/ David M. Kerko | Director | March 3, 2015 | ||
David M. Kerko | ||||
/s/ Anthony Principi | Director | March 3, 2015 | ||
Anthony Principi | ||||
/s/ Charles S. Ream | Director | March 3, 2015 | ||
Charles S. Ream | ||||
/s/ William G. Tobin | Director | March 3, 2015 | ||
William G. Tobin | ||||
INDEX OF EXHIBITS
Exhibit No. | Description |
2.1 | Distribution Agreement, dated as of July 16, 2012, between L-3 Communications Holdings, Inc. and Engility Holdings, Inc. (incorporated herein by reference to Exhibit 2.1 to the Registrant’s Quarterly Report on Form 10-Q, as filed with the Commission on August 13, 2012 (File No. 001-35487)). |
2.2 | Agreement and Plan of Merger, dated as of December 20, 2013, by and among Dynamics Research Corporation, Engility Corporation and Engility Solutions, Inc. (incorporated herein by reference to Exhibit 2.1 to the Registrant’s Current Report on Form 8-K, as filed with the Commission on December 23, 2013 (File No. 001-35487)).++ |
2.3 | Agreement and Plan of Merger, dated as of October 28, 2014, by and among TASC Parent Corporation, Toucan Merger Corporation I, Toucan Merger Corporation II, Engility Holdings, Inc., New East Holdings, Inc. and East Merger Sub, LLC (incorporated herein by reference to Exhibit 2.1 to the Registrant’s Current Report on Form 8-K, as filed with the Commission on October 29, 2014 (File No. 001-35487)) |
2.4 | Voting Agreement, dated as of October 28, 2014, by and among Engility Holdings, Inc. and Birch Partners, L.P. and for the limited purposes set forth therein, KKR Investors and GA Investors (as defined therein) (incorporated herein by reference to Exhibit 10.1 to the Registrant’s Current Report on Form 8-K, as filed with the Commission on October 29, 2014 (File No. 001-35487)). |
3.1 | Amended and Restated Certificate of Incorporation of Engility Holdings, Inc. dated February 26, 2015 (incorporated herein by reference to Exhibit [3.1] of the Registrant’s Current Report on Form 8-K12B, as filed with the Commission on February 27, 2015 (File No. 001-35487)). |
3.2 | Amended and Restated Bylaws of Engility Holdings, Inc. (incorporated herein by reference to Exhibit 3.2 of the Registrant’s Current Report on Form 8-K12B, as filed with the Commission on February 27, 2015 (File No. 001-35487)). |
4.1 | Stockholders Agreement, dated February 26, 2015 by and among Engility Holdings, Inc. and Birch Partners, L.P. and for the limited purposes set forth therein, KKR 2006 Fund L.P. and General Atlantic Partners 85, L.P., KKR Initial Investors and GA Initial Investors (as defined therein) (incorporated herein by reference to Exhibit 4.1 of the Registrant’s Current Report on Form 8-K12B, as filed with the Commission on February 27, 2015 (File No. 001-35487)) |
+10.1 | Master Supply Agreement, dated as of July 16, 2012, between L-3 Communication Corporation (as Seller) and Engility Corporation (as Buyer) (incorporated herein by reference to Exhibit 10.1 of the Registrant’s Quarterly Report on Form 10-Q, as filed with the Commission on November 13, 2012 (File No. 001-35487)). |
+10.2 | Master Supply Agreement, dated as of July 16, 2012, between L-3 Communication Corporation (as Buyer) and Engility Corporation (as Seller) (incorporated herein by reference to Exhibit 10.1 of the Registrant’s Quarterly Report on Form 10-Q, as filed with the Commission on November 13, 2012 (File No. 001-35487)). |
10.3 | Employee Matters Agreement, dated as of July 16, 2012, between Engility Corporation and L-3 Communications Corporation (incorporated herein by reference to Exhibit 10.3 of the Registrant’s Annual Report on Form 10-K, as filed with the Commission on March 21, 2013 (File No. 001-35487)). |
10.4 | Tax Matters Agreement, dated as of July 16, 2012, between Engility Holdings, Inc. and L-3 Communications Holdings, Inc. (incorporated herein by reference to Exhibit 10.4 of the Registrant’s Annual Report on Form 10-K, as filed with the Commission on March 21, 2013 (File No. 001-35487)). |
10.5 | Transition Services Agreement, dated as of July 16, 2012, between Engility Corporation and L-3 Communications Corporation (incorporated herein by reference to Exhibit 10.5 of the Registrant’s Annual Report on Form 10-K, as filed with the Commission on March 21, 2013 (File No. 001-35487)). |
10.6 | Commitment Letter, dated as of December 22, 2013, by and among Bank of America, N.A., Merrill Lynch, Pierce, Fenner & Smith Incorporated, Engility Holdings, Inc. and Engility Corporation (incorporated herein by reference to Exhibit 10.1 to the Registrant’s Current Report on Form 8-K, filed with the Commission on December 23, 2013 (File No. 001-35487)). |
10.7 | Credit Agreement, dated as of August 9, 2013 among Engility Holdings, Inc., Engility Corporation, each of the several lenders from time to time party thereto and Bank of America, N.A. (as administrative agent, swing line lender and letter of credit issuer) (incorporated herein by reference to Exhibit 10.1 of the Registrant’s Current Report on Form 8-K, as filed with the Commission on August 12, 2013 (File No. 001-35487)). |
10.8 | First Amendment to the Credit Agreement, dated as of January 31, 2014 among Engility Holdings, Inc., the Subsidiary Guarantors party thereto, each of the several lenders from time to time party thereto and Bank of America, N.A. (as administrative agent, swing line lender and letter of credit issuer) (incorporated herein by reference to Exhibit 10.1 of the Registrant’s Current Report on Form 8-K, as filed with the Commission on February 3, 2014 (File No. 001-35487)) |
10.9 | First Lien Credit Agreement, dated May 23, 2014. among TASC Parent Corporation, TASC, Inc., the several lenders from time to time parties thereto, Barclays Bank PLC, as Administrative Agent and Collateral Agent, RBC Capital Markets, Deutsch Bank Securities Inc. and Mizuho Bank, LTD. as Co-Syndication Agents, Barclays Bank PLC, as Swingline Lender and Issuing Bank and Barclays Bank PLC, KKR Capital Markets LLC, RBC Capital Markets, Deutsche Bank Securities Inc. and Mizuho Bank, LTD as Joint Lead Arrangers and Joint Bookrunners (incorporated herein by reference to Exhibit 10.1 to the Registrant’s Current Report on Form 8-K12B, as filed with the Commission on February 27, 2015 (File No. 001-35487)). |
10.10 | First Amendment to First Lien Credit Agreement, dated December 18, 2014, by and among TASC, Inc., TASC Parent Corporation, Barclays Bank PLC, as Administrative Agent and the Required Lenders party thereto (incorporated herein by reference to Exhibit 10.2 to the Registrant’s Current Report on Form 8-K12B, as filed with the Commission February 27, 2015 (File No. 001-35487)). |
10.11 | Second Amendment to First Lien Credit Agreement, dated February 26, 2015, by and among TASC, Inc., each lender from time to time party thereto and Barclays Bank PLC (incorporated herein by reference to Exhibit 10.3 to the Registrant’s Current Report on Form 8-K12B, as filed with the Commission on February 27, 2015 (File No. 001-35487)). |
10.12 | Second Lien Credit Agreement, dated May 23, 2014, among TASC Parent Corporation, TASC, Inc., the several lenders from time to time parties thereto, Barclays Bank PLC, as Administrative Agent and Collateral Agent, RBC Capital Markets, Deutsch Bank Securities Inc. and Mizuho Bank, LTD. as Co-Syndication Agents, Barclays Bank PLC, as Swingline Lender and Issuing Bank and Barclays Bank PLC, KKR Capital Markets LLC, RBC Capital Markets, Deutsche Bank Securities Inc. and Mizuho Bank, LTD as Joint Lead Arrangers and Joint Bookrunners (incorporated herein by reference to Exhibit 10.4 to the Registrant’s Current Report on Form 8-K12B, as filed with the Commission on February 27, 2015 (File No. 001-35487)). |
10.13 | First Amendment to Second Lien Credit Agreement, dated as of December 18, 2014, by and among TASC, Inc., TASC Parent Corporation, Barclays Bank PLC, as Administrative Agent and the Required Lenders party thereto (incorporated herein by reference to Exhibit 10.5 to the Registrant’s Current Report on Form 8-K12B, as filed with the Commission on February 27, 2015 (File No. 001-35487)). |
10.14 | Second Amendment to Second Lien Credit Agreement, dated February 26, 2015, by and among TASC, Inc., each lender from time to time party thereto and Barclays Bank PLC (incorporated herein by reference to Exhibit 10.6 to the Registrant’s Current Report on Form 8-K12B, as filed with the Commission on February 27, 2015 (File No. 001-35487)). |
10.15 | First Lien Guarantee and Collateral Agreement, dated May 23, 2014, made by TASC Parent Corporation, TASC, Inc. and the Subsidiary Guarantors party thereto in favor of Barclays Bank PLC, as Collateral Agent (incorporated herein by reference to Exhibit 10.7 to the Registrant’s Current Report on Form 8-K12B, as filed with the Commission on February 27, 2015 (File No. 001-35487)) |
10.16 | Second Lien Guarantee and Collateral Agreement, dated May 23, 2014, made by TASC Parent Corporation, TASC, Inc. and the Subsidiary Guarantors party thereto in favor of Barclays Bank PLC, as Collateral Agent (incorporated herein by reference to Exhibit 10.8 to the Registrant’s Current Report on Form 8-K12B, as filed with the Commission on February 27, 2015 (File No. 001-35487)) |
10.17 | First Lien Assumption Agreement, dated as of February 26, 2015, by and between Engility Holdings, Inc., East Merger Sub, LLC, Engility LLC, International Resources Group Ltd. and Dynamics Research Corporation in favor of Barclays Bank PLC, as collateral agent for the Lenders (incorporated herein by reference to Exhibit 10.9 to the Registrant’s Current Report on Form 8-K12B, as filed with the Commission on February 27, 2015 (File No. 001-35487)). |
10.18 | Second Lien Assumption Agreement, dated as of February 26, 2015, by and between Engility Holdings, Inc., East Merger Sub, LLC, Engility LLC, International Resources Group Ltd. and Dynamics Research Corporation in favor of Barclays Bank PLC, as collateral agent for the Lenders (incorporated herein by reference to Exhibit 10.10 to the Registrant’s Current Report on Form 8-K12B, as filed with the Commission on February 27, 2015 (File No. 001-35487)). |
10.19 | Second Lien Intercreditor Agreement, dated as of May 23, 2014, among Barclays Bank PLC, as the Initial First Lien Representative and Initial First Lien Collateral Agent for the Initial First Lien Claimholders, Barclays Bank PLC, as the Initial Second Lien Representative and Initial Second Lien Collateral Agent for the Initial First Lien Claimholders and each additional Representative and Collateral Agent from time to time party thereto and acknowledged and agreed to by TASC, Inc. and the other Guarantors referred to therein (incorporated herein by reference to Exhibit 10.11 to the Registrant’s Current Report on Form 8-K12B, as filed with the Commission on February 27, 2015 (File No. 001-35487)) |
†10.20 | Engility Holdings, Inc. Amended and Restated 2012 Long Term Performance Plan (incorporated herein by reference to Exhibit 10.4 to the Registrant’s Current Report on Form 8-K, as filed with the Commission on May 28, 2013 (File No. 001-35487)). |
†10.21 | Engility Holdings, Inc. Amended and Restated 2012 Cash Incentive Plan (incorporated herein by reference to Exhibit 10.2 to the Registrant’s Current Report on Form 8-K, as filed with the Commission on May 28, 2013 (File No. 001-35487)). |
†10.22 | Engility Master Savings Plan (incorporated herein by reference to Exhibit 4.7 of the Registrant’s registration statement on Form S-8, as filed with the Commission on July 17, 2012 (File No. 333-182720)). |
†10.23 | Engility Holdings, Inc. 2012 Change in Control Severance Plan (incorporated herein by reference to Exhibit 10.12 of the Registrant’s Annual Report on Form 10-K, as filed with the Commission on March 21, 2013 (File No. 001-35487)). |
†10.24 | Engility Corporation Deferred Compensation Plan I (incorporated herein by reference to Exhibit 10.7 to the Registrant’s Quarterly Report on Form 10-Q, as filed with the Commission on August 13, 2012 (File No. 001-35487)). |
†10.25 | Engility Corporation Deferred Compensation Plan II (incorporated herein by reference to Exhibit 10.8 to the Registrant’s Quarterly Report on Form 10-Q, as filed with the Commission on August 13, 2012 (File No. 001-35487)). |
†10.26 | Form of Engility Holdings, Inc. 2012 Directors Stock Incentive Plan Restricted Stock Unit Agreement (incorporated herein by reference to Exhibit 10.9 to the Registrant’s Quarterly Report on Form 10-Q, as filed with the Commission on August 13, 2012 (File No. 001-35487)). |
†10.27 | Form of Engility Holdings, Inc. 2012 Long Term Performance Plan Nonqualified Stock Option Agreement (incorporated herein by reference to Exhibit 10.10 to the Registrant’s Quarterly Report on Form 10-Q, as filed with the Commission on August 13, 2012 (File No. 001-35487)). |
†10.28 | Form of Engility Holdings, Inc. 2012 Long Term Performance Plan Restricted Stock Unit Agreement (incorporated herein by reference to Exhibit 10.11 to the Registrant’s Quarterly Report on Form 10-Q, as filed with the Commission on August 13, 2012 (File No. 001-35487)). |
†10.29 | Offer Letter in respect of the employment of Anthony Smeraglinolo (incorporated herein by reference to Exhibit 10.13 of the Registrant’s Amendment No. 3 to Form 10, as filed with the Commission on June 19, 2012 (File No. 001-35487)). |
†10.30 | Engility Holdings, Inc. Severance Plan (incorporated herein by reference to Exhibit 10.21 of the Registrant’s Annual Report on Form 10-K, as filed with the Commission on March 21, 2013 (File No. 001-35487)). |
†10.31 | Engility Corporation 2013 Deferred Compensation Plan (incorporated herein by reference to Exhibit 10.22 of the Registrant’s Annual Report on Form 10-K, as filed with the Commission on March 21, 2013 (File No. 001-35487)). |
†10.32 | Form of Engility Holdings, Inc. 2012 Long Term Performance Plan Performance Share Award Agreement (incorporated herein by reference to Exhibit 10.23 of the Registrant’s Annual Report on Form 10-K, as filed with the Commission on March 21, 2013 (File No. 001-35487)). |
*21.1 | Subsidiaries of Engility Holdings, Inc. |
*23.1 | Consent of Independent Registered Public Accounting Firm. |
*31.1 | Certification of President and Chief Executive Officer pursuant to Rule 13a-14(a) and Rule 15d-14(a) of the Securities Exchange Act of 1934, as amended. |
*31.2 | Certification of Senior Vice President and Chief Financial Officer pursuant to Rule 13a-14(a) and Rule 15d-14(a) of the Securities Exchange Act of 1934, as amended. |
*32.1 | Certification of Chief Executive Officer and Chief Financial Officer pursuant to Section 906 of the Sarbanes-Oxley Act of 2002. |
**101.INS | XBRL Instance Document |
**101.SCH | XBRL Taxonomy Extension Schema Document. |
**101.DEF | XBRL Taxonomy Extension Definition Linkbase Document. |
**101.CAL | XBRL Taxonomy Extension Calculation Linkbase Document. |
**101.LAB | XBRL Taxonomy Extension Label Linkbase Document. |
**101.PRE | XBRL Taxonomy Extension Presentation Linkbase Document. |
* | Filed herewith. |
** | Filed electronically with this report. |
† | Compensatory plan or arrangement. |
+ | Portions of this exhibit have been redacted and are subject to a confidential treatment request filed with the Secretary of the Securities and Exchange Commission pursuant to Rule 24b-2 under the Securities Exchange Act of 1934, as amended. |
++ | Certain schedules referenced in the Agreement and Plan of Merger have been omitted in accordance with Item 601(b)(2) of Regulation S-K. A copy of any omitted schedule will be furnished supplementally to the Securities and Exchange Commission upon request. |