Attached files
| file | filename |
|---|---|
| 8-K - FORM 8-K - QUAKER CHEMICAL CORP | v392340_8k.htm |
| EX-99.1 - EXHIBIT 99.1 - QUAKER CHEMICAL CORP | v392340_ex99-1.htm |
Exhibit 99.2

1 Third Quarter 2014 Results Investor Conference Call October 29, 2014 Quaker Chemical Corporation

Regulation G The attached charts include C ompany information that does not conform to generally accepted accounting principles ( “GAAP”). Management believes that an analysis of this data is meaningful to investors because it provides insight with respect to ongoing operating results of the Company and allows investors to better evaluate the financial results of the Company. These measures should not be viewed as an alternative to GAAP measures of performance. Furthermore, these measures may not be consiste nt with simi lar measures provided by other companies. This data should b e read in conjunction with the C ompany’s third quarter earnings news release dated October 28, 2014, which has been furnished to the SEC on Form 8-K, and the Company’s Form 10-Q for the quarterly period ended September 30, 2014, which has been filed with the SEC. Forward-Looking Statements This presentation may contain forward -looking statements that are subject to certain risks and uncertainties that could cause actual results to d iffer materially from those projected in such statements. A major risk is that the Company’s demand is largely derived from the demand for its customers’ products, which subjects the Company to downturns in a customer’s business and unanticipated customer production shutdowns. Other major risks and uncertainties include, but are not limited to, significant increases in raw material costs, customer financial stability, worldwide economic and political conditions, for eign currency fluctuations, future terrorist attacks and other acts of violence . Other factors could also adversely affect us. Therefore, we caution you not to place undue reliance on our forward -looking statements. This discussion is provided as permitted by the Private Securities Litigation Reform Act of 1995. Risks and Uncertainties Statement

Speakers Chart #1 Michael F. Barry Chairman of the Board, Chief Executive Officer & President Margaret M. Loebl Vice President, Chief Financial Officer & Treasurer Robert T. Traub General Counsel

Third Quarter 2014 Headlines ▪ 8% revenue growth on increased product volume ▪ Operating income drives non - GAAP earnings per diluted share up 31% to $1.19 ▪ Net operating cash flows of approximately $30 million generated in the quarter Chart #2

Chairman Comments Third Quarter 2014 ▪ Third Quarter 2014 x Strong volumes drive above - market sales growth x Double - digit growth in North America, Asia Pacific and Europe, partially offset by poor economic conditions in South America x Stable margins x Effective business model & competitive position x Solid net operating cash flow in the quarter ▪ Outlook x Uncertain conditions due to a slowing global economy and a strengthening U.S. Dollar x Potential lower volume due to fourth quarter seasonality x Expect further share gains & leverage from acquisitions “Overall, I continue to remain confident in our future and expect 2014 to be another good year for Quaker.” -- Michael F. Barry, Chairman, CEO & President Chart #3
Chief Financial Officer -- Highlights 1) Record Volume Drives Above - Market Growth in Net Sales 2) Stable Margins Continue to Drive Strong Operating Results 3) Below Operating Income Items Contribute to Strong Results 4) Continued EBITDA Growth and Non - GAAP EPS Up 31% 5) Strong Cash Flow and Balance Sheet for Acquisitions Chart #4 Third Quarter 2014

Product Volume by Quarter Thousand Kilograms 25,000 30,000 35,000 40,000 45,000 50,000 55,000 60,000 4Q08 YTD Avg. 1Q092Q093Q094Q091Q102Q103Q104Q101Q112Q113Q114Q111Q122Q123Q124Q121Q132Q133Q134Q131Q142Q143Q14 Chart #5
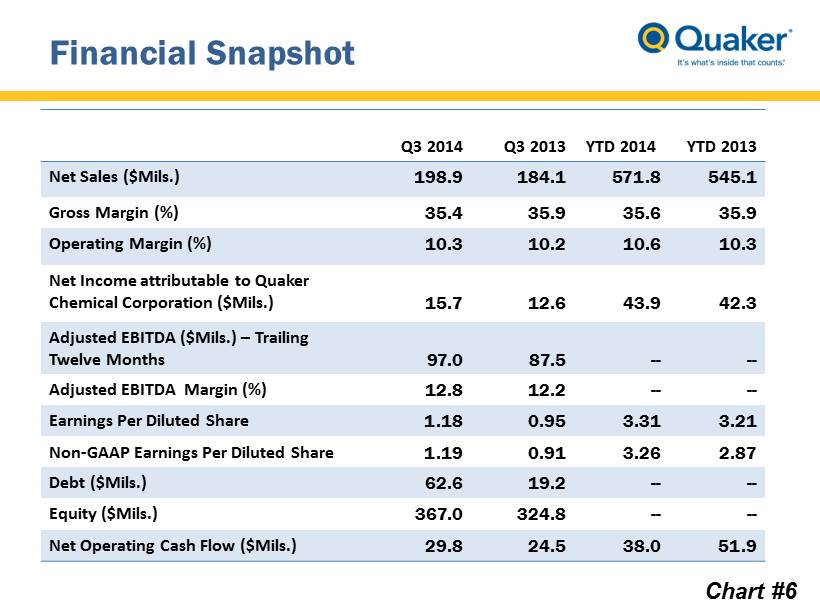
Financial Snapshot Q3 2014 Q3 2013 YTD 2014 YTD 2013 Net Sales ($Mils.) 198.9 184.1 571.8 545.1 Gross Margin (%) 35.4 35.9 35.6 35.9 Operating Margin (%) 10.3 10.2 10.6 10.3 Net Income attributable to Quaker Chemical Corporation ($Mils.) 15.7 12.6 43.9 42.3 Adjusted EBITDA ($Mils.) – Trailing Twelve Months 97.0 87.5 -- -- Adjusted EBITDA Margin (%) 12.8 12.2 -- -- Earnings Per Diluted Share 1.18 0.95 3.31 3.21 Non - GAAP Earnings Per Diluted Share 1.19 0.91 3.26 2.87 Debt ($Mils.) 62.6 19.2 -- -- Equity ($Mils.) 367.0 324.8 -- -- Net Operating Cash Flow ($Mils.) 29.8 24.5 38.0 51.9 Chart #6

Gross Margin Percentage 28.0% 34.7% 35.4% 32.6% 33.7% 35.8% 35.6% 20.0% 25.0% 30.0% 35.0% 40.0% 2008 2009 2010 2011 2012 2013 YTD 2014 Gross Margin Percentage 35.9% 35.4% 35.8% 35.7% 35.4% 20.0% 25.0% 30.0% 35.0% 40.0% Q3 2013 Q4 2013 Q1 2014 Q2 2014 Q3 2014 Gross Margin Percentage Chart #7

Adjusted EBITDA Baseline Historical Performance $40.1 $66.8 $73.0 $80.9 $89.6 $101.4 $44.2 9.8% 12.3% 10.7% 11.4% 12.3% 13.3% 6.9% 2008 2009 2010 2011 2012 2013 Q3 YTD 2014 Annualized Adjusted EBITDA ($ Mils.) Adjusted EBITDA Margin (%) 2008 – 2014 Annualized CAGR: 16.7% +640 Margin bps Chart #8

Balance Sheet Net Cash / (Debt) -$100 -$80 -$60 -$40 -$20 $0 $20 $40 $60 $80 2008 2009 2010 2011 2012 2013 Q3 2014 $ Millions Cash ST/LT Debt Net Debt Chart #9

APPENDIX

Non - GAAP Earnings Per Diluted Share Reconciliation Chart #10 Q3 2014 Q3 2013 YTD 2014YTD 2013 GAAP Earnings Per Diluted Share 1.18$ 0.95$ 3.31$ 3.21$ U.K. pension plan amendment per diluted share -$ -$ 0.05$ -$ U.S. customer bankruptcy per diluted share 0.02$ -$ 0.02$ -$ Mineral oil excise tax refund per diluted share -$ -$ -$ (0.14)$ Change in acquisition-related earnout liability per diluted share -$ -$ -$ 0.03$ Cost streamlining initiatives per diluted share -$ 0.05$ 0.02$ 0.07$ Currency conversion impacts of the Venezuelan Bolivar Fuerte per diluted share -$ -$ 0.02$ 0.03$ Equity income in a captive insurance company per diluted share (0.01)$ (0.09)$ (0.16)$ (0.33)$ Non-GAAP Earnings Per Diluted Share 1.19$ 0.91$ 3.26$ 2.87$

Annualized Adjusted EBITDA Reconciliation Chart #11 2008 2009 2010 2011 2012 2013 YTD Q3 2014 Net income 9,833 16,058 32,120 45,892 47,405 56,339 43,853 Depreciation 10,879 9,525 9,867 11,455 12,252 12,339 9,154 Amortization 1,177 1,078 988 2,338 3,106 3,445 2,754 Interest expense 5,509 5,533 5,225 4,666 4,283 2,922 1,747 Taxes on income 4,977 7,065 12,616 14,256 15,575 20,489 18,808 Restructuring and related activities 2,916 2,289 - - - - - Non-income tax contingency charge - - 4,132 - - 796 - Equity affiliate out of period charge - - 564 - - - - Mineral oil excise tax refund - - - - - (2,540) - Transition costs related to key employees 3,505 2,443 1,317 - 609 - - Non-cash gain from the purchase of an equity affiliate - - - (2,718) - - - Change in acquisition-related earnout liability - - - (595) (1,737) (497) - Equity loss (income) from a captive insurance company 1,299 162 (313) (2,323) (1,812) (5,451) (2,142) Currency conversion impacts of the Venezuelan Bolivar - - 322 - - 357 321 U.S. customer bankruptcies - - - - 1,254 - 310 Cost streamlining initiatives - - - - - 1,419 348 U.K. pension plan amendment - - - - - - 902 Adjusted EBITDA 40,095 44,153 66,838 72,971 80,935 89,618 76,055 Adjusted EBITDA Margin 6.9% 9.8% 12.3% 10.7% 11.4% 12.3% 13.3% Multiply Adjusted EBITDA by Annual Run Rate 1 1 1 1 1 1 1.33 Annualized Adjusted EBITDA 40,095 44,153 66,838 72,971 80,935 89,618 101,407

Trailing Twelve Months Adjusted EBITDA Reconciliation Chart #12 I = G + H H G = F - D F E = C + D D C = B - A B A Trailing Twelve Months Q3 2014 YTD Q3 2014 Last Three Months 2013 YTD 2013 Trailing Twelve Months Q3 2013 YTD Q3 2013 Last Three Months 2012 YTD 2012 YTD Q3 2012 Net income 57,939 43,853 14,086 56,339 55,260 42,253 13,007 47,405 34,398 Depreciation 12,274 9,154 3,120 12,339 12,470 9,219 3,251 12,252 9,001 Amortization 3,578 2,754 824 3,445 3,444 2,621 823 3,106 2,283 Interest expense 2,446 1,747 699 2,922 3,147 2,223 924 4,283 3,359 Taxes on income 22,364 18,808 3,556 20,489 19,816 16,933 2,883 15,575 12,692 Non-income tax contingency 796 - 796 796 - - - - - Mineral oil excise tax refund - - - (2,540) (2,540) (2,540) - - - Change in acquisition-related earnout liability (1,172) - (1,172) (497) (1,062) 675 (1,737) (1,737) - Equity loss (income) from a captive insurance company (3,215) (2,142) (1,073) (5,451) (4,764) (4,378) (386) (1,812) (1,426) Currency conversion impacts of the Venezuelan Bolivar 321 321 - 357 357 357 - - - U.S. customer bankruptcies 310 310 - - 98 - 98 1,254 1,156 Transition costs related to key employees - - - - - - - 609 609 Cost streamlining initiatives 490 348 142 1,419 1,277 1,277 - - - U.K. pension plan amendment 902 902 - - - - - - - Adjusted EBITDA 97,033 76,055 20,978 89,618 87,503 68,640 18,863 80,935 62,072 Adjusted EBITDA Margin 12.8% 13.3% 11.4% 12.3% 12.2% 12.6% 10.9% 11.4% 11.6%