Attached files
| file | filename |
|---|---|
| EX-99.1 - EARNINGS RELEASE - YADKIN FINANCIAL Corp | q32014pressrelease.htm |
| 8-K - 8-K - YADKIN FINANCIAL Corp | form8-k102314.htm |

2014 Q3 Earnings Call October 23, 2014

Forward Looking Statements Information in this presentation contains forward-looking statements within the meaning of the Private Securities Litigation Reform Act of 1995. These statements involve risks and uncertainties that could cause actual results to differ materially, including without limitation, reduced earnings due to larger than expected credit losses in the sectors of our loan portfolio secured by real estate due to economic factors, including declining real estate values, increasing interest rates, increasing unemployment, or changes in payment behavior or other factors; reduced earnings due to larger credit losses because our loans are concentrated by loan type, industry segment, borrower type, or location of the borrower or collateral; the rate of delinquencies and amount of loans charged-off; the adequacy of the level of our allowance for loan losses and the amount of loan loss provisions required in future periods; costs or difficulties related to the integration of the banks we acquired or may acquire may be greater than expected; results of examinations by our regulatory authorities, including the possibility that the regulatory authorities may, among other things, require us to increase our allowance for loan losses or writedown assets; the amount of our loan portfolio collateralized by real estate, and the weakness in the commercial real estate market; our ability to maintain appropriate levels of capital; the impact of our efforts to raise capital on our financial position, liquidity, capital, and profitability; the increase in the cost of capital of our preferred stock; adverse changes in asset quality and resulting credit risk-related losses and expenses; increased funding costs due to market illiquidity, increased competition for funding, and increased regulatory requirements with regard to funding; significant increases in competitive pressure in the banking and financial services industries; changes in political conditions or the legislative or regulatory environment, including the effect of recent financial reform legislation on the banking industry; general economic conditions, either nationally or regionally and especially in our primary service area, becoming less favorable than expected resulting in, among other things, a deterioration in credit quality; our ability to retain our existing customers, including our deposit relationships; changes occurring in business conditions and inflation; changes in monetary and tax policies; ability of borrowers to repay loans; risks associated with a failure in or breach of our operational or security systems or infrastructure, or those of our third party vendors and other service providers or other third parties, including as a result of cyber attacks, which could disrupt our businesses, result in the disclosure or misuse of confidential or proprietary information, damage our reputation, increase our costs and cause losses; changes in accounting principles, policies or guidelines; changes in the assessment of whether a deferred tax valuation allowance is necessary; our reliance on secondary sources such as FHLB advances, sales of securities and loans, federal funds lines of credit from correspondent banks and out-of-market time deposits, to meet our liquidity needs; loss of consumer confidence and economic disruptions resulting from terrorist activities or other military actions; and changes in the securities markets. Additional factors that could cause actual results to differ materially are discussed in the Company’s filings with the Securities and Exchange Commission ("SEC"), including without limitation its Annual Report on Form 10-K, its Quarterly Reports on Form 10-Q, and its Current Reports on Form 8-K. The forward-looking statements in this presentation speak only as of the date of the presentation, and the Company does not assume any obligation to update such forward-looking statements. Non‐GAAP Measures Statements included in this presentation include non‐GAAP measures and should be read along with the accompanying tables to the October 23, 2014 presentation and earnings release which provide a reconciliation of non‐GAAP measures to GAAP measures. Management believes that these non‐GAAP measures provide additional useful information that allows readers to evaluate the ongoing performance of the Company without regard to transactional activities. Non‐GAAP measures should not be considered as an alternative to any measure of performance or financial condition as promulgated under GAAP, and investors should consider the Company's performance and financial condition as reported under GAAP and all other relevant information when assessing the performance or financial condition of the Company. Non‐GAAP measures have limitations as analytical tools, and investors should not consider them in isolation or as a substitute for analysis of the Company's results or financial condition as reported under GAAP. Important Information 2

Q3 2014 Highlights 3 Stanly Cabarrus Vance Richmond Anson Florence Marion Darlington Marlboro Barnwell Greenwood Dillon Chesterfield Lancaster Columbus Lenoir Wayne Cleveland Rutherford Sampson Union Brunswick Cumberland Moore Lee Alamance Orange Iredell Wake Pitt Carteret Onslow Craven Watauga Perquimans Ashe Wilkes Yadkin Washington Currituck Hyde Johnston York Dare Tyrrell Cherokee Richland Greenville Halifax Alleghany Mitchell Avery McDowell McCormick Transylvania Martin Jackson Cherokee Graham Swain Haywood Hertford Northampton Dorchester Bamberg Jasper Charleston Colleton Allendale Beaufort Alexander Beaufort Bertie Bladen Buncombe Burke Caldwell Camden Caswell Catawba Chatham Chowan Clay Davidson Davie Duplin Edgecombe Forsyth Franklin Gaston Gates Granville Greene Guilford Harnett Henderson Hoke Jones Lincoln Macon Madison Montgomery Nash Pamlico Pender Person Polk Randolph Robeson Rockingham Rowan Scotland Stokes Surry Warren Wilson Yancey Abbeville Aiken Anderson Berkeley Calhoun Chester Clarendon Edgefield Fairfield Georgetown Hampton Horry Kershaw Laurens Lee Lexington Newberry Oconee Orangeburg Pickens Saluda Spartanburg Sumter Union Williamsburg Charlotte Raleigh Mecklenburg New Hanover Durham Record Operating Earnings Improved key financial metrics Merger Integration Completed Conversion completed on time and on budget with no key employee losses Positive Business Momentum Strong organic loan growth Continued Asset Quality Improvement

Positive Business Momentum 4 Combined Core Pre-Tax, Pre-Provision Earnings (1, 2) ($000) Combined Operating Efficiency Ratio (1, 2) (%) Combined Gross Loans Outstanding (1, 2) ($mm) Combined Operating ROAA (1, 2) (%) (1) Periods from Q3 2013 to Q2 2014 are a pro forma combination of Yadkin Financial Corporation and VantageSouth Bancshares, Inc. results. Q3 2014 represents actual results. All periods exclude securities gains and losses, a branch sale gain, merger and conversion costs, and restructuring charges. (2) Results from periods prior to Q3 2014 do not include any acquisition accounting impact from the Yadkin-VantageSouth merger.

Pre-tax, pre-provision operating earnings increased by 29.6% from $15.1mm to $19.5mm Net interest income increased (16.5%) due to higher loan yields and a lower cost of funds Benefited from accretion of mark on acquired Yadkin loans Benefited from robust 13% net loan growth (excluding impact of Yadkin acquired loan mark) Provision of $816k fully covered $626k in net charge-offs and provided for robust loan growth Operating non-interest income growth driven by higher mortgage income Operating non-interest expense was negatively impacted by higher core deposit intangible amortization and salaries & benefits Core deposit intangible increased $621k related to acquired Yadkin core deposits Focus for Q3 2014 was to maintain strong business momentum and successfully complete conversion Salaries & benefits cost rose due to higher variable compensation and the integration of benefits programs across the organization *Excludes securities gains and losses, branch sale gain, merger and conversion costs, and restructuring charges. Earnings Profile 5 For the Quarter Ended, ($ in thousands) 2014Q2 2014Q3 Net interest income 35,626$ 41,512$ Provision for loan losses (427) 816 Net interest income after provision for loan losses 36,053 40,696 Operating non-interest income 8,538 8,742 Operating non-interest expense 29,107 30,737 Operating income before taxes & M&A costs 15,484$ 18,701$ Gain on sales of available for sale securities 220 (96) Gain on sale of branch - 415 Merger and conversion costs 2,617 17,270 Restructuring charges 93 180 Income before income taxes 12,994 1,570 Income tax expense 5,062 621 Net income 7,932 949 Dividends and accretion on preferred stock 608 630 Net income to common shareholders 7,324 319 Pre-tax, pre-provision operating earnings (Non- GAAP)* 15,057 19,517

Net Interest Income 6 Combined Net Interest Margin (%) GAAP net interest margin was significantly impacted by impact of acquisition accounting Robust net loan growth and pipelines will continue to benefit net interest income Core net interest margin declined by 0.07% due to loan and investment repricing in current rate environment Focus remains on disciplined loan pricing and low-cost, core deposits Average Yields and Rates For the Quarter Ended, 2014Q2 2014Q3 Loans 5.28% 5.91% Securities 2.33% 2.23% Other earning assets 0.22% 0.34% Total arni g assets 4.61% 5.12% Interest bearing deposits (0.49%) (0.37%) Borrowed funds (2.01%) (1.80%) Total interest bearing liabilities (0.64%) (0.54%) Net interest margin (FTE) 4.07% 4.68% Cost of funds 0.55% 0.44%

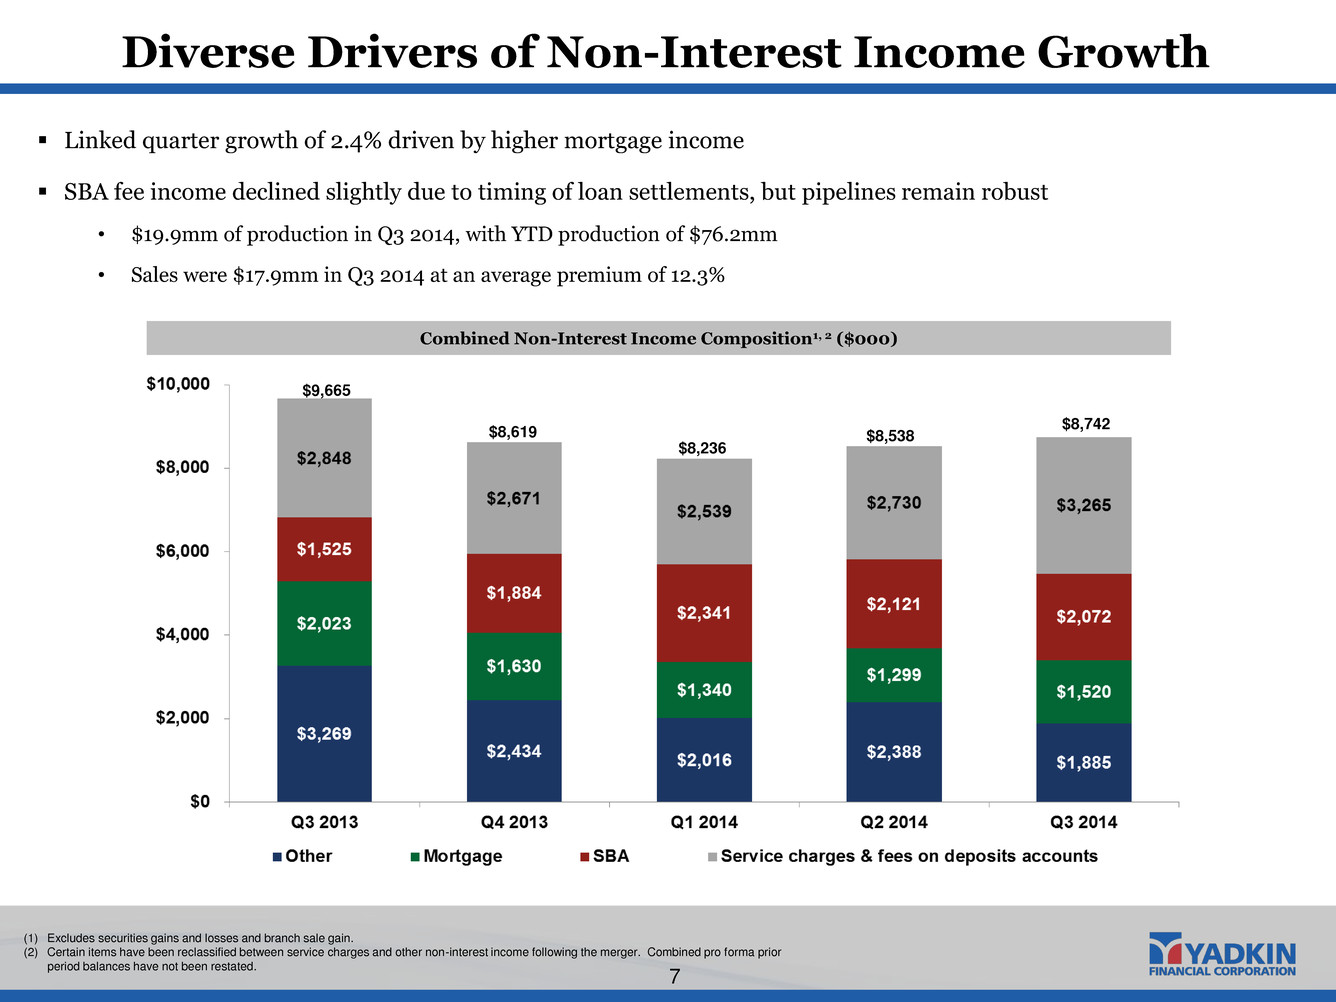
Diverse Drivers of Non-Interest Income Growth 7 Combined Non-Interest Income Composition1, 2 ($000) $8,619 $9,665 $8,236 $8,538 Linked quarter growth of 2.4% driven by higher mortgage income SBA fee income declined slightly due to timing of loan settlements, but pipelines remain robust • $19.9mm of production in Q3 2014, with YTD production of $76.2mm • Sales were $17.9mm in Q3 2014 at an average premium of 12.3% (1) Excludes securities gains and losses and branch sale gain. (2) Certain items have been reclassified between service charges and other non-interest income following the merger. Combined pro forma prior period balances have not been restated. $8,742

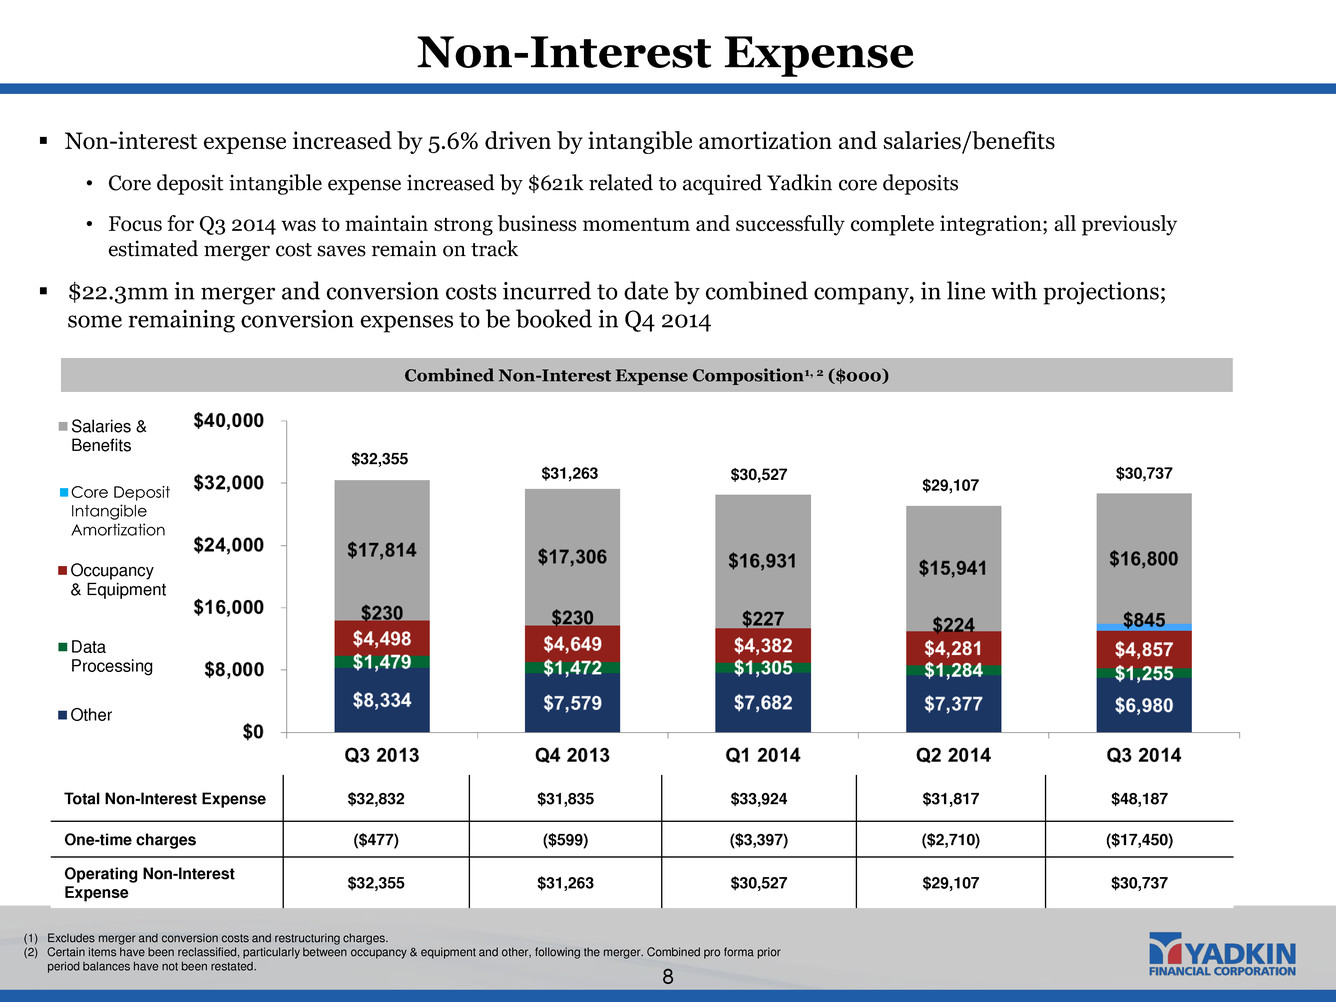
Non-Interest Expense 8 Combined Non-Interest Expense Composition1, 2 ($000) Non-interest expense increased by 5.6% driven by intangible amortization and salaries/benefits • Core deposit intangible expense increased by $621k related to acquired Yadkin core deposits • Focus for Q3 2014 was to maintain strong business momentum and successfully complete integration; all previously estimated merger cost saves remain on track $22.3mm in merger and conversion costs incurred to date by combined company, in line with projections; some remaining conversion expenses to be booked in Q4 2014 Total Non-Interest Expense $32,832 $31,835 $33,924 $31,817 $48,187 One-time charges ($477) ($599) ($3,397) ($2,710) ($17,450) Operating Non-Interest Expense $32,355 $31,263 $30,527 $29,107 $30,737 $2,884 $4,687 $4,569 $4,376 $4,006 $644 $1,075 $1,105 $1,096 $1,030 $1,547 $2,408 $2,497 $2,600 $2,636 $5,991 $11,009 $10,034 $9,452 $9,014 $0 $4,000 $8,000 $12,000 $16,000 $20,000 Q1 2013 Q2 2013 Q3 2013 Q4 2013 Q1 2014 Other Data Processing Occupancy & Equipment Salaries & Benefits $2,884 $4,687 $4,569 $4,376 $4,006 $644 $1,075 $1,105 $1,096 $1,030 $1,547 $2,408 $2,497 $2,600 $2,636 $5,991 $11,009 $10,034 $9,452 $9,014 $0 $4,000 $8,000 $12,000 $16,000 $20,000 Q1 2013 Q2 2013 Q3 2013 Q4 2013 Q1 2014 Other Data Processing Occupancy & Equipment S laries & Ben fits $2,884 $4,687 $4,569 $4,376 $4,006 $644 $1,075 $1,105 $1,096 $1,030 $1,547 $2,408 $2,497 $2,600 $2,636 $5,991 $11,009 $10,034 $9,452 $9,014 $0 $4,000 $8,000 $12,000 $16,000 $20,000 Q1 2013 Q2 2013 Q3 2013 Q4 2013 Q1 2014 Other Data Processing Occupancy & Equipment Salaries & Benefits $31,263 $32,355 $30,527 $29,107 $30,737 (1) Excludes merger and conversion costs and restructuring charges. (2) Certain items have been reclassified, particularly between occupancy & equipment and other, following the merger. Combined pro forma prior period balances have not been restated. $2,884 $4,687 $4,569 $4,376 $4,006 $644 $1,075 $1,105 $1,096 $1,030 $1,547 $2,408 $2,497 $2,600 $2,636 $5,991 $11,009 $10,034 $9,452 $9,014 $0 $4,000 $8,000 $12,000 $16,000 $20,000 Q1 2013 Q2 2 13 Q3 2 13 Q4 2013 Q1 2014 Other Data Processing Occupancy & Equipment Salaries & Benefits n Core Deposit Intangible Amortization

Combined Balance Sheet 9 Net loan growth of $86.2mm, or 13% annualized • Driven by robust new production of $376.2mm, evenly distributed across footprint • Disciplined approach to credit underwriting and pricing • Net loan growth excludes impact of $47mm fair value mark on acquired Yadkin loans Investment portfolio repositioned after merger to improve performance • Funded larger portfolio with fixed rate borrowings • No additional interest rate risk taken Stable deposit profile • Minimal attrition following merger and conversion • Deposit products were integrated and revamped to better serve and attract business and retail customers, which lead to the much of the change between non-interest and interest-bearing demand accounts (1) Does not include impact of acquisition accounting on Yadkin’s balance sheet. Combined Balance Sheet As of the Quarter Ended, (Dollars in thousands) 2014Q2(1) 2014Q3 Assets: Cash and due from banks 70,929$ 59,837$ Federal funds & interest-earning deposits 80,097 31,238 Investment securities 656,754 734,721 Loans held for sale 26,354 26,853 Loans 2,788,436 2,827,426 Allowance for loan losses (23,900) (7,641) Premises and equipment, net 84,416 81,554 Foreclosed assets 12,057 11,078 Other assets 267,209 413,529 Total assets 3,962,352$ 4,178,595$ Liabilities: Deposits: Non-interest demand 531,231$ 657,554$ Interest-bearing demand 576,504 439,117 Money market and savings 942,067 970,571 Time deposits 1,135,818 1,117,697 Total deposits 3,185,620 3,184,939 Short-term borrowings 213,379 216,500 Long-term debt 105,892 210,154 Accrued interest & other liabilities 23,620 24,672 Total liabilities 3,528,511$ 3,636,265$ Shareholders' equity: Preferred stock 28,405$ 28,405$ Common stock & other equity 405,436 513,925 Total shareholders' equity 433,841 542,330 Total liabilities and shareholders' equity 3,962,352$ 4,178,595$

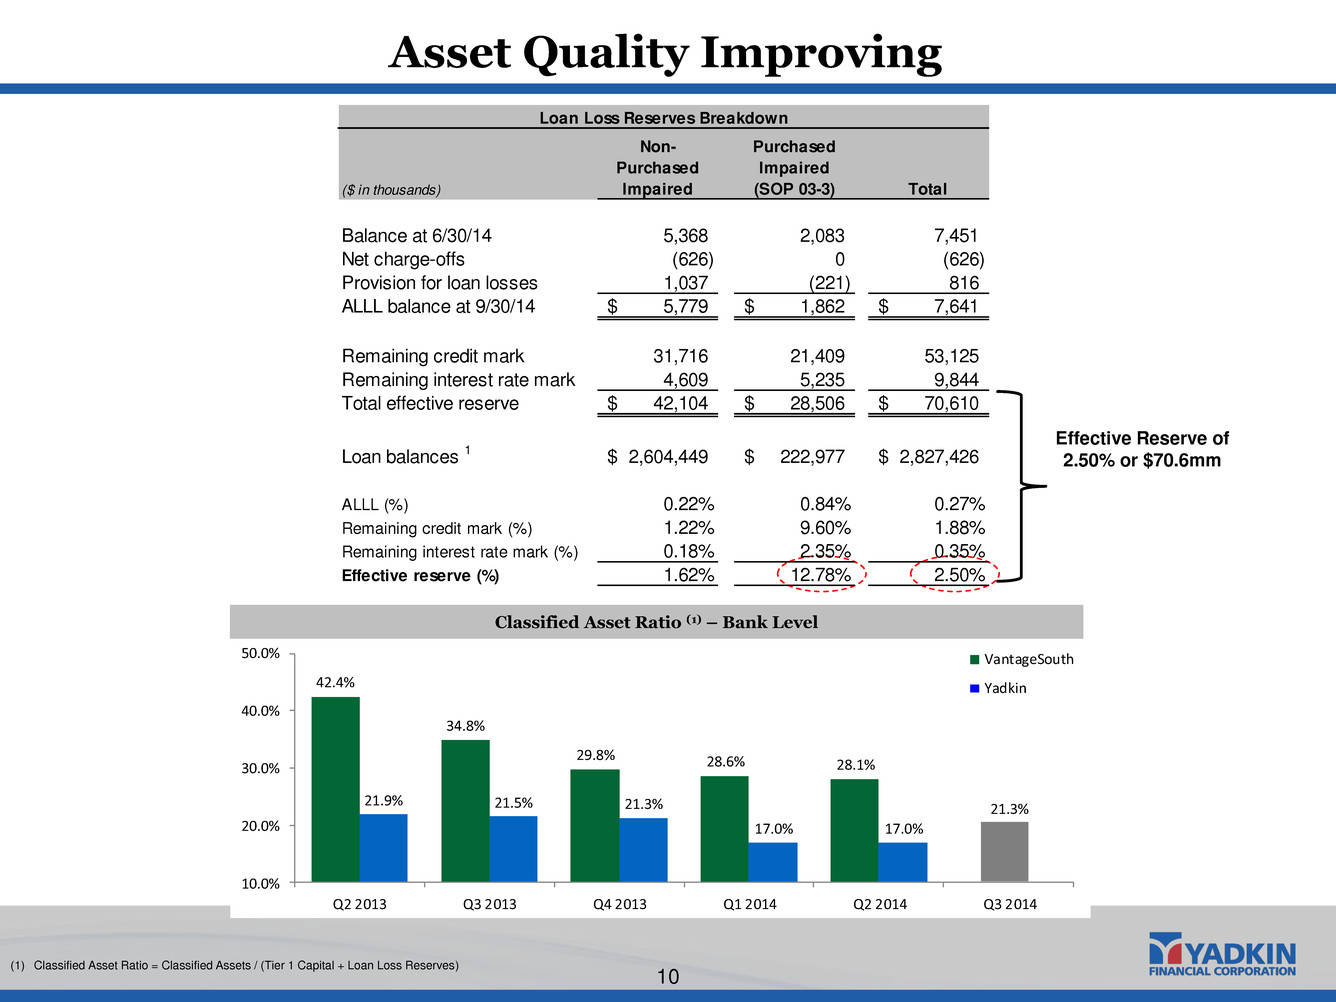
Asset Quality Improving 10 42.4% 34.8% 29.8% 28.6% 28.1% 21.3% 21.9% 21.5% 21.3% 17.0% 17.0% 10.0% 20.0% 30.0% 40.0% 50.0% Q2 2013 Q3 2013 Q4 2013 Q1 2014 Q2 2014 Q3 2014 VantageSouth Yadkin Effective Reserve of 2.50% or $70.6mm Classified Asset Ratio (1) – Bank Level (1) Classified Asset Ratio = Classified Assets / (Tier 1 Capital + Loan Loss Reserves) Loan Loss Reserves Breakdown ($ in thousands) Non- Purchased Impaired Purchased Impaired (SOP 03-3) Total Balance at 6/30/14 5,368 2,083 7,451 Net charge-offs (626) 0 (626) Provision for loan losses 1,037 (221) 816 ALLL balance at 9/30/14 5,779$ 1,862$ 7,641$ Remaining credit mark 31,716 21,409 53,125 Remaining interest rate mark 4,609 5,235 9,844 Total effective reserve 42,104$ 28,506$ 70,610$ Loan balances 1 2,604,449$ 222,977$ 2,827,426$ ALLL ( ) 0.22% 0.84% 0.27% Remaining credit mark (%) 1.22% 9.60% 1.88% Remaining interest rate mark (%) 0.18% 2.35% 0.35% Effective reserve (%) 1.62% 2.78% 2.50%

Contact: Terry Earley (919) 659-9015 terry.earley@yadkinbank.com

Appendix: Operating Earnings Reconciliation (Dollars in thousands) September 30, December 31, March 31, June 30, VANTAGESOUTH 2013 2013 2014 2014 Net operating earnings (Non-GAAP) Net income (GAAP) $1,484 $3,264 $2,114 $3,544 Securities (gains) losses - - - (217) Merger and conversion costs 477 599 1,209 1,968 Restructuring charges - - 836 93 Income tax effect of adjustments (172) (24) (452) (387) Deferred tax asset revaluation from reduction in state income tax rates 1,218 - - - Net operating earnings (Non-GAAP) $3,007 $3,839 $3,707 $5,001 YADKIN Net operating earnings (Non-GAAP) Net income (loss) (GAAP) 4,711$ 4,657$ 3,908$ 4,388$ Securities (gains) losses (253) 2,884 (1,128) (3) Merger and conversion costs - - 1,352 649 Income tax effect of adjustments 100 (1,120) 312 (146) Net operating earnings (Non-GAAP) 4,558$ 6,421$ 4,444$ 4,888$ For the Three Months Ended, COMBINED Actual September 30, December 31, March 31, June 30, September 30, COMBINED 2013 2013 2014 2014 2014 Net operating earnings (Non-GAAP) Net income (loss) (GAAP) 6,195$ 7,921$ 6,022$ 7,932$ 949$ Securities (gains) losses (253) 2,884 (1,128) (220) 96 Branch sale gain - - - - (415) Merger and conversion costs 477 599 2,561 2,617 17,270 Restructuring charges - - 836 93 180 Income tax effect of adjustments (72) (1,144) (140) (533) (6,075) Deferred tax asset revaluation from reduction in state income tax rates 1,218 - - - - Net operating earnings (Non-GAAP) 7,565$ 10,260$ 8,151$ 9,889$ 12,005$ Average Assets 3,813,294$ 3,861,924$ 3,897,139$ 3,929,913$ 4,079,107$ Net operating ROAA 0.80% 1.05% 0.85% 1.01% 1.17% For the Three Months Ended, 12
