Attached files
| file | filename |
|---|---|
| 8-K - 8-K - SYNERGY PHARMACEUTICALS, INC. | a14-22643_18k.htm |
Exhibit 99.1
|
|
Plecanatide, a Novel Uroguanylin Analog: a 12-week, randomized, double-blind, placebo-controlled, dose-ranging trial to evaluate efficacy and safety in patients with irritable bowel syndrome with constipation (IBS-C) Authors: Philip B. Miner Jr.*1, MD; Robert DeLuca, MD2; Marianela De La Portilla, MD3; Eveline Padilla, MD4; William Koltun, MD5; Othon Wiltz, MD6; Kunwar Shailubhai, PhD7; Gary S. Jacob, PhD7; Patrick Griffin, MD7; Laura Barrow, PharmD7 *Presenter, 1Oklahoma Foundation for Digestive Research, Oklahoma City, OK 2 Columbus Clinical Services, Miami, FL 3 Genoma Research Group, Inc., Miami, FL 4 Medical Research Unlimited, LLC, Hialeah, FL 5Medical Center for Clinical Research, San Diego, CA 6South Medical Research Center, Inc., Miami FL 7Synergy Pharmaceuticals, New York, NY |

|
|
2 Plecanatide: a Novel Uroguanylin Analog Linaclotide: Bacterial Enterotoxin NDDCELCVNVACTGCL NDECELCVNVACTGCL NSSNYCCELCCNPACTGCY CCEYCCNPACTGCY ST Peptide: E. coli Bacteria Uroguanylin: Natural GC-C Ligand Plecanatide: Uroguanylin Analog KEY AMINO ACID SUBSTITUTION |

|
|
3 Plecanatide Phase 2b IBS-C Trial: Study Overview Design: Randomized, 12-week, double blind, placebo-controlled, dose-ranging study Population: Rome III Criteria for IBS-C Treatment Groups: 0.3, 1.0, 3.0 and 9.0 mg plecanatide or placebo Drug Administration: Once-daily oral tablet |

|
|
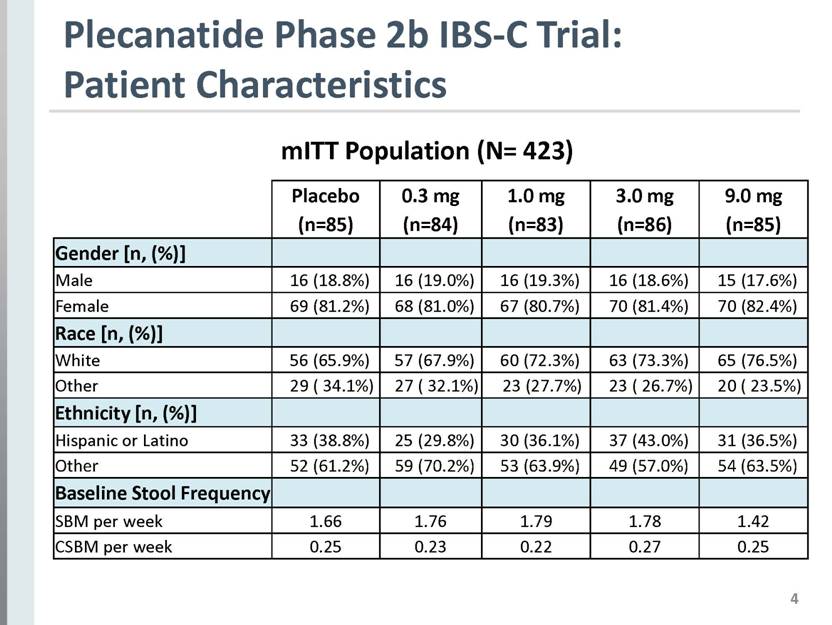
4 Plecanatide Phase 2b IBS-C Trial: Patient Characteristics Placebo (n=85) 0.3 mg (n=84) 1.0 mg (n=83) 3.0 mg (n=86) 9.0 mg (n=85) Gender [n, (%)] Male 16 (18.8%) 16 (19.0%) 16 (19.3%) 16 (18.6%) 15 (17.6%) Female 69 (81.2%) 68 (81.0%) 67 (80.7%) 70 (81.4%) 70 (82.4%) Race [n, (%)] White 56 (65.9%) 57 (67.9%) 60 (72.3%) 63 (73.3%) 65 (76.5%) Other 29 ( 34.1%) 27 ( 32.1%) 23 (27.7%) 23 ( 26.7%) 20 ( 23.5%) Ethnicity [n, (%)] Hispanic or Latino 33 (38.8%) 25 (29.8%) 30 (36.1%) 37 (43.0%) 31 (36.5%) Other 52 (61.2%) 59 (70.2%) 53 (63.9%) 49 (57.0%) 54 (63.5%) Baseline Stool Frequency SBM per week 1.66 1.76 1.79 1.78 1.42 CSBM per week 0.25 0.23 0.22 0.27 0.25 mITT Population (N= 423) |
|
|
5 Plecanatide Phase 2b IBS-C Trial: Statistical Approach to Missing Diary Data 1. Primary Analysis of the Primary Endpoint: Observed Case Methodology - Any missing diary entry in a week with partial data was assigned as ‘no CSBM’ - If < 4 diary entries/week, entire week was set to zero (‘no CSBM’), assumption weekly data ‘missing at random’ 2. Sensitivity Analyses of the Primary Endpoint: Alternative missing data conventions (independent of Observed Case methodology) - Mean Replacement Approach (MRA) - Last Observation Carried Forward (LOCF) |

|
|
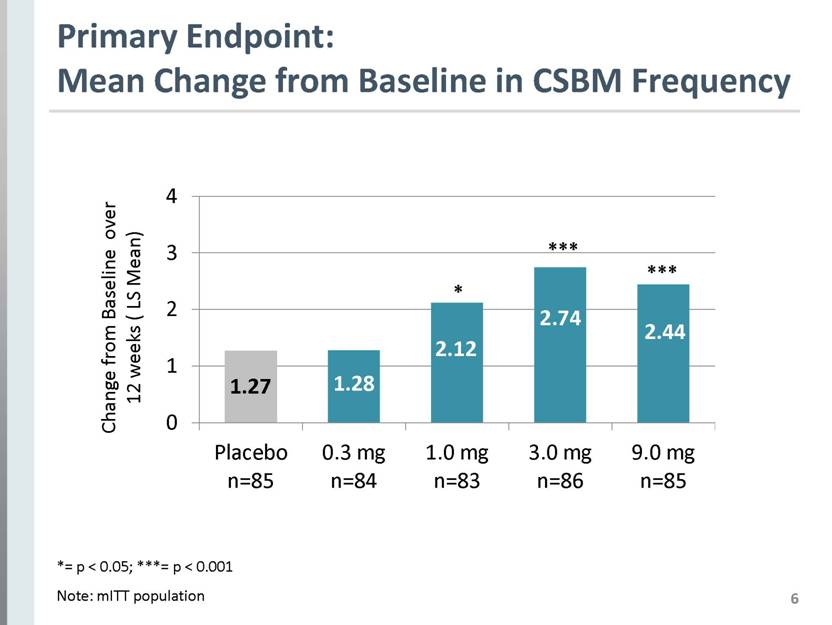
6 Primary Endpoint: Mean Change from Baseline in CSBM Frequency *= p < 0.05; ***= p < 0.001 Note: mITT population 1.27 1.28 2.12 2.44 2.74 Change from Baseline over 12 weeks ( LS Mean) Placebo n=85 0.3 mg n=84 1.0 mg n=83 3.0 mg n=86 9.0 mg n=85 |
|
|
7 Secondary Endpoint: Stool Consistency (BSFS) Bristol Stool Form Scale Score * = p<0.05; ** = p < 0.01; *** = p < 0.001 Treatment week *** *** ** *** *** *** ** *** *** * *** *** *** * ** *** *** * *** *** *** ** ** *** *** ** * *** *** * ** *** *** ** ** *** *** * *** *** *** ** ** *** *** Note: mITT population 5 4.5 4 3.5 3 2.5 2 Placebo 0.3 mg 1.0 mg 3.0 mg 9.0 mg 0 1 2 3 4 5 6 7 8 9 10 11 12 r/o |

|
|
8 Secondary Endpoint: Abdominal Pain Intensity -2.0 -1.8 -1.5 “For today, rate your abdominal pain at its worst on a scale of 0 to 10” * = p < 0.05 Note: mITT population Change from Baseline over 12 weeks ( LS Mean) -1.4 -1.5 0 -0.5 -1 -1.5 -2 -2.5 |

|
|
9 Secondary Endpoint: Abdominal Pain Responder % Responder 23.5% 27.4% 32.5% 38.4% * 40.0% Placebo n=85 0.3 mg n=84 1.0 mg n=83 3.0 mg n=86 9.0 mg n=85 * Abdominal Pain Responder= > 30% reduction in pain in 9 out of 12 treatment weeks (75%) *p < 0.05 Note: mITT population |

|
|
10 Secondary Endpoint: Overall Responder (FDA Endpoint) 41.9% * 40% * 30.1% 26.2% 24.7% * p < 0.05 Note: mITT population Overall Responder= fulfills both > 30% reduction in worst abdominal pain and Increase of > 1 CSBMs from baseline in the same week for at least 50% of the weeks (6/12 weeks) |

|
|
11 *** *** ** ** ** *** *** ** ** * *** *** * * * p< 0.05 ** p<0.01 *** p< 0.001 Note: mITT Population Responder= Patient’s response is considerable or completely improved “How would you rate the ability of your study drug treatment to provide relief from your IBS-C symptoms?” Secondary Endpoint: Ability to Relieve IBS-C Symptoms % Responder Placebo 0.3 mg 1.0 mg 3.0 mg 9.0 mg |

|
|
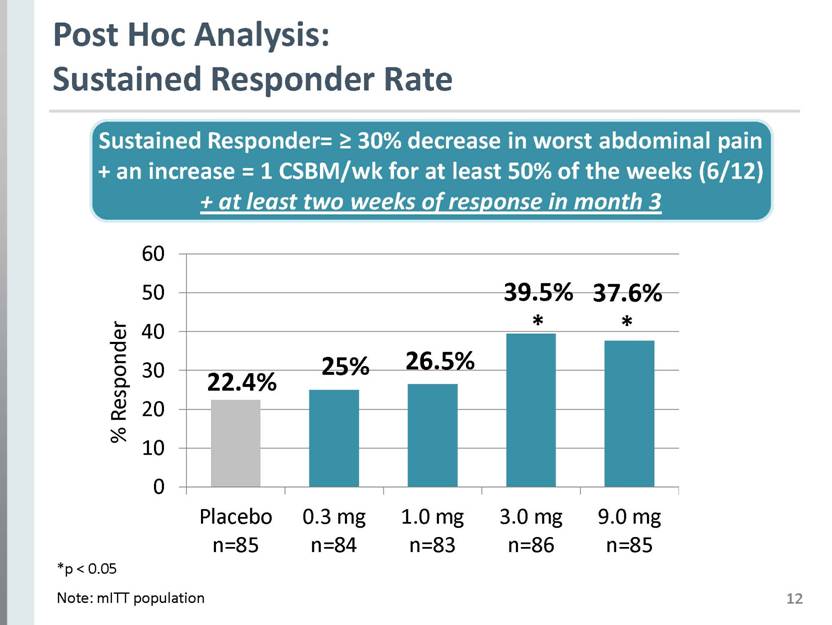
12 Post Hoc Analysis: Sustained Responder Rate 39.5% * 37.6% * 25% 22.4% Sustained Responder= > 30% decrease in worst abdominal pain + an increase = 1 CSBM/wk for at least 50% of the weeks (6/12) + at least two weeks of response in month 3 *p < 0.05 Note: mITT population 26.5% % Responder Placebo n=85 0.3 mg n=84 1.0 mg n=83 3.0 mg n=86 9.0 mg n=85 |
|
|
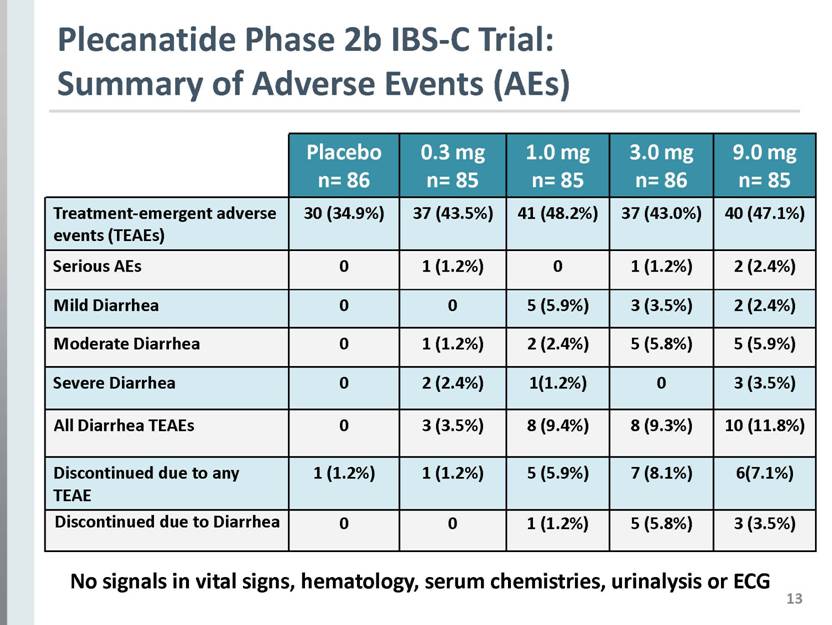
13 Plecanatide Phase 2b IBS-C Trial: Summary of Adverse Events (AEs) Placebo n= 86 0.3 mg n= 85 1.0 mg n= 85 3.0 mg n= 86 9.0 mg n= 85 Treatment-emergent adverse events (TEAEs) 30 (34.9%) 37 (43.5%) 41 (48.2%) 37 (43.0%) 40 (47.1%) Serious AEs 0 1 (1.2%) 0 1 (1.2%) 2 (2.4%) Mild Diarrhea 0 0 5 (5.9%) 3 (3.5%) 2 (2.4%) Moderate Diarrhea 0 1 (1.2%) 2 (2.4%) 5 (5.8%) 5 (5.9%) Severe Diarrhea 0 2 (2.4%) 1(1.2%) 0 3 (3.5%) All Diarrhea TEAEs 0 3 (3.5%) 8 (9.4%) 8 (9.3%) 10 (11.8%) Discontinued due to any TEAE 1 (1.2%) 1 (1.2%) 5 (5.9%) 7 (8.1%) 6(7.1%) Discontinued due to Diarrhea 0 0 1 (1.2%) 5 (5.8%) 3 (3.5%) No signals in vital signs, hematology, serum chemistries, urinalysis or ECG |
|
|
14 3.5% 9.4% 9.3% 11.8% IBS-C Phase 2b Trial CIC Phase 2b Trial 9.7% 8.4% 5.5% 1.3% Note: This is a cross trial comparison. Plecanatide phase 2b CIC trial did not include 9.0 mg dose. Plecanatide: Consistent Tolerability Profile for CIC & IBS-C % Diarrhea Placebo n=236 0.3 mg n=237 1.0 mg n=238 3.0 mg n=237 Placebo n=86 0.3 mg n=85 1.0 mg n=85 3.0 mg n=86 9 mg n=85 |

|
|
15 Plecanatide Phase 2b IBS-C Trial: Data Confirm Efficacy, Safety & Unique Profile Plecanatide was safe, well tolerated and efficacious for treatment of IBS-C patients Trial confirms dose-response pharmacology Predictable treatment response: efficacy and safety observed in same dose range as CIC trials 3.0 and 6.0 mg doses selected for phase 3 IBS-C development (consistent with CIC) |
