Attached files
| file | filename |
|---|---|
| 8-K - 8-K - American Midstream Partners, LP | a8-kcostaracquisition.htm |
| EX-4.1 - EXHIBIT - American Midstream Partners, LP | ex41securitiesagreement.htm |
| EX-99.1 - EXHIBIT - American Midstream Partners, LP | ex991pressreleasecostar.htm |
| EX-2.1 - EXHIBIT - American Midstream Partners, LP | ex21costarpsa.htm |
| EX-99.2 - EXHIBIT - American Midstream Partners, LP | ex992investorpresentation.htm |
Investor Presentation October 2014
Cautionary Statement 2 This presentation includes forward-looking statements. These statements relate to, among other things, projections of operational volumetrics and improvements, growth projects, cash flows and capital expenditures. We have used the words "anticipate,” "believe," "could," "estimate," "expect," "intend," "may," "plan," "predict," "project," "should," "will," "potential," and similar terms and phrases to identify forward-looking statements in this presentation. Although we believe the assumptions upon which these forward-looking statements are based are reasonable, any of these assumptions could prove to be inaccurate and the forward-looking statements based on these assumptions could be incorrect. Our operations involve risks and uncertainties, many of which are outside our control, and any one of which, or a combination of which, could materially affect our results of operations and whether the forward-looking statements ultimately prove to be correct. Actual results and trends in the future may differ materially from those suggested or implied by the forward-looking statements depending on a variety of factors which are described in greater detail in our filings with the SEC. The closing of the acquisitions described in this presentation are subject to negotiation of definitive acquisition agreements and other conditions beyond our control. The construction of the projects described is subject to risks beyond our control including cost overruns and delays resulting from numerous factors. In addition, if we consummate either or both of the acquisitions described in this presentation, we face risks associated with the integration of the business, decreased liquidity, increased interest and other expenses, assumption of potential liabilities, diversion of management’s attention, and other risks associated with acquisitions and growth. Please see our Risk Factor disclosures included in our Annual Report on Form 10-K for the year ended December 31, 2013 filed on March 11, 2014 and our Quarterly Report on Form 10-Q for the quarter ended June 30, 2014 filed on August 11, 2014. All future written and oral forward-looking statements attributable to us or persons acting on our behalf are expressly qualified in their entirety by the previous statements. We undertake no obligation to update any information contained herein or to publicly release the results of any revisions to any forward- looking statements that may be made to reflect events or circumstances that occur, or that we become aware of, after the date of this presentation.
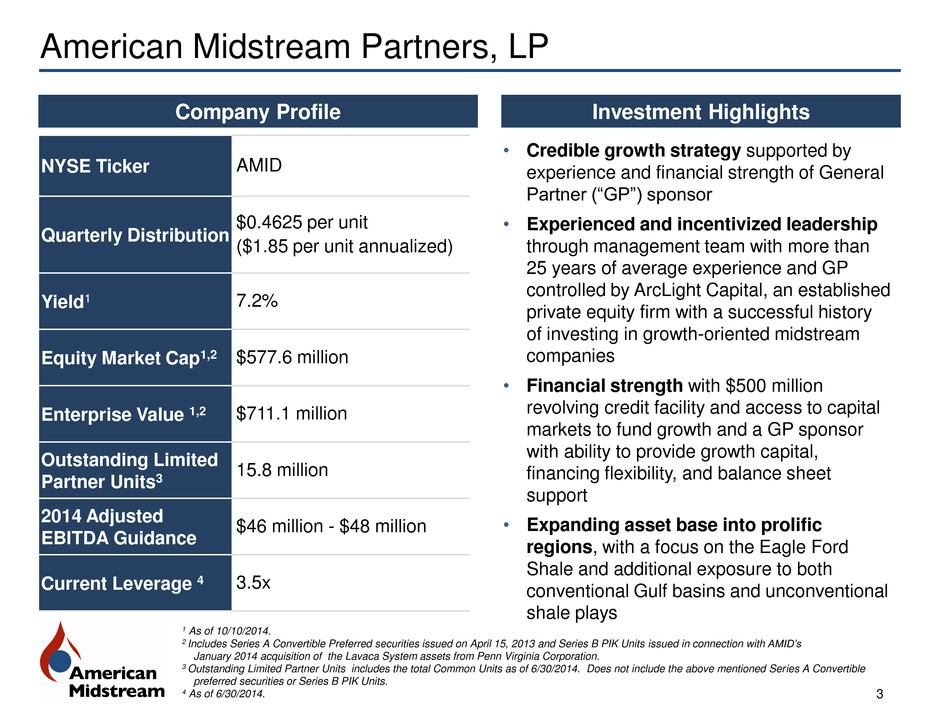
American Midstream Partners, LP 3 • Credible growth strategy supported by experience and financial strength of General Partner (“GP”) sponsor • Experienced and incentivized leadership through management team with more than 25 years of average experience and GP controlled by ArcLight Capital, an established private equity firm with a successful history of investing in growth-oriented midstream companies • Financial strength with $500 million revolving credit facility and access to capital markets to fund growth and a GP sponsor with ability to provide growth capital, financing flexibility, and balance sheet support • Expanding asset base into prolific regions, with a focus on the Eagle Ford Shale and additional exposure to both conventional Gulf basins and unconventional shale plays Investment Highlights Company Profile NYSE Ticker AMID Quarterly Distribution $0.4625 per unit ($1.85 per unit annualized) Yield1 7.2% Equity Market Cap1,2 $577.6 million Enterprise Value 1,2 $711.1 million Outstanding Limited Partner Units3 15.8 million 2014 Adjusted EBITDA Guidance $46 million - $48 million Current Leverage 4 3.5x 1 As of 10/10/2014. 2 Includes Series A Convertible Preferred securities issued on April 15, 2013 and Series B PIK Units issued in connection with AMID’s January 2014 acquisition of the Lavaca System assets from Penn Virginia Corporation. 3 Outstanding Limited Partner Units includes the total Common Units as of 6/30/2014. Does not include the above mentioned Series A Convertible preferred securities or Series B PIK Units. 4 As of 6/30/2014.
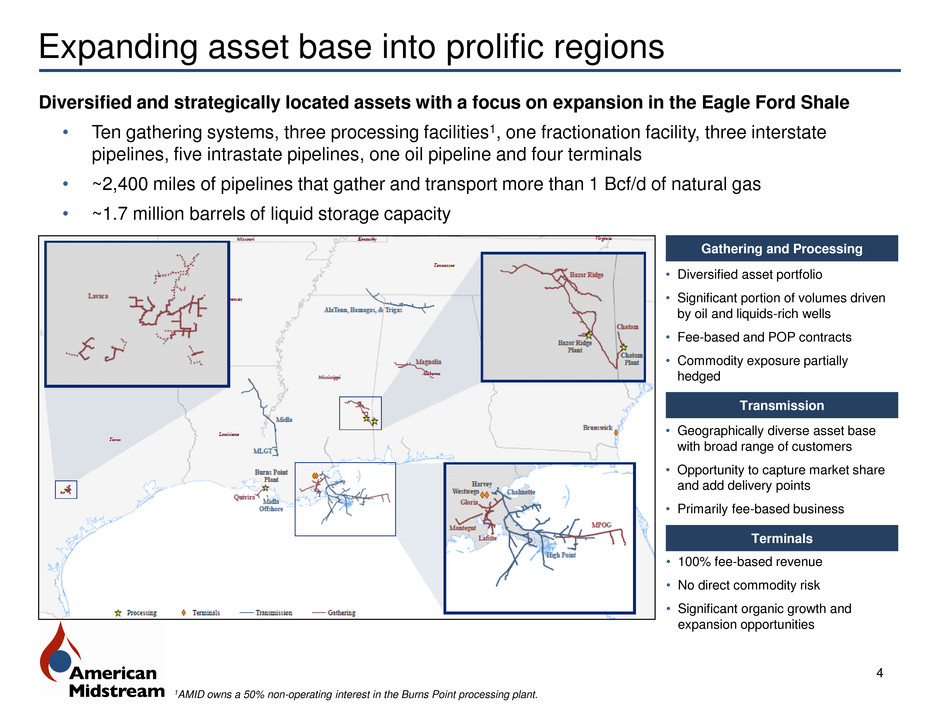
Expanding asset base into prolific regions 4 Gathering and Processing • Diversified asset portfolio • Significant portion of volumes driven by oil and liquids-rich wells • Fee-based and POP contracts • Commodity exposure partially hedged Transmission • Geographically diverse asset base with broad range of customers • Opportunity to capture market share and add delivery points • Primarily fee-based business Terminals • 100% fee-based revenue • No direct commodity risk • Significant organic growth and expansion opportunities 1AMID owns a 50% non-operating interest in the Burns Point processing plant. Diversified and strategically located assets with a focus on expansion in the Eagle Ford Shale • Ten gathering systems, three processing facilities1, one fractionation facility, three interstate pipelines, five intrastate pipelines, one oil pipeline and four terminals • ~2,400 miles of pipelines that gather and transport more than 1 Bcf/d of natural gas • ~1.7 million barrels of liquid storage capacity
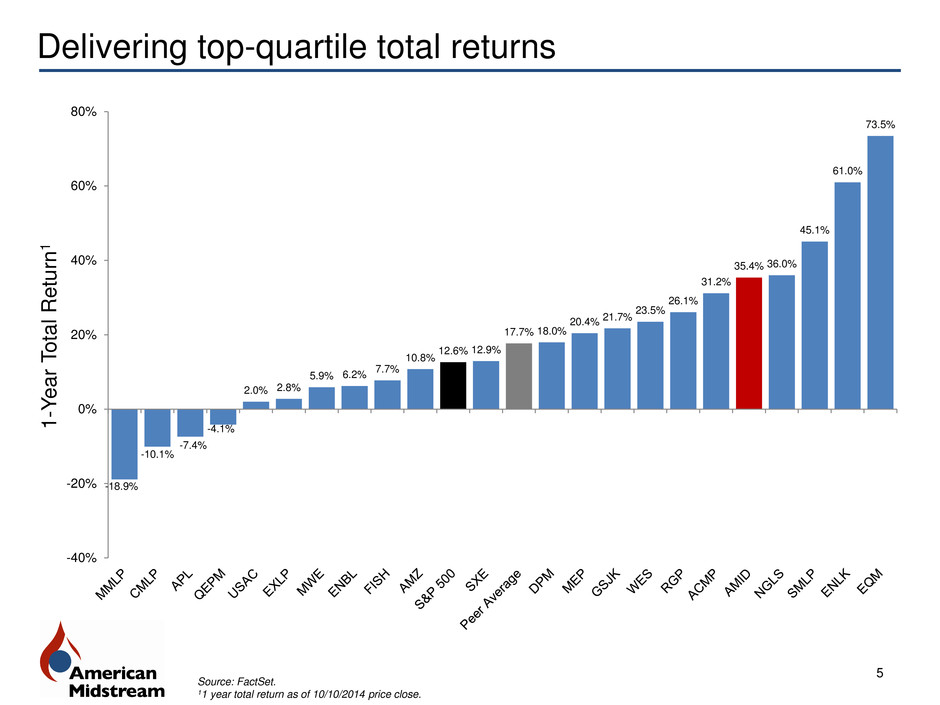
-18.9% -10.1% -7.4% -4.1% 2.0% 2.8% 5.9% 6.2% 7.7% 10.8% 12.6% 12.9% 17.7% 18.0% 20.4% 21.7% 23.5% 26.1% 31.2% 35.4% 36.0% 45.1% 61.0% 73.5% -40% -20% 0% 20% 40% 60% 80% Delivering top-quartile total returns 5 1 -Y ear T ota l Retur n 1 Source: FactSet. 11 year total return as of 10/10/2014 price close.

Growth strategy 6 Bolt-ons / Drop-downs • Acquire nearby assets to consolidate operations, increase scale, and expand service offerings • General Partner may drop down portfolio-owned or acquired assets Optimization and Expansion • Aggressively pursue new well connections, interconnects, and markets • Optimize available capacity with minimal capital requirements • Expand key assets to enhance competitive position New Asset Development • Establish or acquire new asset platforms within or outside of existing geographic footprint
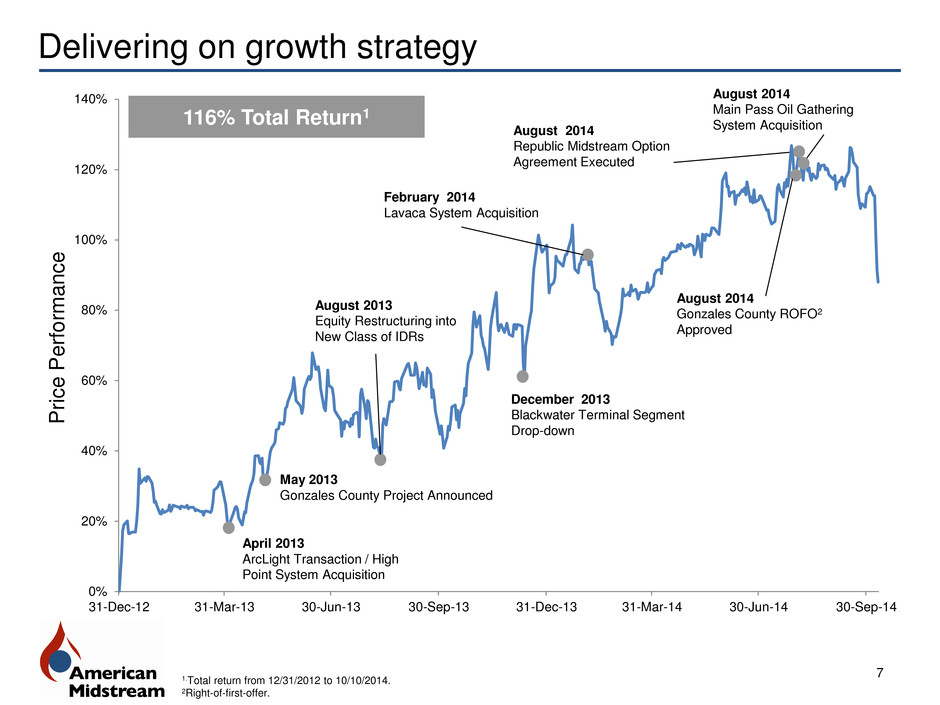
Delivering on growth strategy 7 1.Total return from 12/31/2012 to 10/10/2014. 2Right-of-first-offer. 0% 20% 40% 60% 80% 100% 120% 140% 31-Dec-12 31-Mar-13 30-Jun-13 30-Sep-13 31-Dec-13 31-Mar-14 30-Jun-14 30-Sep-14 December 2013 Blackwater Terminal Segment Drop-down February 2014 Lavaca System Acquisition August 2014 Main Pass Oil Gathering System Acquisition August 2014 Republic Midstream Option Agreement Executed August 2014 Gonzales County ROFO2 Approved April 2013 ArcLight Transaction / High Point System Acquisition May 2013 Gonzales County Project Announced August 2013 Equity Restructuring into New Class of IDRs Pr ic e P e rfo rman c e 116% Total Return1
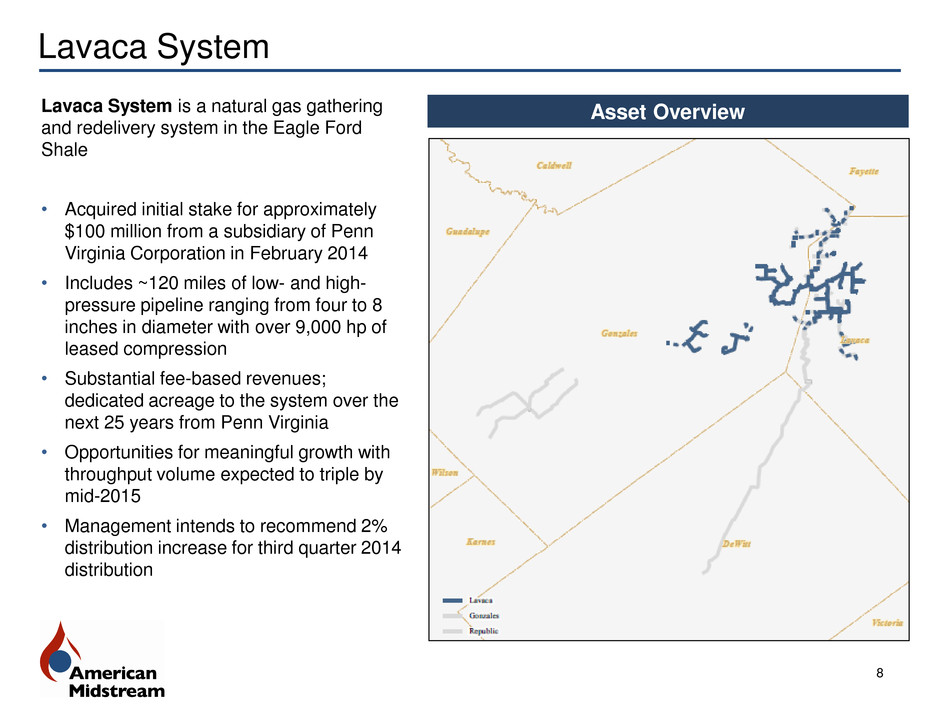
Lavaca System 8 Asset Overview Lavaca System is a natural gas gathering and redelivery system in the Eagle Ford Shale • Acquired initial stake for approximately $100 million from a subsidiary of Penn Virginia Corporation in February 2014 • Includes ~120 miles of low- and high- pressure pipeline ranging from four to 8 inches in diameter with over 9,000 hp of leased compression • Substantial fee-based revenues; dedicated acreage to the system over the next 25 years from Penn Virginia • Opportunities for meaningful growth with throughput volume expected to triple by mid-2015 • Management intends to recommend 2% distribution increase for third quarter 2014 distribution

Gonzales County 9 Asset Overview Gonzales County is a full-well-stream gathering system in the Eagle Ford Shale • Board of Directors of the General Partner of Partnership approved AMID’s Right-of- first-offer to acquire the system for total consideration not to exceed $110 million • $100 million total capital committed for construction by an affiliate of the General Partner • Includes full-well-stream gathering system and treating infrastructure to manage oil, gas, and water production, including water disposal • Initial design capacity is 95,000 bbls/d of crude oil / water and 15 MMCF/d of natural gas • Midstream services provided to Forest Oil Corporation under long-term, fee-based agreement • Drop-down expected late 2014 / early 2015
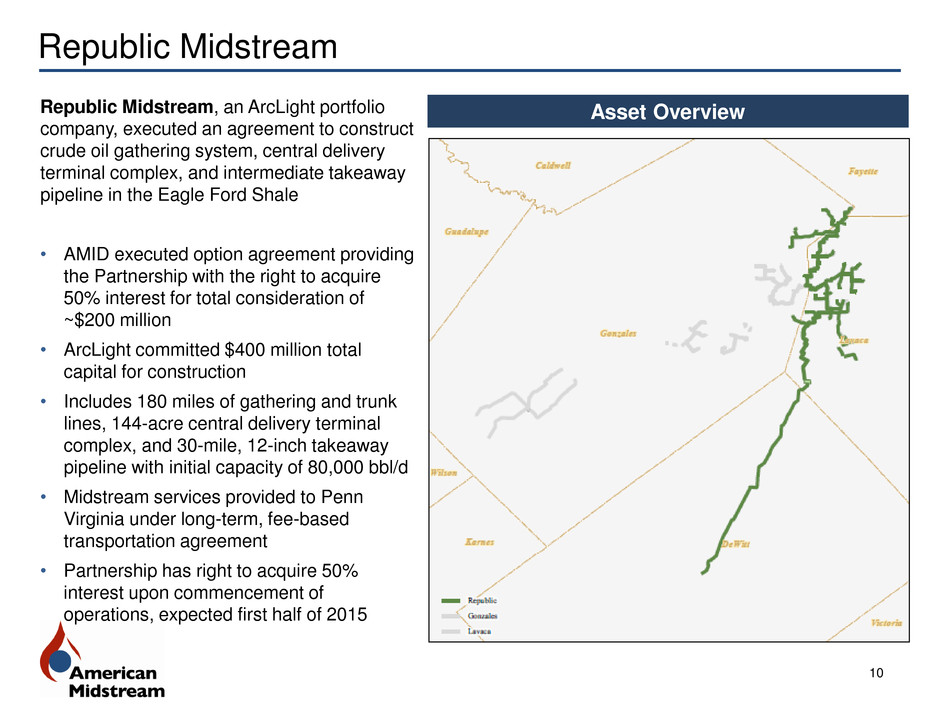
Republic Midstream 10 Asset Overview Republic Midstream, an ArcLight portfolio company, executed an agreement to construct crude oil gathering system, central delivery terminal complex, and intermediate takeaway pipeline in the Eagle Ford Shale • AMID executed option agreement providing the Partnership with the right to acquire 50% interest for total consideration of ~$200 million • ArcLight committed $400 million total capital for construction • Includes 180 miles of gathering and trunk lines, 144-acre central delivery terminal complex, and 30-mile, 12-inch takeaway pipeline with initial capacity of 80,000 bbl/d • Midstream services provided to Penn Virginia under long-term, fee-based transportation agreement • Partnership has right to acquire 50% interest upon commencement of operations, expected first half of 2015
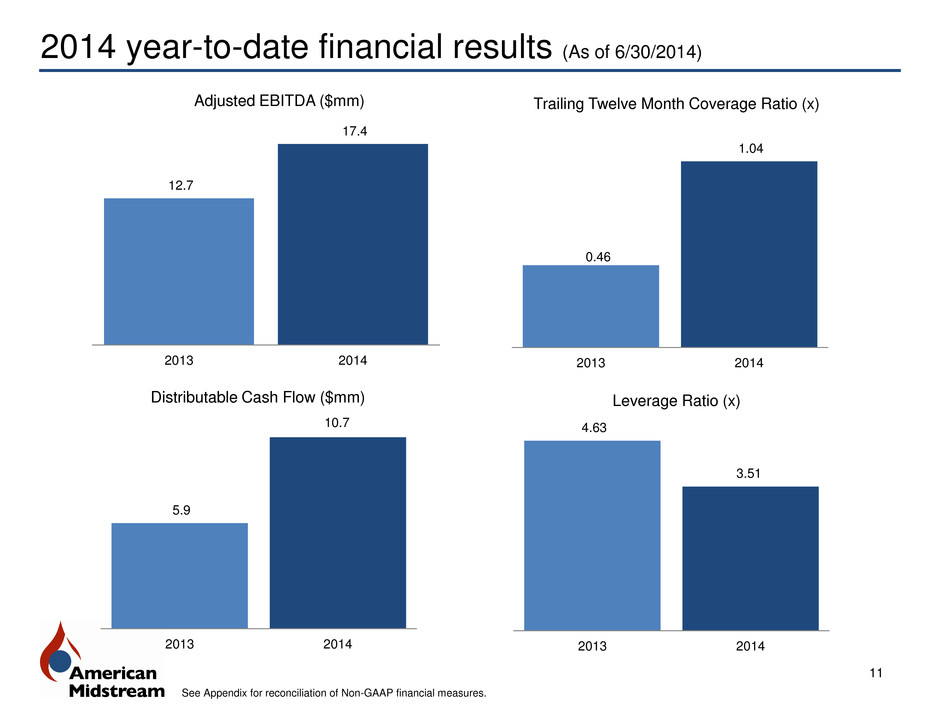
2014 year-to-date financial results (As of 6/30/2014) 11 See Appendix for reconciliation of Non-GAAP financial measures. 12.7 17.4 2013 2014 Adjusted EBITDA ($mm) 5.9 10.7 2013 2014 Distributable Cash Flow ($mm) 0.46 1.04 2013 2014 Trailing Twelve Month Coverage Ratio (x) 4.63 3.51 2013 2014 Leverage Ratio (x)
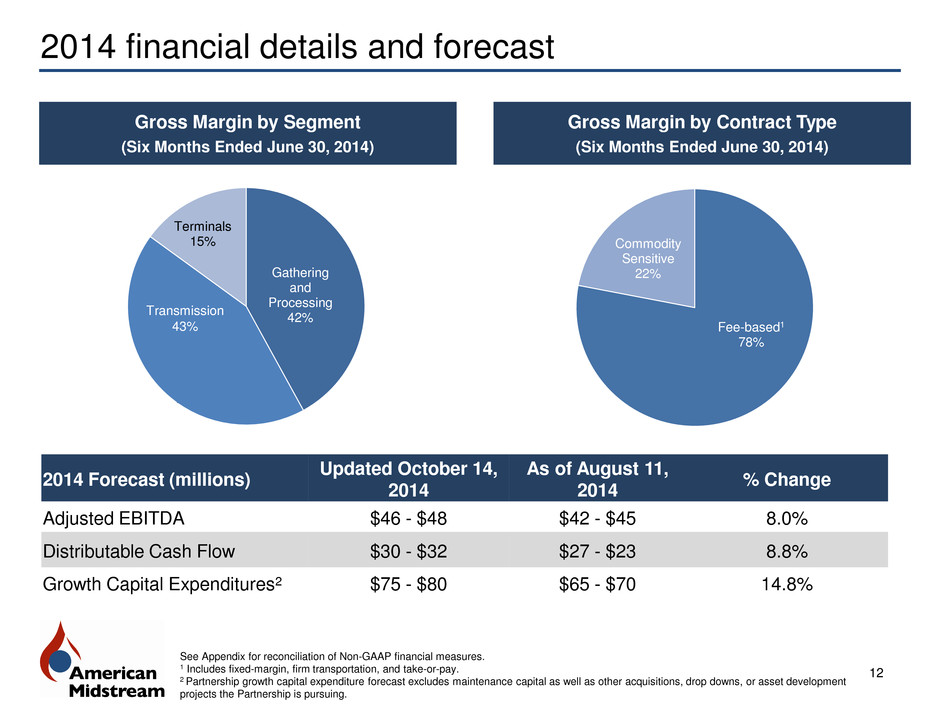
Fee-based1 78% Commodity Sensitive 22% 2014 financial details and forecast 12 Gross Margin by Contract Type (Six Months Ended June 30, 2014) Gross Margin by Segment (Six Months Ended June 30, 2014) See Appendix for reconciliation of Non-GAAP financial measures. 1 Includes fixed-margin, firm transportation, and take-or-pay. 2 Partnership growth capital expenditure forecast excludes maintenance capital as well as other acquisitions, drop downs, or asset development projects the Partnership is pursuing. Gathering and Processing 42% Terminals 15% Transmission 43% 2014 Forecast (millions) Updated October 14, 2014 As of August 11, 2014 % Change Adjusted EBITDA $46 - $48 $42 - $45 8.0% Distributable Cash Flow $30 - $32 $27 - $23 8.8% Growth Capital Expenditures2 $75 - $80 $65 - $70 14.8%
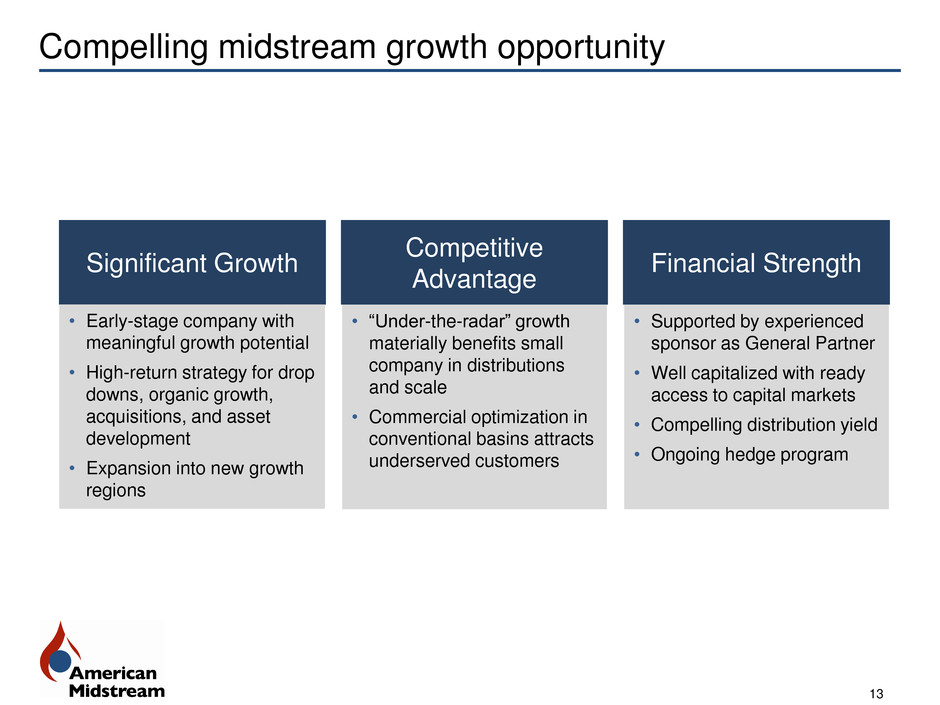
Compelling midstream growth opportunity 13 Competitive Advantage • “Under-the-radar” growth materially benefits small company in distributions and scale • Commercial optimization in conventional basins attracts underserved customers Financial Strength • Supported by experienced sponsor as General Partner • Well capitalized with ready access to capital markets • Compelling distribution yield • Ongoing hedge program Significant Growth • Early-stage company with meaningful growth potential • High-return strategy for drop downs, organic growth, acquisitions, and asset development • Expansion into new growth regions

Appendix
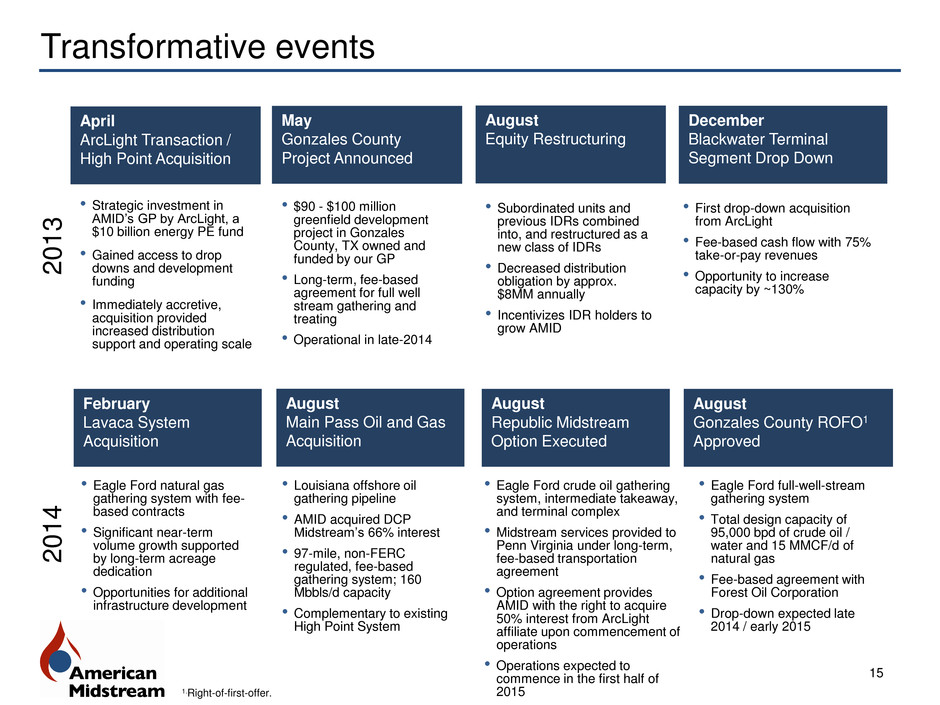
Transformative events 15 • Strategic investment in AMID’s GP by ArcLight, a $10 billion energy PE fund • Gained access to drop downs and development funding • Immediately accretive, acquisition provided increased distribution support and operating scale • $90 - $100 million greenfield development project in Gonzales County, TX owned and funded by our GP • Long-term, fee-based agreement for full well stream gathering and treating • Operational in late-2014 • Subordinated units and previous IDRs combined into, and restructured as a new class of IDRs • Decreased distribution obligation by approx. $8MM annually • Incentivizes IDR holders to grow AMID December Blackwater Terminal Segment Drop Down • First drop-down acquisition from ArcLight • Fee-based cash flow with 75% take-or-pay revenues • Opportunity to increase capacity by ~130% February Lavaca System Acquisition • Eagle Ford natural gas gathering system with fee- based contracts • Significant near-term volume growth supported by long-term acreage dedication • Opportunities for additional infrastructure development August Main Pass Oil and Gas Acquisition • Louisiana offshore oil gathering pipeline • AMID acquired DCP Midstream’s 66% interest • 97-mile, non-FERC regulated, fee-based gathering system; 160 Mbbls/d capacity • Complementary to existing High Point System August Republic Midstream Option Executed August Gonzales County ROFO1 Approved April ArcLight Transaction / High Point Acquisition May Gonzales County Project Announced August Equity Restructuring 2 0 1 4 2 0 1 3 • Eagle Ford crude oil gathering system, intermediate takeaway, and terminal complex • Midstream services provided to Penn Virginia under long-term, fee-based transportation agreement • Option agreement provides AMID with the right to acquire 50% interest from ArcLight affiliate upon commencement of operations • Operations expected to commence in the first half of 2015 • Eagle Ford full-well-stream gathering system • Total design capacity of 95,000 bpd of crude oil / water and 15 MMCF/d of natural gas • Fee-based agreement with Forest Oil Corporation • Drop-down expected late 2014 / early 2015 1.Right-of-first-offer.

Eagle Ford Shale Assets 16
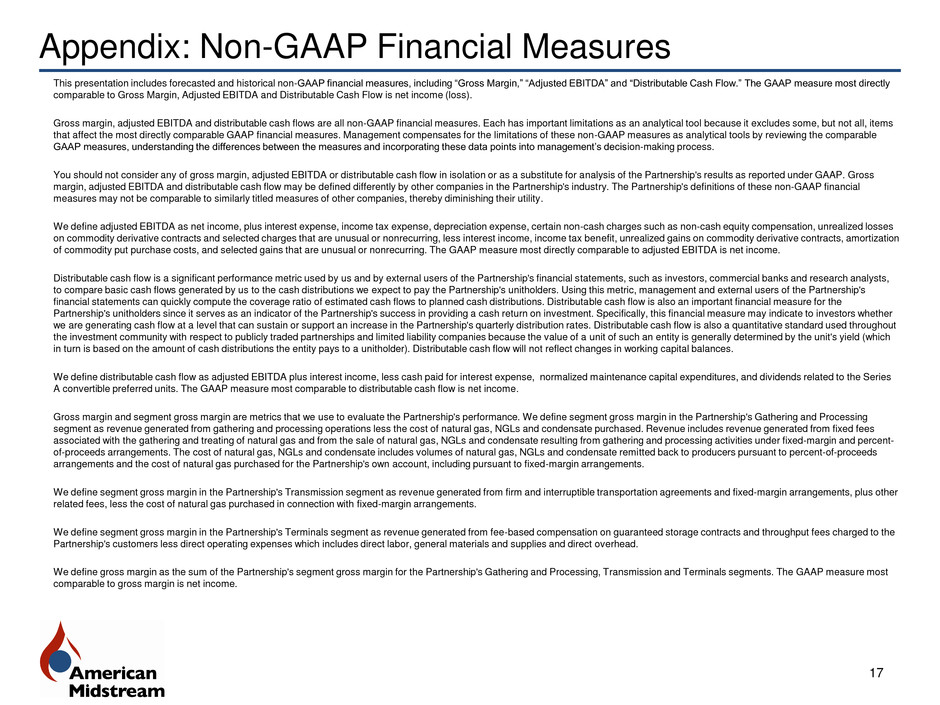
Appendix: Non-GAAP Financial Measures 17 This presentation includes forecasted and historical non-GAAP financial measures, including “Gross Margin,” “Adjusted EBITDA” and “Distributable Cash Flow.” The GAAP measure most directly comparable to Gross Margin, Adjusted EBITDA and Distributable Cash Flow is net income (loss). Gross margin, adjusted EBITDA and distributable cash flows are all non-GAAP financial measures. Each has important limitations as an analytical tool because it excludes some, but not all, items that affect the most directly comparable GAAP financial measures. Management compensates for the limitations of these non-GAAP measures as analytical tools by reviewing the comparable GAAP measures, understanding the differences between the measures and incorporating these data points into management’s decision-making process. You should not consider any of gross margin, adjusted EBITDA or distributable cash flow in isolation or as a substitute for analysis of the Partnership's results as reported under GAAP. Gross margin, adjusted EBITDA and distributable cash flow may be defined differently by other companies in the Partnership's industry. The Partnership's definitions of these non-GAAP financial measures may not be comparable to similarly titled measures of other companies, thereby diminishing their utility. We define adjusted EBITDA as net income, plus interest expense, income tax expense, depreciation expense, certain non-cash charges such as non-cash equity compensation, unrealized losses on commodity derivative contracts and selected charges that are unusual or nonrecurring, less interest income, income tax benefit, unrealized gains on commodity derivative contracts, amortization of commodity put purchase costs, and selected gains that are unusual or nonrecurring. The GAAP measure most directly comparable to adjusted EBITDA is net income. Distributable cash flow is a significant performance metric used by us and by external users of the Partnership's financial statements, such as investors, commercial banks and research analysts, to compare basic cash flows generated by us to the cash distributions we expect to pay the Partnership's unitholders. Using this metric, management and external users of the Partnership's financial statements can quickly compute the coverage ratio of estimated cash flows to planned cash distributions. Distributable cash flow is also an important financial measure for the Partnership's unitholders since it serves as an indicator of the Partnership's success in providing a cash return on investment. Specifically, this financial measure may indicate to investors whether we are generating cash flow at a level that can sustain or support an increase in the Partnership's quarterly distribution rates. Distributable cash flow is also a quantitative standard used throughout the investment community with respect to publicly traded partnerships and limited liability companies because the value of a unit of such an entity is generally determined by the unit's yield (which in turn is based on the amount of cash distributions the entity pays to a unitholder). Distributable cash flow will not reflect changes in working capital balances. We define distributable cash flow as adjusted EBITDA plus interest income, less cash paid for interest expense, normalized maintenance capital expenditures, and dividends related to the Series A convertible preferred units. The GAAP measure most comparable to distributable cash flow is net income. Gross margin and segment gross margin are metrics that we use to evaluate the Partnership's performance. We define segment gross margin in the Partnership's Gathering and Processing segment as revenue generated from gathering and processing operations less the cost of natural gas, NGLs and condensate purchased. Revenue includes revenue generated from fixed fees associated with the gathering and treating of natural gas and from the sale of natural gas, NGLs and condensate resulting from gathering and processing activities under fixed-margin and percent- of-proceeds arrangements. The cost of natural gas, NGLs and condensate includes volumes of natural gas, NGLs and condensate remitted back to producers pursuant to percent-of-proceeds arrangements and the cost of natural gas purchased for the Partnership's own account, including pursuant to fixed-margin arrangements. We define segment gross margin in the Partnership's Transmission segment as revenue generated from firm and interruptible transportation agreements and fixed-margin arrangements, plus other related fees, less the cost of natural gas purchased in connection with fixed-margin arrangements. We define segment gross margin in the Partnership's Terminals segment as revenue generated from fee-based compensation on guaranteed storage contracts and throughput fees charged to the Partnership's customers less direct operating expenses which includes direct labor, general materials and supplies and direct overhead. We define gross margin as the sum of the Partnership's segment gross margin for the Partnership's Gathering and Processing, Transmission and Terminals segments. The GAAP measure most comparable to gross margin is net income.
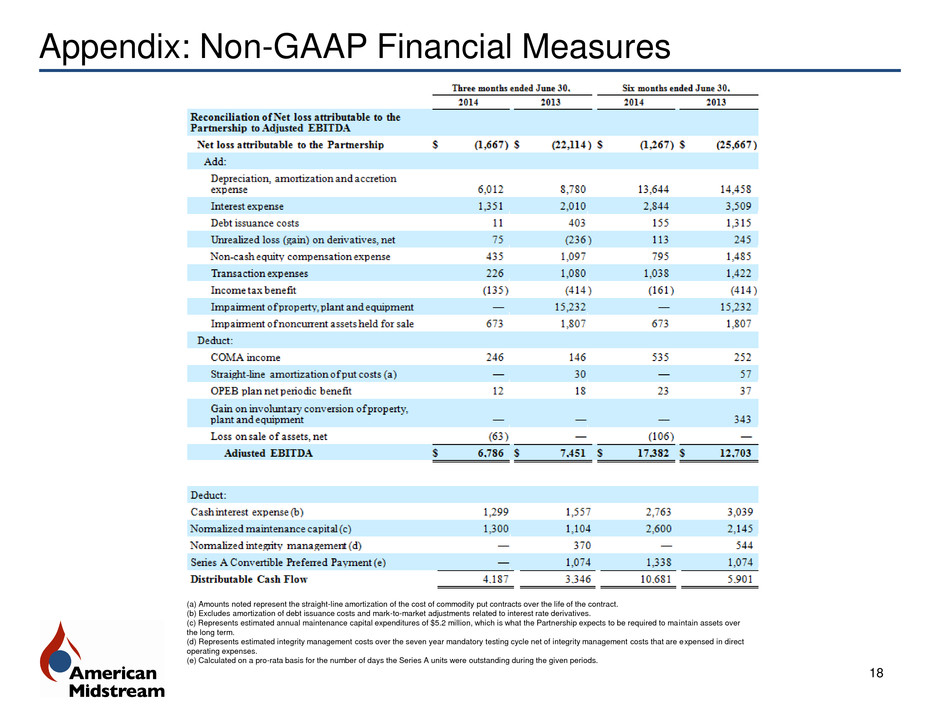
Appendix: Non-GAAP Financial Measures 18 (a) Amounts noted represent the straight-line amortization of the cost of commodity put contracts over the life of the contract. (b) Excludes amortization of debt issuance costs and mark-to-market adjustments related to interest rate derivatives. (c) Represents estimated annual maintenance capital expenditures of $5.2 million, which is what the Partnership expects to be required to maintain assets over the long term. (d) Represents estimated integrity management costs over the seven year mandatory testing cycle net of integrity management costs that are expensed in direct operating expenses. (e) Calculated on a pro-rata basis for the number of days the Series A units were outstanding during the given periods.
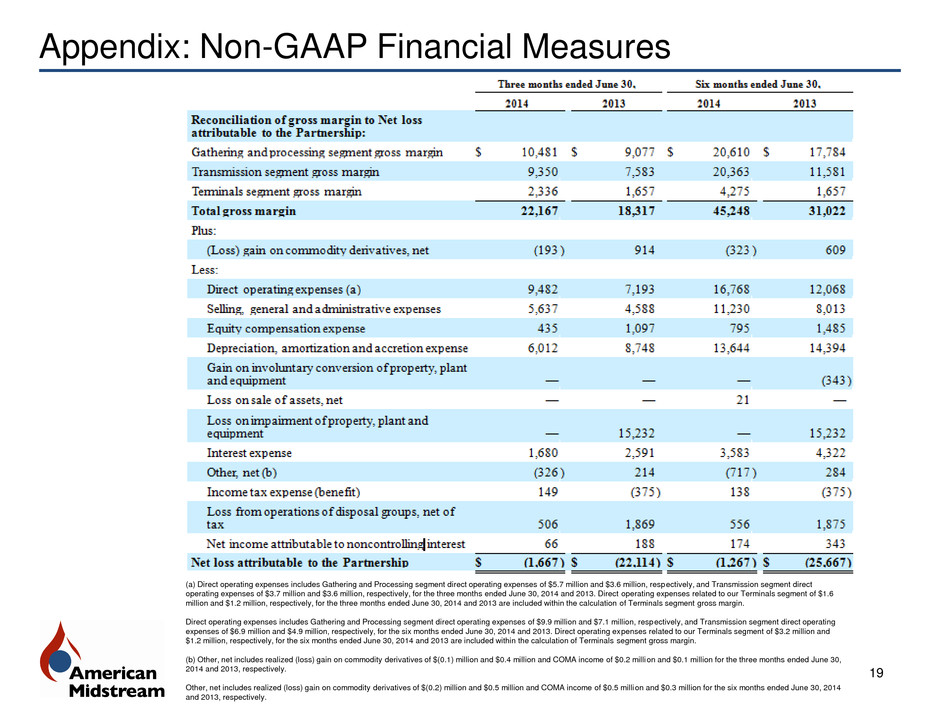
19 Appendix: Non-GAAP Financial Measures (a) Direct operating expenses includes Gathering and Processing segment direct operating expenses of $5.7 million and $3.6 million, respectively, and Transmission segment direct operating expenses of $3.7 million and $3.6 million, respectively, for the three months ended June 30, 2014 and 2013. Direct operating expenses related to our Terminals segment of $1.6 million and $1.2 million, respectively, for the three months ended June 30, 2014 and 2013 are included within the calculation of Terminals segment gross margin. Direct operating expenses includes Gathering and Processing segment direct operating expenses of $9.9 million and $7.1 million, respectively, and Transmission segment direct operating expenses of $6.9 million and $4.9 million, respectively, for the six months ended June 30, 2014 and 2013. Direct operating expenses related to our Terminals segment of $3.2 million and $1.2 million, respectively, for the six months ended June 30, 2014 and 2013 are included within the calculation of Terminals segment gross margin. (b) Other, net includes realized (loss) gain on commodity derivatives of $(0.1) million and $0.4 million and COMA income of $0.2 million and $0.1 million for the three months ended June 30, 2014 and 2013, respectively. Other, net includes realized (loss) gain on commodity derivatives of $(0.2) million and $0.5 million and COMA income of $0.5 million and $0.3 million for the six months ended June 30, 2014 and 2013, respectively.
