Attached files
| file | filename |
|---|---|
| 8-K - 8-K - American Midstream Partners, LP | a8-kcostaracquisition.htm |
| EX-4.1 - EXHIBIT - American Midstream Partners, LP | ex41securitiesagreement.htm |
| EX-99.3 - EXHIBIT - American Midstream Partners, LP | ex993amidinvestorpre.htm |
| EX-99.1 - EXHIBIT - American Midstream Partners, LP | ex991pressreleasecostar.htm |
| EX-2.1 - EXHIBIT - American Midstream Partners, LP | ex21costarpsa.htm |
Costar Midstream, LLC Acquisition Overview
Cautionary Statement This presentation includes forward-looking statements. These statements relate to, among other things, projections of operational volumetrics and improvements, growth projects, cash flows and capital expenditures. We have used the words "anticipate,” "believe," "could," "estimate," "expect," "intend," "may," "plan," "predict," "project," "should," "will," "potential," and similar terms and phrases to identify forward-looking statements in this presentation. Although we believe the assumptions upon which these forward-looking statements are based are reasonable, any of these assumptions could prove to be inaccurate and the forward-looking statements based on these assumptions could be incorrect. Our operations involve risks and uncertainties, many of which are outside our control, and any one of which, or a combination of which, could materially affect our results of operations and whether the forward-looking statements ultimately prove to be correct. Actual results and trends in the future may differ materially from those suggested or implied by the forward-looking statements depending on a variety of factors which are described in greater detail in our filings with the SEC. The integration of the acquisition and the construction of the projects described herein are subject to risks beyond our control including cost overruns and delays resulting from numerous factors. In addition, we face risks associated with the integration of the business, decreased liquidity, increased interest and other expenses, assumption of potential liabilities, diversion of management’s attention, and other risks associated with acquisitions and growth. Please see our Risk Factor disclosures included in our Annual Report on Form 10-K for the year ended December 31, 2013 filed on March 11, 2014 and our Quarterly Report on Form 10-Q for the quarter ended June 30, 2014 filed on August 11, 2014. All future written and oral forward-looking statements attributable to us or persons acting on our behalf are expressly qualified in their entirety by the previous statements. We undertake no obligation to update any information contained herein or to publicly release the results of any revisions to any forward- looking statements that may be made to reflect events or circumstances that occur, or that we become aware of, after the date of this presentation. 2

Costar Midstream Overview 3 Onshore gathering and processing company with its primary gathering, processing, fractionation, and off-spec condensate treating and stabilization assets in East Texas and the prolific Permian basin, with a significant crude oil gathering system project underway in the Bakken oil play Founded by management and Energy Spectrum • Acquired Gas Solutions II Ltd and its East Texas gathering, processing and off-spec condensate treating business in 2012 from Prospect Capital • Kevin Sullivan, Managing Partner – Prior to Costar, founded American Central Gas Co., GED Gas Resources and American Compression Leasing Company • Bob Bourne, President of Gas Solutions – 30 years of energy industry experience, served as President and CEO of Gas Solutions II Ltd. and was a founding member of Coral Energy • Steve Kennedy, SVP of Gas Solutions – 30 years of experience in the energy industry, previously with ARCO Oil and Gas before joining Gas Solutions II Ltd. in 2000 Strategic Value for American Midstream • Midstream asset platforms in East Texas, the Bakken and the Permian – Opportunities for bolt-on development projects and acquisitions • Expand service offerings – Significant entry into the condensate treating and stabilization business • Creation of a condensate treating and blending hub in East Texas – Addition of rail terminal significantly expands access to new supply and markets • Addition of management team with a track record of sourcing new opportunities and creating significant value
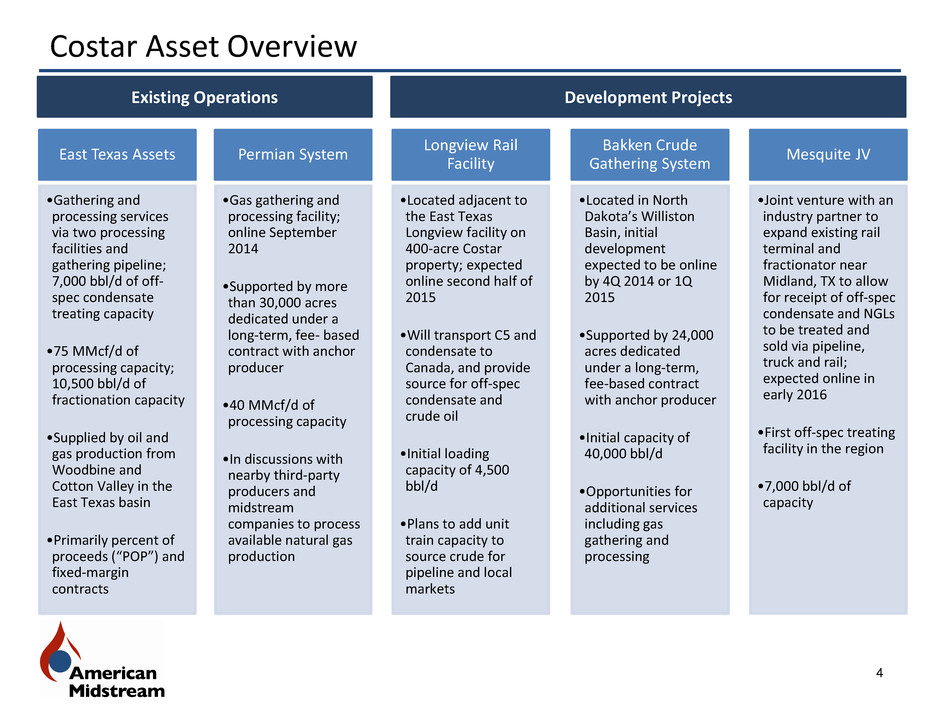
Costar Asset Overview 4 East Texas Assets •Gathering and processing services via two processing facilities and gathering pipeline; 7,000 bbl/d of off- spec condensate treating capacity •75 MMcf/d of processing capacity; 10,500 bbl/d of fractionation capacity •Supplied by oil and gas production from Woodbine and Cotton Valley in the East Texas basin •Primarily percent of proceeds (“POP”) and fixed-margin contracts Permian System •Gas gathering and processing facility; online September 2014 •Supported by more than 30,000 acres dedicated under a long-term, fee- based contract with anchor producer •40 MMcf/d of processing capacity •In discussions with nearby third-party producers and midstream companies to process available natural gas production Bakken Crude Gathering System •Located in North Dakota’s Williston Basin, initial development expected to be online by 4Q 2014 or 1Q 2015 •Supported by 24,000 acres dedicated under a long-term, fee-based contract with anchor producer •Initial capacity of 40,000 bbl/d •Opportunities for additional services including gas gathering and processing Longview Rail Facility •Located adjacent to the East Texas Longview facility on 400-acre Costar property; expected online second half of 2015 •Will transport C5 and condensate to Canada, and provide source for off-spec condensate and crude oil •Initial loading capacity of 4,500 bbl/d •Plans to add unit train capacity to source crude for pipeline and local markets Mesquite JV •Joint venture with an industry partner to expand existing rail terminal and fractionator near Midland, TX to allow for receipt of off-spec condensate and NGLs to be treated and sold via pipeline, truck and rail; expected online in early 2016 •First off-spec treating facility in the region •7,000 bbl/d of capacity Existing Operations Development Projects
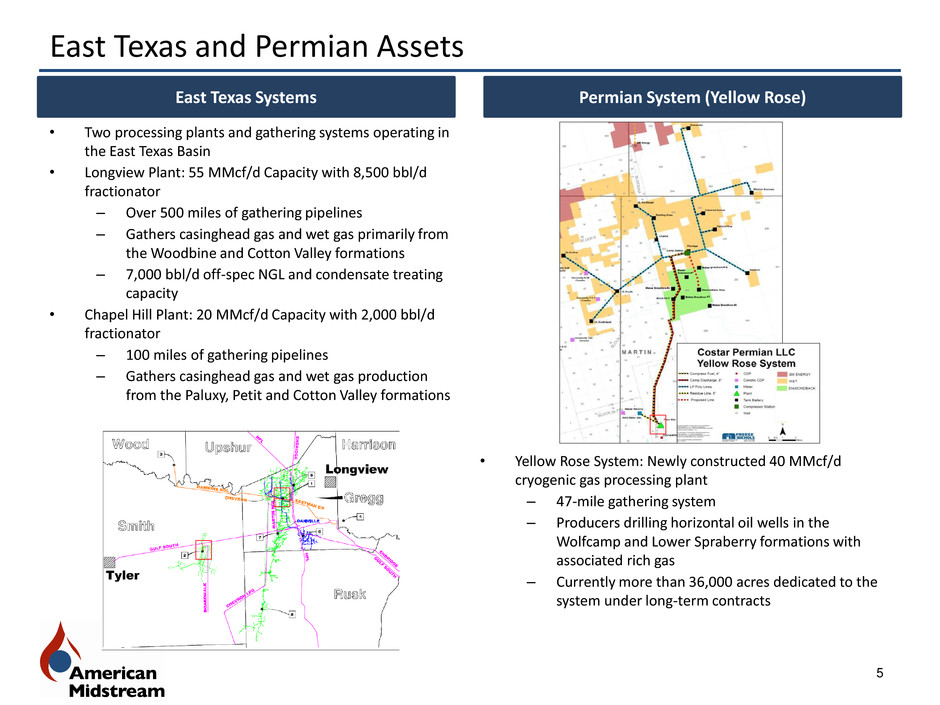
East Texas and Permian Assets 5 • Two processing plants and gathering systems operating in the East Texas Basin • Longview Plant: 55 MMcf/d Capacity with 8,500 bbl/d fractionator – Over 500 miles of gathering pipelines – Gathers casinghead gas and wet gas primarily from the Woodbine and Cotton Valley formations – 7,000 bbl/d off-spec NGL and condensate treating capacity • Chapel Hill Plant: 20 MMcf/d Capacity with 2,000 bbl/d fractionator – 100 miles of gathering pipelines – Gathers casinghead gas and wet gas production from the Paluxy, Petit and Cotton Valley formations East Texas Systems Permian System (Yellow Rose) • Yellow Rose System: Newly constructed 40 MMcf/d cryogenic gas processing plant – 47-mile gathering system – Producers drilling horizontal oil wells in the Wolfcamp and Lower Spraberry formations with associated rich gas – Currently more than 36,000 acres dedicated to the system under long-term contracts

G&P 61% Terminals 10% Fee-based1 78% Commodity Sensitive 22%3 2014 Financial Forecast 6 Gross Margin by Contract Type (Six Months Ended June 30, 2014) Gross Margin by Segment (Six Months Ended June 30, 2014) 2014 Forecast (millions) As of October 13, 2014 Previous % Change Adjusted EBITDA $46 - $48 $42 - $45 8.0% Distributable Cash Flow $30 - $32 $27 - $30 8.8% Growth Capital Expenditures2 $75 - $80 $65 - $70 14.8% See Appendix for reconciliation of Non-GAAP financial measures. 1 Includes fixed-margin, firm transportation, and take-or-pay. 2 Growth capital expenditure forecast excludes maintenance capital as well as other acquisitions, drop downs, or asset development projects the Partnership is pursuing. 3 American Midstream hedges a portion of its commodity exposure through product-specific hedges G&P 42% Terminals 15% Transmission 43% Fee-based1 67% Commodity Sensitive 33%3 Hi st o ri ca l A M ID P ro F o rma C o st ar Transmission 29%
Appendix: Non-GAAP Financial Measures 7 This presentation includes forecasted and historical non-GAAP financial measures, including “Gross Margin,” “Adjusted EBITDA” and “Distributable Cash Flow.” The GAAP measure most directly comparable to Gross Margin, Adjusted EBITDA and Distributable Cash Flow is net income (loss). Gross margin, adjusted EBITDA and distributable cash flows are all non-GAAP financial measures. Each has important limitations as an analytical tool because it excludes some, but not all, items that affect the most directly comparable GAAP financial measures. Management compensates for the limitations of these non-GAAP measures as analytical tools by reviewing the comparable GAAP measures, understanding the differences between the measures and incorporating these data points into management’s decision-making process. You should not consider any of gross margin, adjusted EBITDA or distributable cash flow in isolation or as a substitute for analysis of the Partnership's results as reported under GAAP. Gross margin, adjusted EBITDA and distributable cash flow may be defined differently by other companies in the Partnership's industry. The Partnership's definitions of these non-GAAP financial measures may not be comparable to similarly titled measures of other companies, thereby diminishing their utility. We define adjusted EBITDA as net income, plus interest expense, income tax expense, depreciation expense, certain non-cash charges such as non-cash equity compensation, unrealized losses on commodity derivative contracts and selected charges that are unusual or nonrecurring, less interest income, income tax benefit, unrealized gains on commodity derivative contracts, amortization of commodity put purchase costs, and selected gains that are unusual or nonrecurring. The GAAP measure most directly comparable to adjusted EBITDA is net income. Distributable cash flow is a significant performance metric used by us and by external users of the Partnership's financial statements, such as investors, commercial banks and research analysts, to compare basic cash flows generated by us to the cash distributions we expect to pay the Partnership's unitholders. Using this metric, management and external users of the Partnership's financial statements can quickly compute the coverage ratio of estimated cash flows to planned cash distributions. Distributable cash flow is also an important financial measure for the Partnership's unitholders since it serves as an indicator of the Partnership's success in providing a cash return on investment. Specifically, this financial measure may indicate to investors whether we are generating cash flow at a level that can sustain or support an increase in the Partnership's quarterly distribution rates. Distributable cash flow is also a quantitative standard used throughout the investment community with respect to publicly traded partnerships and limited liability companies because the value of a unit of such an entity is generally determined by the unit's yield (which in turn is based on the amount of cash distributions the entity pays to a unitholder). Distributable cash flow will not reflect changes in working capital balances. We define distributable cash flow as adjusted EBITDA plus interest income, less cash paid for interest expense, normalized maintenance capital expenditures, and dividends related to the Series A convertible preferred units. The GAAP measure most comparable to distributable cash flow is net income. Gross margin and segment gross margin are metrics that we use to evaluate the Partnership's performance. We define segment gross margin in the Partnership's Gathering and Processing segment as revenue generated from gathering and processing operations less the cost of natural gas, NGLs and condensate purchased. Revenue includes revenue generated from fixed fees associated with the gathering and treating of natural gas and from the sale of natural gas, NGLs and condensate resulting from gathering and processing activities under fixed-margin and percent-of-proceeds arrangements. The cost of natural gas, NGLs and condensate includes volumes of natural gas, NGLs and condensate remitted back to producers pursuant to percent-of-proceeds arrangements and the cost of natural gas purchased for the Partnership's own account, including pursuant to fixed-margin arrangements. We define segment gross margin in the Partnership's Transmission segment as revenue generated from firm and interruptible transportation agreements and fixed-margin arrangements, plus other related fees, less the cost of natural gas purchased in connection with fixed-margin arrangements. We define segment gross margin in the Partnership's Terminals segment as revenue generated from fee-based compensation on guaranteed storage contracts and throughput fees charged to the Partnership's customers less direct operating expenses which includes direct labor, general materials and supplies and direct overhead. We define gross margin as the sum of the Partnership's segment gross margin for the Partnership's Gathering and Processing, Transmission and Terminals segments. The GAAP measure most comparable to gross margin is net income.

Appendix: Non-GAAP Financial Measures 8 (a) Amounts noted represent the straight-line amortization of the cost of commodity put contracts over the life of the contract. (b) Excludes amortization of debt issuance costs and mark-to-market adjustments related to interest rate derivatives. (c) Represents estimated annual maintenance capital expenditures of $5.2 million, which is what the Partnership expects to be required to maintain assets over the long term. (d) Represents estimated integrity management costs over the seven year mandatory testing cycle net of integrity management costs that are expensed in direct operating expenses. (e) Calculated on a pro-rata basis for the number of days the Series A units were outstanding during the given periods.

9 Appendix: Non-GAAP Financial Measures (a) Direct operating expenses includes Gathering and Processing segment direct operating expenses of $5.7 million and $3.6 million, respectively, and Transmission segment direct operating expenses of $3.7 million and $3.6 million, respectively, for the three months ended June 30, 2014 and 2013. Direct operating expenses related to our Terminals segment of $1.6 million and $1.2 million, respectively, for the three months ended June 30, 2014 and 2013 are included within the calculation of Terminals segment gross margin. Direct operating expenses includes Gathering and Processing segment direct operating expenses of $9.9 million and $7.1 million, respectively, and Transmission segment direct operating expenses of $6.9 million and $4.9 million, respectively, for the six months ended June 30, 2014 and 2013. Direct operating expenses related to our Terminals segment of $3.2 million and $1.2 million, respectively, for the six months ended June 30, 2014 and 2013 are included within the calculation of Terminals segment gross margin. (b) Other, net includes realized (loss) gain on commodity derivatives of $(0.1) million and $0.4 million and COMA income of $0.2 million and $0.1 million for the three months ended June 30, 2014 and 2013, respectively. Other, net includes realized (loss) gain on commodity derivatives of $(0.2) million and $0.5 million and COMA income of $0.5 million and $0.3 million for the six months ended June 30, 2014 and 2013, respectively.
