Attached files
| file | filename |
|---|---|
| 8-K - 8-K - American Homes 4 Rent | a14-21228_18k.htm |
Exhibit 99.1
|
|
ABS East September 2014 |

|
|
1 Disclaimer The information in this presentation has been prepared solely for informational purposes. “We,” “AMH,” “AH4R,” “the Company,” “the REIT,” “our” and “us” refer to American Homes 4 Rent, a Maryland real estate investment trust, and its subsidiaries taken as a whole. “AH LLC” refers to American Homes 4 Rent, LLC, a Delaware limited liability company formed by B. Wayne Hughes, our founder and chairman of our board of trustees. AH LLC is the largest beneficial owner of our common shares (including units of our operating partnership, American Homes 4 Rent, L.P., that are exchangeable for common shares) and performs our acquisition and renovation functions (including providing us with exclusive access to related personnel), which it will continue to perform until December 2014, at which time we have the option to hire AH LLC’s acquisition and renovation personnel. Various statements contained in this presentation, including those that express a belief, expectation or intention, as well as those that are not statements of historical fact, are forward-looking statements. These forward-looking statements may include projections and estimates concerning the timing and success of our strategies, plans or intentions. Forward-looking statements are generally accompanied by words such as “estimate,” “project,” “predict,” “believe,” “expect,” “intend,” “anticipate,” “potential,” “plan,” “goal” or other words that convey the uncertainty of future events or outcomes. We have based these forward-looking statements on our current expectations and assumptions about future events. These assumptions include, among others, our projections and expectations regarding: market trends in the single-family home rental industry and in the local markets where we operate, our ability to institutionalize a historically fragmented business model, our business strengths, our ideal tenant profile, the quality and location of our properties in attractive neighborhoods, the scale advantage of our national platform and the superiority of our operational infrastructure, the effectiveness of our investment philosophy and diversified acquisition strategy, our ability to create a cash flow opportunity with attractive current yields and upside from increasing rents and cost efficiencies, our understanding of our competition and general economic, demographic and real estate conditions that may impact our business. While we consider these expectations and assumptions to be reasonable, they are inherently subject to significant business, economic, competitive, regulatory and other risks, contingencies and uncertainties, most of which are difficult to predict and many of which are beyond our control and could cause actual results to differ materially from any future results, performance or achievements expressed or implied by these forward-looking statements. Investors should not place undue reliance on these forward-looking statements, which speak only as of the date of this presentation. We undertake no obligation to update any forward-looking statements to conform to actual results or changes in our expectations, unless required by applicable law. For a further description of the risks and uncertainties that could cause actual results to differ from those expressed in these forward-looking statements, as well as risks relating to the business of the Company in general, see the "Risk Factors" disclosed in the Company's Annual Report on Form 10-K for the year ended December 31, 2013 and the Company's subsequent filings with the Securities and Exchange Commission." |

|
|
Securitization – Funding Tool 2 |

|
|
Securitization as a Funding Tool Overall Strategy American Homes 4 Rent (“AMH”) uses a variety of tools to diversify its capital structure: Equity Preferred equity Warehouse line of credit Securitization Structure AMH is focused on creating a cost efficient liability structure that allows the company to continue to maintain flexibility but takes advantage of the long term focus of the operator: Lengthening the maturity profile Reducing the interest rate volatility Reducing the refinancing risk Amortizing the upfront transaction costs 3 American Homes 4 Rent 2014-SFR2 AMH’s second securitization transaction was a 10 year fixed rate transaction, the first one of its kind in the single family rental space. Compared to their initial floating rate transaction, this fixed rate transaction: Reduces interest rate risk Reduces refinancing risk Allows the company to amortize the costs over a longer debt term The issuance of a 10-year fixed rated bond diversified our existing debt maturity profile, which includes an $800 million revolving credit facility due on September 2018 and an extant $481 million SFR bond with final maturity of June 2019 |

|
|
Securitization: AH4R 2014-SFR2 4 |

|
|
5 American Homes 4 Rent 2014-SFR2 $487,650,000 Single-Family Rental Securitization Transaction Overview AH4R 2014-SFR2, AH4R’s second securitization, is the single family rental industry’s first fixed rate deal. The 10 year securitization priced at a blended coupon of 4.42% on September 11, 2014. Bond Terms: WA Coupon: 4.42% Yield: 10 year swap + 181bps2 Loan Terms: 10 year fixed rate loan 1% annual amortization based on closing date balance 65.0%1 Cut-off Date LTV based on a BPO valuation of approximately $750.2 million Transaction Waterfall: Sequential payment of interest and principal Key Transaction Parties: Loan Originator / Seller: Goldman Sachs Mortgage Company Servicer / Special Servicer: Midland Loan Services Collateral Characteristics Offered Loan Balance $487.7 million Cut-off Date Balance $513.3 million Property Count 4,487 BPO Value (Approximate) $750.2 million Cost Basis (Approximate) $701.2 million Average Renovation Cost $13,094 Cut-off Date Loan to BPO Value 65.0%1 UW Net Cash Flow (Approximate) $45.2 million UW NCF Debt Yield 9.28%1 UW NCF DSCR 1.67x1,3 Average Monthly Rent per Property $1,388 Top 5 MSAs (as a % of BPO Value) Chicago-Naperville-Elgin, IL-IN-WI (16.4%) Dallas-Fort Worth-Arlington, TX (14.6%) Indianapolis-Carmel-Anderson, IN (9.5%) Charlotte-Concord-Gastonia, NC-SC (7.8%) Phoenix-Mesa-Scottsdale, AZ (6.9%) Top 5 States (as a % of BPO Value) Texas (18.1%) Illinois (16.9%) North Carolina (13.5%) Indiana (9.9%) Ohio (9.5%) Based on offered amount Duration weighted average DSCR includes CREFC and servicing fees Page Sources: Rating Agency presale reports |

|
|
6 American Homes 4 Rent 2014-SFR2 $487,650,000 Single-Family Rental Securitization; Lead Underwriters: GS, JPM, WF Capital Structure Offered Class Rating (Md/Kr/Mr) Approximate Initial Certificate Balance ($mm) Balance to BPO1 (%) Approximate Initial CE (%) Coupon UW NCF Debt Yield2 Maturity Date WAL (years) Note Type A Aaa(sf)/AAA(sf)/AAA $313.970 41.85% 38.83% 3.79% 14.41% 9.27 Senior / Sequential B Aa2(sf)/AA+(sf)/AA+ $23.630 45.00% 34.23% 4.29% 13.40% 10.08 Subordinate / Sequential C A2(sf)/AA-(sf)/A+ $32.635 49.35% 27.87% 4.71% 12.22% 10.08 Subordinate / Sequential D Baa2(sf)/A(sf)/BBB+ $33.760 53.85% 21.30% 5.15% 11.20% 10.08 Subordinate / Sequential E NR/BBB-(sf)/BBB $83.655 65.00% 5.00% 6.23% 9.28% 10.08 Subordinate / Sequential Non-Offered Classes F NR//NR/NR $25.666 68.42% 0.00% N/A 8.81% 10.08 Risk Retention Class R NR N/A N/A N/A N/A N/A N/A Residual Weighted Average: 4.42% DSCR Stress Scenarios2, 3 Sum of initial certificate balance of such Class and aggregate certificate balances of all senior Classes divided by aggregate most recent BPO value obtained on or after June 7, 2014 Based on underwritten cash flows which assume (1) annual rent at in place contractual annual rent, (2) miscellaneous income at 2% of gross annual rent, (3) vacancy at 6% of gross revenue, (4) taxes at current annual assessed taxes (5) HOA fees at current annual assessed HOA fees (6) insurance expense at actual insurance allocation under the blanket policy (7) annual leasing and marketing at $350 per unit, (8) annual repairs and maintenance expenses at $500 per unit, (9) annual maintenance and turnover costs at $300 per unit, (10) annual property management fee at 6.0% of EGI and (11) annual capital expenditures at $450 per unit. Calculated by dividing (a) the aggregate Underwritten Annual Net Cash Flow by (b) the aggregate initial Certificate Balance of such Class of Certificates and aggregate initial Certificate Balances of any Class of Certificates senior to such Class of Certificate. Based on Offered Certificates; debt service is inclusive of amortization across the entire loan, not solely the offered certificates Cash trap trigger occurs if DSCR falls below 1.20x To reach a 1.20x coverage level, assuming a 4.42% interest rate: Vacancy could increase from the underwritten 6.0% to 23.5% of annual gross income, holding everything else constant Operating expenses and reserves could increase from 36.9% to 55.5% of Effective Gross Income, holding everything else constant Rental income could decrease by 17.8%, holding everything else constant |

|
|
7 American Homes 4 Rent 2014-SFR2 Collateral Attributes Lease Expiration1 Average Age of Property (Years)1 Contractual Monthly Rent2 BPO Values2 Percentages are determined based on number of properties Percentages are determined based on aggregate BPO value 10.3% 21.1% 24.3% 18.7% 11.2% 14.3% $62,000 to $125,000 $125,001 to $150,000 $150,001 to $175,000 $175,001 to $200,000 $200,001 to $225,000 $225,001 to $575,000 20.0% 77.5% 0.4% 2.1% 2014 2015 2016 MTM 4.0% 62.0% 29.6% 4.0% 0.4% $750 to $1,000 $1,001 to $1,500 $1,501 to $2,000 $2,001 to $2,500 $2,501 to $3,000 |

|
|
8 10-Year Fixed Rate vs. 5-Year Floating Rate Loan Attributes Structural Considerations 10-Year Fixed (AH4R 2014-SFR2) Recent 5-Year Floating SFR Transactions 5-Year Floater (AH4R 2014-SFR1) Amortization 1% per year Loan will de-lever 10% over the life None 1% per year Interest Rate Cap None; the coupon is fixed Equal to a per annum rate such that the debt service coverage ratio calculated under the loan agreement will not be less than 1.20x Equal to a per annum rate such that the debt service coverage ratio calculated under the loan agreement will not be less than 1.20x Cash Trap Trigger DSCR <1.20x Debt yield < 85% of closing date debt yield Debt yield < 85% of closing date debt yield Prepayment Locked out for 2 years Yield maintenance from year 3 to year 9 Freely prepayable in year 10 Spread maintenance for 2 years Spread maintenance for 2 years Rationale of a 10-Year vs 5-Year Floating Loan Diversify debt maturity schedule: The issuance of a 10-year fixed rated bond diversifies our existing debt maturity profile, which includes an $800 million revolving credit facility due on September 2018 and an extant $481 million SFR bond with final maturity of June 2019 Refinancing risk: A 10-year fixed-rate bond due in October 2024 locks in funding for a longer term Cost effective: 10-year term allows us to amortize the upfront cost over a longer period Structural Differences |

|
|
9 Single-Family Rental Transaction Comparison Collateral Characteristics and Loan Structure Page Source: Rating Agency Presale Reports Includes IH 2013-SFR1, CAH 2014-1, IH 2014-SFR1, CAH 2014-2, SBY 2014-1, IH 2014-SFR2 and ARP 2014-SFR1 Number of MSAs is based on the MSA count printed in the Presale Reports. In certain Presale Reports, the total count of individual MSAs in the MSA list is different than the amount shown in the printed count Based on Offered Certificates only For transactions with a retained class, calculated as a ratio of Issuer’s Net Cash Flow to aggregate Offered Certificate Balance Collateral characteristics AH4R house age is approximately 12 years relative to its peers at an average of 25 years AH4R home sizes have larger square footage relative to the peer set – at 1,912 square feet relative to an average of 1,810 square feet AH4R’s second transaction, like its first, is collateralized by 100% occupied properties at closing Loan Structure Underwritten debt yield on both AH4R deals is higher (9.28% and 7.86%) than its peers (highest peer deal is 6.65%) Non-AH4R SFR Securitizations1 AH4R |

|
|
10 Geographic Diversity AH4R 2014-SFR2 vs AH4R 2014-SFR1 (1) Number of MSAs sums to 34 rather than 33 due to overlap Page Source: Rating Agency Presale Reports SC OR NV AZ TX IL IN OH GA FL TN NC States only in AH4R 2014-SFR2 States in AH4R 2014-SFR1 and AH4R 2014-SFR2 Geographic Characteristic AH4R 2014-SFR1 AH4R 2014-SFR2 # of States 5 11 # of MSA 24 33 Max State Concentration (as a % of BPO) 29.98% (Florida) 18.07% (Texas) Max MSA Concentration (as a % of BPO) 16.06% (Atlanta-Sandy Springs-Roswell, GA) 16.38% (Chicago-Naperville-Elgin, IL-IN-WI) Top 5 States (as a % of BPO) 100.00% 67.91% Top 5 MSAs (as a % of BPO) 62.55% 55.23% AH4R 2014-SFR2 Geographic Characteristic Texas Illinois North Carolina Indiana Ohio Arizona Georgia Tennessee Oregon Nevada Florida # of MSAs1 4 2 3 5 3 2 4 3 4 1 3 # of Properties 844 712 602 529 457 391 396 234 128 112 82 % of Pool BPO 18.07% 16.91% 13.51% 9.92% 9.51% 8.77% 8.61% 5.99% 3.40% 3.19% 2.12% |

|
|
Securitization: AH4R 2014-SFR1 11 |

|
|
12 American Homes 4 Rent 2014-SFR1 $480,970,000 Single-Family Rental Securitization Transaction Overview AH4R 2014-SFR1 was AH4R’s inaugural securitization of approximately $481 million first lien, floating rate loan secured by 3,852 single-family rental homes. The transaction priced on May 13, 2014 Loan Terms: 2 year floating rate loan with three 12-month extension options Yield: 1mL + 154bps1 1% annual amortization based on closing date balance 70.0% Cutoff Date LTV based on a BPO valuation of approximately $687.1 million Transaction Waterfall: Sequential payment of interest and principal Key Transaction Parties: Loan Originator / Seller: Goldman Sachs Bank USA / Goldman Sachs Mortgage Company Servicer / Special Servicer: Midland Loan Services Collateral Characteristics Balance $481.0 million Property Count 3,852 BPO Value (Approximate) $687.1 million Cost Basis (Approximate) $577.8 million Average Renovation Cost $15,884 Yield 1mL + 154bps1 Cutoff Date Loan to BPO Value 70.0% UW Net Cash Flow (Approximate) $37.8 million UW NCF Debt Yield 7.86%2 UW NCF DSCR 2.69x 2,3 Average Monthly Rent per Property $1,353 Top 5 MSAs (as a % of BPO Value) Atlanta-Sandy Springs-Roswell, GA (16.1%) Dallas-Fort Worth-Arlington, TX (12.1%) Las Vegas-Henderson-Paradise, NV (11.8%) Tampa-St. Petersburg-Clearwater, FL (11.3%) Phoenix-Mesa-Scottsdale, AZ (11.3%) Top 5 States (as a % of BPO Value) Florida (30.0%) Texas (23.8%) Georgia (18.5%) Arizona (15.9%) Nevada (11.8%) Duration weighted average Based on offered amount Based on an interest rate of approximately 1.88% at time of issuance Page Sources: Rating Agency presale reports |

|
|
13 American Homes 4 Rent 2014-SFR1 $480,970,000 Single-Family Rental Securitization; Lead Underwriters: GS, JPM, WF Capital Structure Class Rating (Md/Kr/Mr) Approximate Initial Certificate Balance ($mm) Balance to BPO1 (%) Approximate Initial CE (%) Coupon UW NCF Debt Yield WAL (years) (Maturity Date / Fully Extended Maturity Date) Note Type A Aaa(sf)/AAA(sf)/AAA $269.422 39.2% 44.0% 1mL+100bps 14.0% 2.0 / 4.9 Senior / Sequential B Aa2(sf)/AA+(sf)/AA+ $37.597 44.7% 36.2% 1mL+135bps 12.3% 2.1 / 5.1 Subordinate / Sequential C A2(sf)/A+(sf)/A+ $40.742 50.6% 27.7% 1mL+175bps 10.9% 2.1 / 5.1 Subordinate / Sequential D Baa2(sf)/A-(sf)/BBB+ $38.557 56.2% 19.7% 1mL+210bps 9.8% 2.1 / 5.1 Subordinate / Sequential E NR/BBB(sf)/BBB $62.062 65.3% 6.8% 1mL+250bps 8.4% 2.1 / 5.1 Subordinate / Sequential F NR/BB+(sf)/BB+ $32.590 70.0% 0.0% 1mL+325bps 7.9% 2.1 / 5.1 Subordinate / Sequential Non-Offered Classes R NR N/A N/A N/A N/A N/A N/A Residual Weighted Average: 1mL+154bps Page Sources: Rating Agency presale reports (1) Sum of initial Certificate Balance of such Class and aggregate initial Certificate Balances of all senior classes divided by aggregate most recent BPO value available at the transaction closing date |

|
|
Corporate Overview 14 |

|
|
15 Large, Diversified Portfolio 27,173 high quality homes as of June 30, 2014 (over 29,200 as of July 2014) 23,364 homes leased as of June 30, 2014 (approximately 25,500 as of July 2014) Properties in 22 states / 42 markets Strong Balance Sheet Strong balance sheet with conservative approach to leverage Approximately $4.7 billion total equity capitalization as of June 30, 2014 ($5.0 billion after August equity issuance) Approximately $1.0 billion debt outstanding1 as of June 30, 2014 Differentiated Access to Capital Largest publicly traded REIT in Single Family Rental space (NYSE: AMH) IPO and concurrent private placement completed in August 2013, raising $887 million in capital Completed over $400 million in preferred stock offerings in October 2013, December 2013 and May 2014 Completed first securitization transaction of approximately $481 million in May 2014 at tightest interest rate spreads to date in the SFR sector Completed $229 million public offering of common shares and $50 million concurrent private placement in August 2014 Completed first fixed rate securitization transaction in September 2014, a $487.6 million 10 year deal at 4.42% High Asset Quality High-quality, well-located properties in attractive neighborhoods Screen properties efficiently to ensure they meet AMH parameters Superior Operational Infrastructure Well-developed national operating platform with local market expertise Robust technology utilization – best in class call center and implementation of version “3.0” website Internal Corporate and Property Management Aligned incentives and increased efficiency Fully internalized asset and property management Experienced Management Team Management team with a track record of successfully building and operating businesses in public markets Strong Alignment of Interest Founder and senior management team hold approximately $1 billion of equity ownership American Homes 4 Rent Overview (1) Includes $481 million credit facility and $481 million asset-back securitization, as of June 30, 2014 Page Source: SEC Filings, Form 8-K, August 5, 2014 and August 19, 2014, American Homes 4 Rent May Presentation |

|
|
AMH Business Strengths Tenant Driven Business AMH targets properties that fit the following: Traditional middle class neighborhoods in growing markets Minimum 3 bedrooms, 2 bathrooms, two car garage Newer properties in attractive neighborhoods Significant Scale Advantage Well developed national operating platform provides for enhanced acquisition execution, lower renovation costs, operating efficiencies and increased brand awareness Internalized management coupled with significant investment in technology further drives scale advantages "Cottage" Industry Historical “mom & pop" landlord model Current rent per square foot significantly below multi-family comparables Potential opportunity to drive rents given quality and approach Ability and expertise to streamline and control all aspects of the business model Favorable Asset Dynamics Provides a natural hedge as the business plan works across market cycles Efficient, disciplined and analytical buying strategy has allowed AMH to acquire a diversified portfolio of high quality homes Ability to optimize cash flows as AMH institutionalizes asset class Strong Industry Trends Largest real estate asset class with strong historical demand for rentals Affordability and view of home ownership have changed coming out of downturn Purchase price significantly below replacement cost providing downside protection Significant cash flow opportunity with attractive current yields and upside from increasing rents and cost efficiencies 16 Page Source: SEC Filings, Form 8-K, May 6, 2014 |

|
|
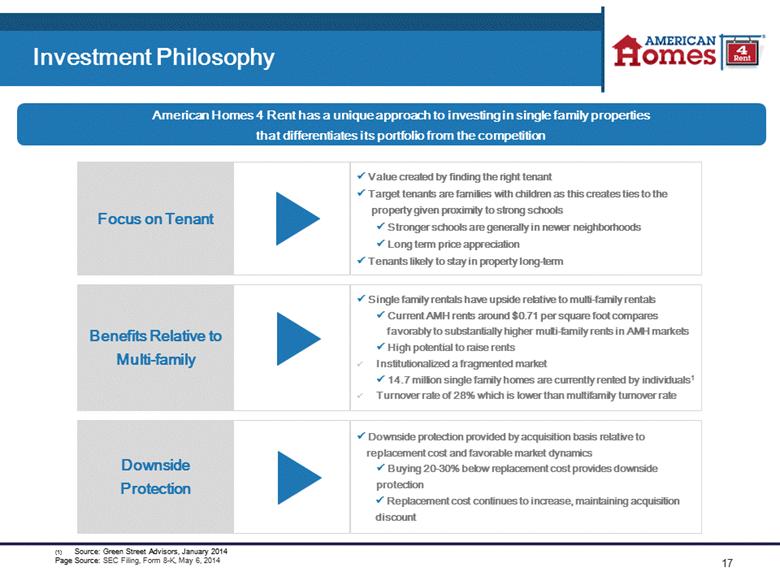
17 Investment Philosophy Focus on Tenant Value created by finding the right tenant Target tenants are families with children as this creates ties to the property given proximity to strong schools Stronger schools are generally in newer neighborhoods Long term price appreciation Tenants likely to stay in property long-term Benefits Relative to Multi-family Downside Protection Downside protection provided by acquisition basis relative to replacement cost and favorable market dynamics Buying 20-30% below replacement cost provides downside protection Replacement cost continues to increase, maintaining acquisition discount American Homes 4 Rent has a unique approach to investing in single family properties that differentiates its portfolio from the competition Source: Green Street Advisors, January 2014 Page Source: SEC Filing, Form 8-K, May 6, 2014 |
|
|
History of American Homes 4 Rent Q3 2014 29,2001 Completed first fixed rate securitization transaction in September 2014, a $487.6 million 10 year deal at 4.42% Completed merger with Beazer Pre-Owned Homes, a $263 million acquisition Completed public offering with total expected gross proceeds of $229 million and a private placement of $50 million Q2 2014 27,173 Completed $481 million debt securitization at L+154 bps in May 2014 Completed NPL Joint Venture with Beach Point and JCRI Completed JV with Alaska Permanent Fund to acquire non-conforming assets Q1 2014 25,505 Additional preferred stock offering with aggregate proceeds of $185 million Q4 2013 23,268 Completed internalization of property management Completed two preferred stock offerings with aggregate proceeds of $236 million Q3 2013 21,267 Completion of $887million IPO and concurrent private placement $3.5 billion in equity capital after closing of IPO Q2 2013 18,326 Alaska Permanent Fund JV contributed 4,778 properties to the REIT for $904 million in equity consideration Internalization of property manager and adviser Q1 2013 12,3102 AMH raised an additional $747 million equity in a second 144A offering AMH obtained a $500 million Asset Backed Facility; subsequently increased to $1.0 billion for nine months AH LLC contributed 2,770 homes to AMH for $492 million in equity consideration 2012 8,1533 AMH formed and subsequently raised $530 million equity in a 144A offering $500 million joint venture between AH LLC and the Alaska Permanent Fund, followed by an additional $250 million investment in November 2012 2011 - American Homes 4 Rent founded by B. Wayne Hughes Parallels between Public Storage and AMH Self-storage was a fragmented, “mom & pop” consumer-focused industry Public Storage institutionalized the sector through professional management Public Storage built a well-recognized, leading national brand Public Storage developed systems to realize operating efficiencies Public Storage rolled up smaller operators to aggregate the country’s largest portfolio # Homes 2006 2006 Public Storage reaches $20 billion equity market cap with over 2,000 facilities across 38 states 1972 1972 Public Storage founded by B. Wayne Hughes with one storage unit in Southern California 18 Approximate number of homes in which company has an investment interest as of July 2014 As of March 2013 As of October / November 2012 Page Source: SEC Filings, American Homes 4 Rent March 2014 Citi 2014 Global Property Conference Presentation |

|
|
19 2014 Second Quarter Operational Update Quarterly Occupancy, Revenue and NOI Increases Q2 Overview Continued strong growth in occupancy and cash flow from operations Note: April 30, 2014 results reflect preliminary estimates. ($ Millions) Page Source: SEC Filings, Form 8-K, August 5, 2014 (1) Stabilized Occupancy includes all properties that have been initially leased or initially rent-ready for more than 90 days (i.e., occupancy percentage is net of vacancy associated with properties in turn). 1 |

|
|
20 Second Quarter 2014 YTD Performance Highlights Revenues of $171.6 million Net Operating Income (NOI) from leased properties of $104.9 million Acquired 3,905 properties during first half 2014, increasing total portfolio to 27,173 homes at June 30, 2014 Properties rent-ready for more than 90 days were 94.7% leased at period end Total properties owned were 86.0% occupied Quarterly Operating Overview NOI is a supplemental non-GAAP financial measure that we define as rents and fees from single-family properties and tenant charge-backs, less property operating expenses for leased single-family properties. Core NOI used to calculate our Core NOI Margin is calculated as rents and fees from single-family properties, net of bad debt expense, less property operating expenses for leased single-family properties, excluding expenses reimbursed by tenant charge-backs and bad debt expense. Annualized based on 3 month G&A expenses for 2Q 2014 divided by total assets at June 30, 2014 Page Source: SEC Filing, Form 8-K, August 5, 2014 3 For the Six Months Ended ($ Thousands, except per share data) June 30, 2014 Operating Data Rents from Single-Family Properties 162,632 Total Revenues 171,582 Leased Property Operating Expenses 66,056 Net Operating Income 1 104,851 Core NOI Margin 2 64.1% Core Funds from Operations (Core FFO) 63,362 Core FFO per FFO Share 0.26 G&A Expense / Total Revenues (%) 6.3% Annualized G&A Expense / Total Assets (%) 0.46% |

|
|
21 National High Quality Portfolio in Attractive Markets As of June 30, 2014 For illustrative purposes, approximate cost per home includes acquisition costs, renovation fees and other costs incurred by the REIT for purchase and renovation Based on number of properties as of June 30, 2014 Page Source: SEC Filing, Form 8-K, August 5, 2014 SC TN WA OR CA NV UT CO AZ TX IL IN OH GA FL SC TN NC KY Corporate & Property Management Headquarters Property Management Offices AMH State Presence OK WI ID NM MS 27,173 homes owned (approximately 29,200 as of July 2014) 42 markets 22 states Average age of 11.5 years Average sq. ft. of 1,969 per home Average investment of $170,000 per home2 Highlights1 Properties by Market3 |

|
|
22 Favorable Operational Comparison to Multi-Family NOI Margin Comparison1 Occupancy Comparison1 Renting primarily to families who desire high quality neighborhoods and school systems 72% renewal rate for Q2 2014 Current AMH average rental rate of $0.71 per square foot provides superior value to renters and opportunity to increase rates Typical AMH Property Characteristics High Quality Tenant Characteristics2 Average household income of approximately $85,000 4.95x Income / Rent Average 2.0 adults per property Average 1.2 children per property Belief that higher quality tenants pay on time, stay longer and limit capital expenditures Note: Multi-Family REITs include AEC, AIV, AVB, BRE, CPT, EQR, ESS, HME, MAA, PPS, UDR, ACC, CCG and EDR. AMH NOI margin and stabilized occupancy metrics as of June 30, 2014 Base on data captured Source: Public filings, Form 8-K, May 6, 2014 |

|
|
23 Property Life Cycle Page Source: SEC Filings, Form 8-K, May 6, 2014 |

|
|
24 Acquisition, Renovation and Leasing Rates “Rent Ready” includes properties for which initial construction has been completed during each quarter. “Leases Signed” includes the number of initial leases signed each quarter (includes Pre-Existing Leases). Page Source: SEC Filings, Form 8-K, August 5, 2014 Number of Properties 2012 2013 Q1 2012 Q2 2012 Q3 2012 Q4 2012 Q1 2013 Q2 2013 Q3 2013 Q4 2013 Q1 2014 Q2 2014 Trustee Acquisitions 336 812 1,793 2,218 1,364 1,440 1,617 1,043 1,056 933 Broker Acquisitions 77 131 741 1,757 2,783 4,291 1,320 958 1,181 735 Total Acquisitions 413 943 2,534 3,975 4,147 5,731 2,937 2,001 2,237 1,668 Rent Ready (1) 301 307 763 1,903 3,275 5,247 5,232 3,108 2,605 2,183 Leases Signed (2) 234 301 585 1,359 2,550 4,835 4,602 3,473 3,185 2,700 2014 |

|
|
25 Acquisition of Beazer Pre-Owned Rental Homes Closed July 1, 2014 Acquisition Price Class A Common: 8.2 mm shares $146 mm1 Debt assumed $113 mm Escrow account $5 mm Total: $263 mm Page Source: SEC Filings, Form 8-K, August 5, 2014 Based on $17.75 AMH common stock closing price on July 1, 2014 Portfolio Characteristic American Homes 4 Rent Beazer Total Homes Owned 27,173 (3,551 in overlap markets) 1,372 Markets 42 7 States 22 4 Average Home Age 11.5 years 10.0 years Average Square Feet 1,969 1,934 Average Monthly Rent $1,393 $1,349 Average Rent per Square Foot $0.71 $0.70 Leased 86% (91% in overlap markets) 90%+ |

|
|
Appendix 26 |

|
|
27 Proven Acquisition Platform Property Screening and Underwriting Process Acquisitions by Channel 2012 In a typical month AMH underwrites approximately 30,000 homes and acquires 2% of homes underwritten Key Underwriting Criteria 1) Location 2) Physical criteria 3) Financial criteria 2013 2014 Page Source: SEC Filing, Form 8-K, August 5, 2014 and American Homes 4 Rent June Presentation |

|
|
28 Market Leading Renovation Capabilities Standardized Renovation Process Homes Delivered Rent Ready per Quarter Before and After Comprehensive inspection and renovation budgeting Utilize over 3,000 preferred contractors nationwide Achieve substantial discounts through scale-enabled bargaining power for nationwide contracts Enables us to achieve underwritten renovation budget Improves relationship with the local communities and HOAs, enhancing brand recognition and loyalty Illustrative Renovation Budget1 Paint $2,400 $1.20 PSF Flooring $2,800 $1.40 PSF Appliances $1,800 Full Package Landscaping $1,500 Full Package Cleaning $500 $0.25 PSF General Repairs $7,500 $3.75 PSF Total Renovation Budget $16,500 $8.25 PSF Budget based on a sample 3 bed, 2 bath 2,000 square-foot house. These budget figures are illustrative only and may not be indicative of the renovation budget of the properties in our portfolio or properties we may acquire in the future. High quality products & control of process achieves better quality homes, which diminishes ongoing maintenance and turnover costs Page Source: SEC Filing, Form 8-K, May 6, 2014 and American Homes 4 Rent June Presentation |

|
|
29 Successful Marketing and Leasing Process Tenant Underwriting1 Lease Execution 96.2% Leasing Channels Initial Leases Signed per Quarter Designed to minimize potential tenant defaults Multiple Listing Service Referral Rental History Credit History Criminal Records Average Income: $85,000 4.95x Income / Rent National Call Center “Let Yourself In” Showings Based on data captured Page Source: SEC Filing, Form 8-K, May 6, 2014 and American Homes 4 Rent June Presentation AH4R Website |

|
|
30 NOI and Core NOI Reconciliation NOI is a supplemental non-GAAP financial measure that we define as rents and fees from single-family properties and tenant charge-backs, less property operating expenses for leased single-family properties. Core NOI is also a supplemental non-GAAP financial measure that we define as rents and fees from single-family properties, net of bad debt expense, less property operating expenses for leased single-family properties, excluding expenses reimbursed by tenant charge-backs and bad debt expense. NOI and Core NOI also exclude income from discontinued operations, remeasurement of preferred shares, remeasurement of Series E units, gain on remeasurement of equity method investment, depreciation and amortization, acquisition fees and costs expensed, noncash share-based compensation expense, interest expense, advisory fees, general and administrative expense, property operating expenses for vacant single-family properties and other revenues Page Source: SEC Filing, Form 8-K, August 5, 2014 Jun 30, 2013 Sep 30, 2013 Dec 31, 2013 Mar 31, 2014 Jun 30, 2014 Net Operating Income Rents from single-family properties $ 17,020 $ 47,364 $ 61,843 $ 73,761 $ 88,871 Fees from single-family properties 690 1,476 1,409 1,358 1,889 Tenant charge-backs 47 323 1,218 1,890 3,138 Total revenues from single-family properties 17,757 49,163 64,470 77,009 93,898 Leased property operating expenses 6,859 17,579 24,470 29,266 36,790 Net operating income $ 10,898 $ 31,584 $ 40,000 $ 47,743 $ 57,108 Net operating income margin 61.4% 64.2% 62.0% 62.0% 60.8% Core Net Operating Income Rents from single-family properties $ 17,020 $ 47,364 $ 61,843 $ 73,761 $ 88,871 Fees from single-family properties 690 1,476 1,409 1,358 1,889 Bad debt expense (100) (417) (1,748) (1,423) (962) Core revenues from single-family properties 17,610 48,423 61,504 73,696 89,798 Leased property operating expenses 6,859 17,579 24,470 29,266 36,790 Expenses reimbursed by tenant charge-backs (47) (323) (1,218) (1,890) (3,138) Bad debt expense (100) (417) (1,748) (1,423) (962) Core property operating expenses 6,712 16,839 21,504 25,953 32,690 Core net operating income $ 10,898 $ 31,584 $ 40,000 $ 47,743 $ 57,108 Core net operating income margin 61.9% 65.2% 65.0% 64.8% 63.6% For the Three Months Ended |

|
|
31 NOI and Core NOI Reconciliation (continued) The following is a reconciliation of NOI and Core NOI to net income / (loss) determined in accordance with GAAP: Page Source: SEC Filing, Form 8-K, August 5, 2014 Jun 30, 2013 Sep 30, 2013 Dec 31, 2013 Mar 31, 2014 Jun 30, 2014 Net income / (loss) 1,123 $ (3,861) $ (9,471) $ (6,935) $ (3,369) $ Income from discontinued operations (986) - - - - Remeasurement of Preferred shares - - 1,810 457 141 Remeasurement of Series E units - 438 1,619 2,756 4,944 Gain on remeasurement of equity method investment (10,945) - - - - Depreciation and amortization 10,879 24,043 33,160 35,131 38,325 Acquisitions fees and costs expensed 2,099 496 814 452 919 Noncash share-based compensation expense 279 153 473 532 612 Interest expense - - - 1,502 3,888 Advisory fees 3,610 - - - - General and administrative expense 811 2,742 3,667 5,074 5,703 Property operating expenses for vacant single-family properties and other 4,391 7,873 8,348 9,043 6,351 Other revenues (363) (300) (420) (269) (406) Net operating income 10,898 $ 31,584 $ 40,000 $ 47,743 $ 57,108 $ Tenant charge-backs 47 323 1,218 1,890 3,138 Expenses reimbursed by tenant charge-backs (47) (323) (1,218) (1,890) (3,138) Bad debt expense excluded from operating expenses 100 417 1,748 1,423 962 Bad debt expense included in revenues (100) (417) (1,748) (1,423) (962) Core net operating income 10,898 $ 31,584 $ 40,000 $ 47,743 $ 57,108 $ |

|
|
32 FFO and Core FFO Reconciliation The following is a reconciliation of net loss attributable to common shareholders to FFO and Core FFO for three months ended September 30, 2013, December 31, 2013, March 31, 2014, and June 30, 2014 (amounts in thousands, except share and per share information): We calculate FFO in accordance with the White Paper on FFO approved by the Board of Governors of the National Association of Real Estate Investment Trusts (“NAREIT”), which defines FFO as net income of loss calculated in accordance with Generally Accepted Accounting Principles (“GAAP”), excluding extraordinary items, as defined by GAAP, gains and losses from sales of depreciable real estate and impairment write-downs associated with depreciable real estate, plus real estate-related depreciation and amortization (excluding amortization of deferred financing costs and depreciation of non-real estate assets), and after adjustment for unconsolidated partnerships and joint ventures. Core FFO is a non-GAAP financial measure that we use as a supplemental measure of our performance. We compute Core FFO by adjusting FFO for (1) acquisition fees and expenses incurred with recent business combinations and the acquisition of properties with existing leases, (2) noncash share-based compensation expense and (3) noncash fair value adjustments associated with remeasuring our Series E units liability and Preferred shares derivative liability to fair value. Includes quarterly weighted average common shares outstanding and assumes full conversion of all Operating Partnership units outstanding, including 13,787,292 Class A units, 31,085,974 Series C units, 4,375,000 Series D units and 4,375,000 Series E units. Page Source: SEC Filing, Form 8-K, August 5, 2014 Sep 30, Dec 31, Mar 31, Jun 30, 2013 2013 2014 2014 Net loss attributable to common shareholders (7,659) $ (14,519) $ (13,676) $ (12,250) $ Adjustments: Noncontrolling interests in the Operating Partnership 4,028 3,718 3,715 4,140 Depreciation and amortization of real estate assets 23,211 31,702 33,827 36,793 Funds from operations 19,580 $ 20,901 $ 23,866 $ 28,683 $ Adjustments: Acquisition fees and costs expensed 496 814 452 919 Noncash share-based compensation expense 153 473 532 612 Remeasurement of Series E units 438 1,619 2,756 4,944 Remeasurement of Preferred shares - 1,810 457 141 Core funds from operations 20,667 $ 25,617 $ 28,063 $ 35,299 $ Weighted average number of FFO shares (1) 216,348,416 239,122,332 239,127,560 239,138,917 FFO per weighted average FFO share 0.09 $ 0.09 $ 0.10 $ 0.12 $ Core FFO per weighted average FFO share 0.10 $ 0.11 $ 0.12 $ 0.15 $ For the Three Months Ended |

|
|
AMERICAN HOMES |
