Attached files
| file | filename |
|---|---|
| 8-K - 8-K - WARREN RESOURCES INC | a14-21070_18k.htm |
Exhibit 99.1
|
|
Investing in the Future of Energy Investor Presentation September 2014 |
|
|
Forward-Looking Statements Investing in the Future of Energy NASDAQ (WRES) 2 Forward-Looking Statements. This presentation includes forward-looking statements within the meaning of Section 27A of the Securities Act of 1933 and Section 21E of the Securities Exchange Act of 1934. Certain statements in this presentation are forward-looking and are based upon the current belief of Warren Resources, Inc. (“Warren") as to the outcome and timing of future events. All statements, other than statements of historical facts, that address activities that Warren plans, expects, believes, projects, estimates or anticipates will, should or may occur in the future, including future production of oil and gas, future capital expenditures and drilling of wells and future financial or operating results are forward-looking statements. No assurance can be given that any of such plans, expectations, estimates or projections will prove to have been correct, and the same can be affected by inaccurate assumptions or by known or unknown risks or uncertainties. Important factors that could cause actual results or other expectations expressed in this presentation to differ materially from those in the forward-looking statements herein include, but are not limited to: commodity price volatility; domestic and worldwide economic conditions; potential adverse changes in general economic conditions, including performance of financial markets, interest rates and unemployment rates; unsuccessful drilling or operating activities; the inability to develop our reserves through exploration and development activities; potential impact of environmental and other governmental regulation, including delays in obtaining governmental and other permits and approvals, and impacts on competing energy sources as well as on natural gas; possible legislative or regulatory changes, including severance or production tax regimes, hydraulic-fracturing regulation, additional drilling and permitting regulations, oil and natural gas derivatives reform, changes in state, federal and foreign income taxes, environmental regulation (including with respect to climate change and greenhouse gas emissions), environmental risks and liability under federal, state, foreign and local environmental and other laws and regulations; the failure to obtain sufficient capital resources to fund our operations; our ability to repay our debt; the extent to which natural gas markets in the United States become integrated with global natural gas markets through the approval and development of infrastructure supporting the export of liquefied and other natural gas; a decline in oil or natural gas production; changes in the localized and global supply and demand fundamentals of natural gas and oil and transportation availability; incorrect estimates of reserve quantities, operating costs and capital expenditures; increases in the cost of drilling, completion and gas gathering or other costs of production and operations; hazardous and risky drilling operations; and an inability to grow. Should one or more of these risks or uncertainties occur, or should underlying assumptions prove incorrect, Warren's actual results and plans could differ materially from those expressed in the forward-looking statements. Given these risks and uncertainties, you are cautioned not to place undue reliance on forward-looking statements, which speak only as of the date of this presentation or as of the report document in which they are contained. Absent legal requirement, we assume no duty to update these statements as of any future date. Further information on risks and uncertainties that may affect Warren’s operations and financial performance, and the forward-looking statements made herein, is available in the Company’s filings with the Securities and Exchange Commission (www.sec.gov), including its Annual Report on Form 10-K under the headings “Risk Factors” and “Management’s Discussion and Analysis of Financial Condition and Results of Operations” and in other public filings and press releases. Reserves. The SEC permits oil and gas companies, in their filings with the SEC, to disclose only proved, probable and possible reserves that meet the SEC's definitions of such terms. Warren discloses only estimated proved reserves in its filings with the SEC. Warren's estimated proved reserves as of December 31, 2013 and Citrus’ estimated proved reserves as of June 30, 2014 contained in this presentation were prepared by Netherland, Sewell & Associates, Inc., a nationally recognized engineering firm, and comply with definitions promulgated by the SEC. Additional information on Warren’s estimated proved reserves is contained in Warren's Annual Report on Form 10-K. In this presentation, Warren may also use internal estimates of “resource potential”, “prospective or potential resources” or “recoverable resource” or other descriptions of volumes of resources potentially recoverable through additional exploratory drilling or recovery techniques, which volumes the SEC's guidelines strictly prohibit Warren from including in filings with the SEC. These estimates, as well as estimates of probable and possible reserves, are by their nature more speculative than estimates of proved reserves and accordingly are subject to substantially greater risk of being actually realized by Warren. Prospective resources refers to Warren's internal estimates of hydrocarbon quantities that may be potentially discovered through exploratory drilling or recovered with additional drilling or recovery techniques. Prospective resources does not constitute reserves within the meaning of the Society of Petroleum Engineer's Petroleum Resource Management System. Actual quantities that may be ultimately recovered from Warren's interests might differ substantially. Factors affecting ultimate recovery include the scope of Warren’s ongoing drilling program, which will be directly affected by the availability of capital, drilling and production costs, availability of drilling services and equipment, drilling results, lease expirations, transportation constraints, regulatory approvals, changes in law and other factors; and actual drilling results, including geological and mechanical factors affecting recovery rates. Estimates of prospective resources may change significantly as development of our resource plays provides additional data. Non-GAAP Information. Please refer to the Appendix to find disclosure and a reconciliation of any non-GAAP financial measures contained in this presentation. |
|
|
Company Overview Investing in the Future of Energy NASDAQ (WRES) 3 Three core operating areas California Primarily focused on waterflood oil recovery and horizontal development in Wilmington field in Los Angeles Basin Marcellus “Core-of-the-core” Marcellus acreage in Wyoming County, Pennsylvania (NE PA) Significant upside potential with stacked pay Strong operating team with extensive shale experience Platform for future growth Wyoming Washakie Basin in southwestern Wyoming (within Greater Green River Basin) Coalbed methane (“CBM”) production with deeper oil and gas potential Includes 6.67 million shares issued on 8/11/14 in connection with the Marcellus acquisition. Warren issued of $300 million of Senior Notes due 2022 on 8/11/14 in connection with the Marcellus acquisition. See Appendix for reconciliation of non-GAAP financial measures. Warren reserves as of 12/31/13 NSAI SEC reserve report. Marcellus reserves as of 6/30/14 NSAI SEC reserve report. Financial Profile Asset Profile Ticker: NASDAQ: WRES Market Capitalization as of 9/16/14 (1) : $495 LT Debt as of 6/30/14, PF 8/11/14 High Yield(2) : $383 LTM EBITDA(3) as of 3/31/14, PF 8/11/14 Marcellus Acquisition : $140 Proved Reserves, PF Marcellus Acquisition (bcfe)(4): 407 % Gas, PF Marcellus Acquisition(4): 76% % Proved Developed, PF Marcellus Acquisition(4) : 59% (US$ mm) |
|
|
Wilmington Field in the Los Angeles Basin 3rd largest U.S. oilfield Waterflood oil recovery Net avg. daily production (2Q14): 3,088 Bbl/d 16.1 MMBbls estimated net proved reserves as of 12/31/13 (53% PDP/PDNP) 150 gross identified potential Wilmington drilling locations(1) Leroy Pine – Expansion Area Currently optimizing completions Initial production expected in 3Q14 Areas of Operations California Properties Marcellus Properties Producing Properties Focus Areas Offices 1. Probable, possible & contingent locations; internally generated unrisked estimated potential locations. Wyoming Properties Commercial CBM development 2012 acquisition of Anadarko interests provided operatorship and 100% ownership of pipeline and infrastructure Approx. 111,000 gross (86,000 net) acres as of 6/30/14 Net avg. daily production (2Q14): 17.9 MMcf/d 175 targeted CBM drilling locations and 225 additional potential locations(1) 5,289 net acres in Northeast PA ~75% working interest “Core-of-the-core” Marcellus 30 PDP wells with an average lateral length of ~4,300 feet July 2014 net production: 90.0 MMcf/d (100% gas) 100% HBP or held by operations with drilled wells waiting on completion Pad and pipeline infrastructure in place All of Citrus’ operational team transitioned to Warren New offices in Denver, CO and Plano, TX to manage Marcellus and Wyoming properties Identified 26 additional locations in the Lower Marcellus and 48 additional locations in the Upper Marcellus Early data indicates Upper Marcellus OGIP 75% of Lower Plan to test Upper Marcellus potential as early as 2015 CA WY PA CO Investing in the Future of Energy NASDAQ (WRES) 4 |
|
|
Company History Investing in the Future of Energy NASDAQ (WRES) 5 Philip Epstein appointed Chairman and CEO in December 2012 Recent additions to management and Board position Company for further growth Transformative Marcellus acquisition provides new core area in another world class oil and gas basin Dec ‘04: Completed $82 MM IPO 2004 – 2005 – 2006 – 2007 – 2008 – 2009 – 2010 – 2011 – 2012 – 2013 – 2014 Dec ‘05: North Wilmington Unit acquired from Global Oil Production & Wilmington Management Oct ‘12: Acquired WY E&P and midstream assets from Anadarko Petroleum Dec ‘12: Appointed Philip A. Epstein as Chairman & CEO Oct ‘09: Priced $31 MM follow-on offering Dec ‘11: Announced $300 MM credit agreement Mar ‘14: Renewed focus on growth with introduction of 2014 capital budget of $116 MM, the largest in 5 years Aug ‘13: Acquired Leroy Pine Project area Dec ‘12: Marcus Rowland elected to Board of Directors Feb ‘05: Acquired Magness Petroleum & Next Generation Investments in Wilmington, CA Aug ’14: Acquired Marcellus assets from Citrus Energy and issued $300mm Senior Notes Dec ‘05: Completed $100 mm follow-on offering |
|
|
Marcellus Acquisition: Deal Overview Investing in the Future of Energy NASDAQ (WRES) 6 Warren acquired assets in the Marcellus Basin from Citrus Energy Corporation (“Citrus Energy” or “Citrus”) and two additional working interest owners for $352.5 million $312.5 million in cash and $40 million in Warren common stock at $6.00 per share Acreage located in the part of the basin with top tier economics Operating control and 100% HBP Production averaged 90 net MMcf/d in July, up from an average of 82 net MMcf/d in June (100% gas) Estimated net proved reserves of 204.8 Bcf (55% PD) (1) Over 300 net Bcf of proved plus probable plus possible (3P) estimates Does not include upside opportunities in Upper Marcellus and downspacing Operational infrastructure system in place to support full field development Retention of key Citrus personnel provides significant operational expertise 1. Per NSAI reserve report as of 6/30/14. |
|
|
Marcellus Acquisition: Key Takeaways Investing in the Future of Energy NASDAQ (WRES) 7 Free cash flow generation from acquired assets Self-funded development Expected to allow for natural deleveraging Significant embedded upside potential Upper Marcellus Narrowing of differentials with additional infrastructure/takeaway Transformative acquisition in new core play Accretive acquisition Doubles proved reserves Triples current production Pro forma Warren strongly positioned to create additional shareholder value Key Citrus employees joined Warren, providing platform for future growth Unique combination of high performing positive free cash flow oil assets in California combined with long life CBM in Wyoming and high growth natural gas properties in the Marcellus |
|
|
Pro Forma and Combined Warren Resources as of March 31, 2014 Combined Proved Reserves(1) (Bcfe) LTM PF EBITDA(2,3) ($MM) Combined Production(2) (MMcfe/d) 2014 Capex Budget(4) ($MM) Investing in the Future of Energy NASDAQ (WRES) 8 1. Warren reserves as of 12/31/13 NSAI reserve report. Marcellus reserves as of 6/30/14 NSAI reserve report. 2. Warren and Marcellus as of 3/31/14. 3. See Appendix for reconciliation of non-GAAP financial measures 4. As of 8/11/14. 117.7 99.3 96.4 96.4 106.0 310.9 202.5 407.3 Current Combined Oil Gas 18.4 18.4 17.8 99.8 36.2 118.2 Current Combined Oil Gas $82.4 $139.5 Current Pro Forma $116.0 $134.7 Current Combined |
|
|
Pro Forma Proved Reserves Investing in the Future of Energy NASDAQ (WRES) 9 Asset Summary Natural Gas Reserves Estimated Proved Reserves Composition Oil Reserves By Category Commodity Mix Estimated Proved Reserves of 407 Bcfe(1) 76% gas, 59% proved developed (PDP/PDNP) Source: SEC reserve report(s) 1. Warren reserve report as of 12/31/13. Citrus reserve report as of 6/30/14. 189.7 121.2 - 125 250 375 500 Gas PDP/PDNP Gas PUD Bcf PDP 50% PDNP 9% PUD 41% 8.5 7.6 - 5 10 15 20 Oil PDP/PDNP Oil PUD MMBbl Oil 24% Gas 76% |
|
|
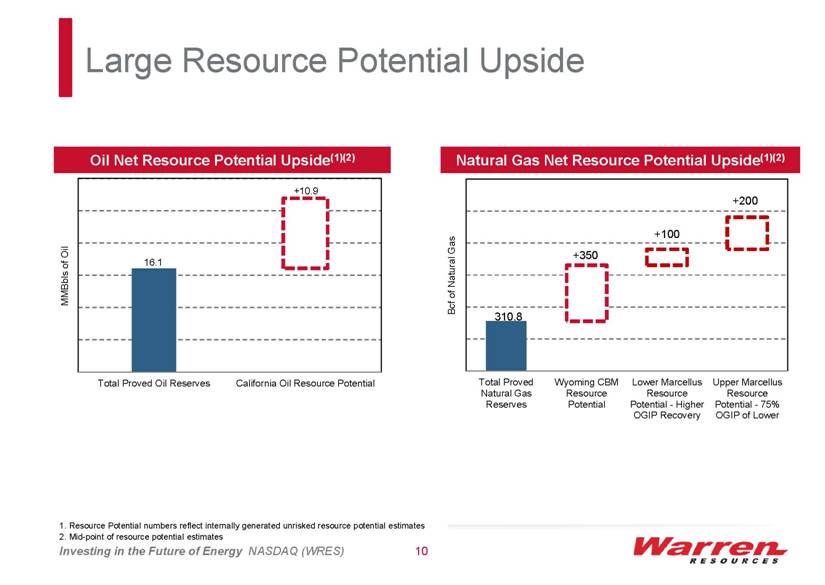
Large Resource Potential Upside Investing in the Future of Energy NASDAQ (WRES) 10 Oil Net Resource Potential Upside(1)(2) Resource Potential numbers reflect internally generated unrisked resource potential estimates Mid-point of resource potential estimates Natural Gas Net Resource Potential Upside(1)(2) |
|
|
Organic Growth: Turning Potential to Proved Investing in the Future of Energy NASDAQ (WRES) 11 1. Resource Potential numbers reflect internally generated unrisked resource potential estimates Strategies Marcellus Drill Lower Marcellus locations offset to PDP wells to prove-up greater recovery factor of OGIP Drill up to two Upper Marcellus wells in 2015 to test the concept California Test potential of identified up-dip and down-dip locations in developed zones and less developed areas of Wilmington Field (east side of WTU, west side of NWU) Data from initial Ford formation development program currently outperforming to inform avg. EUR bookings Test potential of deeper zones (237 and Schist) Wyoming Additional data from 2013 wells and 2014 program to inform YE14 reserve report Continue cost reduction efforts to increase economic locations for future development Resource Potential Upside(1) (Natural Gas) (Oil) |
|
|
Enhancing Growth with Accretive Acquisitions Investing in the Future of Energy NASDAQ (WRES) 12 Warren focuses on acquisitions which will complement and enhance the Company’s current operations and strategy Typical characteristics Warren screens for in an acquisition candidate: Operational and strategic fit – leverage skill sets, basin knowledge and operating expertise Significant PDP component (cash flow generation) Self-funded development or visible path to positive free cash flow in the near to medium term Significant upside potential (with additional zones, improved basin differentials, etc.); not included in valuation Discounted valuation due to “above ground” issues (unrelated to geology/reservoir) Line of sight to resolve or improve asset through operations and/or planning Cultural fit (if corporate acquisition or staff coming over with assets) |
|
|
California Operations Investing in the Future of Energy NASDAQ (WRES) 13 |
|
|
California: Wilmington Oil Field Investing in the Future of Energy NASDAQ (WRES) 14 Overview Los Angeles Basin Third largest U.S. oilfield Produced over 2.5 billion barrels of oil since discovery in the 1930’s Warren represents ~10% of current production of the Wilmington Field Primary operator in the area is Occidental Petroleum Warren-operated WTU and NWU have produced more than 150 and 38 MMBbls, respectively Waterflood development in the shallow Tar, Ranger and Upper Terminal formations Deeper Ford formation development commenced in 2014 5 stacked pay zones from 2,600’ to 6,000’ containing 14 reservoirs Warren Properties Wilmington Field 9 billion Bbls OOIP ~27% produced to date |
|
|
California: Wilmington Field Overview Investing in the Future of Energy NASDAQ (WRES) 15 Wilmington Townlot Unit (“WTU”) North Wilmington Unit (“NWU”) Operated by Warren with 99% WI / 81% NRI 1,440 gross (1,424 net) acres Produced over 150 MMBbls from primary and secondary production Avg. daily production (2Q 2014): 2,632 Bbls/d, net Proved Reserves(1): 11.8 MMBbls, net (60% PDP/PDNP) Operated by Warren with 100% WI / 85% NRI 1,036 gross and net acres Produced more than 38 MMBbls Avg. daily production (2Q 2014): 453 Bbls/d, net Proved Reserves(1): 4.2 MMBbls, net (31% PDP/PDNP) North Wilmington Unit Wilmington Townlot Unit Huntington Beach Seal Beach Long Beach Dominguez Rosecrans Chevice Hills Beverly Hills Salt Lake Los Angeles Bandin Sante Fe Springs West Coyote East Coyote Olive Krawe Richfield Yorba Linda Brea-Olenda Montebello CA L.A. Basin El Segundo Playa Del Rey Englewood WILMINGTON 68 PUD locations 82 additional currently identified probable, possible and contingent locations Approximately 9+ MMBbls incremental resource potential(2) Total Wilmington Field As of 12/31/13. Resource Potential numbers reflect internally generated unrisked resource potential estimates. |
|
|
California: Operations Overview Investing in the Future of Energy NASDAQ (WRES) 16 Existing WTU Cellar Wilmington Townlot Unit Apply risk management concepts to significantly reduce the probability of major business losses Model of urban development |
|
|
California: Wilmington Development Strategy Investing in the Future of Energy NASDAQ (WRES) 17 Producing Zones Oil Reservoirs Continue horizontal / sinusoidal development Drill “highly targeted wells” in 5 stacked pay zones from 2,600’ to 6,000’ containing 14 reservoirs Projecting per well IRRs of 30% - 70% $85.00 California Midway-Sunset (CMS) oil price deck used for planning Use modern technology to maximize recovery 27% of Warren’s 750 MMBbl OOIP produced since 1930’s As of Dec. 31st, 2013, estimated proved oil reserves of 16.1 net million barrels 35%+ OOIP recovery potential based on field performance Tar Ranger Terminal Ford/237 SW Schist Basement Union Pacific - 3000' - 6000' - 9000' NE Productive Limits One Mile |
|
|
Marcellus Operations Investing in the Future of Energy NASDAQ (WRES) 18 |
|
|
Marcellus Assets Overview Investing in the Future of Energy NASDAQ (WRES) 19 Asset Summary Map of Operations & Offset Operators Concentrated acreage position in Wyoming County, PA Offset operators include Cabot, Southwestern, and Chesapeake Citrus drilled 7 of the top 25 wells in the Marcellus in 2012 in terms of IP rates Over 75% of Citrus’ wells IPs have been in the top quartile of all Marcellus wells brought online since 2010 in terms of max 30-day IP rate Marcellus Wells Since 2010 (1) 1. Includes 5,022 Marcellus wells brought online since 2010 with publicly available gas production data between January 2010 and December 2013 per HPDI. - 5.0 10.0 15.0 20.0 25.0 30.0 35.0 - 1,000 2,000 3,000 4,000 5,000 30 Day Peak IP Rate (MMcf/d) Wells Marcellus Wells Citrus Wells 75% Percentile |
|
|
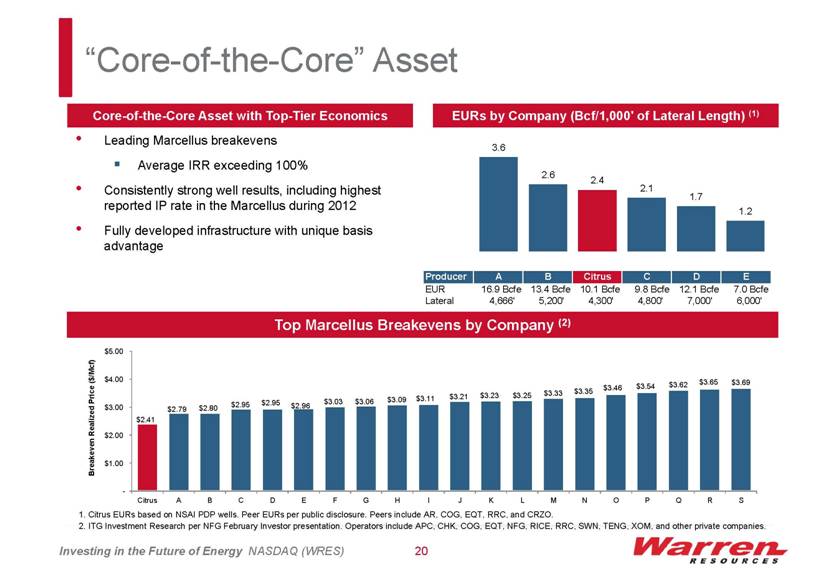
“Core-of-the-Core” Asset Core-of-the-Core Asset with Top-Tier Economics EURs by Company (Bcf/1,000' of Lateral Length) (1) Top Marcellus Breakevens by Company (2) 1. Citrus EURs based on NSAI PDP wells. Peer EURs per public disclosure. Peers include AR, COG, EQT, RRC, and CRZO. 2. ITG Investment Research per NFG February Investor presentation. Operators include APC, CHK, COG, EQT, NFG, RICE, RRC, SWN, TENG, XOM, and other private companies. Leading Marcellus breakevens Average IRR exceeding 100% Consistently strong well results, including highest reported IP rate in the Marcellus during 2012 Fully developed infrastructure with unique basis advantage Investing in the Future of Energy NASDAQ (WRES) 20 $2.41 $2.79 $2.80 $2.95 $2.95 $2.96 $3.03 $3.06 $3.09 $3.11 $3.21 $3.23 $3.25 $3.33 $3.35 $3.46 $3.54 $3.62 $3.65 $3.69 - $1.00 $2.00 $3.00 $4.00 $5.00 Citrus A B C D E F G H I J K L M N O P Q R S Breakeven Realized Price ($/Mcf) Producer A B Citrus C D E EUR 16.9 Bcfe 13.4 Bcfe 10.1 Bcfe 9.8 Bcfe 12.1 Bcfe 7.0 Bcfe Lateral 4,666' 5,200' 4,300' 4,800' 7,000' 6,000' 3.6 2.6 2.4 2.1 1.7 1.2 |
|
|
Established and Growing Infrastructure Investing in the Future of Energy NASDAQ (WRES) 21 Operational infrastructure system in place to support full field development All volumes gathered by Regency (formerly PVR) Two planned compressor stations to boost productivity First station completed in August 2013, resulted in a ~30% productivity boost; Second station is expected in Q3 2015 Estimated total capacity of 210 MMcf/d by YE 2014 with 24,000 combined horsepower Ample takeaway capacity of 285,000 gross MMBtu/d on entire position UGI’s Auburn I and Auburn II pipelines gives ability for Bi-directional flow to two interstate pipelines Provides flexibility to access the market with the most favorable pricing on a daily basis Volumes can be delivered north to Tennessee or south to Transco 165,000 gross MMBtu/d firm transportation agreement with UGI Pipeline and Gathering System Map Key Points Northeast Takeaway Expansion Projects 1. Does not include approximately 1 Bcf from proposed UGI Penn East project. Project Name Date Takeaway Capacity (MMcf/d) Transco NE Connector 01-Nov-14 100 TGP Rose Lake Expansion 01-Nov-14 230 Constitution Pipeline 01-Nov-15 650 TGP Niagara Expansion 01-Nov-15 158 TCO East Side Expansion 01-Nov-15 310 Transco Leidy Southeast 01-Dec-15 525 Algonquin AIM 01-Nov-16 342 DTI Iroquois (NIMO East) 01-Nov-16 275 Atlantic Sunrise 01-Jul-17 1,700 Total 4,290 (1) |
|
|
Compelling Upside Potential Investing in the Future of Energy NASDAQ (WRES) 22 Overview Upper Marcellus Opportunity to significantly increase reserves through targeting of the Upper Marcellus Cabot Oil & Gas, an offset operator to Citrus, has reported highly encouraging preliminary results from its Upper Marcellus test approximately 10 miles from Citrus’ acreage Cabot is currently projecting single well EURs of over 11 Bcf for Upper Marcellus locations Cabot successfully developing on 500’ spacing directly north of Citrus’ acreage Currently designing a compressor station that is expected to lower the system pressure by 350 psi and allow greater deliverability from the wells |
|
|
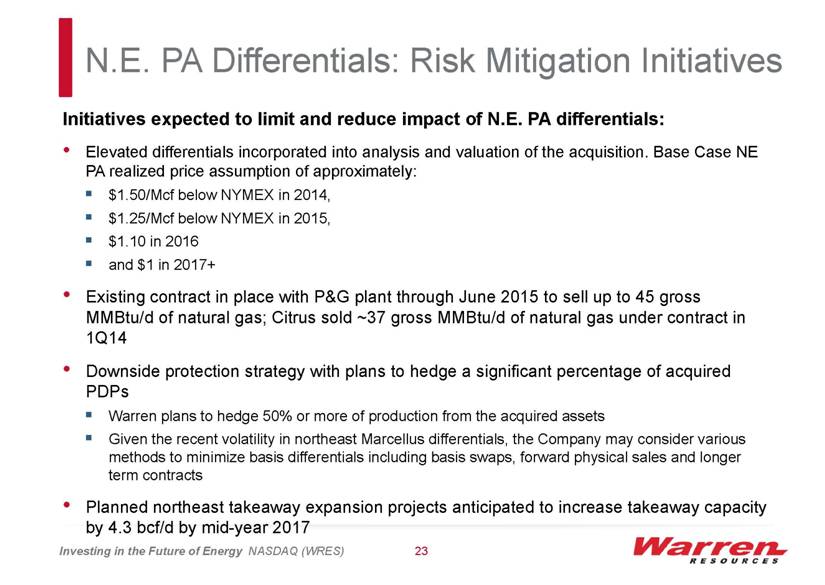
N.E. PA Differentials: Risk Mitigation Initiatives Initiatives expected to limit and reduce impact of N.E. PA differentials: Elevated differentials incorporated into analysis and valuation of the acquisition. Base Case NE PA realized price assumption of approximately: $1.50/Mcf below NYMEX in 2014, $1.25/Mcf below NYMEX in 2015, $1.10 in 2016 and $1 in 2017+ Existing contract in place with P&G plant through June 2015 to sell up to 45 gross MMBtu/d of natural gas; Citrus sold ~37 gross MMBtu/d of natural gas under contract in 1Q14 Downside protection strategy with plans to hedge a significant percentage of acquired PDPs Warren plans to hedge 50% or more of production from the acquired assets Given the recent volatility in northeast Marcellus differentials, the Company may consider various methods to minimize basis differentials including basis swaps, forward physical sales and longer term contracts Planned northeast takeaway expansion projects anticipated to increase takeaway capacity by 4.3 bcf/d by mid-year 2017 Investing in the Future of Energy NASDAQ (WRES) 23 |
|
|
Wyoming Operations Investing in the Future of Energy NASDAQ (WRES) 24 |
|
|
Wyoming: Atlantic Rim Operations Overview Investing in the Future of Energy NASDAQ (WRES) 25 Atlantic Rim Project Commercial CBM production established by Warren in 2002, Anadarko operator through end of 2012 Warren approved as operator of the Spyglass Hill Unit in the Atlantic Rim in 2013 Approx. 111,000 gross (86,000 net) acres prospective for CBM development as of 6/30/14 175 gross targeted drilling locations and an additional 225 potential locations 300-400 Bcf incremental resource potential(1) Over 60 well stimulation opportunities ~71,000 net acres prospective for deeper, oil and gas-bearing formations (Niobrara, Sussex Shannon, etc.) 1. Resource Potential numbers reflect internally generated unrisked resource potential estimates. Washakie |
|
|
Wyoming: Atlantic Rim - Sub-unit Detail Investing in the Future of Energy NASDAQ (WRES) 26 Area Summary as of June 30, 2014 Doty Mountain Sun Dog Grace Point Maxwell Hollow (formerly Brown Cow) Starr Draw Catalina Unit (ESCR operated) 2Q 2014 Net Proved Current Producing Avg. Production Reserves(1) Area Operator WI (%) Wells (MMcf/d) (Bcf) Operated Spyglass Hill Unit: Sun Dog Warren 69% 75 5.7 46.7 Doty Mountain Warren 73% 69 8.1 44.6 Grace Point Warren 81% 22 0.8 8.4 Other : Other Non-op 13% 71 3.3 6.3 Total 237 17.9 106.0 As of 12/31/13 |
|
|
Wyoming Deep Potential: Producing Zones Investing in the Future of Energy NASDAQ (WRES) 27 Atlantic Rim Zones Owns certain deep rights in a portion of the Atlantic Rim area ~71,000 net acres potentially prospective for oil bearing formations including: Sussex (oil) Shannon (oil) Niobrara (oil) Frontier (gas) Dakota (gas) Niobrara interval at depths between 6,000-8,000 ft. across trend Analogous to DJ and Powder River Basins Conducting geological analysis of potential of deeper zones Considering JV with strategic partners CBM – current Warren production CBM – current Warren production |
|
|
5. Financial Overview Investing in the Future of Energy NASDAQ (WRES) 28 |
|
|
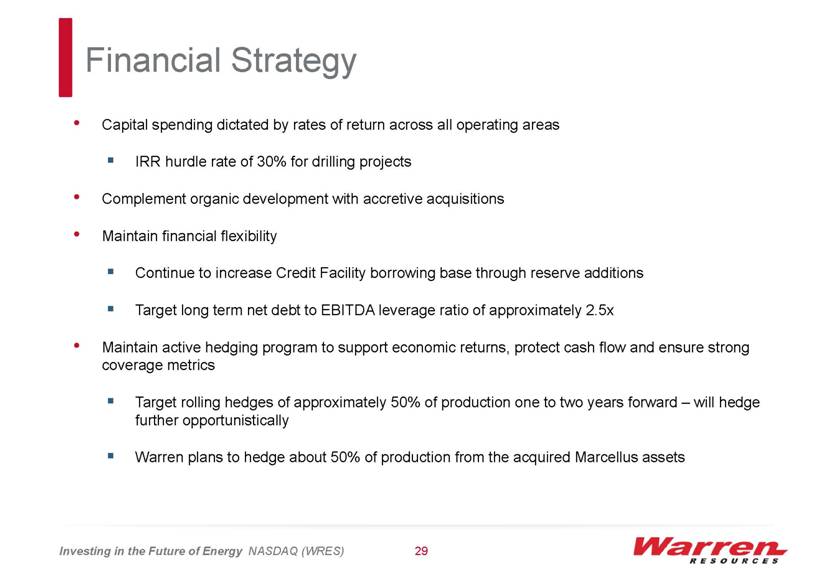
Financial Strategy Investing in the Future of Energy NASDAQ (WRES) 29 Capital spending dictated by rates of return across all operating areas IRR hurdle rate of 30% for drilling projects Complement organic development with accretive acquisitions Maintain financial flexibility Continue to increase Credit Facility borrowing base through reserve additions Target long term net debt to EBITDA leverage ratio of approximately 2.5x Maintain active hedging program to support economic returns, protect cash flow and ensure strong coverage metrics Target rolling hedges of approximately 50% of production one to two years forward – will hedge further opportunistically Warren plans to hedge about 50% of production from the acquired Marcellus assets |
|
|
Underlevered balance sheet prior to the acquisition Significant liquidity between revolver and cash on hand New, fully underwritten $750 million credit facility with $225 million borrowing base(3) Flexibility to tailor permanent capital structure Respond to market conditions Commitment to maintain financial discipline and ample liquidity Substantial free cash flow provides ability to reduce leverage Pro Forma Capitalization Pro Forma Capitalization Commentary Investing in the Future of Energy NASDAQ (WRES) 30 Source: Warren public filings Incremental draw on revolver in connection with the closing of the Marcellus Acquisition on 8/11/14 Reflects issuance of 6.67 million shares of Warren common stock issued on 8/11/14 in connection with the Marcellus Acquisition Borrowing Base increased $50 million to $225 million as of 8/11/14 As of June 30, 2014 Actual Adjustments Pro Forma Cash & Cash Equivalents (US$ mm) $1.8 $1.8 Revolving Credit Facility (US$ mm) 81.5 33.3(1) 114.8 New Senior Notes (US$ mm) -- 300.0 300.0 Other Debt (US$ mm) 1.5 1.5 Total Debt (US$ mm) $83.0 $416.3 Total Equity (US$ mm) $246.2 $40.0(2) $286.2 Total Capitalization (US$ mm) $329.2 $702.5 Liquidity Borrowing Base (US$ mm) $175.0 $50.0 $225.0 Less: Revolver Outstanding (US$ mm) (81.5) (33.3) (114.8) Revolver Availability (US$ mm) $93.5 $110.2 Plus: Cash & Cash Equivalents (US$ mm) 1.8 1.8 Total Liquidity (US$ mm) $95.3 $112.0 |
|
|
Summary Historical Financial Results Investing in the Future of Energy NASDAQ (WRES) 31 Production (MMcfe/d) Revenue ($MM) EBITDA ($MM)(1) Capital Expenditures ($MM) Note: LTM represents 12 months ended 3/31/14. 1. See reconciliation to US GAAP in Appendix. 15.7 15.9 15.0 18.2 18.2 18.4 10.6 12.7 13.8 15.1 17.1 99.3 26.3 28.7 28.7 33.3 35.2 117.7 - 20 40 60 80 100 120 140 2009 2010 2011 2012 2013 PF 1Q'14 Oil Production (MMcfe/d) Gas Production (MMcfe/d) $63 $88 $103 $122 $129 $203 - $40.0 $80.0 $120.0 $160.0 $200.0 $240.0 2009 2010 2011 2012 2013 PF LTM $5 $27 $67 $61 $73 $116 - $30.0 $60.0 $90.0 $120.0 2009 2010 2011 2012 2013 PF LTM $13 $46 $55 $66 $78 $140 - $30.0 $60.0 $90.0 $120.0 $150.0 2009 2010 2011 2012 2013 PF LTM |
|
|
Strong Record of Reducing Expenses Warren management has a strong track record of improving efficiency, growing production while lowering costs G&A per Boe(1) LOE per Boe(2) G&A includes non-cash stock based compensation expense and other items such as severance expense Lease operating expenses (LOE) includes property and production taxes (severance, fees, etc.) Investing in the Future of Energy NASDAQ (WRES) 32 |
|
|
Hedges Natural Gas Hedges(1) Derivatives Quantity(2) Period Gas NYMEX Swap $3.98(2) 12,000 MMBtu/d 07/01/14-12/31/14 Gas NYMEX Swap $4.18 3,000 MMBtu/d 01/01/15-12/31/15 Gas NYMEX CIG $0.20 6,000 MMBtu/d 07/01/14-12/31/14 Investing in the Future of Energy NASDAQ (WRES) 33 Oil Hedges(1) Derivatives Quantity(2) Period Oil Brent Swap $104.30 700 Bbl/d 07/01/14-09/30/14 Oil Brent Swap $102.12 800 Bbl/d 07/01/14-12/31/14 Oil NYMEX Swap $101.67 300 Bbl/d 10/01/14-12/31/14 Open hedges as of 8/11/14. Reflects a weighted average calculation. 1,300(2) 1,400 - 1,000 2,000 2014 (Bbl/d) |
|
|
Summary of Key Investment Highlights Investing in the Future of Energy NASDAQ (WRES) 34 |
|
|
Appendix Investing in the Future of Energy NASDAQ (WRES) 35 |
|
|
Large Inventory of Potential Drilling Locations Investing in the Future of Energy NASDAQ (WRES) 36 Marcellus, Pennsylvania: 20 gross PUD locations(1) 6 gross identified additional potential undeveloped Lower Marcellus locations(1)(2)(3) 48 gross identified additional potential undeveloped Upper Marcellus locations(1)(2)(3) In total represents 7.0+ years of drilling inventory(4) Wilmington Field, California: 68 gross PUD locations(1) 82 gross identified additional potential undeveloped locations(1)(2)(3) In total represents 6.5 years of drilling inventory(4) Leroy Pine, California: 16 gross identified additional potential undeveloped locations(1)(2) Atlantic Rim CBM, Wyoming: 49 gross PUD locations(1)(2) 351 gross additional potential undeveloped locations(1)(2) In total represents 16 years of drilling inventory(4) California and Wyoming as of 12/31/13; Marcellus as of 6/30/14 Probable, possible & contingent locations; internally generated unrisked estimated potential locations 15 gross locations in the WTU Upper Terminal and 7 gross locations in the WTU deep zones 237/Schist comprise total contingent locations Assumes 23 gross producer wells drilled per year in California, 25 gross producer wells in Wyoming, 10 producer wells/year in Marcellus Gross PUD Locations Gross Potential Additional Locations |
|
|
California: Wilmington Field Type Curves Investing in the Future of Energy NASDAQ (WRES) 37 WTU Tar WTU Ranger WTU Upper Terminal NWU Ranger WTU Ford Source: Company generated type curves Year Bbl/d Oil Decline 0 53 1 37 30% 2 27 27% 3 20 26% 4 16 20% Year Bbl/d Oil Decline 0 40 1 36 10% 2 33 8% 3 30 9% 4 27 10% EUR (Gross): 171 MBO Year Bbl/d Oil Decline 0 103 1 62 40% 2 43 31% 3 32 26% 4 25 22% Year Bbl/d Oil Decline 0 110 1 54 51% 2 36 33% 3 27 25% 4 21 22% Year Bbl/d Oil Decline 0 55 1 33 40% 2 24 27% 3 20 17% 4 17 15% EUR (Gross): 185 MBO EUR (Gross): 136 MBO EUR (Gross): 88 MBO EUR (Gross): 177 MBO |
|
|
Northeast Marcellus Type Curve Investing in the Future of Energy NASDAQ (WRES) 38 Northeast Marcellus Type Curve(1) Production from the 30 PDP wells currently exceeding Lower Marcellus type curve Offset operators have indicated that Upper Marcellus type curves are expected to yield 75% of Lower Marcellus results Commentary 1. Represents single PUD well type curve; not representative of all undeveloped locations. - 2,000 4,000 6,000 8,000 10,000 12,000 14,000 16,000 - 1 2 3 4 Mcf/d Gas Years EUR (Gross): 11.7 Bcf 30 - Day IP (Gross): 14.3 MMcf Year Mcf/d Gas Decline 0 14,324.5 1 5,218.7 64% 2 3,079.7 41% 3 2,149.7 30% 4 1,636.1 24% |
|
|
Wyoming CBM: Type Curve Investing in the Future of Energy NASDAQ (WRES) 39 Wyoming CBM Type Curve (1.0 Bcf) Source: Company generated type curve EUR (Gross): 0.8 - 1.16 Bcf Year Natural Gas Mcf/d 0 9 1 324 2 476 3 397 4 324 |
|
|
Non-GAAP Disclosure Warren reports its financial results in accordance with accounting principles generally accepted in the United States of America ("GAAP"). However, management believes certain non-GAAP measures provide useful information for investors as the Company utilizes non-GAAP measures internally to evaluate the performance of its operation and many of those same measures are commonly used by industry analysts to evaluate a company's operations as well as for comparison purposes to industry peers. Adjusted net income, a non-GAAP measure, excludes from the calculation of net income, the impact of unrealized non-cash gains or losses related to the mark to market of hedging contracts as well as other non-recurring items such as severance expense and other extraordinary items. Management views this measure as offering a more accurate picture of our current business operations as unrealized hedging gains and losses are accounting adjustments and have no cash impact on our operations. Additionally, by excluding non-recurring items, adjusted net income enables comparison of the business' ongoing prospects to previous periods. Discretionary cash flow, a non-GAAP measure, excludes the impact of changes in working capital from the calculation of cash flow from operations. Management views this measure as useful because it is widely accepted by the investment community as a means of measuring a company's ability to fund its capital expenditures, while excluding the fluctuations caused by changes in current assets and liabilities. "EBITDA" (earnings before interest expenses, income taxes, depreciation and amortization) is a non-GAAP measure and excludes the impact of working capital growth, capital expenditures, debt principal reductions, and other sources and uses of cash from net income. Management views this measure as useful because it indicates the Company's ability to generate cash flow at a level that can sustain its operations and support its capital investment program. EBITDA is a commonly used measure by the Company and industry peers to evaluate and compare operational performance and plan our capital expenditure programs. EBITDA is not a calculation based on GAAP and in measuring our Company's performance should not be considered as an alternative to net income/(loss), the most directly comparable GAAP financial measure. The PV-10 value represents a non-GAAP measure that differs from the standardized measure of discounted future net cash flows presented in Warren’s Form 10-K, which includes the effect of future income taxes. The standardized measure of discounted future net cash flows represents the present value of future cash flows attributable to our proved oil and natural gas reserves after income tax, discounted at 10%. The PV-10 value represents the present value of future cash flows attributable to our proved oil and gas reserves before income tax, discounted at 10% per annum. We use PV-10 value when assessing the potential return on investment related to our oil and gas properties. Although it is a non-GAAP measure, we believe that the presentation of the PV-10 value is relevant and useful to our investors because it presents the discounted future net cash flows attributable to our proved reserves prior to taking into account future corporate income taxes and our current tax structure. Investing in the Future of Energy NASDAQ (WRES) 40 |
|
|
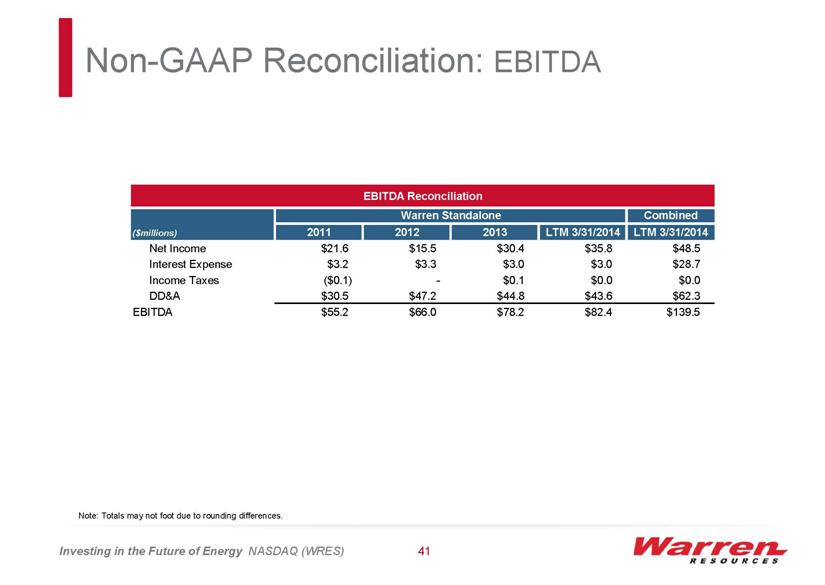
Investing in the Future of Energy NASDAQ (WRES) 41 Non-GAAP Reconciliation: EBITDA Note: Totals may not foot due to rounding differences. EBITDA Reconciliation Warren Standalone Combined ($millions) 2011 2012 2013 LTM 3/31/2014 LTM 3/31/2014 Net Income $21.6 $15.5 $30.4 $35.8 $48.5 Interest Expense $3.2 $3.3 $3.0 $3.0 $28.7 Income Taxes ($0.1) - $0.1 $0.0 $0.0 DD&A $30.5 $47.2 $44.8 $43.6 $62.3 EBITDA $55.2 $66.0 $78.2 $82.4 $139.5 |
|
|
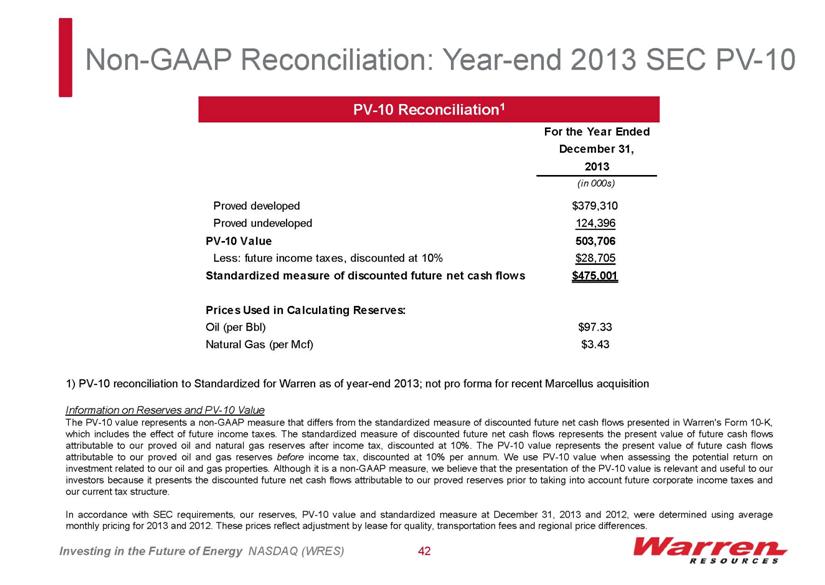
Investing in the Future of Energy NASDAQ (WRES) 42 PV-10 Reconciliation1 Non-GAAP Reconciliation: Year-end 2013 SEC PV-10 1) PV-10 reconciliation to Standardized for Warren as of year-end 2013; not pro forma for recent Marcellus acquisition Information on Reserves and PV-10 Value The PV-10 value represents a non-GAAP measure that differs from the standardized measure of discounted future net cash flows presented in Warren's Form 10-K, which includes the effect of future income taxes. The standardized measure of discounted future net cash flows represents the present value of future cash flows attributable to our proved oil and natural gas reserves after income tax, discounted at 10%. The PV-10 value represents the present value of future cash flows attributable to our proved oil and gas reserves before income tax, discounted at 10% per annum. We use PV-10 value when assessing the potential return on investment related to our oil and gas properties. Although it is a non-GAAP measure, we believe that the presentation of the PV-10 value is relevant and useful to our investors because it presents the discounted future net cash flows attributable to our proved reserves prior to taking into account future corporate income taxes and our current tax structure. In accordance with SEC requirements, our reserves, PV-10 value and standardized measure at December 31, 2013 and 2012, were determined using average monthly pricing for 2013 and 2012. These prices reflect adjustment by lease for quality, transportation fees and regional price differences. For the Year Ended December 31, 2013 (in 000s) Proved developed $379,310 Proved undeveloped 124,396 PV-10 Value 503,706 Less: future income taxes, discounted at 10% $28,705 Standardized measure of discounted future net cash flows $475,001 Prices Used in Calculating Reserves: Oil (per Bbl) $97.33 Natural Gas (per Mcf) $3.43 |
|
|
Warren Resources, Inc. Investing in the Future of Energy NASDAQ (WRES) 43 Please visit our new website: www.warrenresources.com |

