Attached files
| file | filename |
|---|---|
| EXCEL - IDEA: XBRL DOCUMENT - WARREN RESOURCES INC | Financial_Report.xls |
| EX-32 - EX-32 - WARREN RESOURCES INC | a2223515zex-32.htm |
| EX-21.1 - EX-21.1 - WARREN RESOURCES INC | a2223515zex-21_1.htm |
| EX-31.2 - EX-31.2 - WARREN RESOURCES INC | a2223515zex-31_2.htm |
| EX-99.1 - EX-99.1 - WARREN RESOURCES INC | a2223515zex-99_1.htm |
| EX-23.4 - EX-23.4 - WARREN RESOURCES INC | a2223515zex-23_4.htm |
| EX-23.2 - EX-23.2 - WARREN RESOURCES INC | a2223515zex-23_2.htm |
| EX-23.1 - EX-23.1 - WARREN RESOURCES INC | a2223515zex-23_1.htm |
| EX-31.1 - EX-31.1 - WARREN RESOURCES INC | a2223515zex-31_1.htm |
| EX-23.3 - EX-23.3 - WARREN RESOURCES INC | a2223515zex-23_3.htm |
Use these links to rapidly review the document
TABLE OF CONTENTS
PART IV
INDEX TO FINANCIAL STATEMENTS
UNITED STATES
SECURITIES AND EXCHANGE COMMISSION
Washington, D.C. 20549
FORM 10-K
ý |
ANNUAL REPORT PURSUANT TO SECTION 13 OR 15(d) OF THE SECURITIES EXCHANGE ACT OF 1934 |
|
For the Fiscal Year Ended December 31, 2014 |
||
OR |
||
o |
TRANSITION REPORT PURSUANT TO SECTION 13 OR 15(d) OF THE SECURITIES EXCHANGE ACT OF 1934 |
|
COMMISSION FILE NUMBER 000-33275
Warren Resources, Inc.
(Exact name of registrant as specified in its charter)
| Maryland (State or other jurisdiction of incorporation or organization) |
11-3024080 (I.R.S. Employer Identification No.) |
|
1114 Ave of the Americas, New York, NY (Address of principal executive offices) |
10036 (Zip Code) |
Registrant's telephone number, including area code: (212) 697-9660
Securities registered pursuant to Section 12(b) of the Act: None
Securities registered pursuant to Section 12(g) of the Act:
| Common Stock, $.0001 par value per share (Title of Class) |
Indicate by check mark if the registrant is a well-known seasoned issuer, as defined in Rule 405 of the Securities Act. Yes o No ý
Indicate by check mark if the registrant is not required to file reports pursuant to Section 13 or Section 15(d) of the Act. Yes o No ý
Indicate by check mark whether the registrant (1) has filed all reports required to be filed by Section 13 or 15(d) of the Securities Exchange Act of 1934 during the preceding 12 months (or for such shorter period that the registrant was required to file such reports), and (2) has been subject to such filing requirements for the past 90 days. Yes ý No o
Indicate by check mark whether the registrant has submitted electronically and posted on its corporate Web site, if any, every Interactive Data File required to be submitted and posted pursuant to Rule 405 of Regulation S-T (§ 232.405 of this chapter) during the preceding 12 months (or for such shorter period that the registrant was required to submit and post such files). Yes ý No o
Indicate by check mark if disclosure of delinquent filers pursuant to Item 405 of Regulation S-K is not contained herein, and will not be contained, to the best of registrant's knowledge, in definitive proxy or information statements incorporated by reference in Part III of this Form 10-K or any amendment to this Form 10-K. ý
Indicate by check mark whether the registrant is a large accelerated filer, an accelerated filer, a non-accelerated filer, or a smaller reporting company. See definitions of "large accelerated filer," "accelerated filer," and "smaller reporting company" in Rule 12b-2 of the Exchange Act.
| Large accelerated filer o | Accelerated filer ý | Non-accelerated filer o (Do not check if a smaller reporting company) |
Smaller reporting company o |
Indicate by check mark whether the registrant is a shell company (as defined in Rule 12b-2 of the Act). Yes o No ý
The aggregate market value of the registrant's common stock held by non- affiliates of the registrant on June 30, 2014 was approximately $461.8 million.
The number of shares of registrant's common stock outstanding as of March 10, 2015 was 80,754,225 shares.
DOCUMENTS INCORPORATED BY REFERENCE:
The registrant intends to file a proxy statement pursuant to Regulation 14A not later than 120 days after the close of the fiscal year ended December 31, 2014. Portions of such proxy statement are incorporated by reference into Part III of this Annual report on Form 10-K.
WARREN RESOURCES, INC.
FORM 10-K
Warren's logo is a trademark or service mark of Warren. Other trademarks or service marks appearing herein are the property of their respective holders.
As used in this document, "Warren", "the Company", "we", "us" and "our" refer to Warren Resources, Inc. and its subsidiaries. The term "Warren E&P" refers to our wholly owned subsidiary Warren E&P, Inc.
For abbreviations or definitions of certain terms used in the oil and gas industry and in this annual report on Form 10-K, please refer to the section entitled "Glossary of Abbreviations and Terms".
2
CAUTIONARY STATEMENT REGARDING FORWARD-LOOKING STATEMENTS
The statements contained in this annual report on Form 10-K that are not historical are "forward-looking statements," as that term is defined in Section 27A of the Securities Act of 1933, as amended (the "Securities Act") and Section 21E of the Securities Exchange Act of 1934, as amended (the "Exchange Act"), that involve a number of risks and uncertainties.
These forward-looking statements include, among others, the following:
- •
- our ability to successfully and economically acquire, explore, develop and produce oil and natural gas resources;
- •
- our ability to obtain governmental and other permits and approvals;
- •
- the actual or potential impact of environmental and other governmental regulation;
- •
- our exploration and development drilling prospects, inventories, projects and programs;
- •
- our oil and natural gas reserve estimates;
- •
- volatility in commodity prices and market conditions for oil and natural gas;
- •
- our liquidity and ability to finance our acquisition, exploration and development operations and activities;
- •
- our future production, revenue, operating costs and results of operations;
- •
- the cost and availability of experienced labor;
- •
- our business and growth strategies;
- •
- our identified drilling locations;
- •
- availability and costs of drilling rigs, equipment and field services;
- •
- our ability to make and integrate acquisitions; and
- •
- our ability to effectively manage our areas of operations, including our most recently acquired area of operation in the Marcellus Shale in Pennsylvania.
These statements may be found under "Risk Factors," "Management's Discussion and Analysis of Financial Condition and Results of Operations," "Business and Properties" and other sections of this annual report on Form 10-K. Forward-looking statements are typically identified by use of terms such as "may," "will," "could," "should," "expect," "plan," "project," "intend," "anticipate," "believe," "estimate," "predict," "potential," "pursue," "target" or "continue," the negative of such terms or other comparable terminology, although some forward-looking statements may be expressed differently.
The forward-looking statements contained in this annual report on Form 10-K are largely based on our expectations, which reflect estimates and assumptions made by our management. These estimates and assumptions reflect our best judgment based on currently known market conditions and other factors. Although we believe such estimates and assumptions to be reasonable, they are inherently uncertain and involve a number of risks and uncertainties that are beyond our control. In addition, management's assumptions about future events may prove to be inaccurate. Management cautions all readers that the forward-looking statements contained in this annual report on Form 10-K are not guarantees of future performance, and we cannot assure any reader that such statements will be realized or the forward-looking events and circumstances will occur. Actual results may differ materially
3
from those anticipated or implied in the forward-looking statements due to a number of factors, including:
- •
- commodity price volatility;
- •
- domestic and worldwide economic conditions;
- •
- potential adverse changes in general economic conditions, including performance of financial markets, interest rates and unemployment
rates;
- •
- unsuccessful drilling or operating activities;
- •
- the inability to develop our reserves through exploration and development activities;
- •
- potential impact of environmental and other governmental regulation, including delays in obtaining governmental and other permits and
approvals, and impacts on competing energy sources as well as on natural gas;
- •
- possible legislative or regulatory changes, including severance or production tax regimes, hydraulic-fracturing regulation, additional
drilling and permitting regulations, oil and natural gas derivatives reform, changes in state, federal and foreign income taxes, environmental regulation (including with respect to climate change and
greenhouse gas emissions), environmental risks and liability under federal, state, foreign and local environmental and other laws and regulations;
- •
- the failure to obtain sufficient capital resources to fund our operations;
- •
- our ability to repay our debt;
- •
- the extent to which natural gas markets in the United States become integrated with global natural gas markets through the approval
and development of infrastructure supporting the export of liquefied and other natural gas;
- •
- a decline in oil or natural gas production;
- •
- changes in the localized and global supply and demand fundamentals of natural gas and oil and transportation availability;
- •
- incorrect estimates of reserve quantities, operating costs and capital expenditures;
- •
- increases in the cost of drilling, completion and gas gathering or other costs of production and operations;
- •
- hazardous and risky drilling operations; and
- •
- an inability to grow.
You should also consider carefully the statements under "Risk Factors" and other sections of this annual report on Form 10-K, which address additional factors that could cause our actual results to differ from those set forth in the forward-looking statements.
All forward-looking statements speak only as of the date of this annual report on Form 10-K. We do not intend to publicly update or revise any forward-looking statements as a result of new information, future events or otherwise, except as required by law. These cautionary statements qualify all forward-looking statements attributable to us or persons acting on our behalf.
Items 1 and 2: Business and Properties
Overview
We are an independent energy company engaged in the exploration, development and production of domestic onshore crude oil and gas reserves. We focus our efforts primarily on the development of
4
our waterflood oil recovery properties in the Wilmington field within the Los Angeles Basin of California, our recently acquired position in the Marcellus Shale in northeastern Pennsylvania and our coalbed methane, or CBM, natural gas properties located in the Rocky Mountain region.
As of December 31, 2014, we owned natural gas and oil leasehold interests in approximately 113,307 gross (84,240 net) acres, approximately 70% of which are undeveloped. Substantially all our undeveloped acreage is located in the Rocky Mountains. We have identified approximately 140 gross drilling locations in our Wilmington field units. Additionally, we have identified approximately 140 gross drilling locations on our acreage in the Rocky Mountains, primarily on 80-acre well spacing and 74 gross drilling locations in the Marcellus Shale.
As of December 31, 2014, we had estimated net proved reserves of 71.3 MMBoe, with a PV-10 Value of $609 million, based on a reserve report prepared by Netherland, Sewell & Associates, Inc. These estimated net proved reserves include 16.8 MMBbls in our Wilmington units (24%), 212 Bcf in our Marcellus field in Pennsylvania (50%) and 114 Bcfe primarily in our CBM program in the Washakie Basin (26%). These estimated net proved reserves are located on approximately 30% of our total net acreage.
As of December 31, 2014, we had interests in 529 gross (366 net) producing wells and are the operator for 93% of these wells. For the fourth quarter of December 2014, our average daily production was twenty nine thousand barrels of oil equivalent per day ("MBoe/d") gross (16.4 MBoe/d net). For 2015, we have a projected total capital expenditure budget of approximately $21 million.
Our common stock is traded on the NASDAQ Stock Market under the trading symbol "WRES". The Company was incorporated on June 12, 1990 as a Delaware corporation for the purpose of acquiring and developing oil & gas properties. In 2004, the Company was reincorporated as a Maryland corporation.
Business Strategy
The principal elements of our business strategy are designed to grow our oil and gas reserves, production volumes and cash flows at a positive return on invested capital. We intend to accomplish this by focusing on the following key strategies:
- •
- Acquire Additional
Assets. We will continue to review asset acquisitions that meet our economic criteria with a focus on development potential of oil and
gas properties that can be developed at a reasonable cost.
- •
- Exploit Existing Properties Through the
Drillbit. We seek to maximize the value of our existing asset base by developing properties that have production and reserve growth
potential while also attempting to control production costs. We have identified a total of approximately 140 gross oil well drilling locations in our Wilmington Field oil properties, 74 gross drilling
locations in the Marcellus Shale and 140 gross drilling locations in our Rocky Mountain CBM properties, which we plan to develop using capital expenditures within cashflow from operations. Our
drilling locations are located in mature fields with established production profiles and supported by existing infrastructure and end markets.
- •
- Increase Production and Increase Proved Developed Producing Reserves
from our Existing Oil and Gas Asset Base. We intend to increase our proved reserves and production in future years by drilling wells on
our properties with undeveloped reserves or with resource potential, which represents approximately 70% of our acreage position at December 31, 2014.
- •
- Invest our Capital in a Disciplined Manner and Maintain a Strong Financial Position. We focus on utilizing our available capital on projects where we are likely to have success in increasing
5
- •
- Reduce Costs Through Economies of Scale and Efficient
Operations. As we continue to increase our production and develop our existing properties, we expect that our cost structure will
benefit from economies of scale. We seek to exert more control over costs and timing in our exploration, development, production and operating activities.
- •
- Control Operations and Costs. We seek to serve as the operator of the wells in which we have a significant interest. As the operator, we are better positioned to control the timing and plans for future enhancement and exploitation efforts, the costs of drilling, completing, enhancing and producing the wells, and the marketing negotiations for our gas and oil production. We believe this enables us to maximize both production volumes and wellhead prices.
production and/or proved reserves at attractive returns. We believe that maintaining a strong financial position will allow us to capitalize on investment opportunities in all commodity cycles. Our capital programs are generally developed to be funded through internally generated cash flows and the use of our credit line, but we also may obtain alternative sources of capital to develop our assets through partnerships, joint ventures or other investment opportunities with third parties or additional debt or equity. We hedge a portion of our production and generally utilize long-term sales contracts to maintain a strong financial position and provide us with cash flow necessary for the development of our assets.
Business Strengths
Balanced Asset Portfolio. Since 1999, we have grown our asset base and diversified our production through California oil property acquisitions in the Los Angeles Basin and Santa Maria Basin and natural gas property acquisitions in the Rocky Mountains and the Marcellus Shale that have significant growth potential. We believe our diverse asset base provides us with the flexibility to reallocate capital among our assets depending on fluctuations in natural gas and oil prices, as well as area economics.
Long-Lived Proved Reserves with Stable Production Characteristics. Our properties generally have long reserve lives and reasonably stable and predictable well production characteristics, with a ratio of total estimated proved reserves to production of approximately 16 years.
Low-Risk Multi-Year Drilling Inventory in Established Resource Plays. Most of our drilling locations are located in proven resource plays that possess low geologic risk and lead to predictable drilling results. We have identified approximately 140 gross drilling locations in our California assets that have an average vertical depth of less than 4,000 feet and are located in areas where we are an established driller and producer and 74 gross drilling locations in the Marcellus Shale.
Operational control and financial flexibility. As of December 31, 2014, we were the operator of record for 93% of our producing wells. We generally prefer to retain operating control over our properties, which allows us to more effectively control operating costs, timing of development activities and technological enhancements, marketing of production, and allocation of our capital budget. In addition, the timing of most of our capital expenditures is discretionary, which allows us a significant degree of flexibility to adjust the size of our capital budget. In response to a decline in commodity prices and current market conditions, we have reduced our expected capital expenditure budget for 2015 to an estimated $21 million, compared to $108.7 million of actual capital expenditures in 2014. Because of the decline in oil and gas prices, we have chosen to finance our 2015 capital expenditure budget primarily through our internally generated operating cash flows.
Experienced management and operational teams. Our core team of technical staff and operating managers have broad industry experience, including experience in horizontal and directional drilling, waterflood recovery operations, Marcellus development and CBM development and completion. Each of our operational teams in our Pennsylvania, California and Wyoming projects has extensive operating experience in their respective geographic areas. We continue to utilize technologies and waterflood
6
recovery practices that will allow us to optimize production and improve the ultimate recoveries of crude oil on our California properties.
Areas of Exploration and Development Activities
Our exploration and development activities are focused primarily on waterflood oil recovery projects in the Wilmington field in California CBM projects in the Rocky Mountain region and our Marcellus Shale project that utilizes horizontal drilling and hydraulic fracturing techniques to develop dry natural gas. The table below highlights our main areas of activity:
Area
|
Gross Acres | Net Acres | Net Undeveloped Acreage |
|||||||
|---|---|---|---|---|---|---|---|---|---|---|
Atlantic Rim Project, Wyoming |
96,268 | 73,354 | 52,842 | |||||||
Wilmington Field, California |
2,476 | 2,460 | 891 | |||||||
Marcellus, Pennsylvania |
6,513 | 5,288 | 2,608 | |||||||
Pacific Rim Project, Wyoming |
677 | 471 | 471 | |||||||
Other(1) |
7,374 | 2,666 | 1,950 | |||||||
| | | | | | | | | | | |
Total |
113,308 | 84,239 | 58,762 | |||||||
| | | | | | | | | | | |
| | | | | | | | | | | |
| | | | | | | | | | | |
- (1)
- Includes conventional oil and gas properties located primarily in New Mexico and Texas.
California Projects
Wilmington Townlot Unit
Our Wilmington Townlot Unit ("WTU") is located in the Wilmington field within the Los Angeles Basin of California. The WTU, a unitized oil field consisting of 1,440 gross (1,424 net) acres, has produced more than 149 million barrels of oil from primary and secondary production. All the working interests in the WTU are subject to the terms and provisions of a unit operating agreement. We own an approximate 98.9% undivided working interest in the WTU.
During December 2014, we averaged 3,193 barrels of oil per day ("Bbls/d") gross, (2,588 Bbls/d net) production in the WTU, compared to 3,495 Bbls/d gross (2,832, Bbls/d net) production during December 2013. As of December 31, 2014, there were 130 gross (129 net) producing wells. In addition, estimated proved reserves as of December 31, 2014 were 15.5 MMbbls gross (12.6 MMbbls net), of which approximately 56% are PDP or PDNP and 44% are PUDs. We seek to develop our PUD reserves using directional and horizontal drilling and secondary recovery techniques, such as a waterflood recovery.
North Wilmington Unit
The North Wilmington Unit ("NWU") is located in the Wilmington oil field adjacent to our existing WTU. All working interests in the NWU are subject to the terms and provisions of a unit operating agreement. We own a 100% working interest and an approximate 84.7% net revenue interest in the NWU, including existing wells, certain equipment and certain surface properties.
During December 2014, we averaged 700 Bbls/d gross, (593 Bbls/d net) production in the NWU. As of December 31, 2014, there were 33 gross and net producing wells. In addition, estimated proved reserves as of December 31, 2014 were 5.0 MMbbls gross (4.2 MMbbls net), of which 36% are PDPs and 64% are PUDs.
7
Pennsylvania Marcellus Project
Our Pennsylvania properties consist of a concentrated, contiguous acreage position located in Wyoming County, Pennsylvania in the northeast portion of the Marcellus Shale. We acquired these assets (the "Marcellus Assets") in August 2014 from Citrus Energy Corporation ("Citrus") and two other working interest owners in exchange for approximately 6.7 million shares of our common stock and cash consideration of approximately $312.5 million. We now operate approximately 6,512 gross (5,289 net) acres in the Marcellus Shale. We hold an approximate 75% working interest and an approximate 60% net revenue interest in these Marcellus Assets. The Marcellus Assets net average gas production for the three months ended December 31, 2014 was approximately 64.6 MMcfe/d. We have 30 gross (22.5 net) producing wells in the Marcellus. We have identified 26 additional drilling locations in the Lower Marcellus. Estimated net proved reserves as of December 31, 2014 were 212 Bcfe, of which 51% are PDP. While the majority of current production and reserves are attributable to the Lower Marcellus formation, we intend to continue testing in the Upper Marcellus, where we have identified 48 additional locations.
The assets include a robust and scalable infrastructure system that will enable us to further our development of the Marcellus Assets, including a gathering and compression system, takeaway capacity to end markets, a significant local customer, and abundant water supply.
Rocky Mountain Projects in the Washakie Basin
The Washakie Basin is located in the southeast portion of the Greater Green River Basin in southwestern Wyoming and represents our largest acreage position. As of December 31, 2014, we owned 96,945 gross (73,825 net) acres prospective for CBM development in this area, of which 53,313 net acres were undeveloped. This area contains approximately 140 gross identified drilling locations primarily on 80-acre well spacing. As of December 31, 2014 estimates that the estimated gross recoverable proved reserves in this basin were 193.0 Bcf gross (112.1 Bcf net) on 80-acre well spacing.
In addition to this acreage, we have the rights to drill and develop the deeper, conventional formations ("deep rights") in some, but not all, of the acreage in the Atlantic Rim area. We own approximately 60,422 gross (50,971 net) undeveloped acres of deep rights inside the Spyglass Hill Unit, and approximately 12,790 gross (8,099 net) undeveloped acres of deep rights outside the Spyglass Hill Unit, for a total of 73,212 gross (59,070 net) undeveloped acres in the entire Atlantic Rim area.
The net average gas production for our Wyoming assets for the three months ended December 31, 2014 was approximately 13 MMcfe/d. We have 299 gross (177 net) producing wells in the Washakie Basin. We have identified 140 additional drilling locations in our assets in the Basin. Estimated net proved reserves as of December 31, 2014 were 111 Bcfe, of which 72% are PDP and PDNP.
Atlantic Rim Project
Our Atlantic Rim project comprises approximately 96,268 gross (73,355 net) acres on the eastern rim of the Washakie Basin. As of December 31, 2014, we had drilled a total of 441 wells. Currently, we are developing our acreage in the Atlantic Rim project within the Spyglass Hill Unit.
Spyglass Hill Unit
In June, 2011, the U.S. Bureau of Land Management ("the BLM") approved the Spyglass Hill Unit in the Atlantic Rim area. The Spyglass Hill Unit covers approximately 97,000 gross acres and includes the areas previously committed to the Sun Dog, Doty Mountain, Jack Sparrow and Brown Cow Units, as well as all additional leases in the southern portion of the project area. In October 2012, Warren was nominated to become Operator of the Spyglass Hill Unit (see "Acquisition in Spyglass Hill and Catalina Units" below). Additionally, Warren's leases in the Spyglass Hill Unit area, which are
8
prospective for the deeper Niobrara oil formation, will be protected and perpetuated by Unit operations or production. The BLM requires the drilling of 25 CBM wells per year under the Spyglass Hill Unit Agreement. Set forth below are discussions of the three active Sub-Areas within the Spyglass Hill Unit: Sun Dog sub-area, Doty Mountain sub-area and Jack Sparrow sub-area. The Catalina Unit is not included within and remains unaffected by the formation of the Spyglass Hill Unit.
Acquisition in Spyglass Hill and Catalina Units
Effective August 1, 2012, the Company acquired certain additional natural gas and midstream assets from subsidiaries of Anadarko Petroleum Corporation ("Anadarko") in the Atlantic Rim Project in the Washakie Basin. By exercising its preferential rights under a purchase and sale agreement between Anadarko and Double Eagle Petroleum Co. we acquired 79% of Anadarko's 36.5% working interest (or 28.8%) in the Spyglass Hill Unit described in detail below, and acquired approximately 32,645 net leasehold acres therein. This increased our working interest in the entire unit from 30.1% to approximately 60%. We also acquired 26.5% of Anadarko's interest in the Catalina Unit area, which increased its working interest in the entire unit area from approximately 16.9% to 22%. Lastly, we acquired 100% of Anadarko's 50% interest in the gas gathering, compression and pipeline midstream assets within the Atlantic Rim Project. The midstream assets consist of gathering and compression equipment and a 59 mile long pipeline that transports gas from the gathering systems throughout the Spyglass Hill Unit area to the Wyoming Interstate Company (WIC) interstate gas transportation pipeline.
Sun Dog Sub-Area
Our initial pod, the Sun Dog sub-area, was a 10-well pilot program drilled in 2001 on 80-acre spacing. The Sun Dog sub-area commenced production in April 2002 at a rate of approximately 200 gross Mcf/d of gas and 6,000 Bbls/d of water. Currently, the Sun Dog sub-area consists of 113 wells. During December 2014, production from 113 producing wells averaged approximately 9,490 gross Mcf/d of gas and approximately 45,000 Bbls/d of water. Based on a report from Netherland, Sewell & Associates, Inc. as of December 31, 2014, estimated proved reserves for the wells in the Sun Dog sub-area were 82.3 Bcf gross (46.6 net) Bcf. We currently own a working interest of approximately 69% in the wells drilled in the participating area (the" PA") of the Sun Dog sub-area.
Doty Mountain Sub-Area
The Doty Mountain sub-area consists of 81 CBM wells on 80-acre spacing. During December 2014, these wells were producing approximately 13,639 gross Mcf/d of natural gas and 32,000 Bbls/d of water. Based on a report from Netherland, Sewell & Associates, Inc. as of December 31, 2014, estimated proved reserves for the wells in the Doty Mountain sub-area were 96.5 gross (60.8 net) Bcf. We currently own an approximate 77% working interest in the wells drilled in the PA of the Doty Mountain sub-area.
Grace Point Sub-Area (formerly Blue Sky/Jack Sparrow Unit)
The original CBM pilot was a 24-well program originally drilled on 160-acre spacing in 2003 to establish the Blue Sky sub-area. During 2005, we drilled 11 additional CBM wells to reduce the well spacing to 80-acres and accelerate de-watering. The sub-area was later renamed Jack Sparrow. Based on prior desorption, permeability, pressure build-up and other tests, we believed that as the wells dewater, they should exhibit daily production rates and a CBM production curve similar to other CBM wells in the Atlantic Rim project. However, in early 2009, operations were suspended due to economics. In 2011, the BLM required a 25 well drilling program in the area, which is now designated the Grace Point sub-area, to establish the larger Spyglass Hill Unit. These 25 wells are currently de-watering and producing and met the BLM productivity requirement in March 2012 to validate the
9
Spyglass Hill Unit. During December 2014, these wells produced approximately 1,105 gross Mcf/d of natural gas and 21,000 Bbls/d of water. Based on a report from Netherland, Sewell & Associates, Inc. as of December 31, 2014, estimated proved reserves for the wells in the Grace Point sub-area were 5.5 gross (3.8 net) Bcf. We own an approximate 81% working interest in the wells drilled in the PA of the Grace Point sub-area.
Catalina Unit
The Catalina Unit consists of 71 CBM wells. During December 2014, gross production from the Catalina unit averaged approximately 16,770 gross Mcf/d of natural gas and approximately 65,000 Bbls/d of water. Warren currently owns a working interest of approximately 13.4% in the PA in the Catalina Unit. Based on a report from Netherland, Sewell & Associates, Inc. as of December 31, 2014, estimated proved reserves for the wells in the Catalina unit were 8.6 Bcf gross (1.0 net) Bcf. Because we have a larger working interest in the undrilled locations, we expect that our working interest in the unit will be approximately 22% if the existing unit is fully drilled and developed. Warren's interest in the Catalina unit is operated by Escalera Resources Co.
Niobrara Shale Project
Warren owns certain deep rights below a portion of the Atlantic Rim CBM Project, which include an approximate 59,070 net acre position that is potentially prospective for hydrocarbon production from the Niobrara Shale and other deep formations. The acreage is primarily located in the southern portion of the Eastern Washakie Basin in Wyoming and is adjacent to and north of the Colorado border.
Warren estimates that the Niobrara Shale formation is at depths between 4,000 and 10,000 feet. Successful Niobrara Shale oil wells have been developed in southern Wyoming and northern Colorado. The Company is considering possibilities for developing the Niobrara Shale and other deep formations, including joint ventures, cooperative development agreements and joint participation agreements.
Oil and Natural Gas Reserves
Third Party Reserve Reporting and Controls Over Reserve Report
The reserves estimates shown herein for the years ended December 31, 2014, 2013 and 2012, have been independently evaluated by Netherland, Sewell & Associates, Inc. ("NSAI"), a worldwide leader of petroleum property analysis for industry and financial organizations and government agencies. NSAI's Letter is filed as an exhibit to this Form 10-K. NSAI was founded in 1961 and performs consulting petroleum engineering services under Texas Board of Professional Engineers Registration No. F-2699. Within NSAI, the technical persons primarily responsible for preparing the estimates set forth in the NSAI reserve report incorporated herein are Mr. C. Ashley Smith and Mr. Shane M. Howell. Mr. Smith has been practicing consulting petroleum engineering at NSAI since 2006. Mr. Smith is a Licensed Professional Engineer in the State of Texas (No. 100560) and has over 14 years of practical experience in petroleum engineering, with over 8 years experience in the estimation and evaluation of reserves. He graduated from University of Missouri-Rolla (Missouri University of Science & Technology) in 2000 with a Bachelor of Science Degree in Petroleum Engineering. Mr. Howell has been practicing consulting petroleum geology at NSAI since 2005. Mr. Howell is a Licensed Professional Geoscientist in the State of Texas, Geology (No. 11276) and has over 17 years of practical experience in petroleum geosciences, with over 9.5 years experience in the estimation and evaluation of reserves. He graduated from San Diego State University in 1997 with a Bachelor of Science Degree in Geological Sciences and in 1998 with a Master of Science in Geological Sciences. Both technical principals meet or exceed the education, training, and experience requirements set forth in the Standards Pertaining to the Estimating and Auditing of Oil and Gas Reserves Information promulgated by the Society of Petroleum Engineers; both are proficient in judiciously applying industry
10
standard practices to engineering and geoscience evaluations as well as applying SEC and other industry reserves definitions and guidelines. These reserves are then reviewed and approved by our in-house petroleum engineers and geoscientists who oversee and control preparation of the reserve report by working with the independent consulting petroleum engineers to ensure the integrity, accuracy and timeliness of data furnished to the independent consulting petroleum engineers for their review process. Warren's internal reserve review process is coordinated by a team of eight degreed reservoir, drilling, and production engineers and one degreed geologists, who have an average of nearly 16 years of experience in the oil and gas industry. The team is responsible for all technical work to meet the requirements of the SEC and NSAI, as well as our corporate standards. Warren's technical person who was primarily responsible for overseeing the preparation of our reserve estimates was its Vice President of Operations. He has over 8 years of experience in the oil and gas industry, including 5 years as either a reserve evaluator or manager. His professional qualifications include a bachelor's degree in Petroleum Engineering from the Colorado School of Mines and membership in the Society of Petroleum Engineers.
The reserves information in this Annual Report on Form 10-K represents only estimates. There are a number of uncertainties inherent in estimating quantities of proved reserves, including many factors beyond our control, such as commodity pricing. Reserve engineering is a subjective process of estimating underground accumulations of oil and natural gas that cannot be measured in an exact manner. The accuracy of any reserve estimate is a function of the quality of available data and of engineering and geological interpretation and judgment. As a result, estimates of different engineers may vary. In addition, results of drilling, testing and production subsequent to the date of an estimate may lead to revising the original estimate either negatively or positively. Accordingly, initial reserve estimates are often different from the quantities of oil and natural gas that are ultimately recovered. The meaningfulness of such estimates depends primarily on the accuracy of the assumptions upon which they were based. Except to the extent that we successfully develop our inventory of probable and possible locations, have positive revisions, acquire additional properties containing proved reserves or conduct successful exploration and development activities or both, our proved reserves will decline as reserves are produced. For additional information regarding estimates of proved reserves, the preparation of such estimates by NSAI and other information about our oil and natural gas reserves, see Note K Oil and Gas Reserve Data (Unaudited) to the Consolidated Financial Statements in Item 8.
The current SEC rules require that the reserve estimates are based on the 12-month unweighted arithmetic average of the first-day-of- the-month price for each month in the period January through December 2014. For oil volumes, the average Chevron Crude Oil Marketing Midway Sunset posted price of $92.40 per barrel is used for the California properties and the average West Texas Intermediate posted price of $91.48 per barrel is used for all other properties. These average prices are adjusted by field for quality, transportation fees, and market differentials. For gas volumes, the average CIG Rocky Mountains spot price of $4.362 per MMBTU is used for the Wyoming properties and the average Henry Hub spot price of $4.350 per MMBTU is used for all other properties. These average prices are adjusted by field for energy content, transportation fees, and market differentials. All prices are held constant throughout the lives of the properties. For the proved reserves, the average adjusted product prices weighted by production over the remaining lives of the properties are $86.71 per barrel of oil and $3.219 per MCF of gas. By area, these average adjusted prices are $86.71 per barrel of oil for the California business unit, $2.723 per MCF of gas for the Pennsylvania business unit and $4.19 per MCF of gas for the Wyoming business unit. All prices and costs associated with operating wells were held constant in accordance with the SEC guidelines.
The commodity price assumptions described above exceed the current market price of oil and gas. Therefore we may have a substantial downward adjustment in our estimated proved reserves in the future if the current low commodity price environment persists.
11
Estimated Proved Reserves
The following table presents our estimated proved natural gas and oil reserves and the PV-10 value of our interests in net reserves in producing properties as of December 31, 2014, 2013, and 2012 based upon reserve reports prepared by NSAI. The PV-10 values shown in the table are not intended to represent the current market value of the estimated natural gas and oil reserves we own.
| |
Years Ended December 31, | |||||||||
|---|---|---|---|---|---|---|---|---|---|---|
| |
2014 | 2013 | 2012 | |||||||
Estimated Proved Oil and Natural Gas Reserves: |
||||||||||
Net oil reserves (MBbls): |
||||||||||
Proved developed |
8,561 | 8,512 | 8,064 | |||||||
Proved undeveloped |
8,233 | 7,562 | 8,316 | |||||||
| | | | | | | | | | | |
Total |
16,794 | 16,074 | 16,380 | |||||||
| | | | | | | | | | | |
| | | | | | | | | | | |
| | | | | | | | | | | |
Net natural gas reserves (MMcf): |
||||||||||
Proved developed |
203,272 | 78,038 | 51,236 | |||||||
Proved undeveloped |
124,056 | 27,990 | — | |||||||
| | | | | | | | | | | |
Total |
327,328 | 106,028 | 51,236 | |||||||
| | | | | | | | | | | |
| | | | | | | | | | | |
| | | | | | | | | | | |
Total Net Proved Oil and Natural Gas Reserves (MBoe) |
71,349 | 33,745 | 24,919 | |||||||
| | | | | | | | | | | |
| | | | | | | | | | | |
| | | | | | | | | | | |
Estimated Present Value of Net Proved Reserves: |
||||||||||
PV-10 Value (in thousands) |
||||||||||
Proved developed |
$ | 460,059 | $ | 379,310 | $ | 337,786 | ||||
Proved undeveloped |
149,067 | 124,396 | 157,127 | |||||||
| | | | | | | | | | | |
Total(1) |
609,126 | 503,706 | 494,913 | |||||||
Less: future income taxes, discounted at 10% |
54,059 | 28,705 | 35,033 | |||||||
| | | | | | | | | | | |
Standardized measure of discounted future net cash flows (in thousands)(2) |
$ | 555,067 | $ | 475,001 | $ | 459,880 | ||||
| | | | | | | | | | | |
| | | | | | | | | | | |
| | | | | | | | | | | |
Prices Used in Calculating Reserves: |
||||||||||
Oil (per Bbl) |
$ | 86.71 | $ | 97.33 | $ | 104.27 | ||||
Natural Gas (per Mcf) |
$ | 3.22 | $ | 3.43 | $ | 2.51 | ||||
Proved Developed Reserves (MBoe) |
42,439 | 21,518 | 16,603 | |||||||
- (1)
- The
PV-10 Value represents the future net cash flows attributable to our proved oil and gas reserves before income tax, discounted at 10% per annum.
Although it is a non-GAAP measure, we believe that the presentation of the PV-10 Value is relevant and useful to our investors because it presents the discounted future net cash flows attributable to
our proved reserves prior to taking into account future corporate income taxes and our current tax structure. We use this measure when assessing the potential return on investment related to our oil
and gas properties. Our reconciliation of this non-GAAP financial measure is shown in the table as the PV-10, less future income taxes, discounted at 10% per annum, resulting in the standardized
measure of discounted future net cash flows. The standardized measure of discounted future net cash flows represents the present value of future cash flows attributable to our proved oil and natural
gas reserves after income tax, discounted at 10%. In accordance with SEC requirements, our reserves and the future net revenues at December 31, 2014, 2013 and 2012, were determined using
average monthly pricing for 2014, 2013 and 2012. These prices reflect adjustment by lease for quality, transportation fees and regional price differences.
- (2)
- Standardized measure of discounted future net cash flows differs from PV-10 value because it includes the effect of future income taxes.
12
The data in the above natural gas and oil reserves table represents estimates only. Oil and natural gas reserve engineering is inherently a subjective process of estimating underground accumulations of oil and natural gas that cannot be measured exactly. The accuracy of any reserve estimate is a function of the quality of available data and engineering and geological interpretation and judgment. Accordingly, reserve estimates may vary from the quantities of oil and natural gas that are ultimately recovered. See "Risk Factors".
PV-10 is equal to the future net cash flows from our proved reserves, excluding any future income taxes, discounted at 10% per annum ("PV-10"). Proved developed reserves are reserves that can be expected to be recovered through existing wells with existing equipment and operating methods. Proved undeveloped reserves are proved reserves that are expected to be recovered from new wells drilled to known reservoirs for which the existence and recoverability of such reserves can be estimated with reasonable certainty or from existing wells on which a relatively major expenditure is required to establish production. PV-10 may be considered a non-GAAP financial measure as defined by Item 10(e) of Regulation S-K and is derived from the standardized measure of discounted future net cash flows which is the most directly comparable GAAP financial measure. PV-10 is a computation of the standardized measure of discounted future net cash flows on a pre-tax basis. We believe that the presentation of the PV-10 is relevant and useful to investors because it presents the discounted future net cash flows attributable to our proved reserves prior to taking into account future corporate income taxes and it is a useful measure for evaluating the relative monetary significance of our oil and natural gas properties. Further, investors may utilize the measure as a basis for comparison of the relative size and value of our reserves to other companies. We use this measure when assessing the potential return on investment related to our oil and natural gas properties. However, PV-10 is not a substitute for the standardized measure of discounted future net cash flows.
Oil and gas prices significantly impact the calculation of the PV-10 and the standardized measure of discounted future net cash flows. The present value of future net cash flows does not purport to be an estimate of the fair market value of the Company's proved reserves. An estimate of fair value would also take into account, among other things, anticipated changes in future prices and costs, the expected recovery of reserves in excess of proved reserves and a discount factor more representative of the time value of money and the risks inherent in producing oil and gas. Future prices received for production and costs may vary, perhaps significantly, from the prices and costs assumed for purposes of these estimates. The 10% discount factor used to calculate present value, which is required by Financial Accounting Standard Board pronouncements, may not necessarily be the most appropriate discount rate. The present value, no matter what discount rate is used, is materially affected by assumptions as to timing of future production, which may prove to be inaccurate.
There are numerous uncertainties in estimating quantities of proved reserves and in projecting future rates of production and the timing of development expenditures, including many factors beyond our control. The reserve data set forth in this annual report on Form 10-K, are only estimates. Although we believe these estimates to be reasonable, reserve estimates are imprecise and may be expected to change as additional information becomes available. Estimates of natural gas and oil reserves, of necessity, are projections based on engineering data and there are uncertainties inherent in the interpretation of this data, as well as the projection of future rates of production and the timing of development expenditures. Reservoir engineering is a subjective process of estimating underground accumulations of natural gas and oil that cannot be exactly measured. Therefore, estimates of the economically recoverable quantities of natural gas and oil attributable to any particular group of properties, classifications of the reserves based on risk of recovery and the estimates are a function of the quality of available data and of engineering and geological interpretation and judgment and the future net cash flows expected there from, prepared by different engineers or by the same engineers at different times, may vary substantially. There also can be no assurance that the reserves set forth herein will ultimately be produced or that the proved undeveloped reserves will be developed within the
13
periods anticipated. Actual production, revenues and expenditures with respect to our reserves will likely vary from estimates, and such variances may be material. In addition, the estimates of future net revenues from our proved reserves and the present value thereof are based upon certain assumptions about future production levels, prices and costs that may not be correct.
With respect to the estimates prepared by NSAI, PV-10 value should not be construed as representative of the fair market value of our proved natural gas and oil properties since discounted future net cash flows are based upon projected cash flows which do not provide for changes in natural gas and oil prices or for the escalation of expenses and capital costs. The meaningfulness of such estimates is highly dependent upon the accuracy of the assumptions upon which they are based. Actual future prices and costs may differ materially from those estimated. You are cautioned not to place undue reliance on the reserve data included in this annual report on Form 10-K. Under SEC guidelines, prices used in computing reserves at December 31, 2014, 2013 and 2012, are based on 12 month average pricing for 2014, 2013 and 2012, respectively.
Productive Wells
The following table sets forth our gross and net productive wells as of December 31, 2014:
| |
Oil Wells | Natural Gas Wells |
Total | ||||||||||||||||
|---|---|---|---|---|---|---|---|---|---|---|---|---|---|---|---|---|---|---|---|
| |
Gross | Net | Gross | Net | Gross | Net | |||||||||||||
California |
163 | 161.6 | — | — | 163 | 161.6 | |||||||||||||
New Mexico |
2 | 0.03 | 22 | 2.3 | 24 | 2.3 | |||||||||||||
Pennsylvania |
— | — | 31 | 23.1 | 31 | 23.1 | |||||||||||||
Texas |
— | — | 10 | 2.6 | 10 | 2.6 | |||||||||||||
Wyoming |
— | — | 299 | 176.6 | 299 | 176.6 | |||||||||||||
Other |
2 | 0.1 | — | — | 2 | 0.1 | |||||||||||||
| | | | | | | | | | | | | | | | | | | | |
Total |
167 | 161.73 | 362 | 204.6 | 529 | 366.3 | |||||||||||||
| | | | | | | | | | | | | | | | | | | | |
| | | | | | | | | | | | | | | | | | | | |
| | | | | | | | | | | | | | | | | | | | |
Gross wells represent all wells in which we have a working interest. Net wells represent the total of our fractional undivided working interest in those wells. Productive wells include producing wells and wells mechanically capable of production.
Drilling Activity
The following table sets forth the number of gross exploratory and gross development wells drilled in which we participated during the last three fiscal years. The number of wells drilled refers to the number of wells completed at any time during the respective fiscal year. Productive wells are either producing wells or wells capable of commercial production.
| |
Years Ended December 31, | ||||||||||||||||||
|---|---|---|---|---|---|---|---|---|---|---|---|---|---|---|---|---|---|---|---|
| |
2014 | 2013 | 2012 | ||||||||||||||||
| |
Gross | Net | Gross | Net | Gross | Net | |||||||||||||
Exploratory Wells |
|||||||||||||||||||
Productive |
— | — | — | — | — | — | |||||||||||||
Dry |
— | — | — | — | — | — | |||||||||||||
Development Wells |
|||||||||||||||||||
Productive |
67 | 58.9 | 48 | 43.5 | 17 | 16.8 | |||||||||||||
Dry |
— | — | — | — | — | — | |||||||||||||
| | | | | | | | | | | | | | | | | | | | |
Total |
67 | 58.9 | 48 | 43.5 | 17 | 16.8 | |||||||||||||
| | | | | | | | | | | | | | | | | | | | |
| | | | | | | | | | | | | | | | | | | | |
| | | | | | | | | | | | | | | | | | | | |
14
Natural Gas and Oil Acreage
The following table sets forth our acreage position as of December 31, 2014:
| |
Developed | Undeveloped | Total | ||||||||||||||||
|---|---|---|---|---|---|---|---|---|---|---|---|---|---|---|---|---|---|---|---|
| |
Gross | Net | Gross | Net | Gross | Net | |||||||||||||
California |
1,583 | 1,569 | 893 | 891 | 2,476 | 2,460 | |||||||||||||
New Mexico |
1,066 | 98 | 2,924 | 350 | 3,990 | 448 | |||||||||||||
Pennsylvania |
3,301 | 2,680 | 3,212 | 2,608 | 6,513 | 5,288 | |||||||||||||
Texas |
704 | 176 | — | — | 704 | 176 | |||||||||||||
Wyoming |
32,714 | 20,512 | 64,231 | 53,313 | 96,945 | 73,825 | |||||||||||||
Other |
1,080 | 442 | 1,600 | 1,600 | 2,680 | 2,042 | |||||||||||||
| | | | | | | | | | | | | | | | | | | | |
Total |
40,448 | 25,477 | 72,860 | 58,762 | 113,308 | 84,239 | |||||||||||||
| | | | | | | | | | | | | | | | | | | | |
| | | | | | | | | | | | | | | | | | | | |
| | | | | | | | | | | | | | | | | | | | |
The primary terms of the Company's oil and gas leases expire on various dates in any given year. All of the Company's proved acreage is perpetuated by production, unitization or by continuous operations. This means that the Company will maintain its rights in these leases as long as oil or natural gas is produced from or operations are conducted on the acreage by the Company or other parties holding interests in those leases. In some cases, if production from a lease ceases, the lease will expire, and in other cases, if production from a lease is interrupted or ceases, the Company may maintain the lease by conducting additional operations on the acreage.
The Company has approximately zero, 485, and 506 net acres subject to leases with primary terms that expire in 2015, 2016 and 2017, respectively. We do not have any acreage subject to leases with primary terms set to expire in 2015. Leases covering 13,110 net acres expired in 2014. The Company has in the past been and expects in the future to be able to extend the terms of some of these leases by conducting operations thereon or by exchanging or selling some of these leases to or with other companies. The Company does not expect to lose material lease acreage because of a failure to drill due to inadequate capital, equipment, or personnel. However, if 25 gross CBM wells are not drilled on or before September 11, 2015, the Company has approximately 45,595 total net shallow acres subject to leases that will expire in 2017 in the Spyglass Hill Unit. These same leases will also expire in 2017 as to approximately 39,229 total net deep acres, unless the leases are otherwise perpetuated by unitization, development or other means. Based on the Company's evaluation of prospective economics, the Company has allowed acreage to expire and will continue to allow additional acreage to expire in the future.
Production Volumes, Sales Prices and Production Costs
The following table summarizes our net natural gas and oil production volumes, our average sales prices and expenses for the periods indicated. Our production is attributable to our direct interests in producing properties. For these purposes, our net production will be production that is owned by us, after deducting royalty, limited partner and other similar interests. The lease operating expenses shown
15
relates to our net production. In addition, this table summarizes our production for each field that contains 15% or more of our total proved reserves:
| |
Years Ended December 31, | |||||||||
|---|---|---|---|---|---|---|---|---|---|---|
| |
2014 | 2013 | 2012 | |||||||
Production: |
||||||||||
Oil (MBbls) |
||||||||||
Wilmington Field |
1,118.3 | 1,104.5 | 1,108.9 | |||||||
| | | | | | | | | | | |
Total |
1,118.3 | 1,104.5 | 1,108.9 | |||||||
| | | | | | | | | | | |
| | | | | | | | | | | |
| | | | | | | | | | | |
Natural Gas (MMcf) |
||||||||||
Marcellus |
9,784.8 | — | — | |||||||
Atlantic Rim |
5,897.0 | 5,773.2 | 5,071.8 | |||||||
Other |
403.0 | 459.1 | 442.6 | |||||||
| | | | | | | | | | | |
Total |
16,084.8 | 6,232.3 | 5,514.4 | |||||||
| | | | | | | | | | | |
| | | | | | | | | | | |
| | | | | | | | | | | |
Production: |
||||||||||
Total MBoe(1) |
3,799.1 | 2,143.2 | 2,027.9 | |||||||
Average Sales Price Per Unit: |
||||||||||
Oil (per Bbl) |
$ | 86.02 | $ | 97.12 | $ | 96.02 | ||||
Natural gas (per Mcf) |
$ | 3.06 | $ | 3.31 | $ | 2.78 | ||||
Weighted average sales price (per Boe) |
$ | 38.27 | $ | 59.69 | $ | 60.06 | ||||
Expenses (per Boe): |
||||||||||
Lease operating expense(2) |
$ | 12.73 | $ | 17.16 | $ | 16.31 | ||||
- (1)
- Natural
gas reserves are converted to oil reserves using a ratio of six Mcf to one Bbl of oil. This ratio does not assume price equivalency and, given price
differentials, the price for a barrel of oil equivalent for natural gas may differ significantly from the price for a barrel of oil.
- (2)
- Lease operating expenses related to our CBM operations include costs for operating our commercially productive CBM wells, together with the costs for operating our CBM wells that are still in the dewatering phase and are not yet commercially productive.
Crude Oil and Natural Gas Marketing
We sell our oil and natural gas production to various purchasers in the areas where the oil and natural gas is produced. Our revenues are highly dependent upon the prices of, and demand for, oil and gas. The markets for oil and gas have historically been volatile and are likely to continue to be volatile in the future. The prices we receive for our oil and gas production are subject to wide fluctuations and depend on numerous factors beyond our control, including location and quality differentials, seasonality, economic conditions, foreign imports, political conditions in other oil-producing and gas-producing countries, the actions of OPEC, and domestic government regulation, legislation and policies. Decreases in oil and gas prices have had, and could have in the future, an adverse effect on the carrying value and volumes of our proved reserves and our revenues, profitability and cash flow.
We use various derivative instruments to manage our exposure to commodity price risk on sales of oil and gas production. Derivatives provide us protection on the sales revenue streams if prices decline below the prices at which the derivatives are set. Our derivative instruments currently consist of swap agreements with financial institutions.
16
For 2014, the largest purchasers and marketers of our total oil and gas production were Clearwater Enterprises, Phillips 66 Company and Devlar Energy, which accounted for 43%, 29% and 26%, respectively, of our total production sold.
All of our oil reserves are located in California and are sold into a transportation pipeline which delivers our oil production to Phillips 66 Company, which operates a refinery in nearby Carson, California. All of our oil production in California is attributable to heavy crude (generally 21 degree API gravity crude oil or lower). The market price for California crude oil differs from the established market indices in the U.S., due principally to the higher transportation and refining costs associated with heavy oil. Effective August 1, 2012, we entered into an oil purchase contract with Phillips 66 Company whereby the Company sells its oil at the average Midway Sunset posted price for the month less $4.20 per barrel plus a premium for a gravity adjustment which should approximate $0.20 per barrel. For 2014, Warren received a weighted average price of approximately 92% of the NYMEX index price for crude oil sold under the Phillips 66 contract.
Our natural gas production in Pennsylvania and Wyoming is delivered into natural gas pipelines for transportation and is sold to various purchasers for later re-marketing or end use. The majority of all of our natural gas is sold under monthly contracts that allow for periodic adjustments in pricing according to market demands. The prices and marketing of natural gas and oil can be affected by factors beyond our control, the effects of which cannot be predicted, including seasonal variations, general market supply and other fluctuations. In the Marcellus Shale, we sell our natural gas at the Tennessee Gas Pipeline (TGP, Zone 4) or the Transco-Leidy Line receipts market price less transportation fees. Both price points in the Marcellus and the CIG price typically have a negative basis differential below the NYMEX Henry Hub prompt month natural gas price. Fluctuations between spot and index prices can significantly impact the overall differential to the Henry Hub. In the Atlantic Rim of the Washakie Basin, Wyoming, we sell our natural gas at the Rocky Mountain Colorado Interstate Gas ("CIG") market price less transportation fees. We believe that the loss of any of these purchasers would not have a material adverse effect on our operations, as we believe there are a significant number of readily available purchasers in the market. For more information about the risks to our business posed by our marketing activities see "Risk Factors".
Hedging Activities
We have designed a risk management policy for the use of derivative instruments to provide partial protection against certain risks relating to our ongoing business operations, such as commodity price risk. We have an active commodity hedging program to mitigate the risks of the volatile prices of oil and natural gas. Typically, we intend to hedge approximately 50% of our oil and natural gas production on a forward 12 to 18 month basis using a combination of swaps, cashless collars and other financial derivative instruments with counterparties that we believe are creditworthy. Our decision on the quantity and price at which we choose to hedge our production is based in part on our view of current and future market conditions. While there are many different types of derivatives available, we typically use collar agreements and swap agreements to attempt to manage price risk more effectively. The collar agreements are put and call options used to establish floor and ceiling commodity prices for a fixed volume of production during a certain time period. All collar agreements provide for payments to counterparties if the index price exceeds the ceiling and payments from the counterparties if the index price is below the floor. The price swaps call for payments to, or receipts from, counterparties based on whether the market price of oil, natural gas, and natural gas liquids for the period is greater or less than the fixed price established for that period when the swap is put in place. If the index price falls below the floor price, the counterparty pays us net of the fixed premium. If the index price rises above floor price, we pay the fixed premium. For additional information on our hedging activities, see "Item 7A. Quantitative and Qualitative Disclosures About Market Risk."
17
Our Service and Operational Activities
Our drilling, completion, production, re-entry and land operations are conducted, managed and supervised for us through Warren E&P, Inc., our wholly owned subsidiary ("Warren E&P"). Through Warren E&P, we employ petroleum engineers, geologists, drilling supervisors, landmen and field supervisors. Warren E&P also employs geologists, engineers and other personnel on a contract basis. As of December 31, 2014, Warren E&P was the operator of approximately 93% of the wells in which we had interests.
Competition
The oil and natural gas industry is highly competitive and we compete with a substantial number of other companies that have greater financial and other resources. Many of these companies explore for, produce and market oil and natural gas, as well as carry on refining operations and market the resultant products on a worldwide basis. The primary areas in which we encounter substantial competition are in locating and acquiring desirable leasehold acreage for our drilling and development operations, locating and acquiring attractive producing oil and natural gas properties, obtaining sufficient availability of drilling and completion equipment and services, obtaining purchasers and transporters of the oil and natural gas we produce and hiring and retaining key employees. In general, the bidding for natural gas and oil leases has become intense in the areas in which we operate with bidders evaluating potential acquisitions with varying product pricing parameters and other criteria that result in widely divergent bid prices. The presence of bidders willing to pay prices higher than are supported by our evaluation criteria could further limit our ability to acquire natural gas and oil leases. In addition, low or uncertain prices for properties can cause potential sellers to withhold or withdraw properties from the market. In this environment, we cannot guarantee that there will be a sufficient number of suitable natural gas and oil leases available for acquisition; that we can sell interests in natural gas and oil leases; or that we can obtain financing for, or locate participants to join in the development of prospects. Furthermore, competitive conditions may be substantially affected by various forms of energy legislation and/or regulation considered from time to time by the government of the United States and the states in which our properties are located. It is not possible to predict the nature of any such legislation or regulation which may ultimately be adopted or its effects upon our future operations. Such laws and regulations may substantially increase the costs of exploring for, developing or producing oil and natural gas and may prevent or delay the commencement or continuation of a given operation.
Regulations and Environmental Matters
General. Our operations are subject to a wide variety of stringent federal, state and local laws and regulations governing the exploration and production of oil and natural gas, including discharge of materials into the environment or otherwise relating to environmental protection. Our operations are subject to the same environmental laws and regulations as other companies in the oil and gas exploration and production industry in the areas where we operate. These laws and regulations:
- •
- require the acquisition of various permits before drilling, workovers, or water injection commences;
- •
- require the installation of expensive pollution control equipment;
- •
- restrict the types, quantities and concentration of various substances, including without limitation;
- •
- natural gas and water, that can be released into the environment in connection with drilling and production activities;
- •
- limit or prohibit drilling activities on lands lying within wildernesses, wetlands and other protected areas;
18
- •
- require remedial measures to prevent pollution from former operations, such as pit closures and plugging of abandoned wells;
- •
- impose substantial liabilities for pollution resulting from our operations;
- •
- require time consuming environmental analyses with respect to operations affecting federal, state and privately owned lands or leases;
and
- •
- expose us to litigation by environmental and other special interest groups.
These laws, rules and regulations may also restrict the rate of oil and natural gas production below the rate that would otherwise be possible. The regulatory burden on the oil and gas industry increases the cost of doing business in the industry and consequently affects profitability. These regulations have been changed frequently in the past and, in general, these changes have imposed more stringent requirements that increase operating costs and/or require capital expenditures to remain in compliance. Failure to comply with these requirements can result in civil and/or criminal penalties and liability for non-compliance, clean-up costs and other environmental damages, and injunctive relief requiring us to cease production. It also is possible that unanticipated developments or changes in the law could require us to make environmental expenditures significantly greater than those we currently expect. We believe that we substantially comply with all current applicable environmental laws and regulations, and that our continued compliance with existing requirements will not have a material adverse impact on our financial condition or results of operations. However, we cannot predict the passage of or quantify the potential impact of more stringent future laws and regulations at this time. For the year ended December 31, 2014, we did not incur any material expenditures for remediation or pollution control equipment at any of our facilities.
The environmental laws and regulations which could have a material impact on the oil and natural gas exploration and production industry are as follows:
National Environmental Policy Act. Oil and natural gas exploration and production activities on federal lands are subject to the National Environmental Policy Act ("NEPA"). NEPA requires federal agencies, including the Department of Interior, to evaluate major agency actions having the potential to significantly impact the environment. In the course of such evaluations, an agency will have an environmental assessment, or EA, prepared that assesses the potential direct, indirect and cumulative impacts of a proposed project. If impacts are considered significant, the agency will prepare a more detailed environmental impact statement, or EIS, that may be made available for public review and comment. All of our current and proposed exploration, production and development plans on federal lands require governmental permits that are subject to the requirements of NEPA. This process has the potential to delay the development of oil and natural gas projects. Authorizations under NEPA also are subject to protest, appeal or litigation, which can delay or halt projects.
Some of our exploration and production activities occur on federal leases. This is particularly true of our CBM operations. Exploration and production operations on federal leases are generally performed in accordance with a record of decision issued by the Bureau of Land Management ("BLM") after preparation of an EA or EIS. A record of decision typically includes environmental and land use provisions that restrict and limit exploration and production activities on federal leases. Much of our CBM operations are subject to records of decision, and we have not experienced any material difficulty in complying with their terms and conditions.
Waste Handling. The Resource Conservation and Recovery Act ("RCRA"), and comparable state statutes affect oil and gas exploration and production activities by imposing regulations on the generation, transportation, treatment, storage, disposal and cleanup of "hazardous wastes" and on the disposal of non-hazardous wastes. Under the auspices of the Environmental Protection Agency, or EPA, the individual states administer some or all of the provisions of RCRA, sometimes in conjunction with their own more stringent requirements. Drilling fluids, produced waters and most of the other wastes
19
associated with the exploration, development and production of crude oil, natural gas or geothermal energy constitute "solid wastes", which are regulated under the less stringent non-hazardous waste provisions, but there is no guarantee that the EPA or the individual states will not adopt more stringent requirements for the handling of non-hazardous wastes or categorize some non-hazardous wastes as hazardous for future regulation. Legislation has been proposed from time to time in Congress to re-categorize certain oil and gas exploration and production wastes as "hazardous wastes".
We believe we are in substantial compliance with the requirements of RCRA and related state and local laws and regulations, and that we hold all necessary and up-to-date permits, registrations and other authorizations to the extent our operations require them under such laws and regulations. Although we believe the current costs of managing our wastes as they are presently classified are reflected in our budget, any legislative or regulatory reclassification of oil and natural gas exploration and production wastes could increase our costs of managing and disposing of such wastes.
Comprehensive Environmental Response, Compensation and Liability Act. The Comprehensive Environmental Response, Compensation and Liability Act ("CERCLA"), also known as the "superfund" law, imposes joint and several liabilities, without regard to fault or legality of conduct, on classes of persons who are considered to be responsible for the release of a "hazardous substance" into the environment. These persons include the owner or operator of the disposal site, or site where the release occurred, and companies that disposed or arranged for the disposal of the hazardous substance. Under CERCLA, such persons may be subject to joint and several liabilities for the costs of cleaning up the hazardous substances that have been released into the environment, for damages to natural resources and for the costs of certain health studies. In addition, it is not uncommon for neighboring landowners and other third parties to file claims for personal injury and property damage allegedly caused by the hazardous substances released into the environment. Although petroleum is excluded from CERCLA's definition of "hazardous substance", in the course of our operations, we use materials that, if released, would be subject to CERCLA. Therefore, governmental agencies or third parties may seek to hold us responsible under CERCLA for all or part of the costs to clean up sites at which such "hazardous substances" have been deposited.
Water Discharges. The Federal Water Pollution Control Act, also known as the Clean Water Act, and analogous state laws impose restrictions and strict controls regarding the discharge of pollutants, including produced waters and other oil and gas wastes, into waters of the United States. The discharge of pollutants into regulated waters is prohibited, except in accordance with the terms of a permit issued by the EPA or the applicable state agency. These restrictions also prohibit the discharge of dredge and fill material in regulated waters, including wetlands, unless authorized by a permit issued by the U.S. Army Corps of Engineers. Federal and state regulatory agencies can impose administrative, civil and criminal penalties for non-compliance with discharge permits or other requirements of the federal Clean Water Act and analogous state laws and regulations. Response costs could be high and may have a material adverse effect on our operations. We may not be fully insured for these costs. We maintain all required discharge permits necessary to conduct our operations, and we believe we substantially comply with the terms thereof. Obtaining permits has the potential to delay the development of oil and natural gas projects. We anticipate that total maximum daily load water quality standards established under Clean Water Act delegated programs may be promulgated for surface water bodies in areas where we operate. However, we do not expect that any total maximum daily load regulations, or standards promulgated in any area where we operate, will result in a material increase in our produced water disposal costs because we already inject much of our produced water in disposal wells, rather than discharging into surface water bodies, and would be able to cost-effectively drill and operate additional disposal wells as needed.
Air Emissions. The Federal Clean Air Act and associated state laws and regulations regulate emissions of various air pollutants through the issuance of permits and the imposition of other
20
requirements. In addition, the EPA has developed, and continues to develop, stringent regulations governing emissions of toxic air pollutants at specified sources. Some of our new facilities will be required to obtain permits before work can begin, and existing facilities may be required to incur capital costs in order to remain in compliance. Major sources of air pollutants are subject to more stringent, federally based permitting requirements. On April 17, 2012, the EPA issued a final rule that established new source performance standards for volatile organic compounds ("VOCs") and sulfur dioxide, an air toxics standard for major sources of oil and natural gas production, and an air toxics standard for major sources of natural gas transmission and storage. These regulations apply to natural gas wells that are hydraulically fractured, or refractured, and to storage tanks and other equipment. Since January 1, 2015, all wells subject to the rule have been required to use "green completion" technology to limit emissions during well completion operations.
Because of the severity of ozone levels in portions of California, the state has the most severe restrictions on emissions of VOCs and nitrogen oxides ("NOX") of any state. Producing wells, natural gas plants and electric generating facilities all generate VOCs and NOX. Some of our producing wells are in counties that are designated as non-attainment for ozone and, therefore, potentially are subject to restrictive emission limitations and permitting requirements. California also operates a stringent program to control hazardous (toxic) air pollutants, and this program could require the installation of additional controls. Administrative enforcement actions for failure to comply strictly with air pollution regulations or permits generally are resolved by payment of monetary fines and correction of any identified deficiencies. Alternatively, regulatory agencies could require us to forego construction, modification or operation of certain air-emission sources. Air emissions from oil and natural gas operations also are regulated by oil and natural gas permitting agencies, including in California, the South Coast Air Quality Management District, the California Air Resources Board and other local agencies. These regulations may increase the costs of compliance for some facilities we own or operate, and federal and state regulatory agencies can impose administrative, civil and criminal penalties for non-compliance with air permits or other requirements of the Federal Clean Air Act and associated state laws and regulations. We believe we are in substantial compliance with all air emissions regulations, and that we hold all necessary and valid construction and operating permits for our operations. Obtaining permits has the potential to delay the development of our oil and natural gas projects. See "Future Regulation—Wilmington Field" below.
The Safe Drinking Water Act, Groundwater Protection, and the Underground Injection Control Program. The Federal Safe Drinking Water Act ("SDWA") and the Underground Injection Control ("UIC") program promulgated under the SDWA and state programs regulate the drilling and operation of salt water disposal wells. The EPA directly administers the UIC program in some states and in others it is delegated to the state for administering. Permits must be obtained before drilling salt water disposal wells, and casing integrity monitoring must be conducted periodically to ensure the casing is not leaking saltwater to groundwater. Contamination of groundwater by oil and natural gas drilling, production and related operations may result in fines, penalties and remediation costs, among other sanctions and liabilities under the SDWA and state laws. In addition, third party claims may be filed by landowners and other parties claiming damages for alternative water supplies, property damages and bodily injury.
We engage third parties to occasionally provide hydraulic fracturing or other well stimulation services to us in connection with many of the wells for which we are the operator. With the exception of hydraulic fracturing using diesel fuel, the SDWA exempt hydraulic fracturing from regulation under the UIC program. On February 12, 2014, the EPA released an "interpretative memorandum" providing technical recommendations for implementing UIC requirements for hydraulic fracturing activities using diesel fuels. In this guidance document, EPA expansively defined the term "diesel" to include hydrocarbons such as kerosene that have not typically been considered to be diesel. Bills which would have repealed the hydraulic fracturing exemption have been introduced in the last three sessions of Congress. In addition, the EPA is conducting a congressionally-mandated study on the effects of
21
hydraulic fracturing on drinking water resources. The results of this study are expected later in 2015. The EPA study, or other studies, of hydraulic fracturing could spur initiatives to further regulate hydraulic fracturing under the SDWA or other regulatory programs. In addition to federal regulation, certain states have adopted and are considering laws that require the disclosure of the chemical constituents in hydraulic fracturing fluids. Additional disclosure requirements could result in increased regulation, operational delays and increased operating costs that could make it more difficult to perform hydraulic fracturing.
California Environmental Quality Act ("CEQA"). CEQA is a California statute that requires consideration of the environmental impacts of proposed actions that may affect the environment. CEQA often requires the responsible governmental agency to prepare an environmental impact analysis document that is made available for public comment. In some cases, the responsible agency also is required to consider mitigation measures. The party requesting agency action bears the expense of the document.
In 2014, after a lengthy CEQA analysis, we received permit approvals from the South Coast Air Quality Management District ("SCAQMD") for the disposal of our WTU associated and produced gas, These permits allow us (i) to burn gas using a new high efficiency clean enclosed burner to replace the existing gas flare, and (ii) eventually, to sell the gas directly to a third party user by transporting the gas through transmission facilities owned by local gas utility companies. In the future, we may be required to undergo the CEQA process for other proposed actions by state and local governmental authorities that meet specified criteria. At a minimum, the CEQA process delays and adds expense to the process of obtaining new permits and permit renewals. See "Future Regulation—Wilmington Field" below.
Abandonment, Decommissioning and Remediation Requirements. Federal, state and local regulations provide detailed requirements for the abandonment of wells, closure or decommissioning of production and transportation facilities, and the environmental restoration of operations sites. The California Department of Conservation, Division of Oil, Gas and Geothermal Resources ("DOGGR") is the principal state agency responsible for regulating the drilling, operation, maintenance and abandonment of all oil and natural gas wells in the state of California.
Significant potential costs relating to environmental and land-use regulations associated with our existing properties and operations include those relating to (i) plugging and abandonment of facilities, (ii) clean-up costs and damages due to spills or other releases, and (iii) penalties imposed for spills, releases or non-compliance with applicable laws and regulations. As is customary in the oil and natural gas industry, we typically have contractually assumed, and may assume in the future, certain obligations relating to plugging and abandonment, clean-up and other environmental costs in connection with our acquisition of operating interests in oil and gas fields, and these costs can be significant.
Climate Change Legislation and Greenhouse Gas Regulations. Recent and future environmental regulations, including additional federal and state restrictions on greenhouse gas ("GHG") emissions that have been or may be passed in response to climate change concerns, may increase our operating costs and also reduce the demand for the oil and natural gas we produce.
Studies over recent years have indicated that emissions of certain gases may be contributing to warming of the Earth's atmosphere. In response to these studies, many nations have agreed to limit emissions of GHG pursuant to the United Nations Framework Convention on Climate Change, and the "Kyoto Protocol." Methane, a primary component of natural gas, and carbon dioxide, a byproduct of the burning of oil, natural gas and refined petroleum products, are considered "greenhouse gases" regulated by the Kyoto Protocol. Although the United States is not participating in the Kyoto Protocol, the United States Supreme Court has ruled, in Massachusetts, et al. v. EPA, that the EPA abused its discretion under the Clean Air Act by refusing to regulate carbon dioxide emissions from mobile sources. As a result of the Supreme Court decision and the change in presidential administrations, on
22
December 7, 2009, the EPA issued a finding that serves as the foundation under the Clean Air Act to issue other rules that would result in federal greenhouse gas regulations and emissions limits under the Clean Air Act, even without Congressional action. As part of this array of new regulations, on September 22, 2009, the EPA also issued a GHG monitoring and reporting rule that requires certain parties, including participants in the oil and natural gas industry, to monitor and report their GHG emissions, including methane and carbon dioxide, to the EPA. On November 30, 2010, the EPA published a final rule that set forth reporting requirements for the petroleum and natural gas industry. This rule requires companies that hold state drilling permits and that emit 25,000 metric tons or more of carbon dioxide equivalent per year to report annual carbon dioxide, methane and nitrous oxide emissions from certain sources beginning on March 31, 2012. On November 30, 2011, the EPA published a final rule that established technical amendments to certain greenhouse gas reporting requirements and extended the reporting deadline to September 2012 for the petroleum and natural gas industry sources to report their greenhouse gas emissions. These reporting obligations continue in effect.
The EPA has also issued a notice of finding and determination that emissions of carbon dioxide, methane and other GHGs present an endangerment to human health and the environment, which allows the EPA to begin regulating emissions of GHGs under existing provisions of the Clean Air Act. The EPA has begun to implement GHG-related reporting and permitting rules for certain stationary sources. The EPA's finding, the greenhouse gas reporting rules, and the rules to regulate the emissions of greenhouse gases may affect the outcome of other climate change lawsuits pending in United States federal courts in a manner unfavorable to our industry. Similarly, the U.S. Congress has considered, and may in the future consider, "cap and trade" legislation that would establish an economy-wide cap on emissions of GHGs in the United States and would require most sources of GHG emissions to obtain GHG emission "allowances" corresponding to their annual emissions of GHGs. Future federal climate change legislation could adversely impact our operations.
In addition to the EPA's actions to regulate GHGs, more than one-third of the states have begun taking action on their own to control and/or reduce emissions of greenhouse gases. Several multi-state programs have been developed or are in the process of being developed: the Regional Greenhouse Gas Initiative involving 10 Northeastern states and three Canadian provinces, the Western Climate Initiative involving California and four Canadian provinces, and the Midwestern Greenhouse Gas Reduction Accord involving seven states and one Canadian province. Any of the climate change regulatory and legislative initiatives described above could have a material adverse effect on our business, financial condition, and results of operations. On September 27, 2006, California's governor signed into law Assembly Bill (AB) 32, known as the "California Global Warming Solutions Act of 2006," which establishes a statewide cap on GHGs that will reduce the state's GHG emissions to 1990 levels by 2020 and establishes a "cap and trade" program. The California Air Resources Board adopted regulations in December 2010 to implement AB 32 that commenced on January 1, 2012.
Our operations could be adversely impacted by current and future state and local climate change initiatives.
Threatened and endangered species, migratory birds, and natural resources. Various state and federal statutes prohibit certain actions that adversely affect endangered or threatened species and their habitat, migratory birds, wetlands and natural resources. These statutes include the Endangered Species Act, the Migratory Bird Treaty Act, the Clean Water Act and CERCLA. The United States Fish and Wildlife Service may designate critical habitat and suitable habitat areas that it believes are necessary for survival of threatened or endangered species. A critical habitat or suitable habitat designation could result in further material restrictions to federal land use and private land use and could delay or prohibit land access or development. Where takings of or harm to species or damages to wetlands, habitat or natural resources occur or may occur, government entities or at times private parties may act to prevent oil and gas exploration activities or seek damages for harm to species, habitat or natural
23
resources resulting from drilling or construction or releases of oil, wastes, hazardous substances or other regulated materials, and may seek natural resources damages and in some cases, criminal penalties.
Hazard Communications and Community Right to Know
We are subject to federal and state hazard communications and community right to know statutes and regulations. These regulations govern record keeping and reporting of the use and release of hazardous substances, including, but not limited to, the federal Emergency Planning and Community Right-to-Know Act.
Occupational Safety and Health Act
We are subject to the requirements of the federal Occupational Safety and Health Act, commonly referred to as OSHA, and comparable state statutes that regulate the protection of the health and safety of workers. In addition, the OSHA hazard communication standard requires that information be maintained about hazardous materials used or produced in operations and that this information be provided to employees, state and local government authorities and the public.
Operating Regulation of the Oil and Gas Industry
In addition to environmental laws and regulations, exploration, production and operations in the oil and gas industry are extensively regulated by numerous federal, state and local authorities. Legislation affecting the oil and gas industry is under constant review for amendment or expansion, frequently increasing the regulatory burden. Numerous departments and agencies, both federal and state, are authorized by statute to issue rules and regulations binding on the oil and gas industry, some of which carry substantial penalties for failure to comply. Although the regulatory burden on the oil and gas industry increases our cost of doing business and, consequently, affects our profitability, these burdens generally do not affect us any differently or to any greater or lesser extent than they affect other companies in the industry with similar types, quantities and locations of production.
Drilling and Production. Our drilling and production operations are subject to various types of regulation at federal, state and local levels. These types of regulation include requiring permits and bonds for the drilling of wells and reports concerning operations. Most states and some counties and municipalities in which we operate also regulate one or more of the following:
- •
- the location of wells;
- •
- the method of drilling and casing wells;
- •
- the rates of production;
- •
- underground injection of water and other substances;
- •
- the surface use and restoration of properties upon which wells are drilled;
- •
- the plugging and abandoning of wells; and
- •
- notice to, and consultation with, surface owners and other third parties.
State laws regulate the size and shape of drilling and spacing units or proration units and govern the pooling of oil and natural gas properties. Some states allow forced pooling or integration of tracts to facilitate exploration, while other states rely on voluntary pooling of lands and leases. In some instances, forced pooling or unitization may be implemented by third parties and may reduce our interest in the unitized properties. In addition, state conservation laws establish maximum rates of production from oil and natural gas wells, generally prohibit the venting or flaring of natural gas, and impose requirements regarding the ratability of production. These laws and regulations may limit the
24
amount of natural gas and oil we can produce from our wells or limit the number of wells or the locations at which we can drill. Moreover, each state generally imposes a production or severance tax with respect to the production and sale of oil, natural gas and natural gas liquids within its jurisdiction.
Natural Gas Sales Transportation. Historically, federal legislation and regulatory controls have affected the price of the natural gas we produce and the manner in which we market our production. The Federal Energy Regulatory Commission, or FERC, has jurisdiction over the transportation and sale or resale of natural gas in interstate commerce by natural gas companies under the Natural Gas Act of 1938 and the Natural Gas Policy Act of 1978. Since 1978, various federal laws have been enacted that have resulted in the complete removal of all price and non-price controls for sales of domestic natural gas sold in "first sales", which includes all of the sales of our production.
FERC also regulates interstate natural gas transportation rates and service conditions, which affects the marketing of the natural gas we produce, as well as the revenues we receive for sales of our natural gas. Commencing in 1985, FERC promulgated a series of orders, regulations and rule makings that significantly fostered competition in the business of transporting and marketing gas. Today, interstate pipeline companies are required to provide nondiscriminatory transportation services to producers, marketers and other shippers, regardless of whether such shippers are affiliated with an interstate pipeline company. FERC's initiatives have led to the development of a competitive, unregulated, open access market for gas purchases and sales that permits all purchasers of gas to buy gas directly from third-party sellers other than pipelines. However, the natural gas industry historically has been very heavily regulated. Therefore, we cannot guarantee that the less stringent regulatory approach recently pursued by FERC and Congress will continue indefinitely into the future, nor can we determine what effect, if any, future regulatory changes might have on our natural gas related activities.
Under FERC's current regulatory regime, transmission services must be provided on an open-access, non-discriminatory basis at cost-based rates or at market-based rates if the transportation market at issue is sufficiently competitive. Gathering services, which occur upstream of jurisdictional transmission services, are regulated by state agencies. Although its policy is still in flux, FERC recently has reclassified certain jurisdictional transmission facilities as non-jurisdictional gathering facilities, which has the tendency to increase our costs of transporting gas to point-of-sale locations.
Permits. Our operations are subject to various federal, state and local laws and regulations that include requiring permits for the drilling and operation of wells, maintaining bonding and insurance requirements to drill, operate, plug and abandon wells, restoring the surface associated with our wells; and regulating the location of wells, the method of drilling and casing wells, the surface use and restoration of properties upon which wells are drilled, the plugging and abandonment of wells, the disposal of fluids and solids used in connection with our operations, and air emissions associated with our operations. Also, we have permits from numerous jurisdictions to operate crude oil, natural gas and related pipelines and equipment within the boundaries of these governmental jurisdictions. The permits required for various aspects of our operations are subject to enforcement for noncompliance, as well as revocation, modification and renewal by issuing authorities.
Operations on Federal Oil and Gas Leases
We conduct a sizeable portion of our operations on federal oil and natural gas leases which are administered by the BLM and the Minerals Management Service ("MMS"). Federal leases contain relatively standard terms and require compliance with detailed BLM and MMS regulations and orders, which are subject to change. Under certain circumstances, the BLM may require any of our operations on federal leases to be suspended, curtailed or terminated. Any such suspension or termination could have a material adverse effect on our business, financial condition and results of operations. The MMS issued a final rule that amended its regulations governing the valuation of oil and gas produced from
25
federal leases. This rule, which became effective June 1, 2000, provides that the MMS will collect royalties based on the market value of oil and gas produced from federal leases.
State Regulation
Our operations are also subject to regulation at the state, and in some cases, county, municipal and local governmental levels. Such regulation includes requirements concerning permits for the drilling of wells, maintaining bonding requirements in order to drill or operate wells, the location of wells, the method of drilling and casing wells, the surface use and restoration of properties upon which wells are drilled, the plugging and abandonment of wells, and the disposal of fluids used and produced in connection with operations. Our operations are also subject to various conservation laws and regulations pertaining to the size of drilling, spacing and proration units and the unitization or pooling of oil and gas properties.
In California, as part of our waterflood development plan for the WTU and NWU, over the next 7 years, we will require 20 to 30 water injection well approvals from the California DOGGR. In recent years, the DOGGR has timely reviewed and approved our applications for injection permits. Should DOGGR delay the review process or deny our applications for future water injection wells, our ability to develop the WTU and NWU may be compromised.
The Wyoming Department of Environmental Quality, or Wyoming DEQ, has restrictive regulations applicable to the surface disposal of water produced from our CBM drilling operations. We typically are required to obtain Clean Water Act, Safe Drinking Water Act and analogous state and local permits to use surface discharge methods, such as settling ponds, to dispose of water when the groundwater produced from the coal seams will not exceed surface discharge permit limitations. Surface disposal options have volumetric limitations and require an extensive third-party water sampling and laboratory analysis program to ensure compliance with state permit standards. Alternative disposal methods to surface disposal of water are more expensive. These alternatives include installing and operating water treatment facilities or drilling disposal wells to inject the produced water in the underground formations below the coal seams or lower sandstone horizons. Injection wells are regulated by the Wyoming DEQ, the Wyoming Oil & Gas Conservation Commission and the BLM, and permits to drill these wells are obtained from these agencies. Based on our experience with CBM production, we believe that permits for surface discharge of produced water in the Washakie Basin have become and will continue to be difficult to obtain. As a result, in Wyoming, our produced water is currently re-injected into water disposal wells.
In the areas of Pennsylvania where we operate, water sourcing and wastewater disposal are regulated both by the Pennsylvania Department of Environmental Protection, or PADEP, as well as the Susquehanna River Basin Commission, or SRBC. The SRBC is a federal interstate watershed agency that oversees the withdrawal and use of surface water and groundwater from the Susquehanna River Basin for natural gas development and regulates interbasin transfers of produced fluids. The SRBC also restricts water withdrawal rates during periods of reduced precipitation to avoid adverse impacts to the water resources within the Susquehanna River Basin. The PADEP implements a statewide program governing all aspects of natural gas development. This program includes a requirement that operators submit a water management plan for DEP approval prior to the issuance of drilling permits. The PADEP imposes extensive operational and design standards on impoundments and pits that store freshwater or produced water associated with natural gas development. Discharges of produced water to streams in Pennsylvania are prohibited unless strict effluent limits are achieved. The EPA, rather than DEP administers the injection well program in Pennsylvania. Very few injection wells have been permitted in Pennsylvania to accept produced water from unconventional wells. In December of 2013, the PADEP proposed additional regulations governing the permitting and operation of natural gas wells. These regulations, if promulgated as proposed, are likely to increase significantly the costs to
26
dispose of produced water, which could have a material adverse effect on our business, financial condition and results of operations.
In addition, state conservation laws, which frequently establish maximum rates of production from oil and gas wells, generally prohibit, restrict or regulate the venting or flaring of gas and impose certain requirements regarding the rates of production. State regulation of gathering facilities generally includes various safety, environmental and, in some circumstances, nondiscriminatory take requirements, but, except as noted above, does not generally entail rate regulation. These regulatory burdens may affect our profitability, and we are unable to predict the future cost or impact of complying with such regulations.
Future Regulations
Proposals and proceedings that may affect the oil and gas industry are pending before Congress, BLM, FERC, MMS, state legislatures and commissions, and the courts. We cannot predict when or whether any such proposals may become effective. In the past, the natural gas industry has been heavily regulated. There is no assurance that the regulatory approach currently pursued by various agencies will continue indefinitely. Notwithstanding the foregoing, we do not anticipate that compliance with existing federal, state and local laws, rules and regulations will have a material adverse effect on our capital expenditures, earnings or competitive position.
Failure to comply with environmental regulations may result in the imposition of substantial administrative, civil or criminal penalties, or restrict or prohibit our desired business activities. Environmental laws and regulations impose liability, sometimes strict liability, for environmental cleanup costs and other damages. Other environmental laws and regulations may delay or prohibit exploration and production activities in environmentally sensitive areas or impose additional costs on these activities.
We believe we are in compliance with current applicable environmental laws and regulations. We believe the existence and enforcement of such laws and regulations have no more restrictive an effect on our operations than on other similar companies in the energy industry. Costs associated with responding to a major spill of crude oil or produced water, or costs associated with remediation of environmental contamination, are the most likely occurrences that could result in a material adverse effect on our business, financial condition and results of operations. There are no pending or threatened claims for any such environmental cleanup costs, and we operate our producing properties in a prudent manner in order to avoid or minimize liability related to any such claims.
Changes in applicable federal, state and local environmental laws and regulations potentially could have a material adverse effect on our business, financial condition and results of operations. In this regard, our CBM drilling and production operations are subject to ongoing BLM oversight, EIS requirements and recurring BLM approvals, and could be affected by changes in BLM regulations or policies.
We anticipate no material capital expenditures to comply with federal and state environmental requirements. In addition, state-wide reclamation bonds and our $50 million casualty and environmental insurance policy have been adequate to meet the applicable bonding and insurance requirements to date. Additionally, we have deposited $3.2 million in money market securities as of December 31, 2014, as collateral for a $3.4 million reclamation bond for the Wilmington Townlot Unit.
Coalbed Methane Operations. The majority of our gas production is from CBM operations that generate water discharges and air emissions that are subject to significant regulatory control. Naturally occurring groundwater is produced by our CBM operations. This produced water is disposed of by injection into the subsurface through disposal or water injection wells, and, in some cases, discharge to the surface or in evaporation ponds. Whichever disposal method is used, produced water must be
27
disposed of in compliance with permits issued by state and federal regulatory agencies, and in compliance with applicable state, federal and local environmental regulations. To date, we have been able to obtain necessary surface discharge or disposal well permits, and we have been able to discharge produced water and operate our produced water disposal wells in compliance with our permits and applicable federal, state and local laws and regulations without undue cost or burden to our business activities.
Our CBM operations involve the use of gas-fired generators and compressors to transport the gas we produce. Emissions of nitrogen oxides and other combustion by-products from individual or multiple generators and compressors at one location may be great enough to subject the compressors to state air quality requirements for pre-construction and operating permits. To date, we have not experienced significant delays or problems in obtaining the required air permits and have been able to operate these compressors in compliance with our permits and applicable federal, state and local laws and regulations without undue cost or burden to our business activities. Another air emission associated with our coalbed methane operations that may be subject to regulation and permitting requirements is particulate matter resulting from construction activities and vehicle traffic.
Atlantic Rim. In May 2007, the BLM issued its Record of Decision for the Atlantic Rim EIS that allows the development of the Atlantic Rim project by drilling up to 2,000 wells, 1,800 of which are CBM wells and 200 of which are deeper conventional wells. Based on the current knowledge of geologic formations, the BLM's minimum well spacing will be 80 acres per CBM well. Our Washakie Basin CBM production operations are also subject to Wyoming Department of Environmental Quality, or DEQ, regulations and permit requirements. Permits required from the Wyoming DEQ include air emission and produced water discharge permits. To date, we have not experienced any difficulties in obtaining any air permits needed for our Washakie Basin operations from the Wyoming DEQ. Disposal of produced water is limited to subsurface injection in the portion of the Washakie Basin within the Colorado River drainage area. We have received permits for a sufficient number of water injection wells in the Atlantic Rim project; however, we will need to obtain permits for additional injection wells, in the event we need additional subsurface disposal capacity.
Wilmington Field. The Wilmington Townlot Unit, or WTU, and the North Wilmington Unit, or NWU, are located in a mixed industrial and residential area near the Port of Los Angeles, California. Field activities include drilling wells to develop our lease acreage and operating a waterflood to maximize crude oil production. Stringent environmental regulations, restrictive permit conditions and the possibility of permit denials from a multiplicity of state, regional and local regulatory agencies may inhibit, curtail or add cost to future Wilmington field development activities. Despite prudent operation and preventative measures, drilling, waterflooding and production operations may result in spills and other accidental releases of produced water, hydrocarbons or injection fluids. Remediation and associated costs for a release of produced water, hydrocarbons or injection fluids in an urban environment could be significant. This potential liability is accentuated by the location of our WTU and NWU leases in or near residential areas.
Because the gas volume from the WTU was historically too low to justify gas sales equipment, the gas had been flared for many years under a permit from the SCAQMD. In late 2007, we entered into an agreement with the SCAQMD which allowed us to commission six microturbines to generate electrical power from the otherwise flared gas and resume full production. As oil production grew, the excess gas produced but not consumed by our microturbines began to exceed our current gas flare permit limitation. In March 2008, we presented our plan to the SCAQMD to seek approvals from regulatory authorities to dispose of our WTU produced gas by re-injecting it in underground formations or by selling it directly to a nearby public utility or a third party user. We also applied to the SCAQMD for a permit to construct a new high efficiency clean enclosed burner to replace the existing gas flare. Our permit applications requested the authority to install and operate certain pieces of new best available control technology ("BACT") equipment. On July 19, 2011 the SCAQMD
28
certified the Company's CEQA documents and issued all of the related permits, including gas handling equipment. These equipment upgrades will help increase our oil processing capability to approximately 5,000 barrels of oil per day at the Wilmington Townlot Unit. In 2011, we installed the high efficiency burner and began pursuing permits and agreements necessary to dispose of the associated gas by injecting it in underground reservoirs or selling it to a third party. In 2012, the gas injection project was substantially delayed by the DOGGR, which caused Warren to commit to selling all of the gas, rather than injecting it. As required by the SCAQMD, in 2012 we began preparing an additional analysis under CEQA to analyze and mitigate the potential air and other emissions that may be associated with pipeline connections and installation of gas transportation, compression and related equipment that will be required to sell excess gas to third parties. This additional CEQA analysis was completed in late 2014, and construction permits were issued by the SCAQMD. Warren is currently constructing and installing the gas transportation, compression and related equipment, and anticipates that this new gas sales system will be operational in late 2015.
Operating Hazards and Insurance
The oil and natural gas business involves a variety of operating risks, including fires, explosions, blowouts, environmental hazards, spills or releases of crude oil, produced water and injection fluids, and other potential events which could have a material adverse effect on our business, financial condition and results of operations. Any of these problems could adversely affect our ability to conduct operations and cause us to incur substantial losses. Such losses could reduce or eliminate the funds available for exploration, production or leasehold acquisitions, or result in the loss of certain properties.
In accordance with industry practice, we maintain insurance against some, but not all, potential risks and losses. We do not carry business interruption insurance. For some risks, we may elect not to obtain insurance if we believe the cost of available insurance is excessive relative to the risks presented. In addition, pollution and environmental risks generally are not fully insurable at a reasonable cost. If a significant accident or other event occurs and is not fully covered by insurance, it could have a material adverse effect on our business, financial condition and results of operations.
Title to Properties
In most situations, as is customary in the oil and gas industry, only a preliminary title examination is conducted at the time we acquire oil and gas leases covering properties for possible drilling operations. Prior to the commencement of drilling operations, a more complete title examination of the drill site tract is usually conducted by independent attorneys or landmen. Once production from a given well is established, we prepare a division order title report indicating the proper parties and percentages for payment of production proceeds, including royalties. The level of title examination often differs from property to property.
Our properties are subject to customary royalty interests, liens incident to operating agreements, liens for current taxes and other burdens which we believe do not materially interfere with the use of or affect the carrying value of our properties.
Employees
At December 31, 2014, we had 87 full-time employees. We believe that our relationships with our employees are good. None of our employees are covered by a collective bargaining agreement. From time to time, we use the services of independent consultants to perform various professional services, particularly in the areas of geological, permitting and environmental assessment activities. Independent contractors often perform well drilling and production operations, including pumping, maintenance, dispatching, inspection and testing.
29
Offices
Our principal executive offices are located at 1114 Avenue of the Americas, 34th Floor, New York, NY 10036, and our telephone number is (212) 697-9660. We lease approximately 4,178 square feet of office space for our New York office under a lease that expires in May 2023. Our oil and gas operations office in Casper, Wyoming occupies 1,174 square feet under a lease that expired in October 2014 and is currently month to month. Our oil and gas operations office in Long Beach, California occupies 14,201 square feet of space under a lease that expires in April 2020. We lease additional space for our other offices located in Denver, Colorado and Plano, Texas which occupy 4,507 square feet and 4,998 square feet and expire in 2021 and 2016, respectively. We also have field offices in Roswell, New Mexico, Tunkhannok, Pennsylvania and Rawlins, Wyoming. We believe that our facilities are adequate for our current operations and that we can obtain additional leased space if needed.
Website and Code of Business Conduct and Ethics
Our website address is http://www.warrenresources.com. We make available free of charge through our website our annual report on Form 10-K, quarterly reports on Form 10-Q, current reports on Form 8-K, and all amendments to those reports as soon as reasonably practicable after such material is electronically filed with or furnished to the SEC at http://www.sec.gov. Additionally, our Code of Business Conduct and Ethics, which includes our code of ethics for senior financial management, Corporate Governance Guidelines and the charters of our Audit Committee, Compensation Committee and Nominating and Corporate Governance Committee are posted on our website and are available in print free of charge to any stockholder who requests them. Requests should be sent by mail to our corporate secretary at our principal office at 1114 Avenue of the Americas, 34th Floor, New York, NY 10036. Information contained on, or connected to, our website is not incorporated by reference into this annual report on Form 10-K and should not be considered part of this or any other report that we file with or furnish to the SEC.
Glossary of Abbreviations and Terms
The following are abbreviations and definitions of certain terms commonly used in the oil and gas industry and this annual report on Form 10-K:
Adsorption. The attachment, through physical or chemical-bonding, of gas molecules to the coal surface. The adsorbed gas molecules are trapped within the coal, the stability of which are strongly affected by changes in temperature and pressure.
AMI. Area of mutual interest.
Bbl. One stock tank barrel, or 42 U.S. gallons liquid volume, used in reference to oil or other liquid hydrocarbons.
Bbl/d. One Bbl per day.
Bcf. One billion cubic feet of natural gas at standard atmospheric conditions.
Bcfe. One billion cubic feet equivalent of natural gas, calculated by converting oil to equivalent Mcf at a ratio of 6 Mcf to 1 Bbl of oil.
Boe. Barrels of oil equivalent, with six thousand cubic feet of natural gas being equivalent to one barrel of oil.
Btu or British thermal unit. The quantity of heat required to raise the temperature of one pound of water by one degree Fahrenheit.
30
Coalbed methane (CBM). Natural gas formed as a byproduct of the coal formation process, which is trapped in coal seams and produced by non-traditional means.
Completion. The installation of permanent equipment for the production of oil or natural gas, or, in the case of a dry well, to reporting to the appropriate authority that the well has been abandoned.
Condensate. Liquid hydrocarbons associated with the production of a primarily natural gas reserve.
Desorption. The detachment of adsorbed gas molecules from the coal surface. See "Adsorption".
Developed Acreage. The number of acres which are allocated or assignable to producing wells or wells capable of production.
Development well. A well drilled into a proved natural gas or oil reservoir to the depth of a stratigraphic horizon known to be productive.
Dewatering. A coalbed methane well typically begins dewatering with almost all water production and little, or no, natural gas production. The continuous production of water from a well that is dewatering reduces the water reservoir pressure on the coals. The reduced reservoir pressure enables the release of the gas within the coal to the wellbore. This results in an increase in the amount of gas production relative to the amount of water production. Dewatering ceases when peak gas production is reached.
Down-dip. The occurrence of a formation at a lower elevation than a nearby area.
Drill-to-earn. The process of earning an interest in leasehold acreage by drilling a well pursuant to a farm-in or exploration agreement.
Dry hole or well. An exploratory, development, or extension well that proves to be incapable of producing either oil or gas in sufficient quantities to justify completion as an oil or gas well.
Environmental assessment (EA). A public document that analyzes a proposed federal action for the possibility of significant environmental impacts. The analysis is required by the National Environmental Policy Act. If the environmental impacts will be significant, the federal agency must then prepare an environmental impact statement.
Environmental impact statement (EIS). A detailed statement of the environmental effects of a proposed action and of alternative actions that is required for all major federal actions.
Exploitation. The continuing development of a known producing formation in a previously discovered field. To make complete or maximize the ultimate recovery of oil or natural gas from the field by work including development wells, secondary recovery equipment or other suitable processes and technology.
Exploration. The search for natural accumulations of oil and natural gas by any geological, geophysical or other suitable means.
Exploratory well. A well drilled to find a new field or to find a new reservoir in a field previously found to be productive of oil or gas in another reservoir.
Farm-out or Farm-in. An agreement where the owner of a working interest in an oil and gas lease assigns the working interest or a portion thereof to another party who desires to drill on the leased acreage. Generally, the assignee is required to drill one or more wells in order to earn its interest in the acreage. The assignor usually retains a royalty or reversionary interest in the lease. The interest received by an assignee is a farm-in while the interest transferred by the assignor is a farm-out.
Field. An area consisting of either a single reservoir or to multiple reservoirs, all grouped on or related to the same individual geological structural feature and/or stratigraphic condition.
31
Finding and Development Costs. Capital costs incurred in the acquisition, exploitation and exploration of proved oil and natural gas reserves divided by proved reserve additions and revisions to proved reserves.
Fracturing. The technique of improving a well's production or injection rates by pumping a mixture of fluids into the formation and rupturing the rock, creating an artificial channel. As part of this technique, sand or other material may also be injected into the formation to keep the channel open, so that fluids or gases may more easily flow through the formation.
Gross Acres. The total acres in which we own any amount of working interest.
Gross Wells. The total number of producing wells in which we own any amount of working interest.
Horizontal Drilling. A drilling operation in which a portion of the well is drilled horizontally or laterally within a productive or potentially productive formation.
Identified drilling locations. Total gross locations specifically identified and scheduled by management as an estimation of our multi-year drilling activities on existing acreage. Our actual drilling activities may change depending on the availability of capital, regulatory approvals, seasonal restrictions, natural gas and oil prices, costs, drilling results and other factors.
Infill Drilling. The drilling of wells between established producing wells on a lease to increase reserves or productive capacity from the reservoir.
Injection Well or Injector. A well which is used to place water, liquids or gases into an underground zone to assist in maintaining reservoir pressure, enhancing recoveries from the field, or disposal of produced water.
Intangible Drilling Costs. Expenditures made for wages, fuel, repairs, hauling and supplies necessary for the drilling or recompletion of an oil or gas well and the preparation of such well for the production of oil or gas, but without any salvage value, which expenditures are generally accepted in the oil and gas industry as being currently deductible for federal income tax purposes. Examples of such costs include:
- •
- ground clearing, drainage construction, location work, road building, temporary roads and ponds, surveying and geological work;
- •
- drilling, completion, logging, cementing, acidizing, perforating and fracturing of wells;
- •
- hauling mud and water, perforating, swabbing, supervision and overhead;
- •
- renting horizontal tools, milling tools and bits; and
- •
- construction of derricks, pipelines and other physical structures necessary for the drilling or preparation of the wells.
Lease. An instrument which grants to another (the lessee) the exclusive right to enter and explore for, drill for, produce, store and remove oil and natural gas from the mineral interest, in consideration for which the lessor is entitled to certain rents and royalties payable under the terms of the lease. Typically, the duration of the lessee's authorization is for a stated term of years and "for so long thereafter" as minerals are producing.
MBbl. One thousand barrels of oil or other liquid hydrocarbons.
Mcf. One thousand cubic feet of natural gas at standard atmospheric conditions.
32
Mcf/d. One Mcf per day.
Mcfe. One thousand cubic feet equivalent of natural gas, calculated by converting oil to equivalent Mcf at a ratio of 6 Mcf to 1 Bbl of oil.
MMbbl. One million barrels of oil or other liquid hydrocarbons.
MMBoe. One million barrels of oil equivalent.
MMBtu. One million British thermal units.
MMcf. One million cubic feet of natural gas at standard atmospheric conditions.
MMcf/d. One MMcf per day.
MMcfe. One million cubic feet equivalent of natural gas, calculated by converting oil to equivalent Mcf at a ratio of 6 Mcf to 1 Bbl of oil.
MMcfe/d. One MMcfe per day.
Net acres. Gross acres multiplied by the percentage working interest owned by Warren.
Net production. Production that is owned by Warren less royalties and production due others.
Net Revenue Interest. An owner's interest in the revenues of a well after deducting proceeds allocated to royalty and overriding interests.
Net wells. The sum of all of Warren's full and partial well ownership interests (i.e., if we own 25% percent of 100% working interest in eight producing wells, the total net producing well count would be two net producing wells).
NYMEX. New York Mercantile Exchange.
Oil. Crude oil, condensate and natural gas liquids.
Operator. The individual or company responsible for the exploration, exploitation and production of an oil or natural gas well or lease.
Overpressured. A subsurface formation that exerts an abnormally high formation pressure on a well before it is drilled into.
Pay zone. A geological deposit in which oil and natural gas is found in commercial quantities.
Permeability. A measure of the resistance or capacity of a geologic formation to allow water, natural gas or oil to pass through it.
PDP. Proved developed producing.
PDNP. Proved developed nonproducing.
Plugging and abandonment. Refers to the sealing off of fluids in the strata penetrated by a well so that the fluids from one stratum will not escape into another or to the surface. Regulations of all states require plugging of abandoned wells.
Pod. A grouping of 5 to 24 wells complete with associated infrastructure, including water disposal wells, gathering and compression.
Porosity. The ratio of the volume of all the pore spaces in a geologic formation to the volume of the whole formation.
33
Productive Well. An exploratory, development, or extension well that is not a dry well.
Proved developed non-producing reserves. Proved developed reserves that do not qualify as proved developed producing reserves, including reserves that are expected to be recovered from (i) completion intervals that are open at the time of the estimate, but have not started producing, (ii) wells that are shut in because pipeline connections are unavailable or (iii) wells not capable of production for mechanical reasons.
Proved developed producing reserves. Reserves that are being recovered through existing wells with existing equipment and operating methods.
Proved developed reserves. This term means "proved developed oil and gas reserves" as defined in Rule 4-10 of SEC Regulation S-X, and refers to reserves that can be expected to be recovered through existing wells with existing equipment and operating methods.
Proved reserves or proved oil and gas reserves. This term means "proved oil and gas reserves" as defined in Rule 4-10 of SEC Regulation S-X and refers to the quantities of oil and gas, which, by analysis of geoscience and engineering data, can be estimated with reasonable certainty to be economically producible—from a given date forward, from known reservoirs, and under existing economic conditions, operating methods, and government regulations—prior to the time at which contracts providing the right to operate expire, unless evidence indicates that renewal is reasonably certain, regardless of whether deterministic or probabilistic methods are used for the estimation.
Productive well. A well that is found to be capable of producing hydrocarbons in sufficient quantities such that proceeds from the sale of the production exceed operating and production expenses and taxes.
Prospect. A specific geographic area which, based on supporting geological, geophysical or other data and also preliminary economic analysis using reasonably anticipated prices and costs, is deemed to have potential for the discovery of commercial hydrocarbons.
PUD. Proved undeveloped.
Proved undeveloped reserves. Proved reserves that are expected to be recovered from new wells on undrilled acreage or from existing wells where a relatively major expenditure is required for recompletion.
PV-10 Value. The PV-10 of reserves is the present value of estimated future revenues to be generated from the production of the reserves net of estimated production and future development costs and future plugging and abandonment costs, using the twelve-month arithmetic average of the first of the month prices without giving effect to hedging activities or future escalation, costs as of the date of estimate without future escalation, without non-property related expenses such as general and administrative expenses, debt service and depreciation, depletion, amortization and impairment and income taxes, and discounted using an annual discount rate of 10%. See Footnote (1) to the table under oil and natural gas reserves-proved reserves in items 1 and 2.
Re-entry. Entering an existing well bore to redrill or repair.
Recompletion. The process of re-entering an existing wellbore that is either producing or not producing and completing new reservoirs in an attempt to establish or increase existing production.
Reserves. This term is defined in Rule 4-10 of SEC Regulation S-X and refers to estimated remaining quantities of oil and gas and related substances anticipated to be economically producible, as of a given date, by application of development projects to known accumulations. In addition, there must exist, or there must be a reasonable expectation that there will exist, the legal right to produce or
34
a revenue interest in the production, installed means of delivering oil and gas or related substances to market, and all permits and financing required to implement the project.
Reservoir. A porous and permeable underground formation containing a natural accumulation of producible natural gas and/or oil that is confined by impermeable rock or water barriers and is separate from other reservoirs.
Royalty. An interest in an oil and natural gas lease that gives the owner of the interest the right to receive a portion of the production from the leased acreage, or of the proceeds of the sale thereof, but generally does not require the owner to pay any portion of the costs of drilling or operating the wells on the leased acreage. Royalties may be either landowner's royalties, which are reserved by the owner of the leased acreage at the time the lease is granted, or overriding royalties, which are usually reserved by an owner of the leasehold in connection with a transfer to a subsequent owner.
Secondary Recovery. An artificial method or process used to restore or increase production from a reservoir after the primary production by the natural producing mechanism and reservoir pressure has experienced partial depletion. Gas injection and water flooding are examples of this technique.
Shut in. A well suspended from production or injection but not abandoned.
Spacing. The number of wells which can be drilled on a given area of land under applicable laws and regulations.
Standardized Measure of Discounted Future Net Cash Flows. The discounted future net cash flows relating to proved reserves based on prices used in estimating the reserves, year-end costs, and statutory tax rates, and a ten percent annual discount rate. The information for this calculation is included in the note regarding disclosures about oil and gas producing activities contained in the Notes to Consolidated Financial Statements included in this Form 10-K.
Stratigraphic Play. An oil or natural gas formation contained within an area created by permeability and porosity changes characteristic of the alternating rock layer that result from the sedimentation process.
Structural Play. An oil or natural gas formation contained within an area created by earth movements that deform or rupture (such as folding or faulting) rock strata.
Tangible Drilling Costs. Expenditures necessary to develop oil or gas wells, including acquisition, transportation and storage costs, which typically are capitalized and depreciated for federal income tax purposes. Examples of such expenditures include:
- •
- well casings;
- •
- wellhead equipment;
- •
- water disposal facilities;
- •
- metering equipment;
- •
- pumps;
- •
- gathering lines;
- •
- storage tanks; and
- •
- gas compression and treatment facilities.
3-D Seismic. The method by which a three dimensional image of the earth's subsurface is created through the interpretation of reflection seismic data collected over a surface grid. 3-D seismic surveys
35
allow for a more detailed understanding of the subsurface than do conventional surveys and contribute significantly to field appraisal, exploitation and production.
Tight gas sands. A formation with low permeability that produces natural gas with very low flow rates for long periods of time.
Undeveloped acreage. Lease acreage on which wells have been not drilled or completed to a point that would permit the production of commercial quantities of natural gas and oil regardless of whether such acreage contains proved reserves.
Ultimate recovery. The total expected recovery of oil and gas from a producing well, leasehold, pool or field.
Waterflood. A secondary recovery operation in which water is injected into the producing formation in order to maintain reservoir pressure and force oil toward and into the producing wells.
Working Interest. An interest in an oil and natural gas lease that gives the owner of the interest the right to drill for and produce oil and natural gas on the leased acreage and requires the owner to pay a share of the costs of drilling and production operations.
Workover. Remedial operations on a well conducted with the intention of restoring or increasing production from the same zone, including by plugging back, squeeze cementing, reperforating, cleanout and acidizing.
You should be aware that the occurrence of any of the events described in this Risk Factors section and elsewhere in this annual report on Form 10-K or in any other of our filings with the Securities and Exchange Commission could have a material adverse effect on our business, financial position, liquidity and results of operations. In evaluating us, you should consider carefully, among other things, the factors and the specific risks set forth below. This annual report on Form 10-K contains forward-looking statements that involve risks and uncertainties. See "Cautionary Statement Regarding Forward-Looking Statements" in this annual report on Form 10-K. Some of the following risks relate principally to the industry in which we operate and to our business. Other risks relate principally to the securities markets and ownership of our common shares. If any of the following risks develop into actual events, our business, financial condition or results of operations could be materially adversely affected, the trading price of your shares could decline, and you may lose all or part of your investment.
Risks Relating to the Oil and Natural Gas Industry and Our Business
Oil and natural gas prices are volatile. Volatility in oil and natural gas prices can adversely affect our business, financial condition and results of operations. This volatility also makes valuation of oil and natural gas producing properties difficult and can disrupt markets.
Oil and natural gas prices have historically been, and are likely to continue to be, volatile. Oil and natural gas prices are subject to wide fluctuations in response to relatively minor changes in the supply of and demand for oil and natural gas, market uncertainty and a variety of additional factors that are beyond our control. Some of the factors that cause these fluctuations are:
- •
- demand for oil and natural gas, which is affected by worldwide population growth, economic development and general economic and
business conditions;
- •
- the levels and location of natural gas and oil supply and demand and expectations regarding supply and demand, including the potential long-term impact of an abundance of natural gas from shale plays in the United States on the global natural gas supply;
36
- •
- political and economic uncertainty and socio-political unrest;
- •
- the price and quality of foreign imports of oil and natural gas; political and economic conditions in oil and natural gas producing
countries, especially the Middle East, Africa, Russia and South America;
- •
- the willingness and ability of the Organization of Petroleum Exporting Countries ("OPEC") to set and maintain oil price and production
controls;
- •
- the level of domestic and international exploration, drilling and production activity;
- •
- the level of global inventories;
- •
- the cost of exploring for, developing, producing and delivering oil and natural gas;
- •
- the availability, proximity and capacity of gathering, transportation, processing and/or refining facilities in regional or localized
areas that may affect the realized price for natural gas and oil;
- •
- weather conditions and changes in weather patterns;
- •
- the price and availability of, and demand for, competing energy sources, including coal, liquefied natural gas, and alternative energy
sources;
- •
- the extent to which natural gas markets in the United States become integrated with global natural gas markets through the approval
and development of infrastructure supporting the export of liquefied and other natural gas;
- •
- technological advances affecting energy consumption and production;
- •
- the nature and extent of governmental regulation and taxation, including environmental regulations affecting competing energy sources
as well as natural gas;
- •
- risks associated with operating drilling rigs; and
- •
- variations between product prices at sales points and applicable index prices.
Additionally, continuance of the current lower natural gas price environment, further declines in natural gas prices and the lack of natural gas storage may have the following effects on our business:
- •
- reduction of our revenues, operating income and cash flows;
- •
- curtailment or shut-in of our natural gas production due to lack of transportation or storage capacity;
- •
- cause certain of our properties to become economically unviable;
- •
- cause material or significant reductions in our capital investment programs, resulting in a failure to develop our natural gas
reserves; and
- •
- limit our financial condition, liquidity, and/or ability to finance planned capital expenditures and operations.
The long-term effects of these and other conditions on the prices of oil and natural gas are uncertain. Price volatility makes it difficult to budget and project the return on exploration and development projects involving our oil and natural gas properties and to estimate with precision the value of producing properties that we may own or propose to acquire. In addition, unusually volatile prices often disrupt the market for oil and natural gas properties as buyers and sellers have more difficulty agreeing on the purchase price of properties. Our cash flow and results of operations depend to a great extent on the prevailing prices for oil and natural gas. Our annual and quarterly results of operations may fluctuate significantly as a result of, among other things, variations in oil and natural gas prices and production performance. In recent years, oil and natural gas price volatility has become
37
increasingly severe, and continuing volatility may have a material adverse effect on our future business, financial condition and results of operations.
In addition, among the assets that we acquired in 2014 from Citrus as part of our expansion into the Marcellus Shale is a natural gas supply agreement with a subsidiary of Procter and Gamble. During the years ended December 31, 2013 and 2014, approximately 38% and 27.8%, respectively, of Citrus' production was sold pursuant to this agreement. During these same periods, the prices that Citrus received for production under this contract generally were higher than the prices Citrus received for natural gas from other third parties. The customer has elected to terminate the agreement effective June 10, 2015. While we are in discussions with the customer to renew or extend the agreement, there can be no assurance that we will be successful in doing so or that the price secured under the contract will be advantageous compared to market pricing at the time of sale. If we are unable to renew or extend the agreement, or if we negotiate a price that is lower than what is ultimately available in the open market, our revenues may be unfavorably impacted.
Significant declines in oil and natural gas prices would adversely affect our ability to meet our capital expenditure obligation and financial commitments, and our financial results, cash flows, access to capital and ability to grow.
Our revenues, operating results, cash flow, profitability and future rate of growth depend upon the prevailing prices of, and demand for, oil and natural gas. All of our operating revenues are derived from the sale of our oil and natural gas production. A continuing substantial or extended decline in oil and natural gas prices would have a material adverse effect on our financial position, our ability to meet our capital expenditure obligations and commitments, our results of operations, our access to capital and the quantities of oil and natural gas that may be economically produced by us. A significant decrease in price levels for an extended period negatively affects us in several ways including:
- •
- our cash flow will be reduced, which will decrease funds available for capital investments employed to replace reserves, increase
production and operate our properties;
- •
- certain reserves will no longer be economic to produce, resulting in lower proved reserves and cash flow and charges to earnings that
impair the value of these assets; and
- •
- access to other sources of capital, such as bank loans and equity or debt markets, could be severely limited or unavailable.
Based on oil and natural gas prices in recent years, our oil and natural gas revenues may from time to time decrease and negatively impact our liquidity. Our current plans to address lower oil and natural gas prices are primarily to reduce capital expenditures to a level equal to cash flow from operations, reduce operating expenses and seek additional capital financing. However, our plans may not be successful in improving our results of operations and liquidity. If oil or natural gas prices remain suppressed, or further decline, for extended periods of time, we might not be able to generate enough cash flow from operations to meet our obligations and make planned capital expenditures, which could impair our liquidity and our ability to develop and operate our properties.
Our Credit Facility and the indenture governing our Senior Notes contain operating and financial restrictions that may restrict our business and financing activities.
Our Credit Facility and the indenture governing our Senior Notes (the "Indenture") contain, and any future indebtedness we incur may contain, a number of restrictive covenants that will impose significant operating and financial restrictions on us, including restrictions on our ability to, among other things:
- •
- sell assets, including equity interests in our subsidiaries;
38
- •
- pay distributions on, redeem or repurchase our common stock or redeem or repurchase our subordinated debt;
- •
- incur or guarantee additional indebtedness or issue preferred stock;
- •
- create or incur certain liens;
- •
- make certain acquisitions and investments;
- •
- redeem or prepay other debt;
- •
- enter into agreements that restrict distributions or other payments from our restricted subsidiaries to us;
- •
- consolidate, merge or transfer all or substantially all of our assets;
- •
- engage in transactions with affiliates;
- •
- create unrestricted subsidiaries;
- •
- enter into sale and leaseback transactions; and
- •
- engage in certain business activities.
As a result of these covenants, we will be limited in the manner in which we conduct our business, and we may be unable to engage in favorable business activities or finance future operations or capital needs.
Our ability to comply with some of the covenants and restrictions contained in our Credit Facility and the Indenture may be affected by events beyond our control. If market or other economic conditions deteriorate, our ability to comply with these covenants may be impaired. For example, continuation of low oil and gas prices or their further deterioration could significantly reduce cash flow, which is critical to these covenants.
Availability under our Credit Facility depends on a borrowing base which is subject to redetermination by our lenders. If our borrowing base is reduced, we may be required to repay amounts outstanding under our Revolving Credit Facility.
Under the terms of our Revolving Credit Facility, our borrowing base is subject to semi-annual redetermination by our lenders based on their evaluation of our proved reserves and their internal criteria. In addition, under certain circumstances, interim redeterminations may be conducted. The significant recent decline in oil and gas prices has resulted in banks reducing the price decks upon which borrowing bases are set. Our current borrowing base was set using a price deck significantly higher than the current price deck used by the lending institutions in our syndicate. Therefore, it is likely that our borrowing base will be reduced, perhaps significantly, in the regular semi-annual redetermination upcoming at the end of March 2015.
A failure to comply with the covenants, ratios or tests in our Credit Facility, the Indenture or any future indebtedness could result in an event of default, which, if not cured or waived, could have a material adverse effect on our business, financial condition and results of operations. If an event of default under our Credit Facility occurs and remains uncured, the lenders:
- •
- would not be required to lend any additional amounts to us;
- •
- could elect to declare all borrowings outstanding, together with accrued and unpaid interest and fees, to be due and payable;
- •
- may have the ability to require us to apply all of our available cash to repay these borrowings; or
- •
- may prevent us from making debt service payments under our other agreements.
39
Our proved reserves are estimates based on many assumptions that may turn out to be inaccurate. Any material inaccuracies in these reserve estimates or underlying assumptions will materially affect the quantities and present value of our reserves.
No one can measure underground accumulations of oil and natural gas in an exact way. There are numerous uncertainties inherent in estimating quantities of proved reserves, including many factors beyond our control that could cause the quantities and net present value of our reserves to be overstated or understated. Oil and natural gas reserve engineering requires subjective estimates of underground accumulations of oil and natural gas and assumptions concerning future oil and natural gas prices, production levels, operating and development costs, drilling expenses, severance and excise taxes, capital expenditures, ownership and title matters, taxes and the availability of funds. The engineering process of estimating oil and natural gas reserves is complex and is not an exact science. It requires interpretations of available geological, geophysical, engineering and economic data for each reservoir. Therefore, these estimates are inherently imprecise.
Estimates of reserves based on risk of recovery and estimates of expected timing and future net cash flows prepared or audited by different engineers, or by the same engineers at different times, may vary substantially. Because of the subjective nature of oil and natural gas reserve estimates, each of the following items may differ materially from the amounts or other factors estimated:
- •
- The amount and timing of oil and natural gas production;
- •
- The revenues and costs associated with that production; and
- •
- The amount and timing of future development expenditures.
Over time, our independent petroleum engineering consultants may make material changes to reserve estimates by taking into account the results of actual drilling, testing, and production. Further, the potential for future reserve revisions, either upward or downward, is significantly greater than normal because a significant portion of our potential reserves are undeveloped.
In accordance with SEC requirements, our estimates of proved reserves for 2014 were determined based on a historical 12-month average price as of the first day of each month during the fiscal year. As a result, the full effect of falling prices during the second half of 2014 are not reflected. In a given year, actual prices and costs may be materially higher or lower than those used to calculate our estimated proved reserves. Significant variance from these prices and costs could greatly affect our estimates of reserves. In addition, proved undeveloped reserves locations may be limited to those scheduled to be drilled within the next five years.
As of December 31, 2014 and 2013, approximately 41% and 36%, respectively, of our estimated net proved reserves were undeveloped. Undeveloped reserves, by their nature, are less certain. Recovery of undeveloped reserves requires significant capital expenditures and successful drilling operations. Additionally, as oil and natural gas commodity prices become lower, the quantity of economically recoverable proved reserves declines. The reserve data assumes that we will make significant capital expenditures to develop our reserves. We have prepared estimates of our oil and natural gas reserves and the costs associated with these reserves in accordance with industry standards. However, the estimated costs may not be accurate, development may not occur as scheduled, or the actual results may not be as estimated. We may not have, or be able to obtain, the capital we need to develop these proved reserves.
Actual oil and natural gas prices, future production, revenues, operating expenses, taxes, development expenditures and quantities of recoverable oil and natural gas reserves will most likely vary from those estimated. Any significant variance could materially affect the estimated quantities and present value of future net revenues set forth in this annual report on Form 10-K. A reduction in oil and natural gas prices, for example, would reduce the value of proved reserves and reduce the amount
40
of oil and natural gas that could be economically produced, thereby reducing the quantity of reserves. We may adjust estimates of proved reserves to reflect production history, results of exploration and development, prevailing oil and natural gas prices and other factors, many of which are beyond our control.
You should not assume that the present value of future net revenues referred to in this annual report on Form 10-K is the current market value of our estimated oil and natural gas reserves. The Standardized Measure is a reporting convention that provides a common basis for comparing oil and natural gas companies subject to the rules and regulations of the SEC. Our non-GAAP financial measure, PV-10 Value, is a similar reporting convention that we have disclosed in this annual report on Form 10-K. In accordance with SEC requirements, the standardized measure of estimated discounted future net cash flows from proved reserves are generally based on average twelve-month prices and costs as of the first day of each month during the fiscal year. Actual future prices and costs may be materially higher or lower than such prices and costs. Any change in consumption by oil and natural gas purchasers or in governmental regulations or taxation will also affect actual future net cash flows. The timing of both the production and the expenses for the development and production of our oil and natural gas properties will affect the timing of actual future net cash flows from proved reserves and their present value. In addition, the 10% discount factor, which is required by the SEC to be used in calculating discounted future net cash flows for reporting purposes, is not necessarily the most appropriate discount factor, nor does it reflect discount factors used in the marketplace for the purchase and sale of oil and natural gas properties. Conditions in the oil and natural gas industry and oil and natural gas prices will affect whether the 10% discount factor accurately reflects the market value of our estimated reserves.
We may not be able to drill wells on a substantial portion of our acreage.
We may not be able to drill on a substantial portion of our acreage for various reasons. We may not generate or be able to raise sufficient capital to do so. Deterioration in commodities pricing may also make drilling some acreage uneconomic. Our actual drilling activities and future drilling budget will depend on drilling results, oil and natural gas prices, the availability and cost of capital, drilling and production costs, availability of drilling services and equipment, lease expirations, gathering system and pipeline transportation constraints, regulatory approvals and other factors. In addition, any drilling activities we are able to conduct may not be successful or add additional proved reserves to our overall proved reserves, which could have a material adverse effect on our future business, financial condition and results of operations.
We are subject to complex federal, state, local and other laws and regulations that could adversely affect the cost, manner or feasibility of doing business.
Our exploration, development, production and marketing operations are regulated extensively at the federal, state and local levels. Under these laws and regulations, we could be held liable for personal injuries, property damage (including site clean-up and restoration costs), and other damages. Failure to comply with these laws and regulations may also result in the suspension or termination of our operations, or subject us to administrative, civil and criminal penalties and damages.
Environmental and other governmental laws and regulations also increase the costs to plan, permit, design, drill, install, operate and abandon oil and natural gas wells. Moreover, public interest in environmental protection has increased in recent years, and environmental organizations have opposed, with some success, certain drilling projects. Compliance costs are significant. The exploration and production of oil and gas involves many risks concerning equipment and human operational problems that could lead to leaks or spills of petroleum products. These laws and regulations, particularly in California, Pennsylvania and Wyoming, are extensive, involve severe penalties and could change in ways that substantially increase our costs and associated liabilities. As a result, there can be no assurance
41
that our anticipated production levels will be realized or that our estimates of proved reserves will not be negatively impacted.
Part of the regulatory environment in which we operate includes, in some cases, federal and state requirements for performing or preparing environmental assessments, environmental impact statements, studies, reports and/or plans of development before commencing exploration and production activities. These regulations may impose significant costs and delays on our operations and, as a result, may hinder or limit the quantity of oil and natural gas we may ultimately be able to produce and sell.
A major risk inherent in our drilling plans is the need to obtain drilling permits from applicable federal, state and local authorities. Delays in obtaining regulatory approvals or drilling permits for producing and water injection wells, the failure to obtain a drilling permit for a well, or the receipt of a permit with excessive conditions or costs could have a material adverse effect on our ability to explore or develop our properties. Additionally, the oil and natural gas regulatory environment could change in ways that might substantially increase the financial and managerial costs to comply with the requirements of these laws and regulations and, consequently, adversely affect our profitability. Furthermore, we may be put at a competitive disadvantage to larger companies in our industry that can spread these additional costs over a greater number of wells and larger operating area. Any or all of these contingencies could delay or halt our drilling activities or the construction of ancillary facilities necessary for production, which would prevent us from developing our property interests as planned. Conditions, delays or restrictions imposed on the management of groundwater produced during drilling could severely limit our operations or make them uneconomic.
We cannot be certain that existing laws or regulations, as currently interpreted or reinterpreted in the future, or future laws or regulations will not harm our business, results of operations and financial condition. Our operations are subject to regulation and permitting in various aspects, including, but not limited to:
- •
- drilling permits;
- •
- water discharge and disposal permits for drilling operations;
- •
- the amounts and types of substances and materials that may be released into the environment;
- •
- drilling and operating bonds;
- •
- environmental matters and reclamation;
- •
- spacing of wells;
- •
- the permitting and use of underground injection wells, which affects the disposal of water from our wells;
- •
- occupational safety and health;
- •
- unitization and pooling of properties;
- •
- air quality, noise levels and related permits;
- •
- rights-of-way and easements;
- •
- reports concerning operations to regulatory authorities;
- •
- calculation and payment of royalties;
- •
- gathering, transportation and marketing of oil and natural gas;
- •
- taxation; and
- •
- waste disposal.
42
Under these laws and regulations, we could be liable for:
- •
- personal injuries;
- •
- property damage;
- •
- oil spills;
- •
- discharge or disposal of hazardous materials;
- •
- well reclamation costs;
- •
- surface remediation and clean-up costs;
- •
- fines and penalties;
- •
- natural resource damages; and
- •
- other environmental protection and damages issues.
See "Business—Regulations and Environmental Matters" for a more detailed discussion of laws and regulations affecting our operations.
Federal, state and local legislative and regulatory initiatives relating to hydraulic fracturing as well as governmental reviews of such activities could result in increased costs and additional operating restrictions or delays in the completion of oil and natural gas wells and adversely affect our production.
Some of our completion activities and our operations in Pennsylvania involve the use of hydraulic fracturing, which is an important and common process that creates a fracture extending from the well bore in a rock formation to enable oil or natural gas to move more easily through the rock pores to a production well. Fractures are typically created through the injection of water, sand or alternative proppant and chemicals under pressure into target geological formations to fracture the surrounding rock and stimulate production. We regularly use hydraulic fracturing as part of our operations in Pennsylvania. In California, our completion activities do not involve hydraulic fracturing, but do involve other technologies. Presently, hydraulic fracturing is regulated primarily at the state level, typically by state oil and natural gas commissions and similar agencies, however, legislative and regulatory efforts at the federal, state and local government level where we operate have been made to render permitting and compliance requirements more stringent for hydraulic fracturing and other technologies used to increase production. For example, the City of Los Angeles is currently considering whether to amend its zoning code to restrict or prohibit hydraulic fracturing and other completion activities. This and similar proposals, if adopted, would likely increase our costs and make it more difficult, or impossible, to pursue some of our development projects.
In addition, with increased public concern regarding the potential for hydraulic fracturing to adversely affect drinking water supplies, proposals have been made to enact federal, state and local legislation and regulations that would increase the regulatory burden imposed on hydraulic fracturing. For example, the U.S. Environmental Protection Agency, or the EPA, has asserted federal regulatory authority pursuant to the federal Safe Drinking Water Act, or SDWA, over certain hydraulic fracturing activities involving the use of diesel fuels. The Safe Drinking Water Act regulates the underground injection of substances through the Underground Injection Control ("UIC") program and exempts hydraulic fracturing from the definition of "underground injection". However, Congress has from time to time considered legislation that would amend the SDWA to repeal the exemption for hydraulic fracturing from the definition of "underground injection" and require federal permitting and regulatory control of hydraulic fracturing, as well as require disclosure of the chemical constituents of the fluids used in the fracturing process. The U.S. Congress may consider similar SDWA legislation in the future.
43
In February 2014, the EPA asserted federal regulatory authority under the SDWA's UIC program over hydraulic fracturing involving diesel additives, and requested comments in May 2014 on a proposal to require disclosure of chemical ingredients in hydraulic fracturing fluids under the Toxic Substances Control Act. Because the EPA's Advanced Notice of Proposed Rulemaking did not propose any actual regulation, it is unclear how any federal disclosure requirements that add to any applicable state disclosure requirements already in effect may affect our operations. Further, on October 21, 2011, the EPA announced its intention to propose federal Clean Water Act regulations governing wastewater discharges from hydraulic fracturing and certain other natural gas operations, but has not yet proposed any such regulations. In addition, the U.S. Department of the Interior published a Supplemental Notice of Proposed Rulemaking on May 16, 2013 that would update existing regulation of hydraulic fracturing activities on federal and Indian lands, including requirements for chemical disclosure, well bore integrity and handling of flowback water. This proposed rulemaking is currently pending. Studies by the EPA and other federal agencies are underway that focus on the environmental aspects of hydraulic fracturing activities, with draft reports expected for public comment and peer review in 2015. These studies could spur further regulation. Additional regulations adopted at the federal or state level could result in permitting delays and cost increases.
Along with several other states, Pennsylvania has adopted laws and proposed regulations that require oil and natural gas operators to disclose chemical ingredients and water volumes used to hydraulically fracture wells, in addition to more stringent well construction and monitoring requirements. The chemical ingredient information is generally available to the public via online databases, and this may bring more public scrutiny to hydraulic fracturing operations. In addition, local governments may also adopt ordinances within their jurisdictions regulating the time, place and manner of drilling activities in general or hydraulic fracturing activities in particular or prohibit the performance of well drilling in general or hydraulic fracturing, in particular. In Pennsylvania, although the legislature passed legislation to make regulation of drilling uniform throughout the state, the Pennsylvania Supreme Court in Robinson Township v. Commonwealth of Pennsylvania struck down portions of that legislation. Following this decision, local governments in Pennsylvania may adopt ordinances regulating drilling and hydraulic fracturing activities, especially within residential areas. If new or more stringent federal, state, or local legal restrictions relating to the hydraulic fracturing process are adopted in areas where we operate, we could incur potentially significant added costs to comply with such requirements, experience delays or curtailment in the pursuit of exploration, development, or production activities, and perhaps even be precluded from drilling wells.
Our derivatives activities could result in financial losses or could reduce our income.
In order to achieve a more predictable cash flow, reduce our exposure to adverse fluctuations in the prices of oil and natural gas, and comply with credit agreement requirements, we currently, and may in the future, enter into financial derivatives contracts affecting a portion of our oil and natural gas production. Financial derivatives contracts expose us to the risk of financial loss in some circumstances, including when:
- •
- production is less than expected;
- •
- the counterparty to the derivatives contract defaults on its contractual obligations; or
- •
- there is a change in the expected differential between the underlying price in the hedging agreement and the actual price received.
In addition, these types of derivatives arrangements limit the benefit we would receive from increases in the prices for oil and natural gas for the production affected by the financial derivatives contracts and may expose us to cash margin requirements or increased demands for collateral from our counterparties to such contracts.
44
Financial uncertainties in the broader economy as a whole may increase the risk that a counterparty may default on its obligations, as was demonstrated by the recent sub-prime mortgage losses incurred by many banks and other financial institutions (and which prompted the U.S. Congress to attempt to mitigate such risks in the future through the Dodd-Frank Act). Such losses, if they occur, may affect the ability of the counterparties to meet their obligations to us on derivatives transactions, which would reduce our revenues from derivatives at a time when we are also receiving a lower price for our oil and natural gas sales. As a result, our financial condition could be materially or adversely affected.
We have elected not to designate our commodity derivatives as cash flow hedges for accounting purposes. Accordingly, such contracts are recorded at fair value on our Balance Sheet and changes in fair value are recorded in the Consolidated Statements of Operations as they occur.
The enactment of derivatives legislation, and the promulgation of regulations pursuant thereto, could have an adverse effect on our ability to use derivative instruments to hedge risks associated with our business.
The Dodd-Frank Wall Street Reform and Consumer Protection Act (the "Dodd-Frank Act") requires, among other things, that the Commodity Futures Trading Commission ("CFTC") enact regulations affecting financial derivatives contracts and the parties who enter into them ("Swap Dealers" and "Major Swap Participants"). The nature and scope of the regulations, which may result in additional capital or margin requirements or other limitations relating to our use of financial derivatives contracts to hedge commodity price risk, could have an adverse effect on our ability to implement and execute our hedging strategy. In particular, a requirement to post cash collateral in connection with our financial derivatives positions, which are currently collateralized on a non-cash basis by our oil and natural gas properties and other assets, would likely make it impracticable to implement our current hedging strategy or to meet the hedging requirements contained in our Third Amended and Restated Credit Facility (the "Credit Facility"). In addition, requirements and limitations imposed by the Dodd-Frank Act and the CFTC on our derivative counterparties could increase the costs of pursuing our hedging strategy. Finally, since the legislation was intended, in part, to decrease the volatility of commodity prices by restricting speculative trading in financial derivatives contracts our revenues could be negatively affected if the Dodd-Frank Act and CFTC regulations result in lower commodity prices. Any of these consequences could have a material adverse effect on us, our financial condition and our results of operations.
Under current CFTC regulations, a party whose core business is the exploration, production and sale of oil, natural gas or other energy commodities, and who is trading in financial derivatives solely for the purpose of hedging commercial risks associated with its core business, and who is not trading in financial derivatives solely for the purpose of earning a profit in the trading of such derivatives as a business in-and-of-itself, is not a "Swap Dealer" or "Major Swap Participant" within the meaning of the Dodd-Frank Act (unless it has positions the notional value of which are in excess of $8 billion, which would bring in only the largest of companies). Hedging by use of financial derivatives in this manner and subject to these restrictions puts such activity outside the reach of the CFTC and the Dodd-Frank Act. Moreover, physical forward transactions (transactions calling for physical delivery of a commodity in the future, which are not financial derivatives contracts) are specifically exempt from the reach of the CFTC and the Dodd-Frank Act. We do not believe that we meet the definition of "Swap Dealer" or "Major Swap Participant" and that the financial derivatives contracts that we enter into do not fall within the reach of the CFTC or the Dodd-Frank Act, but we cannot predict action by the CFTC with respect to any of these definitions or its future regulations, how these regulations will be interpreted or applied by the CFTC, or the effect that any of these regulations, as modified or applied in the future, will have on our hedging activities, or our ability to hedge at all.
Our hedging activities could result in the imposition of additional administrative burdens on us and expenses to us. Although we do not expect to be deemed to be, or to be regulated as, as "Swap
45
Dealer" or "Major Swap Participant," our counterparties in financial derivatives contracts may be regulated as "Swap Dealers" or "Major Swap Participants" and, in order to comply with regulations applicable to them, these counterparties may require that we supply certain information to them from time-to-time, and may further require that we obtain a registration number to supply to the CFTC. Also, depending on the number and nature of our financial derivatives contracts that we may have open at any given time, the CFTC may require that we file with the CFTC certain reports. Compliance with these requests and requirements could result in increased administrative burdens upon and increased expenses to us.
Proposed changes to U.S. and state tax laws, if adopted, could have an adverse effect on our business, financial condition, results of operations and cash flows.
President Obama has made proposals that would, if enacted into law, make significant changes to United States tax laws, including the elimination of certain key U.S. federal income tax incentives currently available to oil and natural gas exploration and production companies. Legislation has been introduced in Congress that would implement many of President Obama's proposals. These changes include, but are not limited to, (i) the repeal of the percentage depletion allowance for oil and natural gas properties, (ii) the elimination of current deductions for intangible drilling and development costs, (iii) the elimination of the deduction for certain U.S. production activities for oil and gas production, and (iv) the increase in the amortization period from two years to seven years for geophysical costs paid or incurred in connection with the exploration for, or development of, oil or natural gas within the United States. It is unclear, however, whether any such changes will be enacted or how soon such changes could be effective. The passage of any legislation as a result of these proposals or any other similar changes in U.S. federal income tax laws could defer or eliminate certain tax deductions that are currently available with respect to oil and natural gas exploration and development, and any such change could negatively affect our financial condition, results of operations and cash flows.
We could also be adversely affected by future changes to applicable state tax laws and regulations. For example, proposals have been made to amend California State and local laws to impose "windfall profits," severance or other taxes on oil and natural gas companies. If any of these proposals become law, our costs would increase, possibly materially. Significant financial difficulties currently facing the State of California and other localities may increase the likelihood that one or more of these proposals will become law. For example, in California, there have been proposals at the legislative and executive levels over the past several years for tax increases which have included a severance tax as high as 12.5% on all oil production in California. Although the proposals have not passed the California Legislature, the financial crisis in the State of California could lead to a severance tax on oil being imposed in the future.
In February 2012, the state legislature of Pennsylvania passed a new natural gas impact fee. The legislation imposes an annual fee on natural gas and oil operators for each well drilled for a period of fifteen years. The fee is on a sliding scale set by the Public Utility Commission and is based on two factors: changes in the Consumer Price Index and the average NYMEX natural gas prices from the last day of each month. There can be no assurance that the impact fee will remain as currently structured or that new or additional taxes will not be imposed. In addition, there is currently no severance tax imposed on natural gas or oil in Pennsylvania. However on February 11, 2015, Pennsylvania Governor Tom Wolf proposed the Pennsylvania Education Reinvestment Act, a new severance tax targeting proceeds from production of unconventional natural gas wells within the state of Pennsylvania. The proposal includes a 5% tax on the value of the gas at the wellhead plus a 4.7cents per thousand cubic feet of volume severed. Additionally, no portion of the tax imposed in this legislation would be allowed to be deducted from royalty payments. The Governor's office has stated that this proposal would replace the existing impact fee. There is no assurance as to the final form of the proposal, or whether the proposal will be adopted. Changes to the current impact fee, or the imposition of a new severance
46
tax, could negatively affect our future cash flows and financial condition; however, no assurance can be made until the severance tax is made final.
Our operations are subject to environmental and occupational health and safety laws and regulations that may expose us to significant costs and liabilities.
Our oil and natural gas exploration and production operations are subject to stringent and comprehensive federal, regional, state and local laws and regulations governing occupational health and safety aspects of our operations, the discharge of materials into the environment, or otherwise relating to environmental protection. These laws and regulations may impose numerous obligations applicable to our operations, including the acquisition of a permit before conducting drilling or other regulated activities; restriction of types, quantities and concentration of materials that can be released into the environment; limitation or prohibition of drilling activities on certain lands lying within wilderness, wetlands and other protected areas; application of specific health and safety criteria addressing worker protection; and imposition of substantial liabilities for pollution resulting from our operations. Numerous governmental authorities, such as the EPA, and analogous state agencies have the power to enforce compliance with these laws and regulations and the permits issued under them, oftentimes requiring difficult and costly compliance or corrective actions. Failure to comply with these laws and regulations may result in the assessment of sanctions, including administrative, civil or criminal penalties, the imposition of investigatory or remedial obligations and the issuance of orders limiting or prohibiting some or all of our operations.
There is inherent risk of incurring significant environmental costs and liabilities in the performance of our operations, as a result of our handling of petroleum hydrocarbons and wastes, because of air emissions and wastewater discharges related to our operations and due to historical industry operations and waste disposal practices. Under certain environmental laws and regulations, we could be subject to joint and several, strict liability for the removal or remediation of previously released materials or property contamination regardless of whether we were responsible for the release or contamination or if the operations were not in compliance with all applicable laws at the time those actions were taken. Private parties, including the owners of properties upon which our wells are drilled and facilities where our petroleum hydrocarbons or wastes are taken for reclamation or disposal, also may have the right to pursue legal actions to enforce compliance as well as to seek damages for non-compliance with environmental laws and regulations or for personal injury or property or natural resource damages. In addition, the risk of accidental spills or releases could expose us to significant liabilities that could have a material adverse effect on our business, financial condition or results of operations. Environmental advocacy groups and others continue to raise questions and concerns about potential environmental issues that may be associated with hydraulic fracturing, horizontal drilling, and related operations that are key aspects of our business, including concerns about potential impacts on groundwater quality, seismic activity, and greenhouse gas emissions; any of these could lead to changes in regulations in one or more of the jurisdictions in which we operate. Changes in environmental laws and regulations occur frequently, and any changes that result in more stringent or costly well drilling, construction, completion or water management activities, or waste control, handling, storage, transport, disposal or cleanup requirements could require us to make significant expenditures to attain and maintain compliance and may otherwise have a material adverse effect on our own results of operations, competitive position or financial condition. We may not be able to recover some or any of these costs from insurance.
The geographic concentration of our oil reserves in California exposes us to more risks and may have a greater effect on our ability to sell our oil production than if our reserves were more geographically diversified.
A substantial portion of our revenues are generated from oil sales and all of our oil reserves are located in California. Any regional events, including price fluctuations, natural disasters and restrictive
47
regulations that increase costs, reduce availability of equipment or supplies, reduce demand or limit our production may impact our operations more than if our reserves were more geographically diversified.
Our California oil production is, on average, heavier than premium grade light oil and the margin (sales price minus production costs) is generally less than that of lighter oil sales due to the processes required to refine this type of oil and the transportation requirements. As such, the effect of material price decreases will more adversely affect the profitability of heavy oil production compared with lighter grades of oil.
We are subject to the full cost ceiling limitation which may result in a write-down of our estimated net reserves in the future.
We utilize the full cost method of accounting for costs related to our oil and natural gas properties. Under the full cost method, we are subject to quarterly calculations of a "ceiling" or limitation on the amount of our oil and natural gas properties that can be capitalized on our balance sheet. If the net capitalized costs of our oil and natural gas properties exceed the cost center ceiling, we are subject to a write-down of our net oil and natural gas properties to the extent of such excess. A capitalized cost ceiling test impairment also reduces earnings and impacts stockholders' equity in the period of occurrence and results in lower amortization expense in future periods. The discounted present value of our proved reserves is a major component of the ceiling calculation and represents the component that requires the most subjective judgments. The risk that we will be required to write down the carrying value of oil and natural gas properties increases when oil and natural gas prices are depressed or volatile.
For 2014, 2013 and 2012, there was no ceiling test impairment on our oil and natural gas properties; however, a write-down of proved oil and natural gas properties may occur if we experience substantial downward adjustments in our estimated proved reserves. An expense recorded in one period may not be reversed in a subsequent period even though higher oil and natural gas prices may have increased the applicable ceiling in the subsequent period. This and other factors could cause us to write down our oil and natural gas properties or other assets in the future and incur a non-cash charge against future earnings.
Certain of our undeveloped leasehold acreage is subject to leases that will expire over the next several years unless production is established on units containing the acreage.
As of December 31, 2014, we own leasehold interests in approximately 73,355 shallow undeveloped net acres in the Washakie Basin of Wyoming that we believe may be prospective for CBM development and approximately 59,070 deep undeveloped net acres in areas we believe may be prospective for the Niobrara Shale and other deep formations. A large portion of our acreage in the Washakie Basin is not currently held by production. Unless production in paying quantities is established on units containing these leases, approximately zero net acres, 485 net acres and 506 net acres of these shallow leases will expire in 2015, 2016 and 2017, respectively. If our leases expire, we will lose our right to develop the related properties, and could lose up to a total of 45,595 net acres of shallow rights and 39,229 total net acres of deep rights in 2017.
Our drilling plans for these areas are subject to change based upon various factors, many of which are beyond our control, including drilling results, oil and natural gas prices, the availability and cost of capital, drilling and production costs, availability of drilling services and equipment, gathering system and pipeline transportation constraints, and regulatory approvals. Further, some of our acreage is located in areas where we do not hold the majority of the acreage and therefore it is likely that we will not be named the operator of these areas. As a non-operating leaseholder we have less control over the timing of drilling, and there is additional risk of expirations occurring in sections where we are not
48
the operator. Any of these factors may have a material adverse effect on our future business, financial condition and results of operations.
Part of our strategy involves using some of the latest available horizontal drilling and completion techniques, which involve risks and uncertainties in their application.
Our operations in Pennsylvania involve utilizing some of the latest drilling and completion techniques as developed by us, other oil and gas exploration and production companies and our service providers. Risks that we face while drilling, including or as a result of the application of these techniques, include, but are not limited to, the following:
- •
- effectively controlling the level of pressure flowing from particular wells;
- •
- landing our wellbore in the desired drilling zone;
- •
- staying in the desired drilling zone while drilling horizontally through the formation;
- •
- running our casing the entire length of the wellbore; and
- •
- being able to run tools and other equipment consistently through the horizontal wellbore.
Risks that we face while completing our wells, including or as a result of the application of these techniques, include, but are not limited to, the following:
- •
- the ability to fracture stimulate the planned number of stages;
- •
- the ability to run tools the entire length of the wellbore during completion operations; and
- •
- the ability to successfully clean out the wellbore after completion of the final fracture stimulation stage.
Drilling for and producing oil and natural gas are high risk activities with many uncertainties that could have a material adverse effect on our business, financial condition or results of operations.
Our future success depends largely on the success of our exploration, exploitation, development and production activities. These activities are subject to numerous risks beyond our control, including the risk that we will not find any commercially productive natural gas or oil reservoirs. Our decisions to purchase, explore, develop or otherwise exploit prospects or properties depends in part on the evaluation of geophysical and geological analyses, production data, and engineering studies, the results of which are often inconclusive or subject to varying interpretations. Our costs of drilling, completing, producing and operating wells are often uncertain before drilling commences. Drilling for oil and natural gas can be unprofitable, not only from dry holes, but from productive wells that do not produce sufficient revenues to pay the costs or return a profit. In addition, our drilling and producing operations, may be curtailed, delayed or canceled as a result of other factors, including:
- •
- delays in obtaining drilling permits from applicable regulatory authorities;
- •
- unusual or unexpected geological formations;
- •
- unexpected drilling conditions, including ground shifting or quakes;
- •
- pressure or irregularities in geological formations;
- •
- equipment failures or accidents;
- •
- well blow-outs;
- •
- fires and explosions;
- •
- pipeline and processing interruptions or unavailability;
49
- •
- title problems;
- •
- objections from surface owners in the areas where we operate;
- •
- adverse weather conditions;
- •
- lack of market demand for oil and natural gas;
- •
- damage to natural resources due to underground migration of hydraulic fracturing fluids;
- •
- pollution and other environmental damage, including spills or mishandling of recovered hydraulic fracturing fluids;
- •
- delays imposed by or resulting from compliance with environmental and other regulatory requirements;
- •
- shortages of or delays in the availability or delivery of drilling rigs and equipment; and
- •
- reductions in oil and natural gas prices.
Our future drilling activities may not be successful. Our drilling success rate could decline generally or within a particular area and we could incur losses by drilling unproductive wells. Also, we may not be able to obtain sufficient contracts covering our lease rights in potential drilling locations. We cannot be sure that we will ever drill our identified potential drilling locations, or that we will produce natural gas or oil from them or from any other potential drilling locations. Shut-in wells, curtailed production and other production interruptions may negatively impact our business and result in decreased revenues.
All of our oil production in California is dedicated to one customer and as a result, our credit exposure to this customer is significant.
We have entered into an oil marketing arrangement with Phillips 66 Company (formerly ConocoPhillips) under which Phillips 66 Company purchases all of our net oil production in California. We generally do not require letters of credit or other collateral to support these trade receivables. Accordingly, a material adverse change in their financial condition or their unwillingness to enter into future purchase arrangements could adversely impact our ability to sell our California oil, and thereby adversely affect our business, results of operations or financial condition.
Our development and exploration operations require substantial capital and we may be unable to obtain needed capital or financing on satisfactory terms, which could lead to a loss of properties and a decline in our oil and natural gas reserves.
The oil and natural gas industry is capital intensive. We spend and will continue to need a substantial amount of capital for the acquisition, exploration, exploitation, development and production of oil and natural gas reserves. We have historically addressed our short and long-term liquidity needs through the use of cash flow provided by operating activities, borrowing under bank credit facilities, and the issuance of equity and debt securities. Without adequate financing we may not be able to successfully execute our operating strategy. The availability of these sources of capital will depend upon a number of factors, some of which are beyond our control. These factors include:
- •
- general economic, financial and market conditions;
- •
- oil and natural gas prices;
- •
- our market value and operating performance;
- •
- timely issuance of permits and licenses by governmental agencies;
- •
- the success of our CBM projects in the Washakie Basin;
50
- •
- the success of our waterflood recovery oil projects in the WTU and the NWU;
- •
- the success of our Marcellus Assets that we recently acquired;
- •
- our success in locating and producing new reserves;
- •
- amounts of necessary working capital and expenses; and
- •
- the level of production from existing and new wells.
We may not be able to execute our operating strategy if we cannot obtain adequate capital. If low oil and natural gas prices, lack of adequate gathering or transportation facilities, operating difficulties or other factors, many of which are beyond our control, cause our revenues and cash flows from operating activities to decrease, our borrowing base under our Credit Facility may be limited or reduced, and our ability to obtain the capital necessary to sustain our operations may also be limited.
Additional financing sources may be required in the future to fund our developmental and exploratory drilling. Financing may not be available in the future under existing or new financing arrangements, or we may not be able to obtain the necessary financing on acceptable terms, if at all. If sufficient capital resources are not available, we may be forced to curtail drilling, acquisition and other operations, or sell some of our assets on an untimely or unfavorable basis. We would also face a possible loss of properties and a decline in our oil and natural gas reserves, which would have an adverse effect on our business, financial condition and results of operations.
Unless we replace our oil and natural gas reserves, our reserves and production will decline, which would adversely affect our business, financial condition and results of operations.
Producing oil and natural gas reservoirs generally are characterized by declining production rates that vary depending upon reservoir characteristics and other factors. Our future success depends on our ability to find, develop or acquire additional oil and natural gas reserves that are economically recoverable. Our proved reserves generally decline when production occurs, unless we conduct successful exploration or development activities or acquire properties containing proved reserves, or both. We may not be able to find, develop or acquire additional reserves on an economic basis. Furthermore, if oil and natural gas prices increase, our costs for additional reserves could also increase. Thus, our future oil and natural gas reserves and production, cash flow and income are highly dependent on our success in efficiently developing and exploiting our current reserves and economically finding or acquiring additional recoverable reserves. We may not be able to find, finance, acquire or develop additional reserves to replace our current and future production at acceptable costs.
Our identified drilling location inventories are scheduled out over several years, making them susceptible to uncertainties that could materially alter the occurrence or timing of their drilling.
Our management has identified and scheduled drilling locations as an estimation of our future multi-year drilling activities on our existing acreage. These identified drilling locations represent a significant part of our growth strategy. Our ability to drill and develop these locations depends on a number of uncertainties, including the availability of capital, seasonal and weather conditions, regulatory approvals, oil and natural gas prices, costs and expenses, and drilling and production results. Because of these uncertainties, we do not know if the potential drilling locations we have identified will ever be drilled, or if we will be able to produce natural gas or oil from these or any other potential drilling locations. As such, our actual drilling activities may materially differ from those presently identified, which could adversely affect our business, financial condition and results of operations.
51
We face significantly increasing water injection and disposal regulations and costs in our drilling operations.
Water is an essential component of oil and natural gas production during the drilling, and in particular, hydraulic fracturing, process. Our inability to locate sufficient amounts of water, or dispose of or recycle water used in our exploration and production operations, could adversely impact our operations.
Moreover, the imposition of new environmental initiatives and regulations could include restrictions on our ability to conduct certain operations such as hydraulic fracturing or disposal of waste, including, but not limited to, produced water, drilling fluids and other wastes associated with the exploration, development or production of natural gas. The Clean Water Act and similar state laws impose restrictions and strict controls on the discharge of produced waters and other natural gas and oil waste where such discharges could affect surface or ground waters. For example, state and federal regulations prohibit the discharge of produced water and sand, drilling fluids, drill cuttings and certain other substances related to the natural gas and oil industry into coastal waters. We must obtain permits for certain discharges into waters and wetlands and for construction activities that may affect regulated water resources. The EPA has also adopted regulations requiring certain natural gas and oil exploration and production facilities to obtain permits for storm water discharges. The Clean Water Act and similar state laws provide for civil, criminal and/or administrative penalties for any unauthorized discharges of pollutants, reportable quantities of oil and other hazardous substances. Moreover, sending wastewater to publicly-owned treatment works in Pennsylvania requires certain levels of pretreatment that may effectively prohibit such disposal, and our continued ability to use injection wells as a disposal option not only will depend on federal or state regulations, but also on whether available injection wells have sufficient storage capacities. Compliance with current and future federal, state and local environmental regulations and permit requirements governing the withdrawal, storage and use of surface water or groundwater necessary for hydraulic fracturing of wells may increase our operating costs and cause delays, interruptions or termination of our operations, the extent of which cannot be accurately predicted.
We face increasing natural gas disposal regulations and costs in our Wilmington oil operations that could limit our oil production.
The State of California and the EPA have restrictive regulations for the disposition of natural gas produced from our Wilmington oil drilling operations. Natural gas production has continued to grow along with increasing oil production, particularly in the WTU. Because the gas volume from the WTU was historically too low to justify gas sales equipment, the gas has been flared for many years under a permit from the South Coast Air Quality Management District ("SCAQMD"). In late 2007, Warren entered into an agreement with the SCAQMD which allowed Warren to commission six microturbines to generate electrical power from the otherwise flared gas and resume full production. As oil production grew since that time, the excess gas produced but not consumed by our microturbines began to exceed our gas flare limitation. In March 2008, we presented our plan to the SCAQMD to seek approvals from regulatory authorities to dispose of our WTU produced gas by re-injection in underground formations or by selling it directly to a third party user. Warren also applied to the SCAQMD for a permit to construct a new high efficiency clean enclosed burner to replace the existing gas flare. Our filed applications for permits requested the authority to install and operate certain pieces of new best available control technology equipment. On July 19, 2011 the SCAQMD certified the Company's CEQA documents and issued all of the related permits, including gas handling equipment. These equipment upgrades will help increase the Company's oil processing capability to a ceiling of 5,000 barrels of oil per day at the Wilmington Townlot Unit. As requested by the SCAQMD, in 2012 the Company began preparing an additional analysis under CEQA to analyze and mitigate the potential air and other emissions that may be associated with pipeline connections and the installation of gas transportation, compression and related equipment that will be required to sell excess gas through a
52
local gas utility company to third parties. This additional CEQA analysis was completed in late 2014, and construction permits were issued by the SCAQMD. Warren is currently constructing and installing the gas transportation, compression and related equipment, and will schedule governmental inspections of the system and its operating capabilities in late 2015. Any delays in obtaining equipment or constructing the system; any delays by regulatory agencies or public utilities in approving or inspecting the operation of the system or issuing permits in the future to operate the system or dispose of the natural gas, or our inability to locate a third party to purchase the excess gas could limit our future oil production levels until such matters are resolved.
Market conditions or operational impediments may hinder our access to oil and natural gas markets or delay our production.
Market conditions or the unavailability of satisfactory oil and natural gas processing or transportation arrangements may hinder our access to oil and natural gas markets or delay our production. The marketability of our production depends in part upon the availability, proximity and capacity of pipelines, natural gas gathering systems and processing facilities. This dependence is heightened in our CBM operations where this infrastructure is less developed than in our oil operations. For example, there is limited pipeline capacity in the southern portion of the Washakie Basin. Also, as production volumes grow in the Atlantic Rim area, additional pipeline capacity and gas compression will be required.
We deliver oil and natural gas through gathering systems and pipelines that we do not own. These facilities may not be available to us in the future. Our ability to produce and market oil and natural gas is affected and may be harmed by:
- •
- the lack of pipeline transmission facilities or carrying capacity;
- •
- federal and state regulation of oil and natural gas production; and
- •
- federal and state transportation, taxation and energy policies.
We own 100% of the compression facilities and pipeline in the Atlantic Rim area of the Washakie Basin in Wyoming. Any significant change in pipeline or compression operations or other market factors affecting our overall infrastructure facilities could adversely impact our ability to deliver the natural gas we produce to market in an efficient manner, or to obtain adequate natural gas prices. In some cases, we may be required to shut-in wells, at least temporarily, because of a lack of a market or the inadequacy or unavailability of transportation facilities. If that were to occur, we would be unable to realize revenue from those wells until arrangements could be made to deliver our production to market.
Insufficient takeaway capacity in the Marcellus Shale could cause significant fluctuations in our realized natural gas prices.
The Marcellus Shale natural gas business environment has historically been characterized by periods in which production has surpassed local takeaway capacity, sometimes resulting in curtailment of production or substantial discounts in the price received by producers. We expect that a significant portion of our production in the Marcellus Shale will be transported on pipelines that experience a negative differential to NYMEX Henry Hub prices. Should production growth in the Marcellus Shale continue to outpace the increases in takeaway capacity or if we are unable to secure firm takeaway capacity to accommodate our growing production, it could result in substantial discounts in the price we receive for our production, may limit our ability to market our production and could have a material adverse effect on our financial condition and results of operations.
53
We may be affected by climate change and market or regulatory responses to climate change.
Climate change, including the impact of global warming, could have a material adverse effect on our results of operations, financial condition, and liquidity. Restrictions, caps, taxes, or other controls on emissions of greenhouse gasses, including exhaust from generators, engines and flaring of excess natural gas, could significantly increase our operating costs. Restrictions on emissions could also affect businesses that (a) use oil and natural gas to produce energy, or (b) manufacture or produce goods that consume significant amounts of energy or burn fossil fuels, including chemical producers, farmers and food producers, and automakers and other manufacturers. Significant cost increases, government regulation, or changes of consumer preferences for goods or services relating to alternative sources of energy or emissions reductions could materially affect the markets for the oil and natural gas commodities, which in turn could have a material adverse effect on our results of operations, financial condition, and liquidity. Government incentives encouraging the use of alternative sources of energy could also affect certain of our oil and natural gas commodity purchasers and the markets for certain of the commodities in an unpredictable manner, including, for example, the impacts of ethanol incentives on farming and ethanol producers and tax credits for wind turbine and solar power generation. We could face increased costs related to defending and resolving legal claims and other litigation related to climate change and the alleged impact of our operations on climate change. Finally, some scientists have concluded that increasing concentrations of greenhouse gases, or GHGs in the Earth's atmosphere may produce climate changes that have significant physical effects, such as increased frequency and severity of storms, droughts and floods and other climatic events. Any of these factors, individually or in conjunction with one or more of the other factors, or other unforeseen impacts of climate change could reduce the demand for oil and natural gas commodities and have a material adverse effect on our results of operations, financial condition and liquidity. For a more detailed discussion, please see "Business—Regulations and Environmental Matters—Climate Change Legislation and Greenhouse Gas Regulations."
Acquired properties or businesses may not produce as projected, and we may be unable to determine reserve potential, identify liabilities associated with the properties or businesses or obtain protection from sellers against them, which could cause us to incur losses.
One of our growth strategies is to pursue selective acquisitions of oil and natural gas reserves. We perform a review of the target properties that we believe is consistent with industry practices. However, these reviews may not be completely accurate. Generally, it is not feasible to review in depth every individual property involved in each acquisition. Even a detailed review of records and properties may not necessarily reveal existing or potential problems, nor will it permit a buyer to become sufficiently familiar with the properties to fully assess their deficiencies and potential. Inspections may not always be performed on every well, and environmental problems, such as groundwater contamination, are not necessarily observable, even when an inspection is undertaken. Even when problems are identified, a seller may be unwilling or unable to provide effective contractual protection against all or part of those problems, and we often assume environmental and other risks and liabilities in connection with the properties we acquire.
In addition, any acquisition involves, among other things, the following potential risks:
- •
- the risk that reserves expected to support the acquired assets may not be of the anticipated magnitude or may not be developed as
anticipated;
- •
- the risk of title defects discovered after closing;
- •
- inaccurate assumptions about revenues and costs, including synergies;
- •
- significant increases in our indebtedness and working capital requirements;
- •
- an inability to transition and integrate successfully or timely the businesses we acquire;
54
- •
- the cost of transition and integration of data systems and processes;
- •
- the potential environmental problems and costs;
- •
- the assumption of unknown liabilities;
- •
- limitations on rights to indemnity from the seller;
- •
- the diversion of management's attention from other business concerns;
- •
- increased demands on existing personnel and on our corporate structure;
- •
- disputes arising out of acquisitions;
- •
- customer or key employee losses of the acquired businesses; and
- •
- the failure to realize expected growth or profitability.
The scope and cost of these risks may ultimately be materially greater than estimated at the time of the acquisition. Further, our future acquisition costs may be higher than those we have achieved historically. Any of these factors could adversely impact our future growth and could have a material adverse effect on our business, financial condition and results of operations.
Seasonal weather conditions and lease stipulations adversely affect our ability to conduct drilling activities in some of the areas where we operate.
Oil and natural gas operations in Wyoming can be adversely affected by seasonal weather conditions and lease stipulations designed to protect various wildlife, the environment and related matters. Our operations in Wyoming are conducted in areas subject to extreme weather conditions and in difficult terrain. Primarily in the winter and spring, our operations are often curtailed because of cold, snow and wet conditions, as well as lease stipulations. In certain areas on federal lands, drilling and other oil and natural gas activities can only be conducted during limited times of the year. This limits our ability to operate in those areas and can intensify competition during those times for drilling rigs, oil field equipment, services, supplies and qualified personnel, which may lead to periodic shortages. These constraints and the resulting shortages or high costs could delay our operations and materially increase our operating and capital costs, and could have a material adverse effect on our business, financial condition and results of operations.
The loss of key personnel could adversely affect our business.
We depend to a large extent on the efforts and continued employment of our executive management team and other key personnel. The loss of the services of our key personnel could adversely affect our business, and we do not maintain key man insurance on the lives of these persons.
Our drilling success and the success of other activities integral to our operations will depend, in part, on our ability to attract and retain experienced geologists, engineers, landmen and other professionals. Competition for many of these professionals is intense. If we cannot retain our technical personnel or attract additional experienced technical personnel and professionals, our ability to compete could be significantly impaired.
A payment default or an acceleration under our Credit Facility could result in an event of default and acceleration of indebtedness under the Senior Notes.
If the indebtedness under the Senior Notes were to be accelerated, there can be no assurance that we would have, or be able to obtain, sufficient funds to repay such indebtedness in full. In addition, our obligations under our Credit Facility are collateralized by perfected first-priority liens and security interests on substantially all of the oil and gas assets of the Company and the Guarantors (as defined
55
herein), and is guaranteed by the Guarantors, which are three wholly-owned subsidiaries of the Company, and if we are unable to repay our indebtedness under the Credit Facility, the lenders could seek to foreclose on our assets.
We do not insure against all potential operating risks. We may incur substantial losses and be subject to substantial liability claims as a result of various lawsuits, which may not be fully covered by our insurance.
Our insurance coverage does not cover all potential risks, losses, costs, or liabilities. We ordinarily maintain insurance against various losses and liabilities arising from our operations in accordance with customary industry practices and in amounts that management believes to be prudent. Losses and liabilities arising from uninsured and underinsured events or in excess of existing insurance coverage could have a material adverse effect on our business, financial condition or results of operations. Business disruptions could seriously harm our future revenue and financial condition and increase our costs and expenses. Our operations could be subject to earthquakes, mudslides, fires, power shortages, telecommunications failures, water shortages, floods, hurricanes, extreme weather conditions and other natural or manmade disasters or business interruptions, for which we are predominantly self-insured for these types of occurrences. The occurrence of any of these business disruptions could seriously harm our revenue and financial condition and increase our costs and expenses. A substantial portion of our oil properties and operations are located in southern California near major earthquake faults. Our revenues and income could be adversely affected if our operations in these locations are disrupted for any reason, including natural disasters or environmental, public health, or political issues. The ultimate impact of being located near major earthquake faults and being consolidated in certain geographical areas is unknown, but our revenue, profitability and financial condition could suffer in the event of a major earthquake or other natural disaster.
Our oil and natural gas exploration and production activities are subject to numerous hazards and risks associated with drilling for, operating, producing and transporting oil and natural gas, and any of these risks can cause substantial losses resulting from:
- •
- environmental hazards, such as uncontrollable flows of natural gas, oil, brine water, well fluids, toxic gas or other pollution being
released into the environment;
- •
- abnormally pressured formations and ground subsidence;
- •
- mechanical difficulties, inadequate oil field drilling and service tools, and casing collapses;
- •
- fires and explosions;
- •
- personal injuries and death;
- •
- labor and employment issues;
- •
- regulatory investigations and penalties; and
- •
- natural disasters, such as earthquakes, hurricanes and floods.
Any of these risks could have a material adverse effect on our ability to conduct operations or result in substantial losses to us. Many of these risks are not insured because the cost of available insurance, if any, is excessive. In addition, pollution and environmental risks generally are not fully insurable. If a significant accident or other event occurs that is not fully covered by insurance, it could have a material adverse effect on our business, financial condition and results of operations. See "Business—Operating Hazards and Insurance."
56
Competition in the oil and natural gas industry is intense, and many of our competitors have greater financial, technological and other resources than we do, which may adversely affect our ability to compete.
We operate in highly competitive areas of oil and natural gas exploration, exploitation, development and acquisition with a substantial number of other companies. We face intense competition from independent, technology-driven companies, as well as from both major and other independent oil and natural gas companies, in each of the following areas:
- •
- acquiring desirable producing properties or new leases for future exploration;
- •
- marketing our oil and natural gas production;
- •
- integrating new technologies; and
- •
- acquiring the equipment, personnel and expertise necessary to develop and operate our properties.
Many of our competitors have financial, managerial, technological and other resources substantially greater than ours. These companies may be able to pay more for exploratory prospects and productive oil and natural gas properties, and may be able to define, evaluate, bid for and purchase a greater number of properties and prospects than our financial or human resources permit. To the extent our competitors are able to pay more for properties than we are, we will be at a competitive disadvantage. Further, many of our competitors may enjoy technological advantages and may be able to implement new technologies more rapidly than we can. Our ability to explore for oil and natural gas and to acquire additional properties in the future will depend upon our ability to successfully conduct operations, implement advanced technologies, evaluate and select suitable properties, and consummate transactions in this highly competitive environment.
Defects in the title to any of our oil and natural gas interests could result in the loss of some of our oil and natural gas properties or portions thereof, or liability for losses resulting from defects in the assignment of leasehold rights.
We obtain interests in oil and natural gas properties with varying degrees of warranty of title, such as general, special or quitclaim or without any warranty. We acquired our interests in the WTU in 1999 and 2005 with no title opinion as to the interests we acquired, which may ultimately prove to be less than the interests we believe we own. The prior owner had acquired its interests from a third party that, in turn, had acquired its interest from Exxon Corporation with no warranty of title. Exxon had owned the WTU for over 25 years before its sale in 1997. Similarly, when we acquired our interest in the NWU in December 2005, we had no title opinion prepared as to the interests acquired. The prior owner had owned the NWU for over 15 years, acquired the NWU from Sun Oil Corporation, which had owned the NWU for over 20 years before its sale in 1990 without warranty of title. Losses of title to the WTU or the NWU may result from title defects or from ownership of a lesser interest than we believe we acquired. In other instances, title opinions may not be obtained if in our discretion it would be uneconomical or impractical to do so. Furthermore, in certain instances we may determine to purchase properties even though certain technical title defects exist if we believe it to be an acceptable risk under the circumstances. These situations increase the possible risk of loss and could potentially result in total loss of title to some or all of the properties we purchased.
Prospects that we decide to drill may not yield oil or natural gas in commercially viable quantities.
A prospect is a property on which we have identified what our geoscientists believe, based on available seismic and geological information, to be indications of oil or natural gas. Our prospects are in various stages of evaluation, and range from a prospect that is ready to drill to a prospect that will require substantial additional geological or seismic data processing and interpretation. However, the use of seismic data and other technologies and the study of producing fields in the same area will not
57
enable us to know conclusively, prior to drilling and testing, whether natural gas or oil will be present or, if present, whether oil or natural gas will be present in sufficient quantities to recover drilling or completion costs or be economically viable. If we drill wells in our current and future prospects that are identified as non-economic wells or dry holes, our drilling success rate may decline and materially harm our business. In sum, the cost of drilling, completing and operating any wells is often uncertain and new wells may not be productive.
As co-venturer in joint ventures, we are liable for various obligations of those joint ventures.
We have entered into joint ventures in the past and may do so again in the future. As a co-venturer, we are contingently liable for the obligations of the joint venture, including responsibility for day-to-day operations and liabilities which cannot be repaid from joint venture assets, insurance proceeds or indemnification by others. In the future, we might be exposed to litigation in connection with joint venture activities, or find it necessary to advance funds on behalf of joint ventures to protect the value of the oil and natural gas properties by drilling wells to produce undeveloped reserves or to pay lease operating expenses in excess of production. These activities may have a material adverse effect on our business, financial condition and results of operations
Our role as co-venturer in joint ventures may result in conflicts of interest, which may not be resolved in our best interests or the best interests of our noteholders.
We have entered into joint ventures in the past and may do so again in the future. Our role as co-venturer in joint ventures may result in conflicts of interest between the interests of those entities and our noteholders. Any resolution of these conflicts may not always be in our best interests and may have a material adverse effect on our business, financial condition and results of operations.
We have limited control over activities on properties we do not operate, which could reduce our production and revenues.
A portion of our business activities is conducted through joint operating or other agreements under which we own partial ownership or working interests in oil and natural gas properties. We may not operate all of the properties in which we have an interest and may not have the ability to remove the operator in the event of poor performance. As a result, in such situations, we may be limited in our ability to influence normal operating procedures, expenditures or future development of underlying properties and their associated costs. The failure of an operator of our wells to adequately perform operations, or an operator's breach of the applicable agreements, could reduce our revenues and production. Therefore, the success and timing of our drilling and development activities on properties operated by others depends upon a number of factors outside of our control, including:
- •
- timing and amount of capital expenditures;
- •
- expertise and financial resources;
- •
- inclusion of other participants in drilling wells; and
- •
- use of technology.
Shortages of rigs, equipment, supplies and personnel could delay or otherwise adversely affect our cost of operations or our ability to operate according to our business plans.
If domestic drilling activity increases, particularly in the fields in which we operate a general shortage of drilling and completion rigs, field equipment and qualified personnel could develop. As a result, the costs and delivery times for rigs, equipment and personnel could be substantially greater than in previous years. From time to time, these costs have sharply increased and could do so again. The demand for and wage rates of qualified drilling rig crews generally rises in response to the
58
increasing number of active rigs in service and could increase sharply in the event of a shortage. Although we own a drilling rig for use in the WTU, shortages of drilling and completion rigs, field equipment or qualified personnel could delay, restrict or curtail our exploration and development operations, which could in turn harm our operating results.
Failure of our internal control over financial reporting could harm our business and financial results.
The management of the Company is responsible for establishing and maintaining effective internal control over financial reporting. Internal control over financial reporting is a process that provides reasonable assurance regarding the reliability of financial reporting for external purposes in accordance with accounting principles generally accepted in the United States of America. Internal control over financial reporting includes maintaining records that, in reasonable detail, accurately and fairly reflect the Company's transactions; providing reasonable assurance that transactions are recorded as necessary for preparation of the financial statements; providing reasonable assurance that receipts and expenditures are made in accordance with management authorization; and providing reasonable assurance that unauthorized acquisition, use or disposition of the Company assets that could have a material effect on the financial statements would be prevented or detected on a timely basis. Because of its inherent limitations, internal control over financial reporting is not intended to provide absolute assurance that a misstatement of our financial statements would be prevented or detected. Failure to maintain an effective system of internal control over financial reporting could limit our ability to report our financial results accurately and timely, or to detect and prevent fraud.
We make estimates and assumptions in connection with the preparation of our Consolidated Financial Statements, and any changes to those estimates and assumptions could have a material adverse effect on our results of operations.
In connection with the preparation of our Consolidated Financial Statements, we use certain estimates and assumptions based on historical experience and other factors. Our most critical accounting estimates are described in "Management's Discussion and Analysis of Financial Condition and Results of Operations" in this report. In addition, as discussed in Note A to the Consolidated Financial Statements, we make certain estimates, including decisions related to provisions for legal proceedings and other contingencies. While we believe that these estimates and assumptions are reasonable under the circumstances, they are subject to significant uncertainties, some of which are beyond our control. Should any of these estimates and assumptions change or prove to be incorrect, it could have a material adverse effect on our results of operations.
Computer security breaches and other disruptions could compromise our information and expose us to liability, which would cause our business and reputation to suffer.
In the ordinary course of our business, we collect and store sensitive data in our computer data centers and networks. This data includes intellectual property, our proprietary business information, lists of customers, suppliers and business partners, information concerning our oil and natural gas lessors and minerals, royalty and working interest owners, as well as our employees. The secure processing, maintenance and transmission of this information is critical to our operations. Despite our security measures, our information technology and infrastructure may be vulnerable to attacks by hackers or breached due to employee error, malfeasance or other disruptions. Any such breach could compromise our networks and the information stored there could be accessed, publicly disclosed, lost or stolen. Any such access, disclosure or other loss of information could result in legal claims or proceedings, liability under laws that protect the privacy of personal information, regulatory penalties, a disruption of our operations, and damage to our reputation; all of which could adversely affect our business.
59
Risks Relating to Ownership of Our Common Stock
The number of shares eligible for future sale or which have registration rights could adversely affect the future market for our common stock.
Sales of substantial amounts of previously restricted shares of our common stock in the public market, or the perception that these sales may occur, could cause the market price of our common stock to decline, or could impair our ability to raise capital through the sale of additional common or preferred stock.
As of December 31, 2014, we had 80,754,225 shares of common stock issued, 43,423 shares of common stock were issuable upon conversion of our convertible debt and convertible preferred stock, 1,987,159 shares of common stock were issuable upon exercise of outstanding options, and 689,370 shares of restricted stock are issuable upon vesting. Pursuant to a registration rights agreement to which we are party with Citrus, Citrus may require us to file one or more prospectus supplements to the registration statement on Form S-3 we have filed with the SEC for the resale of shares, and any shares sold pursuant to such prospectus supplements would become eligible for sale without restriction by persons other than our affiliates. Additionally, our directors and executive officers, beneficially hold approximately 8% of the outstanding shares of our common stock. If our stockholders sell significant amounts of common stock in any public market that develops or exercise their registration rights and sell a large number of shares, the price of our common stock could be negatively affected. If we were to include shares held by those holders in a registration statement pursuant to the exercise of their registration rights, those sales could impair our ability to raise needed capital by depressing the price at which we could sell our common stock or impede such an offering altogether.
Our stock price has been and may be volatile, and your investment in our stock could decline in value.
In recent years, the stock market has experienced significant price and volume fluctuations. Our common stock has experienced and may continue to experience volatility that is not related to our operating performance for reasons that include:
- •
- domestic and worldwide supplies and prices of and demand for natural gas and oil;
- •
- political conditions in natural gas and oil producing regions;
- •
- the success of our operating strategy;
- •
- war and acts of terrorism;
- •
- demand for our common stock;
- •
- revenue and operating results failing to meet the expectations of securities analysts or investors in any particular quarter or
period;
- •
- changes in expectations of our future financial performance, or changes in financial estimates, if any, of public market analysts;
- •
- investor perception of our industry or our prospects;
- •
- general economic trends;
- •
- limited trading volume of our stock;
- •
- changes in and compliance with environmental and other governmental rules and regulations;
- •
- actual or anticipated quarterly variations in our operating results;
- •
- our involvement in litigation;
- •
- conditions generally affecting the oil and natural gas industry;
60
- •
- the prices of oil and natural gas;
- •
- announcements relating to our business or the business of our competitors;
- •
- our liquidity; and
- •
- our ability to obtain or raise additional funds.
Many of these factors are beyond our control, and we cannot predict their potential effects on the price of our common stock. We cannot assure that the market price of our common stock will not fluctuate or decline significantly in the future. In addition, the stock markets in general can experience considerable price and volume fluctuations.
In particular, our stock price was very volatile during 2014, trading between $1.20 and $7.02 per share. In the event that the average closing price of our common stock does not equal or exceed $1.00 per share over a period of 30 consecutive trading days, we will be out of compliance with NASDAQ listing requirements and may become subject to delisting procedures. If our common stock is delisted from the NASDAQ Global Market, such delisting could negatively impact the market price of our common stock, reduce the number of investors willing to hold or acquire our common stock, and limit our ability to issue additional securities or obtain additional financing in the future, and might negatively impact our reputation and, as a consequence, our business.
Provisions in our articles of incorporation, bylaws and Maryland law may make it more difficult to effect a change in control, which could adversely affect the price of our common stock.
Provisions in our articles of incorporation, bylaws and Maryland law could make it more difficult for a third party to acquire us, even if doing so would be beneficial to our stockholders. We may issue shares of preferred stock in the future without stockholder approval and upon such terms as our board of directors may determine. Our issuance of this preferred stock could have the effect of making it more difficult for a third party to acquire, or of discouraging a third party from acquiring, a majority of our outstanding stock, and could potentially prevent the payment of a premium to stockholders in an acquisition.
Our articles of incorporation and bylaws contain provisions that could delay, defer or prevent a change in control of us or our management. These provisions include:
- •
- giving the board the exclusive right to fill all board vacancies;
- •
- providing that special meetings of stockholders may only be called by the board pursuant to a resolution adopted by
- •
- a majority of the members of the board, either upon a motion or written request by holders of at least
662/3% of the voting power of the shares entitled to vote, or
- •
- by our president;
- •
- a classified board of directors;
- •
- permitting removal of directors only for cause and with a super-majority vote of the stockholders; and
- •
- prohibiting cumulative voting in the election of directors.
These provisions also could discourage proxy contests and make it more difficult for our stockholders to elect directors and take other corporate actions. As a result, these provisions could make it more difficult for a third party to acquire us, even if doing so would benefit our stockholders, and could limit the price that investors are willing to pay in the future for shares of our common stock.
61
We are also subject to provisions of the Maryland General Corporation Law that prohibit business combinations with persons owning 10% or more of the voting shares of a corporation's outstanding stock, unless the combination is approved by the board of directors prior to the person owning 10% or more of the stock, for a period of five years after which the business combination would be subject to special stockholder approval requirements. This provision could deprive our stockholders of an opportunity to receive a premium for their common stock as part of a sale of our company, or may otherwise discourage a potential third party from attempting to obtain control from us, which in turn could have a material adverse effect on the market price of our common stock.
We have not paid cash dividends on our common stock and do not anticipate paying any dividends on our common stock in the foreseeable future.
Under the terms of our convertible preferred stock, we may not pay dividends on our common stock unless all accrued dividends on our convertible preferred stock have been paid. We anticipate that we will retain all future earnings and other cash resources for the future operation and development of our business. Accordingly, we do not intend to declare or pay any cash dividends on our common stock in the foreseeable future. Payment of any future dividends will be at the discretion of our board of directors after taking into account many factors, including our operating results, financial conditions, current and anticipated cash needs, and plans for expansion.
Item 1B: Unresolved Staff Comments.
None.
A description of our properties is included in Items 1 and 2. Business and Properties above and is incorporated herein by reference.
We believe that we have satisfactory title to the properties owned and used in our business, subject to customary liens for taxes not yet payable, liens incident to minor encumbrances, liens for credit arrangements, and easements and restrictions that do not materially detract from the value of the properties, our interests in the properties, or the use of the properties in our business. We believe our properties are adequate and suitable for us to conduct business in the future.
In 2005, Warren recorded a provision for $1.8 million relating to a contingent liability resulting from a lawsuit originally filed in 1998 by Gotham Insurance Company ("Gotham") in the 81st Judicial District Court of Frio County, Texas (Gotham Insurance Company v. Pedeco, Inc., et al.,) seeking a refund of approximately $1.8 million paid by Gotham and other insurers under an insurance policy issued for a well blow-out that occurred in 1997. After several appeals to the Texas Court of Appeals and the Texas Supreme Court, the case was remanded to the trial court for further proceedings. On January 22, 2010 the trial court awarded Gotham $1,823,156 and also awarded prejudgment interest at the rate of 5% per annum in the amount of $976,011. As a result of the January 2010 Summary Judgment, Warren recorded an additional provision of $1.3 million in the fourth quarter of 2009 relating to this contingent liability. On July 7, 2010, Warren E&P posted a supersedeas bond with the court and commenced to appeal the order of the trial court to the Texas Court of Appeals. On April 18, 2012, the Texas Court of Appeals reversed the judgment of the trial court and rendered its appellate decision in favor of Warren ruling that Gotham Insurance take nothing against Warren. Additionally, the Texas Court of Appeals ordered that Warren can recover all costs of the appeal from Gotham. In response, Gotham filed a petition with the Texas Supreme Court seeking a review of the ruling. On April 19, 2013, the Supreme Court granted Gotham's petition for a review of the Court of
62
Appeals ruling. On March 21, 2014, the Court ordered that the case be remanded to the Court of Appeals for reconsideration on the merits of Gotham's potential contractual claims for reimbursement. On August 29, 2014, the El Paso Court of Appeals referred the case for mediation in advance of trial. On October 21, 2014, the parties concluded a final settlement agreement settling all claims arising out of the original lawsuit filed in 1998 and filed a joint motion to render judgment effectuating the settlement agreement with the El Paso Court of Appeals on October 22, 2014. Pursuant to the terms of the settlement agreement, Warren paid Gotham a total of $2 million on October 24, 2014 in full and final settlement of all such claims. The El Paso Court of Appeals rendered final judgment in November 2014 and the supersedeas bonds were released in January 2015.
On November 3, 2014, Warren E&P was named as a defendant in a lawsuit in the Los Angeles County Superior Court, captioned Brandt Haas v. Warren E&P, Inc., Case No. BC562435, involving a claim disputing royalty payments made from the Company's operation at the Wilmington Townlot Unit. The plaintiff seeks to certify a class of all Wilmington Townlot Unit royalty owners who have received royalty payments since November 2010. Although the Company has not yet responded to this complaint, the Company denies plaintiff's allegations. The Company is unable to estimate a possible loss, or range of possible loss, if any, in this case.
We are party to a variety of legal, administrative, regulatory and government proceedings, claims and inquiries arising in the normal course of business. While the results of these proceedings, claims and inquiries cannot be predicted with certainty, management believes that the ultimate outcome of such matters will not have a material effect on the Company's financial condition or results of operations.
Item 4: Mine Safety Disclosures
Not applicable.
63
Item 5: Market for the Registrant's Common Equity, Related Stockholder Matters and Issuer Purchases of Equity Securities
Market Information.
Our common stock is listed on the NASDAQ Global Market under the symbol "WRES".
The following table sets forth, for the period indicated, the high and low sales prices for our common stock as reported by the NASDAQ Global Market:
| |
Common Stock Price |
||||||
|---|---|---|---|---|---|---|---|
| |
High | Low | |||||
Year Ended December 31, 2014 |
|||||||
First Quarter |
$ | 5.27 | $ | 3.04 | |||
Second Quarter |
6.24 | 4.31 | |||||
Third Quarter |
7.02 | 5.19 | |||||
Fourth Quarter |
5.38 | 1.20 | |||||
Year Ended December 31, 2013 |
|||||||
First Quarter |
$ | 3.35 | $ | 2.56 | |||
Second Quarter |
3.25 | 2.46 | |||||
Third Quarter |
3.08 | 2.58 | |||||
Fourth Quarter |
3.47 | 2.84 | |||||
On March 10, 2015, the closing sales price for our common stock as reported by the NASDAQ Global Market was $1.01 per share.
Holders
As of March 10, 2015 there were approximately 1,800 holders of our common stock.
Dividend Policy
We have never paid or declared any cash dividends on our common stock. Dividends are also restricted under the terms of our Credit Facility and the indenture governing our Senior Notes. We currently intend to retain earnings, if any, to finance the growth and development of our business and we do not expect to pay any cash dividends on our common stock in the foreseeable future.
Stockholder Return Performance Presentation
The following common stock performance graph shows the performance of Warren Resources common stock through December 31, 2014. As required by applicable rules of the SEC, the performance graph shown below was prepared based on the following assumptions:
- •
- A $100 investment was made in Warren common stock and each index on December 31, 2009.
- •
- All dividends were reinvested at the average of the closing stock prices at the beginning and end of the quarter.
The indices in the performance graph compares the performance of the Company's common stock to the S&P 500 Index, and to the Dow Jones U.S. Oil & Gas Index for each year since December 31, 2009, which is a composite index consisting of 84 U.S. oil and gas companies that includes integrated major oil and gas companies as well as smaller independent U.S. companies, and a peer group index comprised of 8 United States companies engaged in oil and natural gas operations whose stocks were traded on the NASDAQ or the NYSE during the period from December 31, 2009 through
64
December 31, 2014. The companies that comprise the peer group are Abraxas Petroleum Corporation, Callon Petroleum Corp., Gastar Exploration, Goodrich Petroleum Corporation, Panhandle Royalty Company., PDC Energy Corp., PetroQuest Energy, Inc., and Resolute Energy Corporation, which companies have market capitalizations similar to Warren and are primarily involved in domestic U.S. exploration and production.
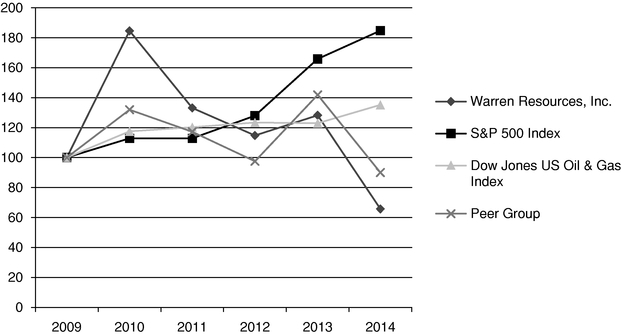
Fiscal Year Ended December 31
(in US Dollars)
| |
2009 | 2010 | 2011 | 2012 | 2013 | 2014 | |||||||||||||
|---|---|---|---|---|---|---|---|---|---|---|---|---|---|---|---|---|---|---|---|
Warren Resources, Inc. |
100 | 184.49 | 133.06 | 114.69 | 128.16 | 65.71 | |||||||||||||
S&P 500 Index |
100 | 112.80 | 112.78 | 127.90 | 165.76 | 184.64 | |||||||||||||
Dow Jones US Oil & Gas Index |
100 | 117.46 | 120.19 | 123.33 | 122.86 | 135.11 | |||||||||||||
Peer Group |
100 | 131.88 | 117.15 | 97.48 | 141.76 | 89.96 | |||||||||||||
Data Provided by S&P's Institutional Market Services and Dow Jones & Company, Inc.
The information in this Form 10-K appearing under the heading "Stockholder Return Performance Presentation" is being "furnished" pursuant to Item 2.01 (e) of Regulation S-K under the Securities Act and shall not be deemed to be "soliciting material" or "filed" with the SEC or subject to Regulation 14A or 14C, other than as provided in Item 2.01 (e) of Regulation S-K, or to the liabilities of Section 18 of the Exchange Act
Securities Authorized for Issuance Under Compensation Plans
The table below includes information about our equity compensation plans as of December 31, 2014, each of which has been approved by our stockholders:
| |
Number of Shares Authorized for Issuance under plan |
Number of securities to be issued upon exercise of outstanding options and restricted stock |
Weighted-average exercise price of outstanding options and restricted stock |
Number of securities remaining available for future issuance under equity compensation plans |
|||||||||
|---|---|---|---|---|---|---|---|---|---|---|---|---|---|
2000 Equity Incentive Plan |
1,975,000 | 64,100 | $ | 2.42 | — | ||||||||
2010 Stock Incentive Plan |
6,950,000 | 2,612,429 | $ | 4.02 | 3,135,085 | ||||||||
| | | | | | | | | | | | | | |
Total |
8,925,000 | 2,676,529 | $ | 3.99 | 3,135,085 | ||||||||
65
Item 6: Selected Consolidated Financial Data
The following tables present selected financial and operating data for Warren and its subsidiaries as of and for the periods indicated. You should read the following selected data along with "Item 7:—Management's Discussion and Analysis of Financial Condition and Results of Operations," our financial statements and the related notes and other information included in this annual report on Form 10-K. The selected financial data as of December 31, 2014, 2013, 2012, 2011, and 2010 has been derived from our financial statements, which were audited by Grant Thornton LLP, independent auditors, and were prepared in accordance with accounting principles generally accepted in the United States of America. The historical results presented below are not necessarily indicative of the results to be expected for any future period.
| |
Year ended December 31, | |||||||||||||||
|---|---|---|---|---|---|---|---|---|---|---|---|---|---|---|---|---|
| |
2014 | 2013 | 2012 | 2011 | 2010 | |||||||||||
| |
(in thousands, except share and per share data) |
|||||||||||||||
Consolidated Statement of Operations Data: |
||||||||||||||||
Revenues: |
||||||||||||||||
Oil & gas sales |
$ | 145,385 | $ | 127,925 | $ | 121,797 | $ | 103, 371 | $ | 88,275 | ||||||
Transportation revenue |
5,338 | 919 | — | — | — | |||||||||||
| | | | | | | | | | | | | | | | | |
Total revenues |
150,723 | 128,844 | 121,797 | 103,371 | 88,275 | |||||||||||
| | | | | | | | | | | | | | | | | |
Lease operating expenses and taxes |
48,357 | 36,779 | 33,072 | 30,637 | 28,845 | |||||||||||
Depreciation, depletion and amortization |
56,489 | 44,806 | 47,172 | 30,517 | 21,993 | |||||||||||
Transportation expense |
2,403 | 311 | — | — | — | |||||||||||
Acquisition expense |
4,198 | — | — | — | — | |||||||||||
General and administrative |
15,271 | 15,389 | 19,844 | 14,819 | 15,358 | |||||||||||
| | | | | | | | | | | | | | | | | |
Total costs and operating expenses |
126,718 | 97,285 | 100,088 | 75,973 | 66,196 | |||||||||||
| | | | | | | | | | | | | | | | | |
Income from operations |
24,005 | 31,559 | 21,709 | 27,398 | 22,079 | |||||||||||
Other income and expense: |
||||||||||||||||
Interest and other income |
2,396 | 5,362 | 90 | 77 | 247 | |||||||||||
Interest expense |
(9,643 | ) | (2,995 | ) | (3,311 | ) | (3,188 | ) | (3,500 | ) | ||||||
Gain (loss) on derivatives |
7,445 | (3,477 | ) | (2,975 | ) | (2,726 | ) | 1,528 | ||||||||
Loss on contingent consideration |
(190 | ) | — | — | — | — | ||||||||||
| | | | | | | | | | | | | | | | | |
Total other income (expense) |
8 | (1,110 | ) | (6,196 | ) | (5,837 | ) | (1,725 | ) | |||||||
Income before income taxes |
24,013 | 30,449 | 15,513 | 21,561 | 20,354 | |||||||||||
Income tax (benefit) expense |
(17 | ) | 64 | (7 | ) | (78 | ) | (29 | ) | |||||||
| | | | | | | | | | | | | | | | | |
Net income before dividends and accretion |
24,030 | 30,385 | 15,520 | 21,639 | 20,383 | |||||||||||
Preferred dividends and accretion |
10 | 10 | 10 | 10 | 18 | |||||||||||
| | | | | | | | | | | | | | | | | |
Net income applicable to common stockholders |
$ | 24,020 | $ | 30,375 | $ | 15,510 | $ | 21,629 | $ | 20,365 | ||||||
| | | | | | | | | | | | | | | | | |
| | | | | | | | | | | | | | | | | |
| | | | | | | | | | | | | | | | | |
Earnings per share—Basic |
$ | 0.31 | $ | 0.42 | $ | 0.22 | $ | 0.31 | $ | 0.29 | ||||||
Earnings per share—Diluted |
$ | 0.31 | $ | 0.42 | $ | 0.22 | $ | 0.30 | $ | 0.29 | ||||||
Weighted average shares outstanding—Basic |
76,541,400 | 72,390,584 | 71,376,046 | 70,830,855 | 70,382,517 | |||||||||||
Weighted average shares outstanding—Diluted |
76,685,511 | 72,546,209 | 72,096,672 | 72,047,488 | 71,429,110 | |||||||||||
Consolidated Statement of Cash Flows Data: |
||||||||||||||||
Net cash provided by (used in): |
||||||||||||||||
Operating activities |
$ | 84,005 | $ | 79,353 | $ | 66,837 | $ | 46,756 | $ | 45,321 | ||||||
Investing activities |
(415,305 | ) | (71,842 | ) | (79,657 | ) | (64,176 | ) | (29,082 | ) | ||||||
Financing activities |
321,383 | (4,366 | ) | 10,681 | 16,942 | (22,385 | ) | |||||||||
66
| |
As of December 31, | |||||||||||||||
|---|---|---|---|---|---|---|---|---|---|---|---|---|---|---|---|---|
| |
2014 | 2013 | 2012 | 2011 | 2010 | |||||||||||
Consolidated Balance Sheet Data: |
||||||||||||||||
Cash and cash equivalents |
$ | 1,703 | $ | 11,620 | $ | 8,475 | $ | 10,614 | $ | 11,092 | ||||||
Total assets |
818,680 | 394,805 | 352,744 | 323,632 | 272,596 | |||||||||||
Total long-term liabilities (including current maturities) |
468,739 | 126,021 | 130,039 | 110,327 | 87,883 | |||||||||||
Stockholders' equity |
292,552 | 226,093 | 193,042 | 174,091 | 150,674 | |||||||||||
Item 7: Management's Discussion and Analysis of Financial Condition and Results of Operations
The discussion and analysis that follows should be read together with the "Selected Consolidated Financial Data" and the accompanying financial statements and notes related thereto that are included elsewhere in this annual report on Form 10-K. It includes forward-looking statements that may reflect our estimates, beliefs, plans and expected performance. The forward-looking statements are based upon events, risks and uncertainties that may be outside our control. Our actual results could differ significantly from those discussed in these forward- looking statements. Factors that could cause or contribute to these differences include but are not limited to, market prices for natural gas and oil, regulatory changes, estimates of proved reserves, economic conditions, competitive conditions, development success rates, capital expenditures and other uncertainties, as well as those factors discussed below and elsewhere in this annual report on Form 10-K, including in "Risk Factors" and "Cautionary Note Regarding Forward-Looking Statements", all of which are difficult to predict. As a result of these assumptions, risks and uncertainties, the forward-looking matters discussed may not occur.
Overview
We are an independent energy company engaged in the exploration and development of domestic onshore oil and natural gas reserves. We focus our efforts primarily on the development of our waterflood oil recovery properties in the Wilmington field within the Los Angeles Basin of California, our recently acquired position in the Marcellus Shale in northeastern Pennsylvania and our coalbed methane, or CBM, natural gas properties located in the Rocky Mountain region.
As of December 31, 2014, we owned natural gas and oil leasehold interests in approximately 113,307 gross (84,240 net) acres, approximately 70% of which were undeveloped. Substantially all our undeveloped acreage is located in the Rocky Mountains. Our total estimated net proved reserves are located on approximately 30% of our net acreage.
Liquidity and Capital Resources
Our cash and cash equivalents decreased $9.9 million during 2014 to $1.7 million at December 31, 2014. This resulted from cash provided by operating activities and financing activities of $84.0 million and $321.4 million respectively offset by cash used in investing activities of $415.3 million.
Cash provided by operating activities was primarily generated by oil and gas operations. Cash used in investing activities primarily represents the acquisition of our Marcellus acreage and development of our oil and gas assets. Cash provided by financing activities primarily represented net proceeds from our private offering of high yield notes during the year.
67
On August 11, 2014, the Company entered into a five-year Third Amended and Restated Credit Agreement with Bank of Montreal, as Administrative Agent (the "Agent"), and various other lenders named therein (the "Credit Facility"). The Credit Facility provides for a revolving credit facility up to the least of: (i) $750 million, (ii) the Borrowing Base, or (iii) the Draw Limit requested by the Company. The Credit Facility matures on August 11, 2019, is guaranteed by Warren Resources of California, Inc., Warren Marcellus LLC and Warren E&P, Inc. (collectively, the "Guarantors") and is secured by substantially all of the oil and gas assets of the Company and the Guarantors. In August 2014, the borrowing base was $225 million. The borrowing base is subject to semi-annual redeterminations in April and October of each year in accordance with the lenders' customary procedures and practices. In addition, the borrowing base may be redetermined in connection with the occurrence of specified events and both the Company and the Agent (or the Agent at the request of the required lenders) have the right to request one additional redetermination between each scheduled borrowing base redetermination.
The recent decline in oil and gas prices has resulted in banks reducing the price decks upon which borrowing bases are set. Our current borrowing base was set using a price deck higher than the current price deck used by the lending institutions in our syndicate. Therefore, it is likely that our borrowing base will be reduced, perhaps significantly, in the regular semi-annual redetermination upcoming at the end of March 2015.
The Company is subject to various covenants required by the Credit Facility, including the maintenance of the following financial ratios: (1) a minimum current ratio of not less than 1.0 to 1.0 (including the unused borrowing base and excluding unrealized gains and losses on derivative financial instruments), and (2) a minimum annualized consolidated EBITDAX (as defined in the Credit Facility) to net interest expense of not less than 2.5 to 1.0. Our ability to comply with some of these covenants may be affected by events beyond our control. If market or other economic conditions deteriorate, our ability to comply with these covenants may be impaired. For example, continuation of low oil and gas prices or their further deterioration could significantly reduce cash flow, which is critical to these covenants.
Depending on the level of borrowing base usage, the annual interest rate on each loan under the Credit Facility will be, at the Company's option, either: (a) a "LIBOR Loan", which has an interest rate equal to the sum of the LIBOR rate plus the applicable "LIBOR Margin" that ranges from 1.75% to 2.75%, or (b) a "Base Rate Loan", which has an interest rate equal to the sum of the "Base Rate", calculated to be the highest of: (i) the Agent's prime rate of interest announced from time to time; (ii) the Federal Funds rate most recently determined by the Agent plus 0.50%; or (iii) the one month LIBOR rate plus 1.00%, plus an applicable "Base Rate Margin" that ranges from 0.75% to 1.75%. As of December 31, 2014, the Company had borrowed $134.7 million under the Credit Facility and was in compliance with all covenants. If the Company fails to satisfy its Credit Facility covenants, it would be an event of default. Under such event of default and upon notice, all borrowings would become immediately due and payable to the lenders. During 2014, the Company incurred $2.8 million of interest expense under the Credit Facility of which approximately $0.2 million was accrued as of December 31, 2014. The weighted average interest rate as of December 31, 2014, was 2.4%.
If the Credit Facility's borrowing base is reduced to a level below current borrowings and upon notice from the Agent of such deficiency, the Company would be obligated to either: (i) reduce the deficiency by 100% within 30 days; (ii) reduce the deficiency by 25% on the 90th, 120th, 150th and 180th day after receipt of such notice, or (iii) provide the Agent with additional security in an amount to eliminate such deficiency.
On August 11, 2014, the Company issued $300.0 million of 9.000% senior notes in a private offering at a price equal to 98.617% due to mature on August 1, 2022 (the "Senior Notes"). Interest is
68
payable on the Senior Notes semi-annually in arrears at a rate of 9.000% per annum on each February 1 and August 1.
During 2014, the Company had net income of $24.0 million (including a $7.4 million gain on derivative financial instruments). This compares to 2013 when the Company had net income of $30.4 million (including a $3.5 million loss on derivative financial instruments) and a net income of $15.5 million in 2012 (including a $3.0 million loss on derivative financial instruments). At December 31, 2014, current assets were approximately $30.7 million less than current liabilities. As of March 10, 2015, the Company has a borrowing base of $225 million and $153.7 million outstanding under the Credit Facility.
The Company's proved reserves increased as of December 31, 2014 compared to prior years. The 2014 increase was primarily due to the acquisition of acreage in the Marcellus Shale in Pennsylvania. Our oil operations include a secondary recovery waterflood with significant fixed costs. During 2014, our oil lease operating expenses were $24.61 per barrel of oil produced. Our natural gas operations include reinjecting the produced water into deep formations and compressing and transporting the gas with significant fixed costs. During 2014, our natural gas lease operating expenses were $2.10 per Mcf of gas produced. The Company's estimated proved reserves are based on assumptions that may prove to be inaccurate. The Company's estimated proved reserves for the periods indicated are listed below.
| |
Years Ended December 31, | |||||||||
|---|---|---|---|---|---|---|---|---|---|---|
| |
2014 | 2013 | 2012 | |||||||
Estimated Proved Oil and Natural Gas Reserves: |
||||||||||
Net oil reserves (MBbls) |
16,794 | 16,074 | 16,380 | |||||||
Net natural gas reserves (MMcf) |
327,328 | 106,028 | 51,236 | |||||||
| | | | | | | | | | | |
Total Net Proved Oil and Natural Gas Reserves (MBoe) |
71,349 | 33,745 | 24,919 | |||||||
| | | | | | | | | | | |
| | | | | | | | | | | |
| | | | | | | | | | | |
Estimated Present Value of Net Proved Reserves: |
||||||||||
PV-10 Value (in thousands) |
||||||||||
Proved developed |
$ | 460,059 | $ | 379,310 | $ | 337,786 | ||||
Proved undeveloped |
149,067 | 124,396 | 157,127 | |||||||
| | | | | | | | | | | |
Total |
609,126 | 503,706 | 494,913 | |||||||
Less: future income taxes, discounted at 10% |
54,059 | 28,705 | 35,033 | |||||||
| | | | | | | | | | | |
Standardized measure of discounted future net cash flows (in thousands) |
$ | 555,067 | $ | 475,001 | $ | 459,880 | ||||
| | | | | | | | | | | |
| | | | | | | | | | | |
| | | | | | | | | | | |
Prices Used in Calculating Reserves: |
||||||||||
Oil (per Bbl) |
$ | 86.71 | $ | 97.33 | $ | 104.27 | ||||
Natural Gas (per Mcf) |
$ | 3.22 | $ | 3.43 | $ | 2.51 | ||||
Proved Developed Reserves (MBoe) |
42,439 | 21,518 | 16,603 | |||||||
2014 and 2015 Capital Expenditure Program
During 2014, we invested $108.7 million in our capital expenditure program. The Company drilled 36 wells in California (24 producers and 12 injectors). The cost associated with the new oil wells in California was $64.5 million and the facility and lease costs were $8.6 million. The costs associated with drilling 31 coalbed methane wells in Wyoming was $27.9 million. The remaining expenditures were invested in the Marcellus asset and the Leroy Pines project in California.
The Company forecasts a 2015 capital expenditure budget of $21 million, consisting of $8 million for California facilities and $13 million for drilling two upper Marcellus wells in Pennsylvania. Due to low commodity prices this capital expenditure budget does not provide for drilling activity in California
69
or Wyoming in 2015. The amount and allocation of budgeted capital expenditures excludes capital expenditures for acquisitions. The Company intends to fund 2015 capital expenditures with cash flows from operations.
See "Item 1A: Risk Factors" for risks and factors which could have a material adverse effect on our business, financial condition and results of operations.
Stock Based Equity Compensation Plan Information
At December 31, 2014, we had approximately 0.4 million vested outstanding stock options issued under our stock based equity compensation plans. Of the total 0.4 million outstanding vested options, zero had exercise prices below the closing market price of our common stock on December 31, 2014 of $1.61.
For additional detail about our stock based equity compensation plans, see "Executive Compensation—Employee Benefit Plans" under Item 11 and as incorporated by reference from our Proxy Statement on Schedule 14A to be filed within 120 days after the end of our fiscal year ended December 31, 2014.
Critical Accounting Estimates
The discussion and analysis of our financial condition and results of operations are based upon the consolidated financial statements, which have been prepared in accordance with accounting principles generally accepted in the United States. The preparation of these financial statements requires us to make estimates and assumptions that affect the reported amounts of assets, liabilities, revenues and expenses, and related disclosure of contingent assets and liabilities. Certain accounting policies involve judgments and uncertainties to such an extent that there is reasonable likelihood that materially different amounts could have been reported under different conditions, or if different assumptions had been used. We evaluate our estimates and assumptions on a regular basis. We base our estimates on historical experience and various other assumptions that are believed to be reasonable under the circumstances, the results of which form the basis for making judgments about the carrying values of assets and liabilities that are not readily apparent from other sources. Actual results may differ from these estimates and assumptions used in preparation of our consolidated financial statements. Below, we provide expanded discussion of our more significant accounting policies, estimates and judgments. We believe these accounting policies reflect our more significant estimates and assumptions used in preparation of our consolidated financial statements. See Notes to the Consolidated Financial Statements for a discussion of additional accounting policies and estimates made by management.
Oil and Gas Producing Activities
We account for our oil and gas activities using the full cost method. As prescribed by full cost accounting rules, all costs associated with property acquisition, exploration and development activities are capitalized. Exploration and development costs include dry hole costs, geological and geophysical costs, direct overhead related to exploration and development activities and other costs incurred for the purpose of finding oil and gas reserves. Salaries and benefits paid to employees directly involved in the exploration and development of oil and gas properties as well as other internal costs that can be specifically identified with acquisition, exploration and development activities are also capitalized. Proceeds received from disposals are credited against accumulated cost except when the sale represents a significant disposal of reserves, in which case a gain or loss is recognized. The sum of net capitalized costs and estimated future development and dismantlement costs are depleted on the equivalent unit-of-production method, based on proved oil and gas reserves as determined by independent petroleum engineers.
70
In accordance with full cost accounting rules, Warren is subject to a limitation on capitalized costs. The capitalized cost of oil and gas properties, net of accumulated depreciation, depletion and amortization, may not exceed the estimated future net cash flows from proved oil and gas reserves discounted at 10 percent, plus the cost of unproved properties excluded from amortization, as adjusted for related tax effects. If capitalized costs exceed this limit (the "ceiling limitation"), the excess must be charged to expense. There was no impairment charge in 2014, 2013 and 2012.
The costs of certain unevaluated oil and gas properties and exploratory wells being drilled are not included in the costs subject to amortization. Warren assesses costs not being amortized for possible impairments or reductions in value and if impairments or a reduction in value has occurred, the portion of the carrying cost in excess of the current value is transferred to costs subject to amortization.
Our estimate of proved reserves is based on the quantities of oil and gas that engineering and geological analysis demonstrate, with reasonable certainty, to be recoverable from established reservoirs in the future under current operating and economic parameters. Reserves and their relation to estimated future net cash flows impact our depletion and impairment calculations. As a result, adjustments to depletion and impairment are made concurrently with changes to reserve estimates. Our reserve estimates and the projected cash flows are derived from these reserve estimates, in accordance with SEC guidelines by an independent engineering firm based in part on data provided by us. The accuracy of our reserve estimates depends in part on the quality and quantity of available data, the interpretation of that data, the accuracy of various mandated economic assumptions, and the judgments of the individuals preparing the estimates.
Revenue Recognition
Oil and gas sales result from undivided interests held by us in various oil and gas properties. Sales of natural gas and oil produced are recognized when delivered to or picked up by the purchaser. Warren accrues for revenue based on estimated pricing and production.
Recent Accounting Pronouncements
In May 2014, the FASB issued Accounting Standards Update No. 2014-09, Revenue from Contracts with Customers ("ASU 2014-09"). The objective of ASU 2014-09 is to clarify the principles for recognizing revenue and to develop a common revenue standard for U.S. GAAP and International Financial Reporting Standards. ASU 2014-09 is effective for fiscal years, and interim periods within those years, beginning after December 15, 2016. The Company is currently evaluating the impact of adopting ASU 2014-09, but the standard is not expected to have a significant effect on its consolidated financial statements.
In August 2014, the FABS issued ASU No. 2014-15, Disclosure of Uncertainties about an Entity's Ability to Continue as a Going Concern ("ASU 2014-15"). ASU 2014-15 will explicitly require management to assess an entity's ability to continue as a going concern, and to provide related footnote disclosure in certain circumstances. The new standard will be effective for all entities in the first annual period ending after December 15, 2016. Earlier adoption is permitted. We are currently evaluating the impact of the adoption of ASU 2014-15.
Results of Operations
Year Ended December 31, 2014 Compared to the Year Ended December 31, 2013
Oil and gas sales. Revenue from oil and gas sales increased $17.5 million during 2014 to $145.4 million, a 14% increase compared to 2013. This increase primarily resulted from an increase in gas production from our Marcellus Assets. Net gas production for 2014 and 2013 was 16.1 Bcf and 6.2 Bcf, respectively. The average realized price per Mcf of gas for 2014 and 2013 was $3.06 and $3.31,
71
respectively. Net oil production for 2014 and 2013 was 1.1 MMbbls and 1.1 MMbbls, respectively. Additionally, the average realized price per barrel of oil for 2014 and 2013 was $86.02 and $97.12, respectively.
Transportation Revenue. We receive fees for transporting third-party gas through our Atlantic Rim intrastate gas pipeline, which connects with the Wyoming interstate Company ("WIC") pipeline system. Commencing in November 2013, we changed the point of sale for our Atlantic Rim gas, which allows us to recognize revenue for the transportation fee we charge. Transportation and gathering revenue totaled $5.3 million and $0.9 million respectively for 2014 and for the months of November and December in 2013.
Lease operating expense. Lease operating expense increased 31% to $48.4 million ($12.73 per boe) for 2014 compared to $36.8 million ($17.16 per boe) in 2013. Primarily this reflects an increase in operating expense resulting from our Marcellus Assets.
Depreciation, depletion and amortization. Depreciation, depletion and amortization expense increased $11.7 million for 2014 to $56.5 million, a 26% increase compared to 2013. This increase is driven by an increase to our full cost pool as a result of the acquisition of the Marcellus Assets during the third quarter of 2014.
Transportation Expense. Commencing in November 2013, we changed the point of sale for our Atlantic Rim gas which allows us to recognize revenue and the associated expense of operating our pipeline. Pipeline operating expenses totaled $2.4 million and $0.3, respectively, for 2014 and for the months of November and December in 2013.
Acquisition expenses. Acquisition expenses totaled $4.2 million for 2014 which resulted from the purchase of the Marcellus Assets during the third quarter of 2014.
General and administrative expenses. General and administrative expenses decreased $0.1 million in 2014 to $15.3 million, a 1% decrease compared to 2013. This decrease reflects lower salary, bonus and stock option expense in 2014 compared to 2013, as several higher paid individuals departed the Company during the year.
Interest expense. Interest expense increased to $9.6 million in 2014 compared to $3.0 million in 2013. The increase results from the issuance of $300 million of 9% senior notes in August 2014 to partially fund the acquisition of our Marcellus Assets.
Interest and other income. Interest and other income decreased $3.0 million in 2014 to $2.4 million. This decrease primarily resulted from an adjustment made in 2013 relating to post-production costs being charged to royalty owners in the Wilmington Townlot Unit in California.
Gain (loss) on derivative financial instruments. Derivative gains of $7.4 million were recorded during 2014. This amount reflects $34,000 of realized losses and $7.5 million of unrealized gains resulting from mark to market accounting of our oil and gas swaps.
Loss on contingent consideration. A $0.2 million loss from the contingent consideration related to the acquisition of our Marcellus Assets. This amount reflects the fair value adjustment for the contingent consideration payment as part of the purchase and sale agreement with Citrus.
Income taxes. We recognize a deferred tax liability or asset for temporary differences, operating loss carryforwards, statutory depletion carryforwards and tax credit carryforwards net of a valuation allowance. The temporary differences consist primarily of depreciation, depletion and amortization of intangible and tangible drilling costs and unrealized gains on investments.
72
As of December 31, 2014, we had a net operating loss carryforward for federal income tax purposes of approximately $236 million. Also as of December 31, 2014, we have provided a 100% valuation allowance on our net deferred tax assets. Our net operating loss carryforwards are estimated to begin to expire in 2019.
Results of Operations
Year Ended December 31, 2013 Compared to the Year Ended December 31, 2012
Oil and gas sales. Revenue from oil and gas sales increased $6.1 million during 2013 to $127.9 million, a 5% increase compared to 2012. This increase primarily resulted from an increase in gas production and an increase in realized gas prices. Net gas production for 2013 and 2012 was 6.2 Bcf and 5.5 Bcf, respectively. The average realized price per Mcf of gas for 2013 and 2012 was $3.31 and $2.78, respectively. Net oil production for 2013 and 2012 was 1.1 MMbbls and 1.1 MMbbls, respectively. Additionally, the average realized price per barrel of oil for 2013 and 2012 was $97.12 and $96.02, respectively.
Transportation Revenue. We receive fees for transporting third-party gas through our Atlantic Rim intrastate gas pipeline, which connects with the Wyoming interstate Company ("WIC") pipeline system. Commencing in November 2013, we changed the point of sale for our Atlantic Rim gas, which allows us to recognize revenue for the transportation fee we charge. Transportation and gathering revenue totaled $0.9 million for the months November and December 2013.
Lease operating expense. Lease operating expense increased 11% to $36.8 million ($17.16 per boe) for 2013 compared to $33.1 million ($16.31 per boe) in 2012. Primarily this reflects an increase in oil operating expense resulting from significantly more work over charges in 2013 compared with 2012.
Depreciation, depletion and amortization. Depreciation, depletion and amortization expense decreased $2.4 million for 2013 to $44.8 million, a 5% decrease compared to 2012. This decrease reflects an increase in estimated proved reserves at year end, which resulted in the calculation of a lower overall depletion rate for 2013 compared to 2012.
Transportation Expense. Commencing in November 2013, we changed the point of sale for our Atlantic Rim gas which allows us to recognize revenue and the associated expense of operating our pipeline. Pipeline operating expenses totaled $0.3 million for November and December 2013.
General and administrative expenses. General and administrative expenses decreased $4.5 million in 2013 to $15.4 million, a 22% decrease compared to 2012. This decrease reflects lower salary, bonus and stock option expense in 2013 compared to 2012, as several higher paid individuals departed the Company during the year.
Interest expense. Interest expense decreased 10% to $3.0 million in 2013 compared to 2012. The increase results from generally lower borrowings under our Credit Facility during 2013 compared to 2012.
Interest and other income. Interest and other income increased $5.3 million in 2013 to $5.4 million. This resulted from a nonrecurring retroactive adjustment relating to certain post-production costs being charged to royalty owners in the Wilmington Townlot Unit field.
Gain (loss) on derivative financial instruments. Derivative losses of $3.5 million were recorded during 2013. This amount reflects $1.4 million of realized losses and $2.1 million of unrealized losses resulting from mark to market accounting of our oil and gas swaps.
Income taxes. We recognize a deferred tax liability or asset for temporary differences, operating loss carryforwards, statutory depletion carryforwards and tax credit carryforwards net of a valuation
73
allowance. The temporary differences consist primarily of depreciation, depletion and amortization of intangible and tangible drilling costs and unrealized gains on investments.
As of December 31, 2013, we had a net operating loss carryforward for federal income tax purposes of approximately $245 million. Also as of December 31, 2013, we have provided a 100% valuation allowance on our net deferred tax assets. Our net operating loss carryforwards are estimated to begin to expire in 2019.
Debentures
As of December 31, 2014 , we had outstanding $1.6 million of convertible secured debentures that are convertible into our common shares. Further, all convertible secured debentures are callable by us if the average bid price of our public traded common shares traded at 133% or greater of the respective conversion price of the debentures for at least 90 consecutive trading days. In such an event, debentures not converted may be called by us upon 60 days notice at a price of 100% of par value plus accrued interest.
The principal of the convertible secured debentures is secured at maturity by zero coupon U.S. treasury bonds previously deposited into an escrow account equaling the par value of the debentures maturing on or before the due date of the debentures. The fair market value of these securities at December 31, 2014 was approximately $1.42 million.
The table below reflects the outstanding convertible secured debentures by issue, the fair market value of the zero coupon U.S. treasury bonds held in escrow on behalf of the debentures holders and the estimated cash outlay for the payment of debenture interest for 2014. The conversion prices listed below will remain to the maturities of the bonds.
Debentures
|
Outstanding at December 31, 2014 |
Conversion Price as of December 31, 2014 |
Fair Market Value of U.S. Treasuries |
Estimated Debenture Interest for 2015 |
|||||||||
|---|---|---|---|---|---|---|---|---|---|---|---|---|---|
| |
(in thousands, except conversion price data) |
||||||||||||
12% Convertible secured Debentures due December 31, 2020 |
$ | 835 | $ | 50.00 | $ | 746 | $ | 100 | |||||
12% Convertible secured Debentures due December 31, 2022 |
801 | $ | 50.00 | 676 | 96 | ||||||||
| | | | | | | | | | | | | | |
|
$ | 1,636 | $ | 1,422 | $ | 196 | |||||||
| | | | | | | | | | | | | | |
| | | | | | | | | | | | | | |
| | | | | | | | | | | | | | |
9% Senior Notes due 2022
On August 11, 2014, the Company issued $300.0 million of 9.000% senior notes in a private offering at a price equal to 98.617% due to mature on August 1, 2022 (the "Senior Notes"). Interest is payable on the Senior Notes semi-annually in arrears at a rate of 9.000% per annum on each February 1 and August 1, commencing February 1, 2015.
We may redeem, at specified redemption prices, some or all of the Senior Notes at any time on or after August 1, 2017. We may also redeem up to 35% of the Senior Notes using the proceeds of certain equity offerings completed before August 1, 2017. If we sell certain of our assets or experience certain kinds of changes in control, we may be required to offer to purchase the Senior Notes from the holders. The Senior Notes are fully, unconditionally and jointly and severally guaranteed on a senior unsecured basis by certain of our existing subsidiaries and will be fully, unconditionally and jointly and severally guaranteed on a senior unsecured basis by our future domestic subsidiaries, subject to certain exceptions.
74
The table below reflects the outstanding Senior Notes, the fair market value of the Notes and the estimated cash outlay for the payment of interest for 2015. There have been no equity offerings since the issuance of the Senior Notes.
9% Senior Notes (in thousands)
|
Outstanding at December 31, 2014 |
Fair Market Value of Senior Notes |
Interest for 2015 | |||||||
|---|---|---|---|---|---|---|---|---|---|---|
9% Senior Notes Due August 1, 2022 |
$ | 300,000 | $ | 195,000 | $ | 27,000 | ||||
Preferred Stock
As of December 31, 2014, we had 10,703 shares of convertible preferred stock issued and outstanding. During 2014, no shares of our convertible preferred stock converted into common shares. The preferred stock is convertible into common shares on a 1 to 0.5 basis. Dividends on preferred shares totaled approximately $10,000 and $10,000 for the years ended December 31, 2014 and 2013, respectively.
All of our outstanding preferred stock has a dividend equal to 8% per annum, payable to the extent legally available quarterly in arrears, and has a liquidation preference of $12.00 per share. Any accrued but unpaid dividends shall be cumulative and paid upon liquidation, optional redemption or conditional repurchase. No dividends may be paid on the common stock as long as there are any accrued and unpaid dividends on the preferred stock. At the election of the holder of our convertible preferred stock, each share of preferred stock is convertible into 0.50 share of common stock.
The conversion rate for our convertible preferred stock is subject to adjustment in the event of:
- •
- the issuance of common stock as a dividend or distribution on any class of our capital stock;
- •
- the combination, subdivision or reclassification of the common stock; or
- •
- the distribution to all holders of common stock of evidences of indebtedness or assets, including securities issued by third parties, but excluding cash dividends or distributions paid out of surplus.
The preferred stock may be redeemed by the holders at a redemption price equal to the liquidation value of $12.00 per share, plus accrued but unpaid dividends, if any. At December 31, 2014, there were 10,703 preferred shares outstanding that the Company may be required to redeem.
Upon receipt of a redemption election, we, at our option, shall either:
- •
- pay the holder cash in an amount equal to $12.00 per convertible preferred share, subject to adjustment for stock splits, stock
dividends or stock exchanges, plus accrued and unpaid dividends, to the extent that we have funds legally available for redemption, or
- •
- issue to the holder shares of common stock in an amount equal to 125% of the cash redemption price and any accrued and unpaid dividends, based on the average of the closing sale prices of our common stock for the 30 trading days immediately preceding the date of the receipt of the written redemption election by the holder, as reported by the NASDAQ Stock Market, or by any exchange or electronic OTC listing service on which the shares of common stock are then traded. In the event that we elect to pay the Redemption Price in kind with our common stock, for the 10,703 shares of preferred stock representing $0.1 million of Redemption Price value, notwithstanding the market price of our common stock, we shall not issue to the redeeming preferred stockholders less than their proportionate share of 10,703 shares of our shares of common stock, nor be obligated to issue more than 16,055 shares of our common stock in full
75
satisfaction of the redemption, subject to adjustment for stock splits, stock dividends and stock exchanges.
If we are not listed on an exchange or our common stock has no trading volume, upon redemption the Board shall determine the fair market value of the common stock.
If the closing sale price of our publicly traded common stock as reported by the NASDAQ Stock Market, or any exchange or electronic OTC listing service on which the shares of common stock are then traded, exceeds 133% of the conversion price then in effect for the preferred stock for at least 10 trading days during any 30-day period, we, at our option, may either:
- •
- redeem the preferred stock in whole or in part, at a redemption price of $12.00 per share plus accrued and unpaid dividends, or
- •
- convert the preferred stock, plus any accrued and unpaid dividends, into common stock at the then applicable conversion rate, based on the average closing sale prices of our common stock for the 30 trading days immediately preceding the date fixed for redemption.
In addition, the preferred stock, plus accrued and unpaid dividends, shall be converted into common stock at the then applicable conversion rate upon the vote or written consent of the holders of 662/3% of the then outstanding preferred stock, voting together as a class.
Accordingly, if the holders of any of the outstanding shares of our preferred stock request redemption and thereafter and we elect to pay the Redemption Price for the preferred stock in cash, we would need capital of $12.00 per share, plus the amount of any accrued but unpaid dividends, which funds may not be available and the payment of which could have a material adverse effect on our financial liquidity and results of operation. Alternatively, if we elect to pay the Redemption Price for the preferred stock and thereafter with shares of our common stock, such issuance could materially increase the number of our shares of common stock then outstanding and be dilutive to our earnings per share, if any.
Contractual Obligations
The contractual obligations table below assumes the maximum amount under contract is tendered each year. The table does not give effect to the conversion of any bonds to common stock which would reduce payments due. All U.S treasury bonds are secured at maturity by zero coupon U.S. treasury bonds deposited into an escrow account equaling the par value of the bonds maturing on or before the maturity of the bonds. Such U.S. treasury bonds had a fair market value of $1.42 million at December 31, 2014. The table below does not reflect the release of escrowed U.S. treasury bonds to us upon redemption.
Additional contracts were assumed by the company as a result of the acquisition of our Marcellus Assets, including a Lateral Demand Fee, a Lateral Commodity Fee, and a Transportation Fee. The Lateral Demand Fee stipulates that the company pay $92,000 per month for a period of 35 months (23 months remain on the contract), for gathering services provided in the Marcellus. The Transportation Fee provides that the Company pay a fixed monthly amount of $1,241,000 for transportation of gas through the interstate pipeline, up to 120,000 dekatherms per day for a term ending in December 2021 (84 months remain on the contract). If the Company exceeds the 120,000 dekatherms per day, the agreement states that a monthly fee of $0.34 per dekatherm over the contractually stipulated amount should be paid. The Transportation Overage Fee is not included in the table below. Warren accounts for the aforementioned gathering and transportation fees on the Consolidated Statements of Operations within the lease operating expenses and taxes line item, as incurred.
76
The contracts also call for several additional fees, not included in the table below. The additional fees include a Lateral Commodity Fee of $0.055 per Mcf up to 150 Bcf of gas gathered, Gathering Commodity Rate of $0.04 per Mcf up to 15,000 Mcf per day per month for certain receipt points, a Gathering Demand Rate of $0.10 per Mcf up to 15,000 Mcf per day per month for certain receipt points, and a Compression Fee of $0.205 per MCF of gas delivered to certain receipt points. For any amount in excess of the 15,000 Mcf delivered to certain receipt points for the Gathering Demand and Commodity Rates the company is obligated to pay 50% of the fees which are adjusted for inflation annually by the CPI index.
| |
Payments due by period | |||||||||||||||
|---|---|---|---|---|---|---|---|---|---|---|---|---|---|---|---|---|
Contractual Obligations As of December 31, 2014 |
Total | Less Than 1 Year |
1 - 3 Years |
3 - 5 Years |
More Than 5 Years |
|||||||||||
| |
(in thousands) |
|||||||||||||||
Credit Facility(1) |
$ | 134,749 | $ | — | $ | — | $ | 134,749 | $ | — | ||||||
Bonds(1) |
1,636 | 164 | 280 | 226 | 966 | |||||||||||
Senior Notes(1) |
300,000 | — | — | — | 300,000 | |||||||||||
Drilling Commitments |
4,401 | 4,401 | — | — | — | |||||||||||
Marcellus Lateral Demand Fee |
2,116 | 1,104 | 1,012 | — | — | |||||||||||
Marcellus Transportation Fee |
103,665 | 14,892 | 29,784 | 29,784 | 29,205 | |||||||||||
Leases |
6,659 | 1,020 | 1,889 | 1,868 | 1,882 | |||||||||||
| | | | | | | | | | | | | | | | | |
Total |
$ | 553,226 | $ | 21,581 | $ | 32,965 | $ | 166,627 | $ | 332,053 | ||||||
| | | | | | | | | | | | | | | | | |
| | | | | | | | | | | | | | | | | |
| | | | | | | | | | | | | | | | | |
- (1)
- The amounts included in the table represent the outstanding principal amounts only. Does not include estimated interest of $30.6 million less than one year, $62.1 million 1-3 years, $61.8 million 3-5 years and $70.2 million thereafter, payable with respect to the Credit Facility, the Debentures and the Senior Notes.
Off-Balance Sheet Arrangements
The Company does not have any off-balance sheet arrangements.
Item 7A: Quantitative and Qualitative Disclosures About Market Risk
The primary objective of the following information is to provide forward-looking quantitative and qualitative information about our potential exposure to market risks. The term "market risk" refers to the risk of loss arising from adverse changes in natural gas and oil prices and interest rates. The disclosures are not meant to be precise indicators of expected future losses, but rather indicators of reasonably possible losses. This forward-looking information provides indicators of how we view and manage our ongoing market risk exposures. All of our market risk sensitive instruments were entered into for purposes other than speculative trading.
Commodity Risk
Our primary market risk exposure is in the price we receive for our natural gas and oil production. Realized pricing is primarily driven by the prevailing worldwide price for crude oil and spot regional market prices applicable to our U.S. natural gas production. Pricing for natural gas and oil production has been volatile and unpredictable for several years, and we expect this volatility to continue in the future. The prices we receive for production depend on many factors outside of our control, including volatility in the differences between product prices at sales points and the applicable index price.
We have entered into several commodity derivative contracts to hedge our exposure to commodity price risk associated with anticipated future oil and gas production. We believe we will have more predictability of our crude oil and gas revenues as a result of these derivative contracts.
77
The following table summarizes our open financial derivative positions as of March 10, 2015 related to oil and gas production.
Product
|
Type | Contract Period | Volume | Price per Mcf or Bbl |
||||||
|---|---|---|---|---|---|---|---|---|---|---|
NYMEX Oil |
Swap | 02/01/15 - 09/30/15 | 1,300 Bbl/d | $ | 50.00 | |||||
NYMEX Oil |
Swap | 03/01/15 - 09/30/15 | 400 Bbl/d | $ | 57.07 | |||||
NYMEX Gas |
Swap | 01/01/15 - 12/31/15 | 3,000 MMbtu/d | $ | 4.18 | |||||
NYMEX Gas |
Swap | 01/01/15 - 06/30/15 | 3,000 MMbtu/d | $ | 4.02 | |||||
NYMEX Gas |
Swap | 01/01/15 - 03/31/15 | 20,000 MMbtu/d | $ | 4.54 | |||||
NYMEX Gas |
Swap | 04/01/15 - 10/31/15 | 10,000 MMbtu/d | $ | 3.20 | |||||
NYMEX Gas |
Swap | 04/01/15 - 10/31/15 | 10,000 MMbtu/d | $ | 3.16 | |||||
NYMEX Gas |
Swap | 02/01/15 - 12/31/15 | 15,000 MMbtu/d | $ | 2.94 | |||||
NYMEX Gas |
Swap | 03/01/15 - 06/30/15 | 10,000 MMbtu/d | $ | 2.97 | |||||
NYMEX Gas |
Swap | 04/01/15 - 03/31/16 | 5,000 MMbtu/d | $ | 3.05 | |||||
Under a swap contract, the counterparty is required to make a payment to us if the index price for any settlement period is less than the fixed price, and we are required to make a payment to the counterparty if the index price for any settlement period is greater than the fixed price.
Interest Rate Risk
We hold investments in U.S. treasury bonds available for sale, which represents securities held in escrow accounts on behalf of certain debentures. Occasionally, we hold U.S. treasury bonds trading securities, which predominantly represent U.S. treasury bonds released from escrow accounts. The fair market value of these securities will generally increase if the federal discount rate decreases and decrease if the federal discount rate increases. All of our convertible debt has fixed interest rates, so consequently we are not exposed to cash flow or fair value risk from market interest rate changes on this debt.
At December 31, 2014, we had debt outstanding under our Credit Facility of $134.7 million. Depending on the current level of borrowing base usage, the annual interest rate on each borrowing under the Credit Facility will be at our option either: (a) a "LIBOR Loan", which has an interest rate equal to the sum of the LIBOR rate plus the applicable "LIBOR Margin" that ranges from 1.75% to 2.75%, or (b) a "Base Rate Loan", which has an interest rate equal to the sum of the "Base Rate", calculated to be the highest of: (i) the Agent's prime rate of interest announced from time to time; (ii) the Federal Funds rate most recently determined by the Agent plus 0.50%; or (iii) the one month LIBOR rate plus 1.00%, plus an applicable "Base Rate Margin" that ranges from 0.75% to 1.75%. During 2014, the Company incurred $2.8 million of interest under the Credit Facility of which approximately $0.2 million of interest was accrued at December 31, 2014. At December 31, 2014, the weighted average interest rate on our Credit Line was 2.4%. A 1% increase in this rate would result in annual additional interest of $1.3 million.
Financial Instruments
Our financial instruments consist of cash and cash equivalents, U.S. treasury bonds, collateral security accounts, derivatives and other long-term liabilities. The carrying amounts of cash and cash equivalents and U.S. treasury bonds approximate fair market value due to the highly liquid nature of these short-term instruments or they are reported at fair value. Debentures, derivatives, other long-term liabilities and the Credit Facility are recorded at the approximate fair value of such items.
78
Inflation and Changes in Prices
The general level of inflation affects our costs. Salaries and other general and administrative expenses are impacted by inflationary trends and the supply and demand of qualified professionals and professional services. Inflation and price fluctuations affect the costs associated with exploring for and producing natural gas and oil, which have a material impact on our financial performance.
Item 8: Financial Statements and Supplementary Data
See Report of Independent Registered Public Accounting Firm and Audited Financial Statements at Item 15.
Item 9: Changes in and Disagreements with Accountants on Accounting and Financial Disclosure
None.
Item 9A: Controls and Procedures
Disclosure Controls and Procedures.
We maintain controls and procedures designed to ensure that information required to be disclosed in the reports that we file or submit under the Securities Exchange Act of 1934 is recorded, processed, summarized and reported within the time periods specified in the rules and forms of the SEC. Evaluations have been performed under the supervision and with the participation of our management, including the Interim Chief Executive Officer and Chief Financial Officer, of the effectiveness of the design and operation of our disclosure controls and procedures (as such terms are defined in Rule 13a-15(e) and 15d-15(e) of the Exchange Act). Based upon those evaluations, management, including the Interim Chief Executive Officer and Chief Financial Officer, concluded that our disclosure controls and procedures were adequate and effective as of December 31, 2014 to provide reasonable assurance that information required to be disclosed by us in the reports that we file or submit under the Exchange Act are recorded, processed, summarized and reported, within the time periods specified in the SEC's rules and forms.
Our management does not expect that our disclosure controls and procedures will prevent all errors and all fraud. The design of a control system must reflect the fact that there are resource constraints, and the benefits of controls must be considered relative to their costs. Based on the inherent limitations in all control systems, no evaluation of controls can provide absolute assurance that all control issues and instances of fraud, if any, within the Company have been detected. These inherent limitations include the realties that judgments in decision-making can be faulty and that breakdowns can occur because of simple errors or mistakes. Additionally, controls can be circumvented by the individual acts of some persons, by collusion of two or more people, or by management override of the controls. The design of any system of controls also is based in part upon certain assumptions about the likelihood of future events. Therefore, a control system, no matter how well conceived and operated, can provide only reasonable, not absolute, assurance that the objectives of the control system are met. Our disclosure controls and procedures are designed to provide such reasonable assurances of achieving our desired control objectives and the Interim Chief Executive Officer and the Chief Financial Officer, as of December 31, 2014, have concluded that our disclosure controls and procedures are effective in achieving that level of reasonable assurance.
Management's Report on Internal Control over Financial Reporting
Our management is responsible for establishing and maintaining adequate internal control over financial reporting. As defined in Exchange Act Rule 13a-15(f), internal control over financial reporting is a process designed by, or under the supervision of, our Interim Chief Executive Officer and Chief
79
Financial Officer and effected by our Board of Directors, management and other personnel, to provide reasonable assurance regarding the reliability of financial reporting and the preparation of financial statements for external purposes in accordance with generally accepted accounting principles and includes those policies and procedures that:
- •
- pertain to the maintenance of records that in reasonable detail accurately and fairly reflect the transactions and dispositions of our
assets;
- •
- provide reasonable assurance that transactions are recorded as necessary to permit preparation of financial statements in accordance
with generally accepted accounting principles, and that our receipts and expenditures are being made only in accordance with authorizations of our management and directors; and
- •
- provide reasonable assurance regarding prevention or timely detection of unauthorized acquisition, use or disposition of our assets that could have a material effect on the financial statements.
Under the supervision and with the participation of our management, including our Interim Chief Executive Officer and Chief Financial Officer, we carried out an evaluation of the effectiveness of our internal control over financial reporting as of December 31, 2014 based on the criteria in the 2013 Internal Control—Integrated Framework issued by the Committee of Sponsoring Organizations of the Treadway Commission ("COSO"). Based upon this evaluation, our management concluded that our internal control over financial reporting was effective as of December 31, 2014.
Grant Thornton LLP, the independent registered public accounting firm that audited our consolidated financial statements included in this Annual Report on Form 10-K, has also audited the effectiveness of the Company's internal control over financial reporting as of December 31, 2014.
Changes in Internal Control over Financial Reporting.
There were no changes in internal control over financial reporting that occurred during the most recent fiscal quarter that have materially affected, or are reasonably likely to materially affect, our internal control over financial reporting.
Not applicable.
80
Item 10: Directors, Executive Officers and Corporate Governance
See "Executive Officers, Board of Directors, Committees of the Board and Section 16(a) Beneficial Ownership Reporting Compliance" in the Warren Resources, Inc. Proxy Statement ("Proxy Statement"), for the Annual Meeting of Stockholders of Warren Resources, Inc. to be held on June 3, 2015 (to be filed with the SEC within 120 days after the end of the Company's fiscal year ended December 31, 2014) which is incorporated herein by reference.
The Company's Code of Business Conduct and Ethics and the Code of Ethics for the Chief Executive Officer, Chief Financial Officer and Chief Accounting Officer can be found on the Company's internet website located at www.warrenresources.com. If the Company amends the Code of Ethics or grants a waiver, including an implicit waiver, from the Code of Ethics, the Company intends to disclose the information on its internet website. This information will remain on the website for at least 12 months.
Item 11: Executive Compensation
Information required by this item will be contained in the Proxy Statement under the caption "Executive Compensation," and is hereby incorporated by reference herein.
Item 12: Securities Ownership of Certain Beneficial Owners and Management and Related Stockholder Matters
Information required by this item will be contained in the Proxy Statement under the caption "Securities Ownership of Certain Beneficial Owners and Management and Related Stockholder Matters" and is incorporated herein by reference.
Item 13: Certain Relationships and Related Transactions, and Director Independence
Information required by this item will be contained in the Proxy Statement under the caption "Certain Transactions" and "Corporate Governance" and is hereby incorporated by reference herein.
Item 14: Principal Accountant Fees and Services
Information required by this item will be contained in the Proxy Statement under the caption "Auditors' Fees," and is hereby incorporated by reference herein.
81
Item 15: Exhibits, Financial Statement Schedules
(a)(1) Financial Statements
(a)(2) All other schedules have been omitted because the required information is inapplicable or is shown in the Notes to the Consolidated Financial Statements.
(a)(3) Exhibits required to be filed by Item 601 of Regulation S-K.
| Exhibit No. | Description | ||
|---|---|---|---|
| 2.1 | (39) | Purchase and Sale Agreement, dated as of July 6, 2014, by and among Citrus Energy Appalachia, LLC, TLK Energy LLC and Troy Energy Investments, LLC, as Seller, and Warren Resources, Inc., as Buyer, and joined in for certain limited purposes by Citrus Energy Corporation | |
| 2.2 | (40) | Amendment to Purchase and Sale Agreement, dated as of August 11, 2014, by and among Citrus Energy Appalachia, LLC, TLK Energy LLC and Troy Energy Investments, LLC, as Seller, and Warren Resources, Inc., as Buyer, and joined in for certain limited purposes by Citrus Energy Corporation | |
| 3.1 | (17) | Articles of Incorporation of Registrant filed May 20, 2004 (Maryland) | |
| 3.2 | (14) | Bylaws of the Registrant, dated June 2, 2004 | |
| 3.3 | (10) | Articles Supplementary (Series A 8% Cumulative Convertible Preferred Stock ($.0001 Par Value)) (Maryland) | |
| 3.4 | (11) | Articles Supplementary (Series A Institutional 8% Cumulative Convertible Preferred Stock ($.0001 Par Value) (Maryland) | |
| 3.5 | (12) | Certificate of Correction to Articles Supplementary (Series A 8% Cumulative Convertible Preferred Stock) (Maryland) | |
| 3.6 | (13) | Certificate of Correction to Articles Supplementary (Series A Institutional 8% Cumulative Convertible Preferred Stock) (Maryland) | |
| 3.7 | (34) | Articles of Amendment to the Articles of Incorporation of Registrant | |
| 4.1 | (18) | Specimen Stock Certificate for Common Stock (Maryland) | |
82
| Exhibit No. | Description | ||
|---|---|---|---|
| 4.2 | (6) | Form of Registration Rights Agreement made as of December 12, 2002, by and between Warren Resources and the Investors in the Series A 8% Cumulative Convertible Preferred Stock | |
| 4.3 | (42) | Indenture, dated as of August 11, 2014, by and between Warren Resources, Inc., Certain Subsidiaries of Warren Resources, Inc., as Guarantors and U.S. Bank National Association, as Trustee | |
| 4.4 | (43) | Form of Note (included in Exhibit 4.3) | |
| 4.5 | (41) | Form of Registration Rights Agreement made as of August 11, 2014, by and between Warren Resources and the Purchasers of Common Stock | |
| 4.6 | (44) | Form of Registration Rights Agreement made as of August 11, 2014, by and between Warren Resources and the Initial Purchasers of the 9% Senior Notes due 2022 | |
| 10.1 | (1)* | 2000 Equity Incentive Plan for Warren E&P Subsidiary | |
| 10.2 | (2)* | Amendment to 2000 Stock Incentive Plan for Warren E&P Subsidiary | |
| 10.3 | (3)* | 2001 Stock Incentive Plan | |
| 10.4 | (4)* | 2001 Key Employee Stock Incentive Plan | |
| 10.5 | (5)* | Form of Indemnification Agreement | |
| 10.6 | (7) | Joint Exploration Agreement, dated December 13, 2002 between Warren Resources, Inc., Anadarko E&P Company LP, and Anadarko Land Corp. | |
| 10.7 | (8) | Form of Rocky Mountain Unit Operating Agreement Between Anadarko E&P Company, LP and Warren Resources, Inc. | |
| 10.8 | (15) | Purchase and Sale Agreement dated November 24, 2004 by and among Warren Resources of California, Inc., Magness Petroleum Company and Next Generation Investments, LLC | |
| 10.9 | (16) | Settlement Agreement and Release dated November 24, 2004 by and among Warren Resources, Inc., Warren Resources of California, Inc., Warren E&P, Inc., Warren Development Corp. and Magness Petroleum Company | |
| 10.10 | (19) | Asset Purchase Agreement dated December 9, 2005 by and among Warren Resources, Inc., Warren Resources of California, Inc., Warren E&P, Inc. and Global Oil Production, LLC and Wilmington Management, LLC | |
| 10.11 | (20) | Form of Change in Control Agreement, dated as of May 9, 2009, between Warren Resources, Inc. and certain employees of Warren Resources, Inc. | |
| 10.12 | (21)* | 2010 Stock Incentive Plan | |
| 10.13 | (24) | Second Amended and Restated Credit Agreement dated as of December 15, 2011 among Warren Resources, Inc., as Borrower, Certain Subsidiaries of Borrower, as Guarantors, Bank of Montreal, as Administrative Agent, as a Lender and the additional Lenders party thereto | |
| 10.14 | (22) | Coalbed Natural Gas (CBNG) Unit Agreement for the Development and Operation of the Spyglass Hill (CBNG) Unit area. Count of Carbon, State of Wyoming, dated February 26, 2011, by and between the parties identified therein | |
| 10.15 | (23) | Unit Operating Agreement Spyglass Hill (CBNG) Unit Area, dated February 26, 2011, by and among the parties identified therein | |
83
| Exhibit No. | Description | ||
|---|---|---|---|
| 10.16 | (25) | Assignment and Bill of Sale (Spyglass Hill Unit) between Anadarko E&P Company, L.P. and Warren Resources, Inc. dated October 9, 2012 | |
| 10.17 | (26) | Assignment and Bill of Sale (Catalina Unit) between Anadarko E&P Company, L.P. and Warren Resources, Inc. dated October 9, 2012 | |
| 10.18 | (27) | Conveyance, Assignment and Bill of Sale between WGR Asset Holding Company LLC and Warren Energy Services, LLC dated October 9, 2012 for Midstream Assets | |
| 10.19 | (28)* | Amendment to 2010 Stock Incentive Plan | |
| 10.20 | (29)* | Executive Employment Agreement with Philip A. Epstein dated December 5, 2012 | |
| 10.21 | (30)* | Employment Agreement with Timothy A. Larkin effective July 15, 2013 | |
| 10.22 | (31)* | Employment Agreement with David E. Fleming effective July 15, 2013 | |
| 10.23 | (32)* | Warren Resources, Inc. Severance Plan | |
| 10.24 | (33) | First Amendment to Second Amended and Restated Credit Agreement and First Amendment to Amended and Restated Guaranty as of December 31, 2013 among Warren Resources, Inc., as Borrower, Certain Subsidiaries of Borrower, as Guarantors, Bank of Montreal, as Administrative Agent, as a Lender and the additional Lenders party thereto | |
| 10.25 | (35) | Form of Incentive Stock Option Award Agreement | |
| 10.26 | (36) | Form of Chief Executive Officer Incentive Stock Option Award Agreement | |
| 10.27 | (37) | Second Amendment to Second Amended and Restated Credit Agreement, dated as of June 9, 2014, among Warren Resources, Inc., as Borrower, certain Subsidiaries of Borrower as Guarantors, Bank of Montreal, as Administrative Agent and as a Lender, the additional lenders that are parties thereto, and BMO Harris Financing, Inc., as the Swing Line Lender, amending the Second Amended and Restated Credit Agreement dated as of December 15, 2011, as amended | |
| 10.28 | (38) | Consulting Services Agreement, dated as of July 9, 2014, between Warren Resources, Inc. and Marc Rowland | |
| 10.29 | (45) | Purchase Agreement, dated as of August 6, 2014, by and among Warren Resources, Inc., as Seller, and BMO Capital Markets Corp., Jefferies LLC, Wells Fargo Securities, LLC, Capital One Securities, Inc., U.S. Bancorp Investments, Inc., BOSC, Inc., Comerica Securities, Inc., KeyBanc Capital Markets Inc., and Santander Investment Securities Inc., collectively as Sellers, and Warren E&P, Inc., Warren Resources of California, Inc., and Warren Marcellus LLC, as Guarantors | |
| 10.30 | (46) | Third Amended and Restated Credit Agreement, dated as of August 11, 2014, among Warren Resources, Inc., as Borrower, certain Subsidiaries of Borrower as Guarantors, Bank of Montreal, as Administrative Agent and as a Lender, the additional Lenders that are parties thereto, and BMO Harris Financing, Inc., as the Swing Line Lender | |
| 10.31 | (47) | First Amendment to Third Amended and Restated Credit Agreement, dated as of November 26, 2014, among Warren Resources, Inc., as Borrower, certain Subsidiaries of Borrower as Guarantors, Bank of Montreal, as Administrative Agent and as a Lender, the additional Lenders that are parties thereto, and BMO Harris Financing, Inc., as the Swing Line Lender | |
| 10.32 | (48) | Offer Letter, dated December 23, 2014, by and between Warren Resources Inc. and Lance Peterson | |
84
| Exhibit No. | Description | ||
|---|---|---|---|
| 10.33 | (49) | Restricted Stock Award Agreement, dated December 23, 2014, by and between Warren Resources Inc. and Lance Peterson | |
| 10.34 | (50) | Separation and General Release Agreement, dated December 31, 2014, by and between Warren Resources Inc. and Philip A. Epstein | |
| 14.1 | (9) | Code of Ethics for Senior Financial Officers | |
| 21.1 | † | Subsidiaries of the Registrant | |
| 23.1 | † | Consent of Grant Thornton LLP | |
| 23.2 | † | Consent of Netherland, Sewell & Associates, Inc. | |
| 23.3 | † | Consent of Richey May & Co. | |
| 23.4 | † | Consent of Hogan Taylor LLP | |
| 31.1 | † | Certification of Chief Executive Officer pursuant to Section 302 of the Sarbanes-Oxley Act of 2002 | |
| 31.2 | † | Certification of Chief Financial Officer pursuant to Section 302 of the Sarbanes-Oxley Act of 2002 | |
| 32 | † | Certification of CEO and CFO pursuant to Section 1350 | |
| 99.1 | † | Report of Netherland, Sewell & Associates, Inc., Independent Petroleum Engineer | |
| 101 | ** | The following materials from the Warren Resources, Inc. Annual Report on Form 10-K for the year ended December 31, 2011 (and related periods), formatted in XBRL (eXtensible Business Reporting Language) include (i) the Consolidated Balance Sheets, (ii) the Consolidated Statements of Operations, (iii) the Consolidated Statements of Stockholders' Equity and Comprehensive Income, (iv) the Consolidated Statements of Cash Flows, and (v) Notes to the Consolidated Financial Statements | |
- †
- Filed
herewith
- *
- Denotes
a management contract or compensatory plan or arrangement
- **
- Users
of this data are advised pursuant to Rule 401 of Regulations S-T that the financial information contained in the XBRL-Related Documents
is unaudited. Furthermore, users of this data are advised in accordance with Rule 406T of Regulations S-T promulgated by the Securities and Exchange Commission that this Interactive Data
File is deemed not filed or part of a registration statement or prospectus for purposes of Sections 11 or 12 of the Securities Act of 1933, as amended, is deemed not filed for purposes of
Section 18 of the Securities Exchange Act of 1934, as amended, and otherwise is not subject to liability under these Sections
- (1)
- Incorporated
by reference to Exhibit 10.1 to the Company's Registration Statement on Form 10, Commission File No. 000-33275, filed on
October 26, 2001
- (2)
- Incorporated
by reference to Exhibit 10.2 to the Company's Registration Statement on Form 10, Commission File No. 000-33275, filed on
October 26, 2001
- (3)
- Incorporated
by reference to Exhibit 10.3 to the Company's Registration Statement on Form 10, Commission File No. 000-33275, filed on
October 26, 2001
- (4)
- Incorporated by reference to Exhibit 10.4 to the Company's Registration Statement on Form 10, Commission File No. 000-33275, filed on October 26, 2001
85
- (5)
- Incorporated
by reference to Exhibit 10.11 to the Company's Registration Statement on Form 10, Commission File No. 000-33275, filed on
October 26, 2001
- (6)
- Incorporated
by reference to Exhibit 4.1 to the Company's Current Report on Form 8-K, Commission File No. 000-33275, filed on
December 17, 2002
- (7)
- Incorporated
by reference to Exhibit 10.2 to the Company's Current Report on Form 8-K, Commission File No. 000-33275, filed on
December 24, 2002
- (8)
- Incorporated
by reference to Exhibit 10.3 to the Company's Current Report on Form 8-K, Commission File No. 000-33275, filed on
December 24, 2002
- (9)
- Incorporated
by reference to Exhibit 14 to the Company's Annual Report on Form 10-K for the year ended December 31, 2002, Commission
File No. 000-33275, filed on March 31, 2003
- (10)
- Incorporated
by reference to Exhibit 3.2 to the Company's Quarterly Report on Form 10-Q for the quarter ended June 30, 2004,
Commission File No. 000-33275, filed on August 16, 2004
- (11)
- Incorporated
by reference to Exhibit 3.3 to the Company's Quarterly Report on Form 10-Q for the quarter ended June 30, 2004,
Commission File No. 000-33275, filed on August 16, 2004
- (12)
- Incorporated
by reference to Exhibit 3.4 to the Company's Quarterly Report on Form 10-Q for the quarter ended June 30, 2004,
Commission File No. 000-33275, filed on August 16, 2004
- (13)
- Incorporated
by reference to Exhibit 3.5 to the Company's Quarterly Report on Form 10-Q for the quarter ended June 30, 2004,
Commission File No. 000-33275, filed on August 16, 2004
- (14)
- Incorporated
by reference to Exhibit 3.6 to the Company's Quarterly Report on Form 10-Q for the quarter ended June 30, 2004,
Commission File No. 000-33275, filed on August 16, 2004
- (15)
- Incorporated
by reference to Exhibit 10.1 to the Company's Registration Statement on Form 8-K, Commission File No. 000-33275, filed on
November 30, 2004
- (16)
- Incorporated
by reference to Exhibit 10.2 to the Company's Registration Statement on Form 8-K, Commission File No. 000-33275, filed on
November 30, 2004
- (17)
- Incorporated
by reference to Exhibit 3.1 to the Company's Annual Report on Form 10-K for the year ended December 31, 2004, Commission
File No. 000-33275, filed on March 17, 2005
- (18)
- Incorporated
by reference to Exhibit 4.1 to the Company's Annual Report on Form 10-K for the year ended December 31, 2004, Commission
File No. 000-33275, filed on March 17, 2005
- (19)
- Incorporated
by reference to Exhibit 10.1 to the Company's Current Report on Form 8-K, Commission File No. 000-33275, filed on
December 14, 2005
- (20)
- Incorporated
by reference to Exhibit 10.1 to the Company's Quarterly Report on Form 10-Q, Commission File No. 000-33275, filed
August 5, 2009
- (21)
- Incorporated
by reference to Exhibit A to the Company's Definitive Proxy Statement on Form DEF 14-A filed on April 8, 2010
- (22)
- Incorporated
by reference to Exhibit 10.1 to the Company's Quarterly Report on Form 10-Q, Commission File No. 000-33275, filed
November 8, 2011
- (23)
- Incorporated
by reference to Exhibit 10.2 to the Company's Quarterly Report on Form 10-Q, Commission File No. 000-33275, filed
November 8, 2011
- (24)
- Incorporated by reference to Exhibit 10.1 to the Company's Current Report on Form 8-K, Commission File No. 000-33275, filed December 16, 2011
86
- (25)
- Incorporated
by reference to Exhibit 10.1 to the Company's Current Report on Form 8-K, Commission File No. 000-33275, filed
October 15, 2012
- (26)
- Incorporated
by reference to Exhibit 10.2 to the Company's Current Report on Form 8-K, Commission File No. 000-33275, filed
October 15, 2012
- (27)
- Incorporated
by reference to Exhibit 10.3 to the Company's Current Report on Form 8-K, Commission File No. 000-33275, filed
October 15, 2012
- (28)
- Incorporated
by reference to Exhibit 10.1 to the Company's Quarterly Report on Form 10-Q, Commission File No. 000-33275, filed
November 7, 2012
- (29)
- Incorporated
by reference to Exhibit 10.1 to the Company's Current Report on Form 8-K, Commission File No. 000-33275, filed
December 7, 2012
- (30)
- Incorporated
by reference to Exhibit 10.1 to the Company's Current Report on Form 8-K, Commission File No. 000-33275, filed
August 20, 2013
- (31)
- Incorporated
by reference to Exhibit 10.2 to the Company's Current Report on Form 8-K, Commission File No. 000-33275, filed
August 20, 2013
- (32)
- Incorporated
by reference to Exhibit 10.1 to the Company's Current Report on Form 8-K, Commission File No. 000-33275, filed
November 21, 2013
- (33)
- Incorporated
by reference to Exhibit 10.1 to the Company's Current Report on Form 8-K, Commission File No. 000-33275, filed
December 17, 2013
- (34)
- Incorporated
by reference to Exhibit A to the Company's Definitive Proxy Statement on Form DEF 14-A filed on April 24, 2014
- (35)
- Incorporated
by reference to Exhibit 10.1 to the Company's Quarterly Report on Form 10-Q, Commission File No. 000-33275, filed
May 7, 2014
- (36)
- Incorporated
by reference to Exhibit 10.2 to the Company's Quarterly Report on Form 10-Q, Commission File No. 000-33275, filed
May 7, 2014
- (37)
- Incorporated
by reference to Exhibit 10.1 to the Company's Current Report on Form 8-K, Commission File No. 000-33275, filed
June 10, 2014
- (38)
- Incorporated
by reference to Exhibit 10.1 to the Company's Current Report on Form 8-K, Commission File No. 000-33275, filed
July 10, 2014
- (39)
- Incorporated
by reference to Exhibit 2.1 to the Company's Current Report on Form 8-K, Commission File No. 000-33275, filed
August 12, 2014
- (40)
- Incorporated
by reference to Exhibit 2.2 to the Company's Current Report on Form 8-K, Commission File No. 000-33275, filed
August 12, 2014
- (41)
- Incorporated
by reference to Exhibit 4.1 to the Company's Current Report on Form 8-K, Commission File No. 000-33275, filed
August 12, 2014
- (42)
- Incorporated
by reference to Exhibit 4.2 to the Company's Current Report on Form 8-K, Commission File No. 000-33275, filed
August 12, 2014
- (43)
- Incorporated
by reference to Exhibit 4.3 to the Company's Current Report on Form 8-K, Commission File No. 000-33275, filed
August 12, 2014
- (44)
- Incorporated by reference to Exhibit 4.4 to the Company's Current Report on Form 8-K, Commission File No. 000-33275, filed August 12, 2014
87
- (45)
- Incorporated
by reference to Exhibit 10.1 to the Company's Current Report on Form 8-K, Commission File No. 000-33275, filed
August 12, 2014
- (46)
- Incorporated
by reference to Exhibit 10.2 to the Company's Current Report on Form 8-K, Commission File No. 000-33275, filed
August 12, 2014
- (47)
- Incorporated
by reference to Exhibit 10.1 to the Company's Current Report on Form 8-K, Commission File No. 000-33275, filed
December 2, 2014
- (48)
- Incorporated
by reference to Exhibit 10.1 to the Company's Current Report on Form 8-K, Commission File No. 000-33275, filed
December 24, 2014
- (49)
- Incorporated
by reference to Exhibit 10.2 to the Company's Current Report on Form 8-K, Commission File No. 000-33275, filed
December 24, 2014
- (50)
- Incorporated by reference to Exhibit 10.1 to the Company's Current Report on Form 8-K, Commission File No. 000-33275, filed January 2, 2015
88
Pursuant to the requirements of Section 13 or 15(d) of the Securities Exchange Act of 1934, the registrant has duly caused this Report to be signed on its behalf by the undersigned, thereunto duly authorized.
| WARREN RESOURCES, INC. | ||||
By: |
/s/ LANCE PETERSON Lance Peterson Interim Chief Executive Officer |
|||
By: |
/s/ STEWART P. SKELLY Stewart P. Skelly Vice President, Chief Financial Officer and Chief Accounting Officer |
|||
Dated: March 11, 2015
Pursuant to the requirements of the Securities Exchange Act of 1934, this Report has been signed below by the following persons on behalf of the registrant and in the capacities and on the dates indicated.
Signature
|
Title (Principal Function)
|
Date
|
||
|---|---|---|---|---|
| /s/ LANCE PETERSON Lance Peterson |
Interim Chief Executive Officer and Director (Principal Executive Officer) | March 11, 2015 | ||
/s/ STEWART P. SKELLY Stewart P. Skelly |
Vice President, Chief Financial Officer and Chief Accounting Officer (Principal Financial and Accounting Officer) |
March 11, 2015 |
||
/s/ DOMINICK D'ALLEVA Dominick D'Alleva |
Director and Interim Chairman of the Board |
March 11, 2015 |
||
/s/ CHET BORGIDA Chet Borgida |
Director |
March 11, 2015 |
||
/s/ ANTHONY COELHO Anthony Coelho |
Director |
March 11, 2015 |
89
Signature
|
Title (Principal Function)
|
Date
|
||
|---|---|---|---|---|
| /s/ LEONARD DECECCHIS Leonard DeCecchis |
Director | March 11, 2015 | ||
/s/ THOMAS NOONAN Thomas Noonan |
Director |
March 11, 2015 |
||
/s/ ESPY PRICE Espy Price |
Director |
March 11, 2015 |
||
/s/ MARCUS C. ROWLAND Marcus C. Rowland |
Director |
March 11, 2015 |
90
F-1
Report of Independent Registered Public Accounting Firm
Board
of Directors and Stockholders
Warren Resources, Inc.
We have audited the internal control over financial reporting of Warren Resources, Inc. (a Maryland Corporation) and subsidiaries (the "Company") as of December 31, 2014, based on criteria established in the 2013 Internal Control—Integrated Framework issued by the Committee of Sponsoring Organizations of the Treadway Commission (COSO). The Company's management is responsible for maintaining effective internal control over financial reporting and for its assessment of the effectiveness of internal control over financial reporting, included in the accompanying Management's Report on Internal Control over Financial Reporting. Our responsibility is to express an opinion on the Company's internal control over financial reporting based on our audit.
We conducted our audit in accordance with the standards of the Public Company Accounting Oversight Board (United States). Those standards require that we plan and perform the audit to obtain reasonable assurance about whether effective internal control over financial reporting was maintained in all material respects. Our audit included obtaining an understanding of internal control over financial reporting, assessing the risk that a material weakness exists, testing and evaluating the design and operating effectiveness of internal control based on the assessed risk, and performing such other procedures as we considered necessary in the circumstances. We believe that our audit provides a reasonable basis for our opinion.
A company's internal control over financial reporting is a process designed to provide reasonable assurance regarding the reliability of financial reporting and the preparation of financial statements for external purposes in accordance with generally accepted accounting principles. A company's internal control over financial reporting includes those policies and procedures that (1) pertain to the maintenance of records that, in reasonable detail, accurately and fairly reflect the transactions and dispositions of the assets of the company; (2) provide reasonable assurance that transactions are recorded as necessary to permit preparation of financial statements in accordance with generally accepted accounting principles, and that receipts and expenditures of the company are being made only in accordance with authorizations of management and directors of the company; and (3) provide reasonable assurance regarding prevention or timely detection of unauthorized acquisition, use or disposition of the company's assets that could have a material effect on the financial statements.
Because of its inherent limitations, internal control over financial reporting may not prevent or detect misstatements. Also, projections of any evaluation of effectiveness to future periods are subject to the risk that controls may become inadequate because of changes in conditions, or that the degree of compliance with the policies or procedures may deteriorate.
In our opinion, the Company maintained, in all material respects, effective internal control over financial reporting as of December 31, 2014 , based on criteria established in the 2013 Internal Control—Integrated Framework issued by COSO.
We also have audited, in accordance with the standards of the Public Company Accounting Oversight Board (United States), the consolidated financial statements of the Company as of and for the year ended December 31, 2014, and our report dated March 11, 2015 expressed an unqualified opinion on those financial statements.
/s/ GRANT THORNTON LLP
Oklahoma
City, Oklahoma
March 11, 2015
F-2
Report of Independent Registered Public Accounting Firm
Board
of Directors and Stockholders
Warren Resources, Inc.
We have audited the accompanying consolidated balance sheets of Warren Resources, Inc. (a Maryland Corporation) and subsidiaries (the "Company") as of December 31, 2014 and 2013, and the related consolidated statements of operations, comprehensive income, stockholders' equity and cash flows for each of the three years in the period ended December 31, 2014. These financial statements are the responsibility of the Company's management. Our responsibility is to express an opinion on these financial statements based on our audits.
We conducted our audits in accordance with the standards of the Public Company Accounting Oversight Board (United States). Those standards require that we plan and perform the audit to obtain reasonable assurance about whether the financial statements are free of material misstatement. An audit includes examining, on a test basis, evidence supporting the amounts and disclosures in the financial statements. An audit also includes assessing the accounting principles used and significant estimates made by management, as well as evaluating the overall financial statement presentation. We believe that our audits provide a reasonable basis for our opinion.
In our opinion, the consolidated financial statements referred to above present fairly, in all material respects, the financial position of Warren Resources, Inc. and subsidiaries as of December 31, 2014 and 2013, and the results of their operations and their cash flows for each of the three years in the period ended December 31, 2014, in conformity with accounting principles generally accepted in the United States of America.
We also have audited, in accordance with the standards of the Public Company Accounting Oversight Board (United States), the Company's internal control over financial reporting as of December 31, 2014, based on criteria established in the 2013 Internal Control—Integrated Framework issued by the Committee of Sponsoring Organizations of the Treadway Commission (COSO), and our report dated March 11, 2015 expressed an unqualified opinion.
/s/ GRANT THORNTON LLP
Oklahoma
City, Oklahoma
March 11, 2015
F-3
Warren Resources, Inc. and Subsidiaries
CONSOLIDATED BALANCE SHEETS
December 31,
| |
2014 | 2013 | |||||
|---|---|---|---|---|---|---|---|
| |
(in thousands, except share and per share data) |
||||||
ASSETS |
|||||||
Current Assets |
|||||||
Cash and cash equivalents |
$ | 1,703 | $ | 11,620 | |||
Accounts receivable—trade, net |
20,025 | 21,874 | |||||
Restricted investments in U.S. Treasury bonds—available for sale, at fair value (amortized cost of $107 in 2014 and $100 in 2013) |
142 | 131 | |||||
Derivative financial instruments |
4,005 | — | |||||
Other current assets |
1,245 | 1,859 | |||||
| | | | | | | | |
Total current assets |
27,120 | 35,484 | |||||
Other Assets |
|||||||
Oil and gas properties—at cost, based on full cost method of accounting, net of accumulated depreciation, depletion and amortization (includes unproved properties excluded from amortization of $204,626 and $18,015 as of December 31, 2014 and 2013) |
753,496 | 335,354 | |||||
Property and equipment—at cost, net |
19,622 | 18,772 | |||||
Restricted investments in U.S. Treasury bonds—available for sale, at fair value (amortized cost of $962 in 2014 and $904 in 2013) |
1,280 | 1,183 | |||||
Deferred bond offering costs |
13,942 | 785 | |||||
Other assets |
3,220 | 3,184 | |||||
Derivative financial instruments |
— | 43 | |||||
| | | | | | | | |
Total other assets |
791,560 | 359,321 | |||||
| | | | | | | | |
|
$ | 818,680 | $ | 394,805 | |||
| | | | | | | | |
| | | | | | | | |
| | | | | | | | |
LIABILITIES AND STOCKHOLDERS' EQUITY |
|||||||
Current Liabilities |
|||||||
Current maturities of debentures and other long-term liabilities |
$ | 381 | $ | 1,936 | |||
Accounts payable and accrued expenses |
57,389 | 39,174 | |||||
Derivative financial instruments |
— | 3,517 | |||||
| | | | | | | | |
Total current liabilities |
57,770 | 44,627 | |||||
Long-Term Liabilities |
|||||||
Senior notes and debentures, less current portion |
297,525 | 1,472 | |||||
Other long-term liabilities, less current portion |
36,084 | 28,113 | |||||
Credit Facility |
134,749 | 94,500 | |||||
| | | | | | | | |
|
468,358 | 124,085 | |||||
Commitments and contingencies (Note F) |
|||||||
Stockholders' Equity |
|||||||
8% convertible preferred stock—$.0001 par value; authorized, 10,000,000 shares; issued and outstanding 10,703 shares in 2014 and 2013 (aggregate liquidation preference $128 in 2014 and 2013) |
128 | 128 | |||||
Common stock—$.0001 par value; authorized, 100,000,000 shares; issued, 80,754,225 shares in 2014 and 72,887,650 shares in 2013 |
8 | 7 | |||||
Additional paid-in capital |
512,843 | 470,441 | |||||
Accumulated deficit |
(220,643 | ) | (244,673 | ) | |||
Accumulated other comprehensive income, net of applicable income taxes of $141 in 2014 and $124 in 2013 |
216 | 190 | |||||
| | | | | | | | |
Total Stockholders' Equity |
292,552 | 226,093 | |||||
| | | | | | | | |
|
$ | 818,680 | $ | 394,805 | |||
| | | | | | | | |
| | | | | | | | |
| | | | | | | | |
The accompanying notes are an integral part of these statements.
F-4
Warren Resources, Inc. and Subsidiaries
CONSOLIDATED STATEMENTS OF OPERATIONS
Year ended December 31,
| |
2014 | 2013 | 2012 | |||||||
|---|---|---|---|---|---|---|---|---|---|---|
| |
(in thousands, except share and per share amounts) |
|||||||||
Operating Revenues |
||||||||||
Oil and gas sales |
$ | 145,385 | $ | 127,925 | $ | 121,797 | ||||
Transportation revenue |
5,338 | 919 | — | |||||||
| | | | | | | | | | | |
Total revenues |
150,723 | 128,844 | 121,797 | |||||||
| | | | | | | | | | | |
Operating Expenses |
||||||||||
Lease operating expenses and taxes |
48,357 | 36,779 | 33,072 | |||||||
Depreciation, depletion and amortization |
56,489 | 44,806 | 47,172 | |||||||
Transportation expenses |
2,403 | 311 | — | |||||||
Acquisition expenses |
4,198 | — | — | |||||||
General and administrative |
15,271 | 15,389 | 19,844 | |||||||
| | | | | | | | | | | |
Total operating expenses |
126,718 | 97,285 | 100,088 | |||||||
| | | | | | | | | | | |
Income from operations |
24,005 | 31,559 | 21,709 | |||||||
Other income (expense) |
||||||||||
Interest and other income |
2,396 | 5,362 | 90 | |||||||
Interest expense |
(9,643 | ) | (2,995 | ) | (3,311 | ) | ||||
Gain (loss) on derivative financial instruments |
7,445 | (3,477 | ) | (2,975 | ) | |||||
Loss on contingent consideration |
(190 | ) | — | — | ||||||
| | | | | | | | | | | |
Net other income (expense) |
8 | (1,110 | ) | (6,196 | ) | |||||
| | | | | | | | | | | |
Income before provision for income taxes |
24,013 | 30,449 | 15,513 | |||||||
Deferred income tax (benefit) expense |
(17 | ) | 64 | (7 | ) | |||||
| | | | | | | | | | | |
Net income |
24,030 | 30,385 | 15,520 | |||||||
Less dividends and accretion on preferred shares |
10 | 10 | 10 | |||||||
| | | | | | | | | | | |
Net income applicable to common stockholders |
$ | 24,020 | $ | 30,375 | $ | 15,510 | ||||
| | | | | | | | | | | |
| | | | | | | | | | | |
| | | | | | | | | | | |
Income per common share—Basic |
$ | 0.31 | $ | 0.42 | $ | 0.22 | ||||
Income per common share—Diluted |
$ | 0.31 | $ | 0.42 | $ | 0.22 | ||||
Weighted average common shares outstanding—Basic |
76,541,400 | 72,390,584 | 71,376,046 | |||||||
Weighted average common shares outstanding—Diluted |
76,685,511 | 72,546,209 | 72,096,672 | |||||||
The accompanying notes are an integral part of these statements.
F-5
Warren Resources, Inc. and Subsidiaries
CONSOLIDATED STATEMENTS OF COMPREHENSIVE INCOME
Year ended December 31,
| |
2014 | 2013 | 2012 | |||||||
|---|---|---|---|---|---|---|---|---|---|---|
| |
(in thousands, except share and per share amounts) |
|||||||||
Net income |
$ | 24,030 | $ | 30,385 | $ | 15,520 | ||||
Other comprehensive income (loss) |
||||||||||
Holding gains (losses) on available for sale investments, net of income tax |
26 | (97 | ) | 10 | ||||||
| | | | | | | | | | | |
Comprehensive income |
$ | 24,056 | $ | 30,288 | $ | 15,530 | ||||
| | | | | | | | | | | |
| | | | | | | | | | | |
| | | | | | | | | | | |
The accompanying notes are an integral part of these statements.
F-6
Warren Resources, Inc. and Subsidiaries
CONSOLIDATED STATEMENT OF STOCKHOLDERS' EQUITY
Years ended December 31, 2014, 2013 and 2012
| |
Preferred stock | Common stock | |
|
Accumulated other comprehensive income |
|
|
|||||||||||||||||||||
|---|---|---|---|---|---|---|---|---|---|---|---|---|---|---|---|---|---|---|---|---|---|---|---|---|---|---|---|---|
| |
Additional paid-in capital |
Accumulated deficit |
Treasury stock |
Total Stockholders' equity |
||||||||||||||||||||||||
| |
Shares | Amount | Shares | Amount | ||||||||||||||||||||||||
| |
(in thousands) |
|||||||||||||||||||||||||||
Balance at December 31, 2011 |
11 | $ | 128 | 71,519 | $ | 7 | $ | 464,985 | $ | (290,578 | ) | $ | 277 | $ | (728 | ) | $ | 174,091 | ||||||||||
| | | | | | | | | | | | | | | | | | | | | | | | | | | | | |
| | | | | | | | | | | | | | | | | | | | | | | | | | | | | |
| | | | | | | | | | | | | | | | | | | | | | | | | | | | | |
Shares issued from exercise of options |
— | — | 658 | — | 839 | — | — | — | 839 | |||||||||||||||||||
Shares issued from vesting of restricted stock |
— | — | 264 | — | — | — | — | — | — | |||||||||||||||||||
Dividends declared on preferred stock |
— | — | — | — | (10 | ) | — | — | — | (10 | ) | |||||||||||||||||
Stock based compensation |
— | — | — | — | 2,592 | — | — | — | 2,592 | |||||||||||||||||||
Net income |
— | — | — | — | — | 15,520 | — | — | 15,520 | |||||||||||||||||||
Net change in unrealized gain on investment securities available for sale, net of applicable income taxes |
— | — | — | — | — | — | 10 | — | 10 | |||||||||||||||||||
| | | | | | | | | | | | | | | | | | | | | | | | | | | | | |
Total comprehensive income |
15,530 | |||||||||||||||||||||||||||
| | | | | | | | | | | | | | | | | | | | | | | | | | | | | |
Balance at December 31, 2012 |
11 | $ | 128 | 72,441 | $ | 7 | $ | 468,406 | $ | (275,058 | ) | $ | 287 | $ | (728 | ) | $ | 193,042 | ||||||||||
| | | | | | | | | | | | | | | | | | | | | | | | | | | | | |
| | | | | | | | | | | | | | | | | | | | | | | | | | | | | |
| | | | | | | | | | | | | | | | | | | | | | | | | | | | | |
Shares issued from exercise of options |
— | — | 823 | — | 711 | — | — | — | 711 | |||||||||||||||||||
Shares issued from vesting of restricted stock |
— | — | 256 | — | — | — | — | — | — | |||||||||||||||||||
Retirement of treasury stock |
— | — | (632 | ) | — | (728 | ) | — | — | 728 | — | |||||||||||||||||
Dividends declared on preferred stock |
— | — | — | — | (10 | ) | — | — | — | (10 | ) | |||||||||||||||||
Stock based compensation |
— | — | — | — | 2,062 | — | — | — | 2,062 | |||||||||||||||||||
Net income |
— | — | — | — | — | 30,385 | — | — | 30,385 | |||||||||||||||||||
Net change in unrealized gain on investment securities available for sale, net of applicable income taxes |
— | — | — | — | — | — | (97 | ) | — | (97 | ) | |||||||||||||||||
| | | | | | | | | | | | | | | | | | | | | | | | | | | | | |
Total comprehensive income |
30,288 | |||||||||||||||||||||||||||
| | | | | | | | | | | | | | | | | | | | | | | | | | | | | |
Balance at December 31, 2013 |
11 | $ | 128 | 72,888 | $ | 7 | $ | 470,441 | $ | (244,673 | ) | $ | 190 | $ | — | $ | 226,093 | |||||||||||
| | | | | | | | | | | | | | | | | | | | | | | | | | | | | |
| | | | | | | | | | | | | | | | | | | | | | | | | | | | | |
| | | | | | | | | | | | | | | | | | | | | | | | | | | | | |
Shares issued from exercise of options |
— | — | 649 | — | 1,473 | — | — | — | 1,473 | |||||||||||||||||||
Shares issued and taxes paid from vesting of restricted stock |
— | — | 551 | — | (2,067 | ) | — | — | — | (2,067 | ) | |||||||||||||||||
Shares issued from acquisition |
— | — | 6,666 | 1 | 41,399 | — | — | — | 41,400 | |||||||||||||||||||
Dividends declared on preferred stock |
— | — | — | — | (10 | ) | — | — | — | (10 | ) | |||||||||||||||||
Stock based compensation |
— | — | — | — | 1,607 | — | — | — | 1,607 | |||||||||||||||||||
Net income |
— | — | — | — | — | 24,030 | — | — | 24,030 | |||||||||||||||||||
Net change in unrealized gain on investment securities available for sale, net of applicable income taxes |
— | — | — | — | — | — | 26 | — | 26 | |||||||||||||||||||
| | | | | | | | | | | | | | | | | | | | | | | | | | | | | |
Total comprehensive income |
24,056 | |||||||||||||||||||||||||||
| | | | | | | | | | | | | | | | | | | | | | | | | | | | | |
Balance at December 31, 2014 |
11 | $ | 128 | 80,754 | $ | 8 | $ | 512,843 | $ | (220,643 | ) | $ | 216 | $ | — | $ | 292,552 | |||||||||||
| | | | | | | | | | | | | | | | | | | | | | | | | | | | | |
| | | | | | | | | | | | | | | | | | | | | | | | | | | | | |
| | | | | | | | | | | | | | | | | | | | | | | | | | | | | |
The accompanying notes are an integral part of these statements.
F-7
Warren Resources, Inc. and Subsidiaries
CONSOLIDATED STATEMENTS OF CASH FLOWS
Year ended December 31,
| |
2014 | 2013 | 2012 | |||||||
|---|---|---|---|---|---|---|---|---|---|---|
| |
(in thousands) |
|||||||||
Cash flows from operating activities: |
||||||||||
Net income |
$ | 24,030 | $ | 30,385 | $ | 15,520 | ||||
Adjustments to reconcile net income to net cash provided by operating activities: |
||||||||||
Accretion of discount on available for sale debt securities |
(65 | ) | (61 | ) | (58 | ) | ||||
Accretion of discount on senior notes |
202 | — | — | |||||||
Amortization of deferred offering costs |
965 | 218 | 207 | |||||||
Gain on sale of U.S. Treasury bonds—available for sale |
— | — | (4 | ) | ||||||
Depreciation, depletion and amortization |
56,489 | 44,806 | 47,172 | |||||||
Deferred tax (benefit) expense |
(17 | ) | 64 | (7 | ) | |||||
Change in fair value of derivative financial instruments |
(7,479 | ) | 2,523 | 281 | ||||||
Stock option expense |
1,607 | 2,062 | 2,592 | |||||||
Change in assets and liabilities: |
||||||||||
Decrease (Increase) in accounts receivable—trade |
1,849 | (3,890 | ) | (4,157 | ) | |||||
(Increase) decrease in other assets |
578 | (764 | ) | (41 | ) | |||||
Increase in accounts payable and accruals |
10,570 | 5,856 | 6,618 | |||||||
Decrease in other long term liabilities |
(4,724 | ) | (1,846 | ) | (1,286 | ) | ||||
| | | | | | | | | | | |
Net cash provided by operating activities |
84,005 | 79,353 | 66,837 | |||||||
Cash flows from investing activities: |
||||||||||
Purchase, exploration and development of oil and gas properties |
(412,531 | ) | (69,162 | ) | (77,004 | ) | ||||
Purchases of property and equipment |
(2,774 | ) | (2,680 | ) | (2,666 | ) | ||||
Proceeds from U.S. Treasury bonds—available for sale |
— | — | 13 | |||||||
| | | | | | | | | | | |
Net cash used in investing activities |
(415,305 | ) | (71,842 | ) | (79,657 | ) | ||||
Cash flows from financing activities: |
||||||||||
Proceeds from Credit Facility and senior notes offering |
389,599 | 5,000 | 20,000 | |||||||
Payments on debt and debentures |
(67,623 | ) | (10,077 | ) | (10,158 | ) | ||||
Payments on taxes of vested restricted stock and proceeds from the exercise of stock options |
(593 | ) | 711 | 839 | ||||||
| | | | | | | | | | | |
Net cash provided by (used in) financing activities |
321,383 | (4,366 | ) | 10,681 | ||||||
| | | | | | | | | | | |
Net (decrease) increase in cash and cash equivalents |
(9,917 | ) | 3,145 | (2,139 | ) | |||||
Cash and cash equivalents at beginning of year |
11,620 | 8,475 | 10,614 | |||||||
| | | | | | | | | | | |
Cash and cash equivalents at end of year |
$ | 1,703 | $ | 11,620 | $ | 8,475 | ||||
| | | | | | | | | | | |
| | | | | | | | | | | |
| | | | | | | | | | | |
Supplemental disclosure of cash flow information |
||||||||||
Cash paid for interest (net of capitalized interest of $4,978 in 2014) |
$ | 8,662 | $ | 2,672 | $ | 3,181 | ||||
Noncash investing and financing activities: |
||||||||||
Accrued preferred stock dividend |
$ | 10 | $ | 10 | $ | 10 | ||||
Change in accounts payable relating to oil and gas property |
7,635 | 4,029 | (15,750 | ) | ||||||
Increase in asset retirement liability |
2,088 | 1,139 | 9,491 | |||||||
Common Stock issued for Citrus Acquisition |
41,400 | — | — | |||||||
Earn-Out provision for Citrus Acquisition |
6,340 | — | — | |||||||
Farm-Out provision for Citrus Acquisition |
3,410 | — | — | |||||||
The accompanying notes are an integral part of these statements.
F-8
Warren Resources, Inc. and Subsidiaries
NOTES TO CONSOLIDATED FINANCIAL STATEMENTS
December 31, 2014, 2013 and 2012
NOTE A—ORGANIZATION AND ACCOUNTING POLICIES
Nature of Operations
Warren Resources, Inc. (the "Company" or "Warren"), was originally formed on June 12, 1990 for the purpose of acquiring and developing oil and gas properties. The Company is incorporated under the laws of the state of Maryland. The Company's properties are located primarily in California, Pennsylvania and Wyoming.
Principles of Consolidation
The consolidated financial statements include accounts of the Company, its wholly-owned subsidiaries, Warren Development Corp., Warren Drilling Corp., Warren Management Corp., Warren Resources of California, Inc., Warren Energy Services LLC, Warren Marcellus LLC and Warren E&P, Inc. All significant intercompany accounts and transactions have been eliminated in consolidation.
Oil and Gas Properties
The Company accounts for its oil and gas activities using the full cost method. As prescribed by full cost accounting rules, all costs associated with property acquisition, exploration and development activities are capitalized. Exploration and development costs include dry hole costs, geological and geophysical costs, direct overhead related to exploration and development activities and other costs incurred for the purpose of finding oil and gas reserves. Salaries and benefits paid to employees directly involved in the exploration and development of oil and gas properties as well as other internal costs that can be specifically identified with acquisition, exploration and development activities are also capitalized. Proceeds received from disposals are credited against accumulated cost except when the sale represents a significant disposal of reserves, in which case a gain or loss is recognized. The sum of net capitalized costs and estimated future development and dismantlement costs are depleted on the equivalent unit-of-production method, based on proved oil and gas reserves as determined by independent petroleum engineers.
In accordance with full cost accounting rules, the Company is subject to a limitation on capitalized costs. The capitalized cost of oil and gas properties, net of accumulated depreciation, depletion and amortization, may not exceed the estimated future net cash flows from proved oil and gas reserves discounted at 10 percent, plus the cost of unproved properties excluded from amortization, as adjusted for related tax effects. If capitalized costs exceed this limit (the "ceiling limitation"), the excess must be charged to expense. There was no impairment charge in 2014, 2013 or 2012.
The costs of certain unevaluated oil and gas properties and exploratory wells being drilled are not included in the costs subject to amortization. The Company assesses costs not being amortized for possible impairments or reductions in value and if impairments or a reduction in value has occurred, the portion of the carrying cost in excess of the current value is transferred to costs subject to amortization.
Revenue Recognition
Oil and gas sales result from undivided interests held by the Company in various oil and gas properties. Sales of natural gas and oil produced are recognized when delivered to, or picked up by, the
F-9
Warren Resources, Inc. and Subsidiaries
NOTES TO CONSOLIDATED FINANCIAL STATEMENTS (Continued)
December 31, 2014, 2013 and 2012
NOTE A—ORGANIZATION AND ACCOUNTING POLICIES (Continued)
purchaser. For 2014, the largest purchasers and marketers of our total oil and gas production were Clearwater Enterprises, Phillips 66 , and Devlar Energy, which accounted for 43%, 29% and 26%, respectively, of total oil and natural gas sales sold in 2014. For 2013, the largest purchasers and marketers for the Company's production primarily included Phillips 66 and Devlar Energy, which accounted for 52% and 40%, respectively, of total oil and natural gas sold in 2013. For 2012, the largest purchasers and marketers for the Company's production primarily included Phillips 66 and Anadarko Energy Services, which accounted for 55% and 38%, respectively, of total oil and natural gas sold in 2012.
Cash and Cash Equivalents
The Company considers all highly liquid investments with maturities of three months or less when acquired to be cash equivalents. The Company maintains its cash and cash equivalents in bank deposit accounts that may exceed federally insured limits. At December 31, 2014, the Company had the majority of its cash and cash equivalents with one financial institution. The Company has not experienced any losses in such accounts and believes it is not exposed to any significant credit risk on cash and cash equivalents.
Accounts Receivable
Accounts receivable include trade receivables from joint interest owners and oil and gas purchasers. Credit is extended based on evaluation of a customer's financial condition and, generally, collateral is not required. Accounts receivable under joint operating agreements generally have a right of offset against future oil and gas revenues if a producing well is completed. Accounts receivable are due within 30 days and are stated at amounts due from customers net of an allowance for doubtful accounts when the Company believes collection is doubtful. Accounts outstanding longer than the contractual payment terms are considered past due. The Company determines its allowance by considering a number of factors, including the length of time trade accounts receivable are past due, the Company's previous loss history, the customer's current ability to pay its obligation to the Company, and the condition of the general economy and the industry as a whole. The Company writes off specific accounts receivable when they become uncollectible, and payments subsequently received on such receivables are credited to the allowance for doubtful accounts. As of December 31, 2014 and 2013, the Company has an allowance of $16,000 and $16,000 respectively, for doubtful accounts.
Investments
The Company classifies its investment in debt securities into two categories: trading securities and available-for-sale securities. Trading securities, classified as current assets, are recorded at fair value with net unrealized gains or losses included in the determination of net earnings. Available-for-sale securities are recorded at fair value, with net unrealized gains and losses excluded from net earnings and reported as other comprehensive income (loss). Available-for-sale securities represent the market value of zero coupon Treasury Bonds collateralizing convertible debentures and are classified as current or non-current based on the classification of the related debentures. Realized gains and losses are determined on the basis of specific identification of the securities.
F-10
Warren Resources, Inc. and Subsidiaries
NOTES TO CONSOLIDATED FINANCIAL STATEMENTS (Continued)
December 31, 2014, 2013 and 2012
NOTE A—ORGANIZATION AND ACCOUNTING POLICIES (Continued)
Offering Costs
Costs incurred in connection with the issuance of debt are capitalized and amortized over the term of the related debt using the effective interest rate method. The Company has $15.7 million and $1.6 million, net of accumulated amortization of $1.8 million and $0.8 million, included in other assets at December 31, 2014 and 2013, respectively. Costs associated with the issuance of preferred and common stock are reflected as a reduction of proceeds.
Income Taxes
Deferred income taxes are recognized for the tax consequences in future years of differences between the tax basis of assets and liabilities and their financial reporting amounts based on enacted tax laws and statutory rates applicable to the period in which the differences are expected to affect taxable income. Valuation allowances are established when, in management's opinion, it is more likely than not that a portion or all of the deferred tax assets will not be realized. The Company's policy is to classify accrued penalties and interest related to unrecognized tax benefits in the Company's income tax provision. The Company routinely assesses potential uncertain tax positions and, if required, establishes accruals for such amounts. Only tax positions that meet the more-likely-than-not recognition threshold are recorded.
Use of Estimates
In preparing financial statements, accounting principles generally accepted in the United States of America require management to make estimates and assumptions in determining the reported amounts of assets and liabilities and disclosure of contingent assets and liabilities at the date of the financial statements and the reported amounts of revenues and expenses during the reporting period. In addition, significant estimates are used in determining year end proved oil and gas reserves. Actual results could differ from those estimates. The estimate of the Company's oil and natural gas reserves, which is used to compute depreciation, depletion, amortization and impairment of oil and gas properties, is the most significant of the estimates and assumptions that affect reported results.
Gas Imbalances
The Company follows the sales method of accounting for gas imbalances. A liability is recorded when the Company's excess takes of natural gas volumes exceed its estimated remaining recoverable reserves. No receivables are recorded for those wells where the Company has taken less than its ownership share of gas production. The Company has no significant gas imbalances at December 31, 2014 or December 31, 2013.
Stock Based Compensation
The Company uses the Black-Scholes option-pricing formula and the Monte Carlo Simulation method to estimate the fair value of stock based compensation expense at the grant date related to stock options and certain restricted stock grants issued. This expense is then recognized using the straight-line method over the vesting period. For the years ended December 31, 2014, 2013 and 2012, the Company recognized approximately $1.6 million, $2.1 million and $2.6 million in compensation
F-11
Warren Resources, Inc. and Subsidiaries
NOTES TO CONSOLIDATED FINANCIAL STATEMENTS (Continued)
December 31, 2014, 2013 and 2012
NOTE A—ORGANIZATION AND ACCOUNTING POLICIES (Continued)
expense, respectively, related to stock option plans and restricted stock. Both the Black-Scholes and the Monte Carlo Simulation method require numerous assumptions, including volatility, service periods and cancellations in their calculations.
The fair value of each stock option grant is estimated on the date of grant using the Black-Scholes options-pricing model with the following weighted-average assumptions used for grants in 2014, 2013 and 2012, respectively: No expected dividends, weighted average volatility of 53%, 71%, and 72%, risk-free interest rates of 1.09%, 0.53%, and 0.43% and expected lives of 3.5 years for incentive options issued in 2014, 2013 and 2012. The volatility assumptions were calculated based on the performance of our stock prices for the year. The weighted average fair values of the options issued in 2014, 2013 and 2012 were $2.03, $1.43, and $1.41, respectively.
Accounting for Long-Lived Assets
The Company reviews property and equipment for impairment whenever indicators of impairment are present to determine if the carrying amounts exceed the estimated future net cash flows to be realized. Impairment losses are recognized based on the estimated fair value of the asset.
Derivative financial instruments
The Company has entered into several crude oil and natural gas hedges in order to minimize any effect of a downturn in oil and gas prices and protect profitability. These derivative financial instruments are carried on the balance sheet at fair value. If a derivative is designated as a fair value hedge, the changes in the fair value of the derivative and of the hedged item attributable to the hedged risk are recognized in earnings. If a derivative is designated as a cash flow hedge, the effective portions of changes in the fair value of the derivative are recorded in other comprehensive income ("OCI") and are recognized in the statement of operations when the hedged item affects earnings. Ineffective portions of changes in the fair value of cash flow hedges are recognized in earnings. The Company has elected not to designate its derivatives as fair value or cash flow hedges (Note I). Gains and losses resulting from changes in the fair value of the non-designated hedges are recognized in earnings.
F-12
Warren Resources, Inc. and Subsidiaries
NOTES TO CONSOLIDATED FINANCIAL STATEMENTS (Continued)
December 31, 2014, 2013 and 2012
NOTE A—ORGANIZATION AND ACCOUNTING POLICIES (Continued)
Property and Equipment
Property and equipment are stated at cost and are depreciated using the straight-line method over the estimated useful lives of the assets, ranging from three to twenty-five years, except for land which is not depreciated. Property and equipment consisted of the following at December 31:
| |
2014 | 2013 | |||||
|---|---|---|---|---|---|---|---|
| |
(in thousands) |
||||||
Drilling rig |
$ | 22,159 | $ | 20,666 | |||
Equipment |
1,506 | 1,543 | |||||
Automobiles and trucks |
801 | 979 | |||||
Furniture and fixtures |
373 | 461 | |||||
Land and buildings |
943 | 906 | |||||
Office equipment |
1,779 | 1,874 | |||||
| | | | | | | | |
|
27,561 | 26,429 | |||||
Less accumulated depreciation and amortization |
7,939 | 7,657 | |||||
| | | | | | | | |
|
$ | 19,622 | $ | 18,772 | |||
| | | | | | | | |
| | | | | | | | |
| | | | | | | | |
Earnings (Loss) Per Common Share
Basic earnings (loss) per common share is computed by dividing the net earnings (loss) applicable to common stockholders by the weighted average number of common shares outstanding for the period. Diluted earnings per share is based on the assumption that stock options and warrants are converted into common shares using the treasury stock method and convertible debentures and preferred stock are converted using the if-converted method. Conversion or exercise is not assumed if the results are antidilutive.
| |
Year ended December 31, | |||||||||
|---|---|---|---|---|---|---|---|---|---|---|
| |
2014 | 2013 | 2012 | |||||||
Weighted average shares outstanding—basic |
76,541,400 | 72,390,584 | 71,376,046 | |||||||
Incremental shares issuable from dilutive stock options |
144,111 | 155,625 | 720,626 | |||||||
| | | | | | | | | | | |
Weighted average shares outstanding—diluted |
76,685,511 | 72,546,209 | 72,096,672 | |||||||
| | | | | | | | | | | |
| | | | | | | | | | | |
| | | | | | | | | | | |
Potential common shares relating to options, warrants, preferred stock, restricted stock and convertible debentures excluded from the computations of diluted earnings (loss) per share because they are anti-dilutive are as follows:
| |
Year ended December 31, | |||||||||
|---|---|---|---|---|---|---|---|---|---|---|
| |
2014 | 2013 | 2012 | |||||||
Employee stock options |
1,245,336 | 891,405 | 575,750 | |||||||
Convertible debentures |
32,720 | 32,720 | 32,720 | |||||||
Preferred stock |
5,352 | 5,352 | 5,352 | |||||||
Restricted Stock |
689,370 | 1,898,133 | 1,606,460 | |||||||
F-13
Warren Resources, Inc. and Subsidiaries
NOTES TO CONSOLIDATED FINANCIAL STATEMENTS (Continued)
December 31, 2014, 2013 and 2012
NOTE A—ORGANIZATION AND ACCOUNTING POLICIES (Continued)
Preferred stock is convertible from the date of issuance until redemption at 100% of the redemption price amount into common stock of the Company at a conversion rate between 1 to 1 and 1 to 0.5 (Note D).
At December 31, 2014, the Convertible Debentures may be converted until maturity at 100% of principal amount into common stock of the Company at a price of $50.00. At December 31, 2013 and 2012, the Convertible Debentures may have been converted until maturity at 100% of principal amount into common stock of the Company at prices ranging from $35.00 to $50.00 (Note C).
Asset Retirement Obligations
The estimated fair value of the future costs associated with dismantlement, abandonment and restoration of oil and gas properties is recorded generally upon acquisition or completion of a well. The net estimated costs are discounted to present values using a risk adjusted rate over the estimated economic life of the oil and gas properties. Such costs are capitalized as part of the related asset. The asset is depleted on the units-of-production method. The associated liability is classified in other long-term liabilities, net of current portion, in the accompanying Consolidated Balance Sheets. The liability is periodically adjusted to reflect (1) new liabilities incurred, (2) liabilities settled during the period, (3) accretion expense, and (4) revisions to estimated future cash flow requirements. The accretion expense is recorded as a component of depreciation, depletion and amortization. The Company has cash held in escrow with a fair market value of $3.2 million that is legally restricted for potential plugging and abandonment liability in the Wilmington field which is recorded in other assets in the Consolidated Balance Sheets. A reconciliation of the Company's asset retirement obligations is as follows:
| |
December 31, | ||||||
|---|---|---|---|---|---|---|---|
| |
2014 | 2013 | |||||
| |
(in thousands) |
||||||
Balance at beginning of year |
$ | 26,785 | $ | 25,236 | |||
Liabilities incurred in current year |
1,768 | 1,139 | |||||
Obligations on properties acquired |
320 | — | |||||
Liabilities settled in current year |
(1,623 | ) | (1,846 | ) | |||
Accretion expense |
2,521 | 2,256 | |||||
| | | | | | | | |
Carrying amount |
$ | 29,771 | $ | 26,785 | |||
| | | | | | | | |
| | | | | | | | |
| | | | | | | | |
Recent Accounting Pronouncements
In May 2014, the FASB issued Accounting Standards Update No. 2014-09, Revenue from Contracts with Customers ("ASU 2014-09"). The objective of ASU 2014-09 is to clarify the principles for recognizing revenue and to develop a common revenue standard for U.S. GAAP and International Financial Reporting Standards. ASU 2014-09 is effective for fiscal years, and interim periods within those years, beginning after December 15, 2016. The Company is currently evaluating the impact of adopting ASU 2014-09, but the standard is not expected to have a significant effect on its consolidated financial statements.
F-14
Warren Resources, Inc. and Subsidiaries
NOTES TO CONSOLIDATED FINANCIAL STATEMENTS (Continued)
December 31, 2014, 2013 and 2012
NOTE A—ORGANIZATION AND ACCOUNTING POLICIES (Continued)
In August 2014, the FABS issued ASU No. 2014-15, Disclosure of Uncertainties about an Entity's Ability to Continue as a Going Concern ("ASU 2014-15"). ASU 2014-15 will explicitly require management to assess an entity's ability to continue as a going concern, and to provide related footnote disclosure in certain circumstances. The new standard will be effective for all entities in the first annual period ending after December 15, 2016. Earlier adoption is permitted. We are currently evaluating the impact of the adoption of ASU 2014-15.
NOTE B—INVESTMENTS
The amortized cost, unrealized gains and estimated fair values of the Company's available-for-sale securities held are summarized as follows:
| |
December 31, | ||||||
|---|---|---|---|---|---|---|---|
| |
2014 | 2013 | |||||
| |
(in thousands) |
||||||
U.S. Treasury Bonds, stripped of interest, maturing 2020 and 2022, aggregate par value of $1.6 million and $1.6 million, respectively: |
|||||||
Amortized cost |
$ | 1,069 | $ | 1,004 | |||
Gross unrealized gains |
353 | 310 | |||||
| | | | | | | | |
Estimated fair value |
$ | 1,422 | $ | 1,314 | |||
| | | | | | | | |
| | | | | | | | |
| | | | | | | | |
During 2014, 2013 and 2012, the Company recognized approximately $0, $0 and $4,000, respectively, of realized gains from its investments in available-for-sale securities. The basis of available for sale securities sold is determined using the specific identification method.
The realized gains for each year results from the disposition of such securities due to the release of the Company's obligation related to securing its commitment under debentures (Notes C & F).
The amortized cost and estimated fair values of available-for-sale securities, by contractual maturity at December 31, 2014 are shown below.
| |
Amortized cost |
Estimated fair value |
|||||
|---|---|---|---|---|---|---|---|
| |
(in thousands) |
||||||
Due within one year |
$ | 107 | $ | 142 | |||
Due after one year through five years |
— | — | |||||
Due after five years through ten years |
962 | 1,280 | |||||
| | | | | | | | |
Total |
$ | 1,069 | $ | 1,422 | |||
| | | | | | | | |
| | | | | | | | |
| | | | | | | | |
F-15
Warren Resources, Inc. and Subsidiaries
NOTES TO CONSOLIDATED FINANCIAL STATEMENTS (Continued)
December 31, 2014, 2013 and 2012
NOTE C—LONG-TERM LIABILITIES
| |
2014 | 2013 | |||||
|---|---|---|---|---|---|---|---|
| |
(in thousands) |
||||||
Senior notes and debentures consist of the following at December 31: |
|||||||
Secured Convertible Debentures, due December 31, 2020, bearing interest at 12%, due in monthly payments. As of December 31, 2014 and 2013, principal collateralized by $835 thousand and $835 thousand, respectively, principal amount of zero coupon U.S. Treasury Bonds due November 15, 2020(1) |
$ | 835 | $ | 835 | |||
Secured Convertible Debentures, due December 31, 2022, bearing interest at 12%, due in monthly payments. As of December 31, 2014 and 2013, principal collateralized by $801 thousand and $801 thousand respectively, principal amount of zero coupon U.S. Treasury Bonds due November 15, 2022(1) |
801 | 801 | |||||
Senior Notes, due August 11, 2022, bearing interest at 9%, due in semi-annual payments on February 1 and August 1(2) |
296,053 | — | |||||
| | | | | | | | |
|
297,689 | 1,636 | |||||
Less current maturities |
164 | 164 | |||||
| | | | | | | | |
Long-term portion |
$ | 297,525 | $ | 1,472 | |||
| | | | | | | | |
| | | | | | | | |
| | | | | | | | |
- (1)
- Debentures
can be called at par if the Company's stock trades at or above 133% of the conversion price for a period of ninety consecutive trading days.
- (2)
- The carrying amount is net of an unamortized discount of $3.9 million at December 31, 2014.
The Convertible Debentures may be converted from the date of issuance until maturity at 100% of principal amount into common stock of the Company at a price of $50.00 each. Conversion of the Debentures would increase the number of shares outstanding at December 31 as follows:
2014
|
Maturity date | Outstanding principal amount |
Per share conversion price |
Common shares if converted |
||||||||
|---|---|---|---|---|---|---|---|---|---|---|---|---|
| |
(in thousands, except share and per share amounts) |
|||||||||||
Secured Convertible 12% Debentures |
December 31, 2020 | $ | 835 | $ | 50.00 | 16,700 | ||||||
Secured Convertible 12% Debentures |
December 31, 2022 | 801 | 50.00 | 16,020 | ||||||||
| | | | | | | | | | | | | |
|
$ | 1,636 | 32,720 | |||||||||
| | | | | | | | | | | | | |
| | | | | | | | | | | | | |
| | | | | | | | | | | | | |
F-16
Warren Resources, Inc. and Subsidiaries
NOTES TO CONSOLIDATED FINANCIAL STATEMENTS (Continued)
December 31, 2014, 2013 and 2012
NOTE C—LONG-TERM LIABILITIES (Continued)
Each year, holders of the Secured Convertible Debentures may tender to the Company up to 10% of the aggregate amount outstanding. As of December 31, 2014, the estimated principal that can be tendered by the secured holders is as follows:
| |
(in thousands) | |||
|---|---|---|---|---|
Fiscal year ending December 31: |
||||
2015 |
$ | 164 | ||
2016 |
147 | |||
2017 |
133 | |||
2018 |
119 | |||
2019 |
107 | |||
Thereafter |
966 | |||
| | | | | |
|
$ | 1,636 | ||
| | | | | |
| | | | | |
| | | | | |
Long-term liabilities, excluding derivative financial instruments, consist of the following at December 31:
| |
2014 | 2013 | |||||
|---|---|---|---|---|---|---|---|
| |
(in thousands) |
||||||
Credit facility |
$ | 134,749 | $ | 94,500 | |||
Debentures |
1,636 | 1,636 | |||||
Senior notes |
300,000 | — | |||||
Discount on senior notes |
(3,947 | ) | — | ||||
Contingent earn-out |
6,530 | — | |||||
Asset retirement obligations |
29,771 | 26,785 | |||||
Litigation allowance |
— | 3,100 | |||||
| | | | | | | | |
|
468,739 | 126,021 | |||||
Less current maturities |
381 | 1,936 | |||||
| | | | | | | | |
Long-term portion |
$ | 468,358 | $ | 124,085 | |||
| | | | | | | | |
| | | | | | | | |
| | | | | | | | |
On August 11, 2014, the Company entered into a five-year Third Amended and Restated Credit Agreement with Bank of Montreal, as Administrative Agent, and the other lenders party thereto (the "Amended Credit Facility"), which provides for an initial borrowing base of $225 million. This replaced the Second Amended and Restated Credit Agreement with Bank of Montreal. The Amended Credit Facility matures on August 11, 2019, is guaranteed by Warren Resources of California, Inc., Warren Marcellus LLC and Warren E&P, Inc. (collectively, the "Guarantors") and is secured by substantially all of the oil and gas assets of the Company and the Guarantors.
The borrowing base is subject to semi-annual redeterminations in April and October of each year in accordance with the lenders' customary procedures and practices. In addition, the borrowing base may be redetermined in connection with the occurrence of specified events and both the Company and the Agent (or the Agent at the request of the required lenders) have the right to request one additional redetermination between each scheduled borrowing base redetermination. Credit line interest
F-17
Warren Resources, Inc. and Subsidiaries
NOTES TO CONSOLIDATED FINANCIAL STATEMENTS (Continued)
December 31, 2014, 2013 and 2012
NOTE C—LONG-TERM LIABILITIES (Continued)
of approximately $185,000 was accrued as of December 31, 2014. As of December 31, 2014 the Company had $134.7 million outstanding on its borrowings under the Amended Credit Facility.
The Company is subject to certain covenants under the terms of the Amended Credit Facility which include, but are not limited to, the maintenance of the following financial ratios (1) minimum current ratio of not less than 1.0 to 1.0 (including unused borrowing base and excluding unrealized gains and losses on derivative financial instruments) and (2) a minimum consolidated EBITDAX (as defined in the Amended Credit Facility) to net interest expense of not less than 2.5 to 1.0. The Company is in compliance with all covenants as of December 31, 2014.
Depending on the level of borrowing base usage, the annual interest rate on each loan under the Amended Credit Facility will be, at the Company's option, either: (a) a "LIBOR Loan", which has an interest rate equal to the sum of the LIBOR rate plus the applicable "LIBOR Margin" that ranges from 1.75% to 2.75%, or (b) a "Base Rate Loan", which has an interest rate equal to the sum of the "Base Rate", calculated to be the highest of: (i) the Agent's prime rate of interest announced from time to time; (ii) the Federal Funds rate most recently determined by the Agent plus 0.50%; or (iii) the one month LIBOR rate plus 1.00%, plus an applicable "Base Rate Margin" that ranges from 0.75% to 1.75%. The weighted average interest rate as of December 31, 2014, was 2.41%.
The Amended Credit Facility also places restrictions on certain additional indebtedness, dividends to shareholders, liens, investments, mergers, acquisitions, asset dispositions, repurchase or redemption of our common stock, speculative commodity transactions, transactions with affiliates and other matters.
The Amended Credit Facility is subject to customary events of default. If an event of default occurs and is continuing, the Agent may, or at the request of the Lenders shall, accelerate amounts due under the Credit Facility (except for a bankruptcy event of default, in which case such amounts will automatically become due and payable).
On August 11, 2014, the Company issued $300.0 million of 9.000% senior notes in a private offering at a price equal to 98.617% due to mature on August 1, 2022 (the "Senior Notes"). Interest is payable on the Senior Notes semi-annually in arrears at a rate of 9.000% per annum on each February 1 and August 1.
We may redeem, at specified redemption prices, some or all of the Senior Notes at any time on or after August 1, 2017. We may also redeem up to 35% of the Senior Notes using the proceeds of certain equity offerings completed before August 1, 2017. If we sell certain of our assets or experience certain kinds of changes in control, we may be required to offer to purchase the Senior Notes from the holders. The Senior Notes are fully, unconditionally and jointly and severally guaranteed on a senior unsecured basis by certain of our existing subsidiaries and will be fully, unconditionally and jointly and severally guaranteed on a senior unsecured basis by our future domestic subsidiaries, subject to certain exceptions. Warren Resources, Inc. is a holding company with no independent assets or operations. Any subsidiaries of the Company other than the subsidiary guarantors are minor. There are no significant restrictions on the Company's ability, or the ability of any subsidiary guarantor, to obtain funds from its subsidiaries through dividends, loans, advances or otherwise.
At December 31, 2014, we were in compliance with all of our covenants, and there were no existing defaults or events of default, under our debt instruments.
F-18
Warren Resources, Inc. and Subsidiaries
NOTES TO CONSOLIDATED FINANCIAL STATEMENTS (Continued)
December 31, 2014, 2013 and 2012
NOTE D—STOCKHOLDERS' EQUITY
During 2014, as part of the acquisition of our Marcellus Assets, the Company issued approximately 6.7 million shares of our common stock valued at $41.4 million.
During 2014, the Company issued 649,002 shares of common stock to individuals who exercised options at exercise prices ranging from $0.51 to $3.09 per share. During 2013, the Company issued 823,331 shares of common stock to individuals who exercised options at exercise prices ranging from $0.51 to $3.07 per share. During 2012, the Company issued 658,510 shares of common stock to individuals who exercised options at an exercise price of $0.51 to $2.42 per share.
The preferred stock has an 8% cumulative dividend, payable quarterly. Preferred dividends of approximately $103 thousand ($9.60 per share) and $92 thousand ($8.64 per share) were accrued at December 31, 2014 and 2013, respectively. The holders of the preferred stock are not entitled to vote except as defined by the agreement or as provided by applicable law. The preferred stock may be voluntarily converted into common stock at the election of the holder based on the table below. The conversion rate is subject to adjustment as defined by the agreement.
| |
Preferred to common |
|
|---|---|---|
Period |
||
Prior to June 30, 2005 |
1 to 1 | |
July 1, 2005 through June 30, 2006 |
1 to .75 | |
July 1, 2006 through redemption |
1 to .50 |
Additionally, commencing December 31, 2012, holders of the preferred stock may elect to require the Company to redeem their preferred stock at a redemption price equal to the liquidation value of $12 per share, plus accrued but unpaid dividends, if any ("Redemption Price"). Upon the receipt of a redemption election, the Company, at its option, shall either: (1) pay the holder cash in the amount equal to the Redemption Price or (2) issue to holder shares of common stock as defined by the agreement. The Company is accreting the carrying value of its preferred stock to its redemption price using the effective interest method with accretion recorded to additional paid in capital. The accretion of preferred stock results in a reduction of earnings per share applicable to common stockholders. There are 10,703 preferred shares outstanding that the Company may be required to redeem at the aggregate Redemption Price of $0.1 million after December 31, 2014. As noted above, the Company could, at its option, settle the redemption requests in shares of common stock.
F-19
Warren Resources, Inc. and Subsidiaries
NOTES TO CONSOLIDATED FINANCIAL STATEMENTS (Continued)
December 31, 2014, 2013 and 2012
NOTE D—STOCKHOLDERS' EQUITY (Continued)
Securities Authorized for Issuance Under Compensation Plans
The table below includes information about our equity compensation plans as of December 31, 2014:
| |
Number of Shares Authorized for Issuance under plan |
Number of securities to be issued upon exercise of outstanding options and restricted stock |
Weighted-average exercise price of outstanding options and restricted stock |
Number of securities remaining available for future issuance under equity compensation plans |
|||||||||
|---|---|---|---|---|---|---|---|---|---|---|---|---|---|
2000 Equity Incentive Plan |
1,975,000 | 64,100 | $ | 2.42 | 0 | ||||||||
2010 Stock Incentive Plan |
6,950,000 | 2,612,429 | $ | 4.02 | 3,135,085 | ||||||||
| | | | | | | | | | | | | | |
Total |
8,925,000 | 2,676,529 | $ | 3.99 | 3,135,085 | ||||||||
| | | | | | | | | | | | | | |
| | | | | | | | | | | | | | |
| | | | | | | | | | | | | | |
During 2014, the Board of Directors approved and the Company issued 1,372,920 stock options to officers and employees of the Company exercisable at prices ranging from $3.01 to $6.66 per share and 525,296 shares of restricted stock. During 2013, the Board of Directors approved and the Company issued 652,322 stock options to officers and employees of the Company exercisable at prices ranging from $2.75 to $3.04 per share and 886,331 shares of restricted stock. During 2012, the Board of Directors approved and the Company issued 269,000 stock options to officers and employees of the Company exercisable at prices ranging from $2.74 to $3.21 per share and 1,405,965 shares of restricted stock. The options are exercisable at a price not less than the fair market value of the stock at the date of grant, have an exercisable period of five years and generally vest over three years.
F-20
Warren Resources, Inc. and Subsidiaries
NOTES TO CONSOLIDATED FINANCIAL STATEMENTS (Continued)
December 31, 2014, 2013 and 2012
NOTE D—STOCKHOLDERS' EQUITY (Continued)
A summary of the status of the Company's options issued to employees as of December 31, 2014, 2013 and 2012 and changes during the years ended on those dates is presented below:
| |
Incentive options |
Weighted Average Exercise Price |
|||||
|---|---|---|---|---|---|---|---|
Options outstanding—December 31, 2011 |
3,092,985 | $ | 3.89 | ||||
| | | | | | | | |
| | | | | | | | |
| | | | | | | | |
Issued |
269,000 | $ | 2.80 | ||||
Exercised |
(658,510 | ) | $ | 1.27 | |||
Expired |
(405,666 | ) | $ | 11.08 | |||
Forfeited |
(308,500 | ) | $ | 8.17 | |||
| | | | | | | | |
Options outstanding—December 31, 2012 |
1,989,309 | $ | 2.48 | ||||
| | | | | | | | |
| | | | | | | | |
| | | | | | | | |
Issued |
652,322 | $ | 2.88 | ||||
Exercised |
(823,331 | ) | $ | 0.86 | |||
Expired |
(150,750 | ) | $ | 11.30 | |||
Forfeited |
(176,976 | ) | $ | 3.03 | |||
| | | | | | | | |
Options outstanding—December 31, 2013 |
1,490,574 | $ | 2.65 | ||||
| | | | | | | | |
| | | | | | | | |
| | | | | | | | |
Issued |
1,372,920 | $ | 5.18 | ||||
Exercised |
(649,002 | ) | $ | 2.27 | |||
Expired |
— | — | |||||
Forfeited |
(227,333 | ) | $ | 3.98 | |||
| | | | | | | | |
Options outstanding—December 31, 2014 |
1,987,159 | $ | 4.37 | ||||
| | | | | | | | |
| | | | | | | | |
| | | | | | | | |
| |
Number of Options |
Weighted Average Exercise Price |
Weighted Average Remaining Term (in years) |
|||||||
|---|---|---|---|---|---|---|---|---|---|---|
Outstanding at December 31, 2014 |
1,987,159 | $ | 4.37 | 3.75 | ||||||
| | | | | | | | | | | |
Exercisable at December 31, 2014 |
400,856 | $ | 3.01 | 2.10 | ||||||
| | | | | | | | | | | |
The total intrinsic value of options exercised during the year ended December 31, 2014, 2013 and 2012 was $1.8 million, $1.7 million and $1.0 million respectively.
The total intrinsic value of options outstanding at December 31, 2014 was zero.
As of December 31, 2014, there was $2.7 million of total unrecognized compensation cost related to non-vested stock options granted under the Plans. This cost is expected to be recognized over a weighted average period of 1.6 years.
Cash received from option exercises under all stock-based payment arrangements for the years ended December 31, 2014, 2013 and 2012 was $1.5 million, $0.7 million and $0.8 million respectively. We issue new shares of common stock to settle option exercises.
F-21
Warren Resources, Inc. and Subsidiaries
NOTES TO CONSOLIDATED FINANCIAL STATEMENTS (Continued)
December 31, 2014, 2013 and 2012
NOTE D—STOCKHOLDERS' EQUITY (Continued)
A summary of the status of the Company's restricted stock issued to employees as of December 31, 2014, 2013 and 2012 and changes during the years ended on those dates is presented below:
| |
Shares | Weighted Average Fair Value |
|||||
|---|---|---|---|---|---|---|---|
Outstanding at December 31, 2011 |
615,731 | $ | 4.22 | ||||
Granted |
1,405,965 | 2.19 | |||||
Vested |
(405,650 | ) | 3.86 | ||||
Forfeited |
(9,586 | ) | 3.20 | ||||
| | | | | | | | |
Outstanding at December 31, 2012 |
1,606,460 | $ | 2.54 | ||||
Granted |
886,331 | 1.87 | |||||
Vested |
(398,838 | ) | 3.52 | ||||
Forfeited |
(195,820 | ) | 3.07 | ||||
| | | | | | | | |
Outstanding at December 31, 2013 |
1,898,133 | $ | 1.97 | ||||
Granted |
525,296 | 3.00 | |||||
Vested |
(908,750 | ) | 2.39 | ||||
Forfeited |
(825,309 | ) | 1.41 | ||||
| | | | | | | | |
Outstanding at December 31, 2014 |
689,370 | $ | 2.87 | ||||
| | | | | | | | |
| | | | | | | | |
| | | | | | | | |
Restricted stock awards for executive officers and employees generally vest ratably over three years. Fair value of our restricted shares is based on our closing stock price on the date of grant. As of December 31, 2014, total unrecognized stock-based compensation expense related to non-vested restricted shares was $1.5 million which is expected to be recognized over a weighted average period of approximately 2.1 years.
NOTE E—INCOME TAXES
The Company and its subsidiaries file a consolidated federal income tax return.
The Company's effective income tax rate differed from the federal statutory rate as follows:
| |
2014 | 2013 | 2012 | |||||||
|---|---|---|---|---|---|---|---|---|---|---|
| |
(in thousands) |
|||||||||
Income taxes at federal statutory rate(a) |
$ | 8,167 | $ | 10,353 | $ | 5,274 | ||||
Change in valuation allowance |
(10,647 | ) | (11,768 | ) | (6,537 | ) | ||||
Nondeductible expenses |
869 | 156 | 694 | |||||||
State income taxes net of federal benefit |
1,441 | 1,827 | 931 | |||||||
Other |
153 | (504 | ) | (369 | ) | |||||
| | | | | | | | | | | |
|
$ | (17 | ) | $ | 64 | $ | (7 | ) | ||
| | | | | | | | | | | |
| | | | | | | | | | | |
| | | | | | | | | | | |
- (a)
- 34% for 2014, 2013 and 2012.
F-22
Warren Resources, Inc. and Subsidiaries
NOTES TO CONSOLIDATED FINANCIAL STATEMENTS (Continued)
December 31, 2014, 2013 and 2012
NOTE E—INCOME TAXES (Continued)
Deferred tax assets and liabilities are as follows as of December 31:
| |
2014 | 2013 | |||||
|---|---|---|---|---|---|---|---|
| |
(in thousands) |
||||||
Deferred tax assets relating to: |
|||||||
Net operating loss carryforward |
$ | 94,321 | $ | 98,895 | |||
Oil and gas properties and tangible equipment |
6,256 | 15,043 | |||||
Stock option expense |
3,322 | 3,585 | |||||
Unrealized loss on derivatives |
4,381 | 1,390 | |||||
Other |
327 | 324 | |||||
| | | | | | | | |
|
108,607 | 119,237 | |||||
Less valuation allowance |
108,466 | 119,112 | |||||
| | | | | | | | |
Total deferred tax asset |
141 | 125 | |||||
| | | | | | | | |
Deferred tax liabilities relating to: |
|||||||
Net unrealized gain on investments |
(141 | ) | 125 | ||||
| | | | | | | | |
Total deferred tax liability |
(141 | ) | 125 | ||||
| | | | | | | | |
Net deferred tax asset (liability) |
$ | — | $ | — | |||
| | | | | | | | |
| | | | | | | | |
| | | | | | | | |
A valuation allowance for deferred tax assets is required when it is more likely than not that some portion or all of the deferred tax assets will not be realized. The ultimate realization of this deferred tax asset depends on the Company's ability to generate sufficient taxable income in the future. Management believes it is more likely than not that the net deferred tax asset will not be realized by future operating results. The valuation allowance decreased by approximately $11 million, $12 million and $7 million for the years ended December 31, 2014, 2013 and 2012, respectively.
At December 31, 2014, the Company had net operating loss carryforwards for federal income tax purposes of approximately $236 million, which will expire in years 2019 through 2033.
Tax years beginning in 2010 are subject to examination by taxing authorities, although net operating loss and credit carryforwards from all years are subject to examination and adjustments for at least three years following the year in which the attributes are used.
The Company routinely assesses potential uncertain tax positions and, if required, establishes accruals for such amounts. Only tax positions that meet the more-likely-than-not recognition threshold are recorded.
NOTE F—COMMITMENTS AND CONTINGENCIES
General Commitments
The Company has entered into various commitments and operating agreements related to development and production of certain oil and gas properties. It is management's belief that such commitments, as stated below, will be met without significant adverse impact to the Company's financial position or results of operations.
F-23
Warren Resources, Inc. and Subsidiaries
NOTES TO CONSOLIDATED FINANCIAL STATEMENTS (Continued)
December 31, 2014, 2013 and 2012
NOTE F—COMMITMENTS AND CONTINGENCIES (Continued)
Trust Indenture Agreements
Under certain Trust Indenture Agreements, the Company has purchased zero coupon U.S. Treasury Bonds to secure repayment of the outstanding principal amount of debentures when due at maturity. At December 31, 2014 and 2013, the face amounts of U.S. Treasury Bonds securing the Company's obligation under the Trust Indenture Agreements were $1.6 million and $1.6 million, respectively, and the market values of these U.S. Treasury Bonds were approximately $1.4 million and $1.3 million, respectively (see Note B).
9% Senior Notes
To finance the acquisition of the recently acquired Marcellus Asset in 2014, the company issued the 9% Senior Notes. At December 31, 2014 the face amount of the Senior Notes was $300 million and the market value was approximately $195 million.
Leases
The Company leases corporate office space in New York City, which expires in May 2023. The Company leases oil and gas administrative offices located in Denver, Colorado and Plano, Texas which expire in July 2021 and January 2016, respectively. The Company leases field office space in Rawlins, Wyoming, which expires in March 2015. The Company leases office space in Long Beach, California which expires in September 2020. The Company leases office space in Tunkhannock, Pennsylvania which expires in August 2019. The Company also leases office space in Casper, Wyoming and Roswell, New Mexico, on month to month basis.
Future minimum annual rental payments, which are subject to escalation and include utility charges as of December 31, 2014, are as follows:
| |
(in thousands) | |||
|---|---|---|---|---|
Year ending December 31: |
||||
2015 |
$ | 1,020 | ||
2016 |
947 | |||
2017 |
942 | |||
2018 |
925 | |||
2019 |
943 | |||
Thereafter |
1,882 | |||
| | | | | |
|
$ | 6,659 | ||
| | | | | |
| | | | | |
| | | | | |
Rent expense under these leases was approximately $960 thousand, $881 thousand, and $698 thousand for the years ended December 31, 2014, 2013 and 2012, respectively.
Legal Proceedings
Information with respect to this item may be found under the "Part1, Item3.Legal Proceedings" section of this Annual Report on Form 10-K which is incorporated herein by reference.
F-24
Warren Resources, Inc. and Subsidiaries
NOTES TO CONSOLIDATED FINANCIAL STATEMENTS (Continued)
December 31, 2014, 2013 and 2012
NOTE G—EMPLOYEE BENEFIT PLANS
The Company has a retirement plan covering substantially all qualified employees under section 401(k) of the Internal Revenue Code. The Company's 401(k) is a safe harbor matching plan where the Company contributes up to 100% of the participants' 401(k) contributions, up to a maximum of 3% of the participants' compensation plus 50% of the next 2% of the active participants' compensation. The Company's safe harbor match vests immediately. The Company may also make discretionary contributions. The Company's expenses under the plan were approximately $314 thousand, $276 thousand and $222 thousand for the years ended December 31, 2014, 2013 and 2012, respectively.
NOTE H—FAIR VALUE OF FINANCIAL INSTRUMENTS
The estimated fair values of financial instruments recognized in the Consolidated Balance Sheets or disclosed within these Notes to Consolidated Financial Statements have been determined using available market information, information from unrelated third party financial institutions and appropriate valuation methodologies, primarily discounted projected cash flows. However, considerable judgment is required when interpreting market information and other data to develop estimates of fair value.
Short-term Assets and Liabilities. The fair values of cash and cash equivalents, accounts receivable, accounts payable and accrued expenses and other current liabilities approximate their carrying values because of their short-term nature.
U.S Treasury Bonds—Available-For-Sale Securities. The fair values are based upon quoted market prices for those or similar investments and are reported on the Consolidated Balance Sheets at fair value.
Collateral Security Agreement Account (included in other non-current assets). The balance sheet carrying amount approximates fair value, as it earns a market rate.
Fixed Rate Debentures. Fair values of fixed rate convertible debentures were calculated using interest rates in effect as of year end for similar instruments with the other terms unchanged.
Other Long-Term Liabilities. The carrying amount approximates fair value due the current rates offered to the Company for long-term liabilities of the same remaining maturities.
Line of Credit. The carrying amount approximates fair value due the current rates offered to the Company for lines of credit.
Derivatives. The fair values are based upon observable inputs based on market data obtained from independent sources and are considered Level 2 inputs (quoted prices for similar assets, liabilities (adjusted) and market-corroborated inputs) and are reported on the Consolidated Balance Sheets at fair value.
9.000% Senior Notes. The fair value is based upon quoted market prices for those or similar investments and are reported on the Consolidated Balance Sheets at face value, net of discount.
F-25
Warren Resources, Inc. and Subsidiaries
NOTES TO CONSOLIDATED FINANCIAL STATEMENTS (Continued)
December 31, 2014, 2013 and 2012
NOTE H—FAIR VALUE OF FINANCIAL INSTRUMENTS (Continued)
Contingent Earn-Out. The fair value is based on the present value of the amount discounted at the cost of capital.
| |
2014 | 2013 | |||||||||||
|---|---|---|---|---|---|---|---|---|---|---|---|---|---|
| |
Fair value |
Carrying amount |
Fair value |
Carrying amount |
|||||||||
| |
(in thousands) |
||||||||||||
Financial assets |
|||||||||||||
Collateral Security account |
3,165 | 3,165 | $ | 3,166 | $ | 3,166 | |||||||
Financial liabilities |
|||||||||||||
Fixed rate debentures |
3,035 | 1,636 | $ | 2,035 | $ | 1,636 | |||||||
Line of credit |
134,749 | 134,749 | 94,500 | 94,500 | |||||||||
Senior Notes |
195,000 | 296,053 | — | — | |||||||||
Contingent Earn-Out |
6,530 | 6,530 | — | — | |||||||||
FAIR VALUE MEASUREMENTS:
Fair value as defined by authoritative literature is the price that would be received to sell an asset or paid to transfer a liability in an orderly transaction between market participants at the measurement date. Fair value measurements are classified and disclosed in one of the following categories:
Level 1: Quoted prices (unadjusted) in active markets for identical assets and liabilities that we have the ability to access at the measurement date.
Level 2: Inputs other than quoted prices included within Level 1 that are either directly or indirectly observable for the asset or liability, including quoted prices for similar assets or liabilities in active markets, quoted prices for identical or similar assets or liabilities in inactive markets, inputs other than quoted prices that are observable for the asset or liability, and inputs that are derived from observable market data by correlation or other means. Instruments categorized in Level 2 include non-exchange traded derivatives such as over-the-counter forwards and swaps.
Level 3: Unobservable inputs for the asset or liability, including situations where there is little, if any, market activity for the asset or liability.
The valuation assumptions utilized to measure the fair value of the Company's commodity derivatives were observable inputs based on market data obtained from independent sources and are considered Level 2 inputs (quoted prices for similar assets, liabilities (adjusted) and market-corroborated inputs).
F-26
Warren Resources, Inc. and Subsidiaries
NOTES TO CONSOLIDATED FINANCIAL STATEMENTS (Continued)
December 31, 2014, 2013 and 2012
NOTE H—FAIR VALUE OF FINANCIAL INSTRUMENTS (Continued)
The following table presents for each hierarchy level our assets and liabilities, including both current and non-current portions, measured at fair value on a recurring basis.
December 31, 2014
|
Level 1 | Level 2 | Level 3 | Total | |||||||||
|---|---|---|---|---|---|---|---|---|---|---|---|---|---|
| |
(in thousands) |
||||||||||||
Assets |
|||||||||||||
Restricted investments in US Treasury Bonds—available for sale, at fair value |
$ | 1,422 | $ | — | $ | — | $ | 1,422 | |||||
Commodity derivatives |
$ | — | $ | 4,005 | $ | — | $ | 4,005 | |||||
December 31, 2013
|
Level 1 | Level 2 | Level 3 | Total | |||||||||
|---|---|---|---|---|---|---|---|---|---|---|---|---|---|
| |
(in thousands) |
||||||||||||
Assets |
|||||||||||||
Restricted investments in US Treasury Bonds—available for sale, at fair value |
$ | 1,314 | $ | — | $ | — | $ | 1,314 | |||||
Commodity derivatives |
$ | — | $ | 43 | $ | — | $ | 43 | |||||
| |
Level 1 | Level 2 | Level 3 | Total | |||||||||
|---|---|---|---|---|---|---|---|---|---|---|---|---|---|
| |
(in thousands) |
||||||||||||
Liabilities |
|||||||||||||
Commodity derivatives |
$ | — | $ | 3,517 | $ | — | $ | 3,517 | |||||
NOTE I—DERIVATIVE FINANCIAL INSTRUMENTS
To minimize the effect of a downturn in oil and gas prices and protect our profitability and the economics of our development plans, we enter into crude oil and natural gas hedge contracts. The terms of contracts depend on various factors, including management's view of future crude oil and natural gas prices. This price hedging program is designed to moderate the effects of a crude oil and natural gas price downturn while allowing us to participate in some commodity price increases. Management regularly monitors the crude oil and natural gas markets and our financial commitments to determine if, when, and at what level some form of crude oil and/or natural gas hedging and/or basis adjustments or other price protection is appropriate. Currently, our more commonly used derivatives are in the form of swaps. However, we may use a variety of derivative instruments in the future to hedge. The Company has not designated these derivatives as hedges.
The following table summarizes the open financial derivative positions as of December 31, 2014 related to oil and gas production. The Company will receive prices as noted in the table below and will pay a counterparty market price based on the NYMEX (for natural gas production) or WTI (for oil production) index price, settled monthly.
Product
|
Type | Contract Period | Volume | Price per Mcf or Bbl |
||||||
|---|---|---|---|---|---|---|---|---|---|---|
NYMEX Gas |
Swap | 01/01/15 - 3/31/15 | 20,000 MMbtu/d | $ | 4.54 | |||||
NYMEX Gas |
Swap | 01/01/15 - 12/31/15 | 3,000 MMbtu/d | $ | 4.02 | |||||
NYMEX Gas |
Swap | 01/01/15 - 12/31/15 | 3,000 MMbtu/d | $ | 4.18 | |||||
F-27
Warren Resources, Inc. and Subsidiaries
NOTES TO CONSOLIDATED FINANCIAL STATEMENTS (Continued)
December 31, 2014, 2013 and 2012
NOTE I—DERIVATIVE FINANCIAL INSTRUMENTS (Continued)
The tables below summarize the amount of gains (losses) recognized in income from derivative instruments not designated as hedging instruments under authoritative guidance.
| |
For the Years Ended December 31, | |||||||||
|---|---|---|---|---|---|---|---|---|---|---|
Derivatives not designated as Hedging Instrument under authoritative guidance |
||||||||||
| 2014 | 2013 | 2012 | ||||||||
| |
(in thousands) |
|||||||||
Realized cash settlements on hedges |
$ | (34 | ) | $ | (1,397 | ) | $ | (2,780 | ) | |
Unrealized gain (loss) on hedges |
7,479 | (2,080 | ) | (195 | ) | |||||
| | | | | | | | | | | |
Total |
$ | 7,445 | $ | (3,477 | ) | $ | (2,975 | ) | ||
| | | | | | | | | | | |
| | | | | | | | | | | |
| | | | | | | | | | | |
The table below reflects the line item in our Consolidated Balance Sheet where the fair value of our net derivatives, are included.
| |
Derivative Assets | |||||
|---|---|---|---|---|---|---|
December 31, 2014
|
Balance Sheet Location |
Fair Value | ||||
| |
(in thousands) |
|||||
Commodity—Natural Gas |
current | $ | 3,611 | |||
Commodity—Oil |
current | 394 | ||||
| | | | | | | |
Total derivatives not designated as hedging instruments |
$ | 4,005 | ||||
| | | | | | | |
| | | | | | | |
| | | | | | | |
| |
Derivative Assets | |||||
|---|---|---|---|---|---|---|
December 31, 2013
|
Balance Sheet Location |
Fair Value | ||||
| |
(in thousands) |
|||||
Commodity—Natural Gas |
Non-current | $ | 43 | |||
| | | | | | | |
Total derivatives not designated as hedging instruments |
$ | 43 | ||||
| | | | | | | |
| | | | | | | |
| | | | | | | |
| |
Derivative Liabilities | |||||
|---|---|---|---|---|---|---|
December 31, 2013
|
Balance Sheet Location |
Fair Value | ||||
| |
(in thousands) |
|||||
Commodity—Natural Gas |
current | $ | (808 | ) | ||
Commodity—Oil |
current | (2,709 | ) | |||
| | | | | | | |
Total derivatives not designated as hedging instruments |
$ | (3,517 | ) | |||
| | | | | | | |
| | | | | | | |
| | | | | | | |
Derivative's Credit risk
The Company does not require collateral or other security from counterparties to support derivative instruments. However, the agreements with those counterparties typically contain netting provisions such that if a default occurs, the non-defaulting party can offset the amount payable to the
F-28
Warren Resources, Inc. and Subsidiaries
NOTES TO CONSOLIDATED FINANCIAL STATEMENTS (Continued)
December 31, 2014, 2013 and 2012
NOTE I—DERIVATIVE FINANCIAL INSTRUMENTS (Continued)
defaulting party under the derivative contract with the amount due from the defaulting party. As a result of the netting provisions the Company's maximum amount of loss due to credit risk is limited to the net amounts due to and from the counterparties under the derivative contracts.
As of December 31, 2014, the counterparty to the Company's commodity derivative contracts consists of one financial institution. The Company's counterparty or their affiliates are also lenders under the Company's Amended Credit Facility. As a result, the counterparty to the Company's derivative agreements share in the collateral supporting the Company's Credit Facility. The Company is not generally required to post additional collateral under derivative agreements.
The Company's derivative agreements contain provisions that require cross defaults and acceleration of those instruments to any material debt. If the Company were to default on any of its material debt agreements, it would be a violation of these provisions, and the counterparties to the derivative instruments could request immediate payment on derivative instruments that are in a net liability position at that time.
NOTE J—OIL AND GAS INFORMATION
Costs related to the oil and gas activities of the Company were incurred as follows for the years ended December 31:
| |
2014 | 2013 | 2012 | |||||||
|---|---|---|---|---|---|---|---|---|---|---|
| |
(in thousands) |
|||||||||
Property acquisition—unproved |
$ | 184,410 | $ | — | $ | — | ||||
Property acquisition—proved |
172,264 | 1,635 | 5,413 | |||||||
Exploration costs |
32 | 227 | 52 | |||||||
Development costs |
108,676 | 72,991 | 65,676 | |||||||
| | | | | | | | | | | |
|
$ | 465,382 | $ | 74,853 | $ | 71,141 | ||||
| | | | | | | | | | | |
| | | | | | | | | | | |
| | | | | | | | | | | |
Asset retirement cost included in oil and gas property costs increased by approximately $2.1 million in 2014, increased by $1.1 million in 2013 and increased by approximately $9.5 million in 2012.
The Company had the following aggregate capitalized costs relating to the Company's oil and gas activities at December 31:
| |
2014 | 2013 | |||||
|---|---|---|---|---|---|---|---|
| |
(in thousands) |
||||||
Unproved oil and gas properties |
$ | 204,627 | $ | 18,015 | |||
Proved oil and gas properties |
1,091,063 | 807,439 | |||||
| | | | | | | | |
|
1,295,690 | 825,454 | |||||
Less accumulated depreciation, depletion, amortization and impairment expense |
542,194 | 490,100 | |||||
| | | | | | | | |
|
$ | 753,496 | $ | 335,354 | |||
| | | | | | | | |
| | | | | | | | |
| | | | | | | | |
F-29
Warren Resources, Inc. and Subsidiaries
NOTES TO CONSOLIDATED FINANCIAL STATEMENTS (Continued)
December 31, 2014, 2013 and 2012
NOTE J—OIL AND GAS INFORMATION (Continued)
The following table sets forth the Company's results of operations from oil and natural gas producing activities for the years ended December 31:
| |
2014 | 2013 | 2012 | |||||||
|---|---|---|---|---|---|---|---|---|---|---|
| |
(in thousands) |
|||||||||
Revenues |
$ | 145,385 | $ | 127,925 | $ | 121,797 | ||||
Production costs |
(48,357 | ) | (36,779 | ) | (33,072 | ) | ||||
Accretion of asset retirement obligation |
(2,521 | ) | (2,256 | ) | (1,525 | ) | ||||
Depreciation, depletion, amortization |
(50,686 | ) | (39,431 | ) | (43,460 | ) | ||||
| | | | | | | | | | | |
Income from oil and gas producing activities |
$ | 43,821 | $ | 49,459 | $ | 43,740 | ||||
| | | | | | | | | | | |
| | | | | | | | | | | |
| | | | | | | | | | | |
In the presentation above, no deduction has been made for indirect costs such as corporate overhead or interest expense. No income taxes are reflected above due to the Company's tax loss carryforwards.
The following is a summary of Warren's oil and gas properties not subject to amortization as of December 31, 2014:
| |
Costs incurred in | |||||||||||||||
|---|---|---|---|---|---|---|---|---|---|---|---|---|---|---|---|---|
| |
Fiscal year 2014 |
Fiscal year 2013 |
Fiscal year 2012 |
Prior to 2012 |
Total | |||||||||||
| |
(in thousands) |
|||||||||||||||
Acquisition costs |
$ | 189,388 | $ | — | $ | — | $ | 834 | $ | 190,222 | ||||||
Exploration costs |
— | — | — | 60 | 60 | |||||||||||
Development costs(1) |
1,127 | 126 | 311 | 12,780 | 14,344 | |||||||||||
| | | | | | | | | | | | | | | | | |
Total oil and gas properties not subject to amortization |
$ | 190,515 | $ | 126 | $ | 311 | $ | 13,674 | $ | 204,626 | ||||||
| | | | | | | | | | | | | | | | | |
| | | | | | | | | | | | | | | | | |
| | | | | | | | | | | | | | | | | |
- (1)
- The Company's development costs primarily reflect investment in well cellars and facilities in its Wilmington oil field to facilitate the development of future oil wells. These costs will be allocated to future wells drilled, the majority of these wells are expected to be drilling during the next five to eight years.
NOTE K—OIL AND GAS RESERVE DATA (UNAUDITED)
The following estimates of proved reserve quantities and related standardized measure of discounted future net cash flows are estimates only, and do not purport to reflect realizable values or fair market values of the Company's reserves. The Company emphasizes that reserve estimates are inherently imprecise and that estimates of new discoveries are more imprecise than those of producing oil and gas properties. Accordingly, these estimates are expected to change as future information becomes available. All of the Company's reserves are located in the United States.
Proved reserves are estimated reserves of crude oil (including condensate and natural gas liquids) and natural gas that geological and engineering data demonstrate with reasonable certainty to be recoverable in future years from known reservoirs under existing economic and operating conditions. Proved developed reserves are those expected to be recovered through existing wells, equipment and operating methods.
F-30
Warren Resources, Inc. and Subsidiaries
NOTES TO CONSOLIDATED FINANCIAL STATEMENTS (Continued)
December 31, 2014, 2013 and 2012
NOTE K—OIL AND GAS RESERVE DATA (UNAUDITED) (Continued)
The standardized measure of discounted future net cash flows for were computed by applying 12-month average prices for oil and gas (with consideration of price changes only to the extent provided by contractual arrangements) to the estimated future production of proved oil and gas reserves, less estimated future expenditures (based on year-end costs) to be incurred in developing and producing the proved reserves, less estimated future income tax expenses (based on year-end statutory tax rates, with consideration of future tax rates already legislated) to be incurred on pretax net cash flows less tax basis of the properties and available credits, and assuming continuation of existing economic conditions. The estimated future net cash flows are then discounted using a rate of 10%.
The following summaries of changes in reserves and standardized measure of discounted future net cash flows were prepared from estimates of proved reserves provided by Netherland, Sewell & Associates, Inc. for 2014, 2013 and 2012:
| |
Oil (MBbls) |
Gas (MMcf) |
Equivalent Units (MBoe) |
|||||||
|---|---|---|---|---|---|---|---|---|---|---|
Proved reserves: |
||||||||||
Balance at December 31, 2011 |
14,963 | 43,860 | 22,273 | |||||||
Purchases of oil and gas reserves in place |
— | 20,649 | 3,442 | |||||||
Discoveries and extensions |
3,337 | 2,054 | 3,679 | |||||||
Revisions of previous estimates |
(811 | ) | (9,813 | ) | (2,447 | ) | ||||
Sales of reserves |
— | — | — | |||||||
Production |
(1,109 | ) | (5,514 | ) | (2,028 | ) | ||||
| | | | | | | | | | | |
Balance at December 31, 2012 |
16,380 | 51,236 | 24,919 | |||||||
| | | | | | | | | | | |
| | | | | | | | | | | |
| | | | | | | | | | | |
Purchases of oil and gas reserves in place |
128 | — | 128 | |||||||
Discoveries and extensions |
500 | 46,532 | 8,255 | |||||||
Revisions of previous estimates |
171 | 14,492 | 2,586 | |||||||
Sales of reserves |
— | — | — | |||||||
Production |
(1,105 | ) | (6,232 | ) | (2,143 | ) | ||||
| | | | | | | | | | | |
Balance at December 31, 2013 |
16,074 | 106,028 | 33,745 | |||||||
| | | | | | | | | | | |
| | | | | | | | | | | |
| | | | | | | | | | | |
Purchases of oil and gas reserves in place |
— | 204,839 | 34,140 | |||||||
Discoveries and extensions |
481 | 23,533 | 4,403 | |||||||
Revisions of previous estimates |
1,357 | 9,013 | 2,859 | |||||||
Sales of reserves |
— | — | — | |||||||
Production |
(1,118 | ) | (16,085 | ) | (3,798 | ) | ||||
| | | | | | | | | | | |
Balance at December 31, 2014 |
16,794 | 327,328 | 71,349 | |||||||
| | | | | | | | | | | |
| | | | | | | | | | | |
| | | | | | | | | | | |
Proved developed reserves: |
||||||||||
December 31, 2012 |
8,064 | 51,236 | 16,603 | |||||||
December 31, 2013 |
8,512 | 78,038 | 21,518 | |||||||
December 31, 2014 |
8,560 | 203,272 | 42,439 | |||||||
Proved undeveloped reserves: |
||||||||||
December 31, 2012 |
8,316 | — | 8,316 | |||||||
December 31, 2013 |
7,562 | 27,990 | 12,227 | |||||||
December 31, 2014 |
8,233 | 124,056 | 28,909 | |||||||
F-31
Warren Resources, Inc. and Subsidiaries
NOTES TO CONSOLIDATED FINANCIAL STATEMENTS (Continued)
December 31, 2014, 2013 and 2012
NOTE K—OIL AND GAS RESERVE DATA (UNAUDITED) (Continued)
At December 31, 2014, our proved reserves were 71.3 MMBoe, all of which are scheduled to be drilled within five years of initial disclosure. Undeveloped reserves transferred to developed reserves were 3.9 MMBoe for the year ended December 31, 2014 and capital costs incurred to convert these proved undeveloped reserves to proved developed reserves were $92.9 million. Positive revisions increased 2014 proved natural gas reserves and oil reserves by a net amount of 9 Bcf and 1.4 MMbbls, of which for natural gas 5.7 Bcf was due to pricing, 3.3 Bcf due to performance, and for oil a negative 0.2 MMBbl was due to pricing and 1.6 MMBbl was due to performance. In 2014, total oil extensions and discoveries of 0.5 MMbbls resulted from the Company's drilling and completion activities in the Wilmington Townlot and North Wilmington Units in California. In 2014, total gas extensions and discoveries of 24 Bcf consisted of 18 Bcf which resulted from drilling activities in the Marcellus and 6 Bcf which related to drilling activities in Wyoming. During 2014, we acquired acreage in the Marcellus Shale in Pennsylvania which contributed 204.8 Bcf to our reserves and is reflected in Purchases of reserves in place. Proved undeveloped gas reserves increased from 28 Bcf at December 31, 2013 to 124 Bcf at December 31, 2014, this increase reflects the addition of 93 Bcf of proved undeveloped reserves associated with the acquisition of Marcellus acreage during the year.
At December 31, 2013, our proved reserves were 33.7 MMBoe, all of which were scheduled to be drilled within five years of initial disclosure. Undeveloped reserves transferred to developed reserves were 1.1 MMBoe for the year ended December 31, 2013 and capital costs incurred to convert these proved undeveloped reserves to proved developed reserves were $39.2 million. Positive revisions increased 2013 proved natural gas reserves by a net amount of 14.5 Bcfe, of which 9 Bcfe was due to pricing, 13.8 Mcfe due to performance, and the remainder due to extensions and discoveries. In 2013, total oil extensions and discoveries of 0.5 MMbbls resulted from the Company's drilling and completion activities in the Wilmington Townlot and North Wilmington Units in California. Positive oil revisions of 0.2 MMbbls were made based on production performance and an additional 0.1 MMbbls was relating to the acquisition of the Leroy Pine Project in California. At the beginning of 2013, the value of our proved undeveloped gas reserves was zero. During 2013, we added 4.7 MMBoe in our Atlantic Rim field, 2.8 MMBoe of which was attributable to revisions to our previous estimates as a result of an increase in gas pricing and 1.9 MMBoe of which was attributable to extensions and discoveries related to our drilling activities. In addition, we transferred 1.1 MMBoe to proved developed producing during the year, and added 0.3 MMBoe in California due to drilling.
At December 31, 2012, our proved reserves were 24.9 MMBoe, all of which were scheduled to be drilled within five years of initial disclosure. Undeveloped reserves transferred to developed reserves were 0.9 MMBoe for the year ended December 31, 2012 and capital costs incurred to convert these proved undeveloped reserves to proved developed reserves were $32.4 million. The Company revised its 2012 proved natural gas reserves downward by a net amount of 9.8 Bcfe due to pricing and performance. Positive revisions included 2 Bcfe of discoveries and extensions while an additional 20.6 Bcfe can be attributed to the Company purchasing Anadarko's interest in Atlantic Rim area properties on October 9, 2012. In 2012, total extensions and discoveries of 3.3 MMbbls resulted from the Company's drilling and completion activities in the Wilmington Townlot Unit in California. Negative revisions of 0.8 MMbbls were made based on production performance.
F-32
Warren Resources, Inc. and Subsidiaries
NOTES TO CONSOLIDATED FINANCIAL STATEMENTS (Continued)
December 31, 2014, 2013 and 2012
NOTE K—OIL AND GAS RESERVE DATA (UNAUDITED) (Continued)
Standardized Measure of Discounted Future Net Cash Flows
Relating to Proved Oil and Gas Reserves
| |
December 31, | |||||||||
|---|---|---|---|---|---|---|---|---|---|---|
| |
2014 | 2013 | 2012 | |||||||
| |
(Amounts in thousands) |
|||||||||
Future cash inflows |
$ | 2,510,062 | $ | 1,928,019 | $ | 1,836,212 | ||||
Future production costs and taxes |
(967,776 | ) | (688,056 | ) | (574,959 | ) | ||||
Future development costs(1) |
(390,057 | ) | (314,091 | ) | (303,062 | ) | ||||
Future income tax expenses |
(140,458 | ) | (82,576 | ) | (105,078 | ) | ||||
| | | | | | | | | | | |
Net future cash flows |
1,011,771 | 843,296 | 853,113 | |||||||
Discounted at 10% for estimated timing of cash flows |
(456,704 | ) | (368,295 | ) | (393,233 | ) | ||||
| | | | | | | | | | | |
Standardized measure of discounted future net cash flows |
$ | 555,067 | $ | 475,001 | $ | 459,880 | ||||
| | | | | | | | | | | |
| | | | | | | | | | | |
| | | | | | | | | | | |
- (1)
- Includes future estimated asset retirement obligations of $69.7 million in 2014, $64.4 million in 2013 and $79.9 million in 2012.
Changes in Standardized Measure of Discounted Future Net Cash Flows
Related to Proved Oil and Gas Reserves
| |
Year ended December 31, | |||||||||
|---|---|---|---|---|---|---|---|---|---|---|
| |
2014 | 2013 | 2012 | |||||||
| |
(Amounts in thousands) |
|||||||||
Sales, net of production costs and taxes |
$ | (97,028 | ) | $ | (91,146 | ) | $ | (88,725 | ) | |
Discoveries and extensions |
40,720 | 52,189 | 108,438 | |||||||
Purchases of reserves in place |
206,334 | 2,823 | 4,966 | |||||||
Changes in prices and production costs |
(84,548 | ) | (109 | ) | (17,286 | ) | ||||
Revisions of quantity estimates |
47,425 | 22,911 | (39,172 | ) | ||||||
Development costs incurred |
92,983 | 39,233 | 36,539 | |||||||
Net changes in development costs |
(134,255 | ) | (88,968 | ) | (90,392 | ) | ||||
Interest factor—accretion of discount |
50,371 | 49,491 | 48,601 | |||||||
Net change in income taxes |
(25,354 | ) | 6,328 | 5,037 | ||||||
Changes in production rates (timing) and other |
(16,582 | ) | 22,369 | 5,868 | ||||||
| | | | | | | | | | | |
Net (decrease) increase |
80,066 | 15,121 | (26,126 | ) | ||||||
Balance at beginning of year |
475,001 | 459,880 | 486,006 | |||||||
| | | | | | | | | | | |
Balance at end of year |
$ | 555,067 | $ | 475,001 | $ | 459,880 | ||||
| | | | | | | | | | | |
| | | | | | | | | | | |
| | | | | | | | | | | |
Estimated future net cash flows represent an estimate of future net revenues from the production of proved reserves using average prices for 2014, 2013 and 2012 along with estimates of the operating costs, production taxes and future development and abandonment costs (less salvage value) necessary to produce such reserves. The prices used at December 31, 2014, 2013 and 2012 were $86.71, $97.33 and $104.27 per Bbl and $3.22, $3.43 and $2.51 per Mcf, respectively. No deduction has been made for depreciation, depletion or any indirect costs such as general corporate overhead or interest expense.
F-33
Warren Resources, Inc. and Subsidiaries
NOTES TO CONSOLIDATED FINANCIAL STATEMENTS (Continued)
December 31, 2014, 2013 and 2012
NOTE K—OIL AND GAS RESERVE DATA (UNAUDITED) (Continued)
Operating costs and production taxes are estimated based on current costs with respect to producing oil and natural gas properties. Future development costs including abandonment costs are based on the best estimate of such costs assuming current economic and operating conditions. The future cash flows estimated to be spent to develop the Company's portion of proved undeveloped and proved developed non-producing properties through December 31, 2019 is $320.4 million.
Income tax expense is computed based on applying the appropriate statutory tax rate to the excess of future cash inflows less future production and development costs over the current tax basis of the properties involved, less applicable carryforwards, for both regular and alternative minimum tax.
The future net revenue information assumes no escalation of costs or prices, except for oil and natural gas sales made under terms of contracts which include fixed and determinable escalation. Future costs and prices could significantly vary from current amounts and, accordingly, revisions in the future could be significant.
NOTE L—QUARTERLY INFORMATION (UNAUDITED)
Summarized quarterly financial data for the years ended December 31, 2014 and 2013 are as follows:
| |
2014 | |||||||||||||||
|---|---|---|---|---|---|---|---|---|---|---|---|---|---|---|---|---|
| |
Quarter | |||||||||||||||
| |
First | Second | Third | Fourth | Year | |||||||||||
| |
(in thousands, except per share amounts) |
|||||||||||||||
Revenues |
$ | 34,202 | $ | 34,994 | $ | 40,513 | $ | 41,014 | $ | 150,723 | ||||||
Gross profit |
24,136 | 25,235 | 26,618 | 23,974 | 99,963 | |||||||||||
Net income |
8,210 | 10,754 | 3,726 | 1,340 | 24,030 | |||||||||||
Net income applicable to common stockholders |
8,207 | 10,752 | 3,723 | 1,338 | 24,020 | |||||||||||
Earnings per share |
||||||||||||||||
Basic |
$ | 0.11 | $ | 0.15 | $ | 0.05 | $ | 0.02 | $ | 0.31 | ||||||
Diluted |
$ | 0.11 | $ | 0.15 | $ | 0.05 | $ | 0.02 | $ | 0.31 | ||||||
| |
2013 | |||||||||||||||
|---|---|---|---|---|---|---|---|---|---|---|---|---|---|---|---|---|
| |
Quarter | |||||||||||||||
| |
First | Second | Third | Fourth | Year | |||||||||||
| |
(in thousands, except per share amounts) |
|||||||||||||||
Revenues |
$ | 30,819 | $ | 30,735 | $ | 34,682 | $ | 32,608 | $ | 128,844 | ||||||
Gross profit |
21,023 | 22,405 | 25,425 | 22,901 | 91,754 | |||||||||||
Net income |
2,829 | 9,185 | 14,658 | 3,713 | 30,385 | |||||||||||
Net income applicable to common stockholders |
2,826 | 9,183 | 14,656 | 3,710 | 30,375 | |||||||||||
Earnings per share |
||||||||||||||||
Basic |
$ | 0.04 | $ | 0.13 | $ | 0.20 | $ | 0.05 | $ | 0.42 | ||||||
Diluted |
$ | 0.04 | $ | 0.13 | $ | 0.20 | $ | 0.05 | $ | 0.42 | ||||||
Quarterly and year-to-date computations of per share amounts are made independently. Therefore, the sum of quarterly per share amounts may not agree with per share amounts for the year. Gross profit represents total revenues less applicable direct operating expenses.
F-34
Warren Resources, Inc. and Subsidiaries
NOTES TO CONSOLIDATED FINANCIAL STATEMENTS (Continued)
December 31, 2014, 2013 and 2012
NOTE M—INTEREST AND OTHER INCOME
During the third quarter of 2013, the Company reviewed its practice regarding the amounts of post-production costs that could be charged to royalty owners in the Wilmington Townlot Unit. The Company evaluated these post-production costs and the applicable amounts that could be charged to royalty owners under the terms of the lease agreements. The analysis resulted in a decision by management to charge additional amounts as compared to past practices and, additionally, to recapture amounts applicable to prior periods. This decision resulted in a non-recurring adjustment of $5.3 million during the quarter, which was recorded in interest and other income as well as an adjustment of $2.2 million during 2014.
NOTE N—CAPITALIZED INTEREST
The company capitalizes interest on qualifying assets, which include investments in undeveloped oil and natural gas properties and exploration and development projects for which depletion expense is not currently recognized, and for which exploration or development activities are in progress. The capitalized interest is determined by multiplying the Company's interest rate on specific borrowing costs, adjusted to include amortization of bond discount and issuance costs, related to the Senior Notes used to purchase the Marcellus asset, by the qualifying costs incurred that are excluded from the full cost pool. However, the amount of capitalized interest cannot exceed the amount of gross interest expense incurred in any given period. The capitalized interest amounts are recorded as additions to unevaluated oil and natural gas properties on the consolidated balance sheets. As the costs excluded are transferred to the full cost pool, the associated capitalized interest is also transferred to the full cost pool. Interest of $4.98 million was capitalized during the year ended December 31, 2014, relating to the Senior Notes.
NOTE O—ACQUISITIONS
Marcellus Assets
On August 11, 2014, we acquired essentially all of the Marcellus Assets (the "Marcellus Assets") of Citrus Energy Corporation ("Citrus") and two other working interest owners in exchange for approximately 6.7 million shares of our common stock valued at $41.4 million and cash consideration of $312.5 million, subject to certain post-closing adjustments and certain closing conditions (the "Citrus Acquisition"). The Citrus Acquisition provides us a new area of operations in the Marcellus Shale in Pennsylvania. The Citrus Acquisition was accounted for as a business combination in accordance with Accounting Standards Codification (ASC) No. 805, Business Combinations (ASC 805) which, among other things, requires assets acquired and liabilities assumed to be measured at their acquisition date fair values. The purchase price of the Marcellus Assets was as follows (in thousands):
| |
2014 | |||
|---|---|---|---|---|
Cash Consideration |
$ | 312,500 | ||
Fair Value of Warren Equity Common Shares |
41,400 | |||
Closing Adjustments |
(7,828 | ) | ||
Fair Value of Earn-Out Provision |
6,340 | |||
Fair Value of Farm-Out Provision |
3,410 | |||
| | | | | |
Total purchase price |
$ | 355,822 | ||
| | | | | |
| | | | | |
| | | | | |
F-35
Warren Resources, Inc. and Subsidiaries
NOTES TO CONSOLIDATED FINANCIAL STATEMENTS (Continued)
December 31, 2014, 2013 and 2012
NOTE O—ACQUISITIONS (Continued)
The Company completed its assessment of the fair values of the assets acquired and liabilities assumed by December 31, 2014. The following table presents the purchase price allocation of the Marcellus Assets as of December 31, 2014, based on the fair values of assets acquired and liabilities assumed (in thousands):
| |
2014 | |||
|---|---|---|---|---|
Proved Oil and Gas Properties |
$ | 171,383 | ||
Unproved Oil and Gas Properties |
184,752 | |||
Asset Retirement Obligations |
(313 | ) | ||
| | | | | |
Total purchase price |
$ | 355,822 | ||
| | | | | |
| | | | | |
| | | | | |
In connection with the Citrus Acquisition, a contingent consideration payment was included as part of the purchase price with a maximum payout of $8.5 million, based upon proved reserves and price differential factors. The fair value of this consideration is based on a 90% probability of achieving the full payout discounted to present value.
Pro Forma Impact of Acquisition (Unaudited)
The following unaudited pro forma combined results of operations are provided for the three and twelve months ended December 31, 2014 and 2013 as though the Citrus Acquisition of the Marcellus Assets had occurred on January 1, 2014. The pro forma combined results of operations for the years ended December 31, 2014 and 2013 have been prepared by adjusting the historical results of the Company to include the historical results of the Marcellus Assets to give effect to the pro forma events that were directly attributable to the Citrus Acquisition that were factually supportable. These supplemental pro forma results of operations are provided for illustrative purposes only and do not purport to be indicative of the actual results that would have been achieved by the combined company for the period presented or that may be achieved by the combined company in the future. The pro forma results of operations do not include any cost savings or other synergies that resulted, or may result, from the Citrus Acquisition. Future results may vary significantly from the results reflected in this unaudited pro forma financial information because of future events and transactions, as well as other factors.
| |
For the Twelve Months Ended December 31, |
||||||
|---|---|---|---|---|---|---|---|
| (in thousands) |
2014 | 2013 | |||||
Revenues |
$ | 212,518 | $ | 187,495 | |||
Income (loss) from Operations |
$ | 57,800 | $ | 64,357 | |||
Net income |
$ | 52,395 | $ | 55,946 | |||
Diluted net income per share |
$ | 0.65 | $ | 0.77 | |||
F-36
Warren Resources, Inc. and Subsidiaries
WARREN RESOURCES, INC.
FORM 10-K
December 31, 2014
INDEX TO EXHIBITS
| Exhibit No. | Description | ||
|---|---|---|---|
| 2.1 | (39) | Purchase and Sale Agreement, dated as of July 6, 2014, by and among Citrus Energy Appalachia, LLC, TLK Energy LLC and Troy Energy Investments, LLC, as Seller, and Warren Resources, Inc., as Buyer, and joined in for certain limited purposes by Citrus Energy Corporation | |
| 2.2 | (40) | Amendment to Purchase and Sale Agreement, dated as of August 11, 2014, by and among Citrus Energy Appalachia, LLC, TLK Energy LLC and Troy Energy Investments, LLC, as Seller, and Warren Resources, Inc., as Buyer, and joined in for certain limited purposes by Citrus Energy Corporation | |
| 3.1 | (17) | Articles of Incorporation of Registrant filed May 20, 2004 (Maryland) | |
| 3.2 | (14) | Bylaws of the Registrant, dated June 2, 2004 | |
| 3.3 | (10) | Articles Supplementary (Series A 8% Cumulative Convertible Preferred Stock ($.0001 Par Value)) (Maryland) | |
| 3.4 | (11) | Articles Supplementary (Series A Institutional 8% Cumulative Convertible Preferred Stock ($.0001 Par Value) (Maryland) | |
| 3.5 | (12) | Certificate of Correction to Articles Supplementary (Series A 8% Cumulative Convertible Preferred Stock) (Maryland) | |
| 3.6 | (13) | Certificate of Correction to Articles Supplementary (Series A Institutional 8% Cumulative Convertible Preferred Stock) (Maryland) | |
| 3.7 | (34) | Articles of Amendment to the Articles of Incorporation of Registrant | |
| 4.1 | (18) | Specimen Stock Certificate for Common Stock (Maryland) | |
| 4.2 | (6) | Form of Registration Rights Agreement made as of December 12, 2002, by and between Warren Resources and the Investors in the Series A 8% Cumulative Convertible Preferred Stock | |
| 4.3 | (42) | Indenture, dated as of August 11, 2014, by and between Warren Resources, Inc., Certain Subsidiaries of Warren Resources, Inc., as Guarantors and U.S. Bank National Association, as Trustee | |
| 4.4 | (43) | Form of Note (included in Exhibit 4.3) | |
| 4.5 | (41) | Form of Registration Rights Agreement made as of August 11, 2014, by and between Warren Resources and the Purchasers of Common Stock | |
| 4.6 | (44) | Form of Registration Rights Agreement made as of August 11, 2014, by and between Warren Resources and the Initial Purchasers of the 9% Senior Notes due 2022 | |
| 10.1 | (1)* | 2000 Equity Incentive Plan for Warren E&P Subsidiary | |
| 10.2 | (2)* | Amendment to 2000 Stock Incentive Plan for Warren E&P Subsidiary | |
| 10.3 | (3)* | 2001 Stock Incentive Plan | |
| 10.4 | (4)* | 2001 Key Employee Stock Incentive Plan | |
| Exhibit No. | Description | ||
|---|---|---|---|
| 10.5 | (5)* | Form of Indemnification Agreement | |
| 10.6 | (7) | Joint Exploration Agreement, dated December 13, 2002 between Warren Resources, Inc., Anadarko E&P Company LP, and Anadarko Land Corp. | |
| 10.7 | (8) | Form of Rocky Mountain Unit Operating Agreement Between Anadarko E&P Company, LP and Warren Resources, Inc. | |
| 10.8 | (15) | Purchase and Sale Agreement dated November 24, 2004 by and among Warren Resources of California, Inc., Magness Petroleum Company and Next Generation Investments, LLC | |
| 10.9 | (16) | Settlement Agreement and Release dated November 24, 2004 by and among Warren Resources, Inc., Warren Resources of California, Inc., Warren E&P, Inc., Warren Development Corp. and Magness Petroleum Company | |
| 10.10 | (19) | Asset Purchase Agreement dated December 9, 2005 by and among Warren Resources, Inc., Warren Resources of California, Inc., Warren E&P, Inc. and Global Oil Production, LLC and Wilmington Management, LLC | |
| 10.11 | (20) | Form of Change in Control Agreement, dated as of May 9, 2009, between Warren Resources, Inc. and certain employees of Warren Resources, Inc. | |
| 10.12 | (21)* | 2010 Stock Incentive Plan | |
| 10.13 | (24) | Second Amended and Restated Credit Agreement dated as of December 15, 2011 among Warren Resources, Inc., as Borrower, Certain Subsidiaries of Borrower, as Guarantors, Bank of Montreal, as Administrative Agent, as a Lender and the additional Lenders party thereto | |
| 10.14 | (22) | Coalbed Natural Gas (CBNG) Unit Agreement for the Development and Operation of the Spyglass Hill (CBNG) Unit area. Count of Carbon, State of Wyoming, dated February 26, 2011, by and between the parties identified therein | |
| 10.15 | (23) | Unit Operating Agreement Spyglass Hill (CBNG) Unit Area, dated February 26, 2011, by and among the parties identified therein | |
| 10.16 | (25) | Assignment and Bill of Sale (Spyglass Hill Unit) between Anadarko E&P Company, L.P. and Warren Resources, Inc. dated October 9, 2012 | |
| 10.17 | (26) | Assignment and Bill of Sale (Catalina Unit) between Anadarko E&P Company, L.P. and Warren Resources, Inc. dated October 9, 2012 | |
| 10.18 | (27) | Conveyance, Assignment and Bill of Sale between WGR Asset Holding Company LLC and Warren Energy Services, LLC dated October 9, 2012 for Midstream Assets | |
| 10.19 | (28)* | Amendment to 2010 Stock Incentive Plan | |
| 10.20 | (29)* | Executive Employment Agreement with Philip A. Epstein dated December 5, 2012 | |
| 10.21 | (30)* | Employment Agreement with Timothy A. Larkin effective July 15, 2013 | |
| 10.22 | (31)* | Employment Agreement with David E. Fleming effective July 15, 2013 | |
| 10.23 | (32)* | Warren Resources, Inc. Severance Plan | |
| 10.24 | (33) | First Amendment to Second Amended and Restated Credit Agreement and First Amendment to Amended and Restated Guaranty as of December 31, 2013 among Warren Resources, Inc., as Borrower, Certain Subsidiaries of Borrower, as Guarantors, Bank of Montreal, as Administrative Agent, as a Lender and the additional Lenders party thereto | |
| 10.25 | (35) | Form of Incentive Stock Option Award Agreement | |
| Exhibit No. | Description | ||
|---|---|---|---|
| 10.26 | (36) | Form of Chief Executive Officer Incentive Stock Option Award Agreement | |
| 10.27 | (37) | Second Amendment to Second Amended and Restated Credit Agreement, dated as of June 9, 2014, among Warren Resources, Inc., as Borrower, certain Subsidiaries of Borrower as Guarantors, Bank of Montreal, as Administrative Agent and as a Lender, the additional lenders that are parties thereto, and BMO Harris Financing, Inc., as the Swing Line Lender, amending the Second Amended and Restated Credit Agreement dated as of December 15, 2011, as amended | |
| 10.28 | (38) | Consulting Services Agreement, dated as of July 9, 2014, between Warren Resources, Inc. and Marc Rowland | |
| 10.29 | (45) | Purchase Agreement, dated as of August 6, 2014, by and among Warren Resources, Inc., as Seller, and BMO Capital Markets Corp., Jefferies LLC, Wells Fargo Securities, LLC, Capital One Securities, Inc., U.S. Bancorp Investments, Inc., BOSC, Inc., Comerica Securities, Inc., KeyBanc Capital Markets Inc., and Santander Investment Securities Inc., collectively as Sellers, and Warren E&P, Inc., Warren Resources of California, Inc., and Warren Marcellus LLC, as Guarantors | |
| 10.30 | (46) | Third Amended and Restated Credit Agreement, dated as of August 11, 2014, among Warren Resources, Inc., as Borrower, certain Subsidiaries of Borrower as Guarantors, Bank of Montreal, as Administrative Agent and as a Lender, the additional Lenders that are parties thereto, and BMO Harris Financing, Inc., as the Swing Line Lender | |
| 10.31 | (47) | First Amendment to Third Amended and Restated Credit Agreement, dated as of November 26, 2014, among Warren Resources, Inc., as Borrower, certain Subsidiaries of Borrower as Guarantors, Bank of Montreal, as Administrative Agent and as a Lender, the additional Lenders that are parties thereto, and BMO Harris Financing, Inc., as the Swing Line Lender | |
| 10.32 | (48) | Offer Letter, dated December 23, 2014, by and between Warren Resources Inc. and Lance Peterson | |
| 10.33 | (49) | Restricted Stock Award Agreement, dated December 23, 2014, by and between Warren Resources Inc. and Lance Peterson | |
| 10.34 | (50) | Separation and General Release Agreement, dated December 31, 2014, by and between Warren Resources Inc. and Philip A. Epstein | |
| 14.1 | (9) | Code of Ethics for Senior Financial Officers | |
| 21.1 | † | Subsidiaries of the Registrant | |
| 23.1 | † | Consent of Grant Thornton LLP | |
| 23.2 | † | Consent of Netherland, Sewell & Associates, Inc. | |
| 23.3 | † | Consent of Richey May & Co. | |
| 23.4 | † | Consent of Hogan Taylor LLP | |
| 31.1 | † | Certification of Chief Executive Officer pursuant to Section 302 of the Sarbanes-Oxley Act of 2002 | |
| 31.2 | † | Certification of Chief Financial Officer pursuant to Section 302 of the Sarbanes-Oxley Act of 2002 | |
| 32 | † | Certification of CEO and CFO pursuant to Section 1350 | |
| 99.1 | † | Report of Netherland, Sewell & Associates, Inc., Independent Petroleum Engineer | |
| Exhibit No. | Description | ||
|---|---|---|---|
| 101 | ** | The following materials from the Warren Resources, Inc. Annual Report on Form 10-K for the year ended December 31, 2011 (and related periods), formatted in XBRL (eXtensible Business Reporting Language) include (i) the Consolidated Balance Sheets, (ii) the Consolidated Statements of Operations, (iii) the Consolidated Statements of Stockholders' Equity and Comprehensive Income, (iv) the Consolidated Statements of Cash Flows, and (v) Notes to the Consolidated Financial Statements | |
- †
- Filed
herewith
- *
- Denotes
a management contract or compensatory plan or arrangement
- **
- Users
of this data are advised pursuant to Rule 401 of Regulations S-T that the financial information contained in the XBRL-Related Documents
is unaudited. Furthermore, users of this data are advised in accordance with Rule 406T of Regulations S-T promulgated by the Securities and Exchange Commission that this Interactive Data
File is deemed not filed or part of a registration statement or prospectus for purposes of Sections 11 or 12 of the Securities Act of 1933, as amended, is deemed not filed for purposes of
Section 18 of the Securities Exchange Act of 1934, as amended, and otherwise is not subject to liability under these Sections
- (1)
- Incorporated
by reference to Exhibit 10.1 to the Company's Registration Statement on Form 10, Commission File No. 000-33275, filed on
October 26, 2001
- (2)
- Incorporated
by reference to Exhibit 10.2 to the Company's Registration Statement on Form 10, Commission File No. 000-33275, filed on
October 26, 2001
- (3)
- Incorporated
by reference to Exhibit 10.3 to the Company's Registration Statement on Form 10, Commission File No. 000-33275, filed on
October 26, 2001
- (4)
- Incorporated
by reference to Exhibit 10.4 to the Company's Registration Statement on Form 10, Commission File No. 000-33275, filed on
October 26, 2001
- (5)
- Incorporated
by reference to Exhibit 10.11 to the Company's Registration Statement on Form 10, Commission File No. 000-33275, filed on
October 26, 2001
- (6)
- Incorporated
by reference to Exhibit 4.1 to the Company's Current Report on Form 8-K, Commission File No. 000-33275, filed on
December 17, 2002
- (7)
- Incorporated
by reference to Exhibit 10.2 to the Company's Current Report on Form 8-K, Commission File No. 000-33275, filed on
December 24, 2002
- (8)
- Incorporated
by reference to Exhibit 10.3 to the Company's Current Report on Form 8-K, Commission File No. 000-33275, filed on
December 24, 2002
- (9)
- Incorporated
by reference to Exhibit 14 to the Company's Annual Report on Form 10-K for the year ended December 31, 2002, Commission
File No. 000-33275, filed on March 31, 2003
- (10)
- Incorporated
by reference to Exhibit 3.2 to the Company's Quarterly Report on Form 10-Q for the quarter ended June 30, 2004,
Commission File No. 000-33275, filed on August 16, 2004
- (11)
- Incorporated
by reference to Exhibit 3.3 to the Company's Quarterly Report on Form 10-Q for the quarter ended June 30, 2004,
Commission File No. 000-33275, filed on August 16, 2004
- (12)
- Incorporated
by reference to Exhibit 3.4 to the Company's Quarterly Report on Form 10-Q for the quarter ended June 30, 2004,
Commission File No. 000-33275, filed on August 16, 2004
- (13)
- Incorporated
by reference to Exhibit 3.5 to the Company's Quarterly Report on Form 10-Q for the quarter ended June 30, 2004,
Commission File No. 000-33275, filed on August 16, 2004
- (14)
- Incorporated by reference to Exhibit 3.6 to the Company's Quarterly Report on Form 10-Q for the quarter ended June 30, 2004, Commission File No. 000-33275, filed on August 16, 2004
- (15)
- Incorporated
by reference to Exhibit 10.1 to the Company's Registration Statement on Form 8-K, Commission File No. 000-33275, filed on
November 30, 2004
- (16)
- Incorporated
by reference to Exhibit 10.2 to the Company's Registration Statement on Form 8-K, Commission File No. 000-33275, filed on
November 30, 2004
- (17)
- Incorporated
by reference to Exhibit 3.1 to the Company's Annual Report on Form 10-K for the year ended December 31, 2004, Commission
File No. 000-33275, filed on March 17, 2005
- (18)
- Incorporated
by reference to Exhibit 4.1 to the Company's Annual Report on Form 10-K for the year ended December 31, 2004, Commission
File No. 000-33275, filed on March 17, 2005
- (19)
- Incorporated
by reference to Exhibit 10.1 to the Company's Current Report on Form 8-K, Commission File No. 000-33275, filed on
December 14, 2005
- (20)
- Incorporated
by reference to Exhibit 10.1 to the Company's Quarterly Report on Form 10-Q, Commission File No. 000-33275, filed
August 5, 2009
- (21)
- Incorporated
by reference to Exhibit A to the Company's Definitive Proxy Statement on Form DEF 14-A filed on April 8, 2010
- (22)
- Incorporated
by reference to Exhibit 10.1 to the Company's Quarterly Report on Form 10-Q, Commission File No. 000-33275, filed
November 8, 2011
- (23)
- Incorporated
by reference to Exhibit 10.2 to the Company's Quarterly Report on Form 10-Q, Commission File No. 000-33275, filed
November 8, 2011
- (24)
- Incorporated
by reference to Exhibit 10.1 to the Company's Current Report on Form 8-K, Commission File No. 000-33275, filed
December 16, 2011
- (25)
- Incorporated
by reference to Exhibit 10.1 to the Company's Current Report on Form 8-K, Commission File No. 000-33275, filed
October 15, 2012
- (26)
- Incorporated
by reference to Exhibit 10.2 to the Company's Current Report on Form 8-K, Commission File No. 000-33275, filed
October 15, 2012
- (27)
- Incorporated
by reference to Exhibit 10.3 to the Company's Current Report on Form 8-K, Commission File No. 000-33275, filed
October 15, 2012
- (28)
- Incorporated
by reference to Exhibit 10.1 to the Company's Quarterly Report on Form 10-Q, Commission File No. 000-33275, filed
November 7, 2012
- (29)
- Incorporated
by reference to Exhibit 10.1 to the Company's Current Report on Form 8-K, Commission File No. 000-33275, filed
December 7, 2012
- (30)
- Incorporated
by reference to Exhibit 10.1 to the Company's Current Report on Form 8-K, Commission File No. 000-33275, filed
August 20, 2013
- (31)
- Incorporated
by reference to Exhibit 10.2 to the Company's Current Report on Form 8-K, Commission File No. 000-33275, filed
August 20, 2013
- (32)
- Incorporated
by reference to Exhibit 10.1 to the Company's Current Report on Form 8-K, Commission File No. 000-33275, filed
November 21, 2013
- (33)
- Incorporated
by reference to Exhibit 10.1 to the Company's Current Report on Form 8-K, Commission File No. 000-33275, filed
December 17, 2013
- (34)
- Incorporated
by reference to Exhibit A to the Company's Definitive Proxy Statement on Form DEF 14-A filed on April 24, 2014
- (35)
- Incorporated by reference to Exhibit 10.1 to the Company's Quarterly Report on Form 10-Q, Commission File No. 000-33275, filed May 7, 2014
- (36)
- Incorporated
by reference to Exhibit 10.2 to the Company's Quarterly Report on Form 10-Q, Commission File No. 000-33275, filed
May 7, 2014
- (37)
- Incorporated
by reference to Exhibit 10.1 to the Company's Current Report on Form 8-K, Commission File No. 000-33275, filed
June 10, 2014
- (38)
- Incorporated
by reference to Exhibit 10.1 to the Company's Current Report on Form 8-K, Commission File No. 000-33275, filed
July 10, 2014
- (39)
- Incorporated
by reference to Exhibit 2.1 to the Company's Current Report on Form 8-K, Commission File No. 000-33275, filed
August 12, 2014
- (40)
- Incorporated
by reference to Exhibit 2.2 to the Company's Current Report on Form 8-K, Commission File No. 000-33275, filed
August 12, 2014
- (41)
- Incorporated
by reference to Exhibit 4.1 to the Company's Current Report on Form 8-K, Commission File No. 000-33275, filed
August 12, 2014
- (42)
- Incorporated
by reference to Exhibit 4.2 to the Company's Current Report on Form 8-K, Commission File No. 000-33275, filed
August 12, 2014
- (43)
- Incorporated
by reference to Exhibit 4.3 to the Company's Current Report on Form 8-K, Commission File No. 000-33275, filed
August 12, 2014
- (44)
- Incorporated
by reference to Exhibit 4.4 to the Company's Current Report on Form 8-K, Commission File No. 000-33275, filed
August 12, 2014
- (45)
- Incorporated
by reference to Exhibit 10.1 to the Company's Current Report on Form 8-K, Commission File No. 000-33275, filed
August 12, 2014
- (46)
- Incorporated
by reference to Exhibit 10.2 to the Company's Current Report on Form 8-K, Commission File No. 000-33275, filed
August 12, 2014
- (47)
- Incorporated
by reference to Exhibit 10.1 to the Company's Current Report on Form 8-K, Commission File No. 000-33275, filed
December 2, 2014
- (48)
- Incorporated
by reference to Exhibit 10.1 to the Company's Current Report on Form 8-K, Commission File No. 000-33275, filed
December 24, 2014
- (49)
- Incorporated
by reference to Exhibit 10.2 to the Company's Current Report on Form 8-K, Commission File No. 000-33275, filed
December 24, 2014
- (50)
- Incorporated by reference to Exhibit 10.1 to the Company's Current Report on Form 8-K, Commission File No. 000-33275, filed January 2, 2015