Attached files
| file | filename |
|---|---|
| 8-K - CURRENT REPORT - Digital Turbine, Inc. | v389307_8k.htm |
EXHIBIT 99.1

Mandalay Digital Group, Inc. Craig - Hallum Alpha Select Conference September 18, 2014

Safe Harbor Statements. Statements in this presentation concerning future results from operations, financial position, economic conditions, product releases and any other statement that may be construed as a prediction of future performance or events, including without limitation statements regarding future profitability and expected 2015 and 2016 revenues , 2015 margins, carrier (including Tier 1 carrier) relationships and order volume, future operating expenses and product deployment and ramp up are “forward - looking statements” (within the meaning of Section 27A of the Securities Act of 1933, as amended, and Section 21E of the Securities Exchange Act of 1934, as amended), which involve known and unknown risks, uncertainties and other factors which may cause actual results to differ materially from those expressed or implied by such statements. We claim the protection of the safe harbor contained in the Private Securities Litigation Reform Act of 1995 related to these forward looking statements. These factors include the inherent challenges in converting discussions with carriers into contractual relationships and deploying our key products within large enterprises such as major carriers in a timely manner, product acceptance of new products in a competitive marketplace, the potential for unforeseen or underestimated cash requirements or liabilities, the impact of currency exchange rate fluctuations on our reported GAAP financial statements, the Company’s ability as a smaller company to manage international operations, its ability given the Company’s limited resources to identify and consummate acquisitions, varying and often unpredictable levels of orders, the challenges inherent in technology development necessary to maintain the Company’s competitive advantage such as adherence to release schedules and the costs and time required for finalization and gaining market acceptance of new products, changes in economic conditions and market demand, rapid and complex changes occurring in the mobile marketplace, pricing and other activities by competitors, and other risks including those described from time to time in Mandalay Digital Group's filings on Forms 10 - K and 10 - Q with the Securities and Exchange Commission (SEC), press releases and other communications. We disclaim any intention or obligation to update or revise any forward - looking statements, whether as a result of new information, future events or otherwise, except as may be required by law. Use of Non - GAAP Financial Measures. Adjusted EBITDA is calculated as income (loss) from continuing operations before interest expense, foreign exchange gains (losses), financing and related expenses, debt discount and debt settlement expense, gain or loss on extinguishment of debt, acquisition and integration costs, income taxes, asset impairment charges, depreciation and amortization, stock - based compensation expense, change in fair value of derivatives, and accruals for discretionary bonuses. Since Adjusted EBITDA is a non - GAAP measure that does not have a standardized meaning, it may not be comparable to similar measures presented by other companies. Readers are cautioned that Adjusted EBITDA should not be construed as an alternative to net income (loss) determined in accordance with U.S. GAAP as an indicator of performance, which is the most comparable measure under GAAP. Adjusted EBITDA is used by management as an internal measure of profitability. We have included Adjusted EBITDA because we believe that this measure is used by certain investors to assess our financial performance before non - cash charges and certain costs that we do not believe are reflective of our underlying business. A reconciliation of Adjusted EBITDA to U.S. GAAP net income is expected to be included in the press release announcing the results of our fiscal quarters (including the current quarter) and full financial year, however such reconciliation to future net income is not currently available without unreasonable effort. The information that is unavailable is primarily related to tax credits or tax expense and expenses related to stock - based compensation; it is probable that when such amounts are available they will result in a GAAP net loss for our third fiscal quarter notwithstanding our expected Adjusted EBITDA results. MANDALAY DIGITAL GROUP, INC. © 2014 Mandalay Digital Group, Inc. Page 2

Digital Turbine

Topics. • The Big Picture. • Connecting Digital Turbine to the Big Picture. • Digital Turbine Updates: – Products. – Customers and Case Studies. – Metrics. • Q and A. MANDALAY DIGITAL GROUP, INC. © 2014 Mandalay Digital Group, Inc. Page 4

The Big Picture. • Smartphones. • Operating Systems. • Mobile Content. • Mobile Advertising and Applications. • Operators versus Over - the - top (OTT ). MANDALAY DIGITAL GROUP, INC. © 2014 Mandalay Digital Group, Inc. Page 5

Smartphone Users = Still lots of upside… @ 30% of 5.2B Mobile phone user base. Global smartphone quarterly unit shipments and smartphone users as % of mobile phone users, 2009 – 2013. MANDALAY DIGITAL GROUP, INC. © 2014 Mandalay Digital Group, Inc. Page 6 Source: Smartphone shipments per Morgan Stanley Research. User base per KPCB estimates based on Morgan Stanley Research and I TU data. Smartphone users and mobile phone users represent unique individuals owning mobile devices as noted on slide 8; Mobile Subscribers, based on number of connections an d m ay therefore overstate number of mobile users.

Global smartphone operating systems “Made in the USA”: 97% share from 5% eight years ago. Global smartphone operating system market share (by units shipped), 2005 versus 2010 versus 2013. MANDALAY DIGITAL GROUP, INC. © 2014 Mandalay Digital Group, Inc. Page 7 Source: 2005 and 2010 data per Gartner, 2013 data per IDC.

Mobile app revenue = Still trumps Mobile ad revenue… @ 68% of Mobile monetization. Global mobile app + advertising revenue, 2008 – 2013. MANDALAY DIGITAL GROUP, INC. © 2014 Mandalay Digital Group, Inc. Page 8 Source: Global Mobile App revenue per Strategy Analytics; comprises virtual goods, in - app advertising, subscription and download revenue. Global Mobile A dvertising revenue per PWC; comprises browser, search and classified advertising revenue.

Apps versus Mobile web. MANDALAY DIGITAL GROUP, INC. © 2014 Mandalay Digital Group, Inc. Page 9 86% of time spent on mobile on Applications. Monetization of other apps lagging Google and Facebook.

Remain optimistic about Mobile Ad spend growth… print remains way over - extended. % of time spent in media versus % of Advertising Spending, USA 2013. MANDALAY DIGITAL GROUP, INC. © 2014 Mandalay Digital Group, Inc. Page 10 Source: Advertising Spend based on IAB data for full year 2013. Print includes newspaper and magazine. $30B+ opportunity calc ula ted on assuming internet and mobile ad spend share equal their respective time spent share. Time spent share data based on eMarketer 7/13 (adjusted to exclude outdoors / classified m edi a spend). Arrows denote Y/Y shift in percent share.
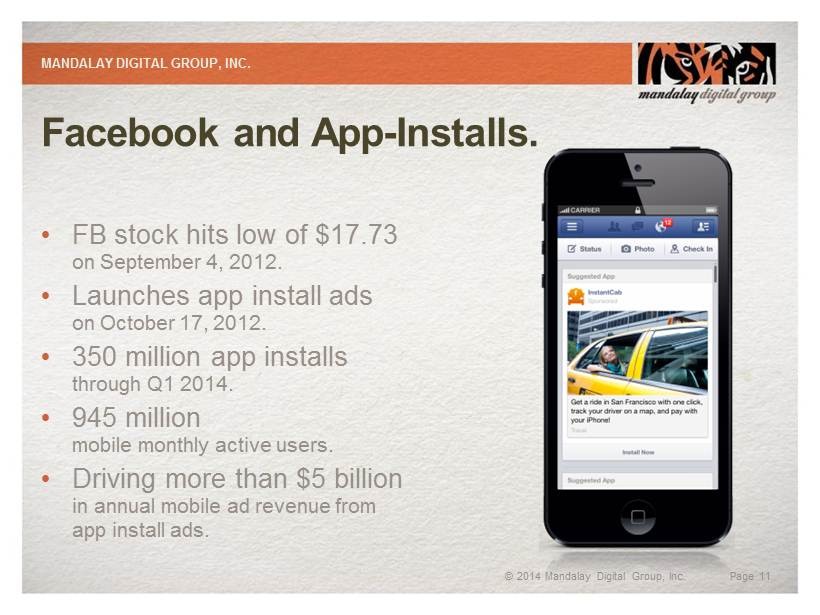
Facebook and App - Installs. • FB stock hits low of $17.73 on September 4, 2012. • Launches app install ads on October 17, 2012. • 350 million app installs through Q1 2014. • 945 million mobile monthly active users. • Driving more than $5 billion in annual mobile ad revenue from app install ads. MANDALAY DIGITAL GROUP, INC. © 2014 Mandalay Digital Group, Inc. Page 11

Mobile Operators versus Over - the - top (OTT ). • Operators over $2T in revenue. • Google, Apple, Facebook are approximately 25 % of operator revenue (including non - mobile ). • OTT competing against operator services. • Operator history of competing and monetizing mobile content distribution is poor. MANDALAY DIGITAL GROUP, INC. © 2014 Mandalay Digital Group, Inc. Page 12

Takeaways from the Big Picture. MANDALAY DIGITAL GROUP, INC. © 2014 Mandalay Digital Group, Inc. Page 13 Trend Implication Smartphones Global and g rowing Operating Systems Android dominates … for now Mobile Content Business Models About Apps AND Advertising not Apps OR Advertising Mobile Advertising Under - indexed form of media Applications versus Mobile Web Majority of time on on Apps versus Mobile Web Ecosystems Not necessarily defined by Operating System Operators versus OTT Operators most to gain and lose

How does Digital Turbine capitalize? MANDALAY DIGITAL GROUP, INC. © 2014 Mandalay Digital Group, Inc. Page 14 Trend Implication for Digital Turbine Smartphones Global opportunity, not just a US one Operating Systems Focus on Android today; however, platform architected for flexibility Mobile Content Business Models Monetize through app - installs, content sales, and payments Applications versus Mobile Web Focus on App Installs over search, browsers, etc. Ecosystems Large stakeholders want in on the growth and can’t do it on their own Operators versus OTT Operators best distribution channel (but not only)

Digital Turbine product mix. MANDALAY DIGITAL GROUP, INC. © 2014 Mandalay Digital Group, Inc. Page 15
• Pre - loads a problem for operators. • Customization. • Platform and device agnostic. • Flexible. MANDALAY DIGITAL GROUP, INC. © 2014 Mandalay Digital Group, Inc. Page 16

• Discovery. • Recommendation. • Organization. • App drawer and search. MANDALAY DIGITAL GROUP, INC. © 2014 Mandalay Digital Group, Inc. Page 17

• Sphere in the Cloud. • Full - service , all categories. • Business models changing. • Integrated billing. MANDALAY DIGITAL GROUP, INC. © 2014 Mandalay Digital Group, Inc. Page 18
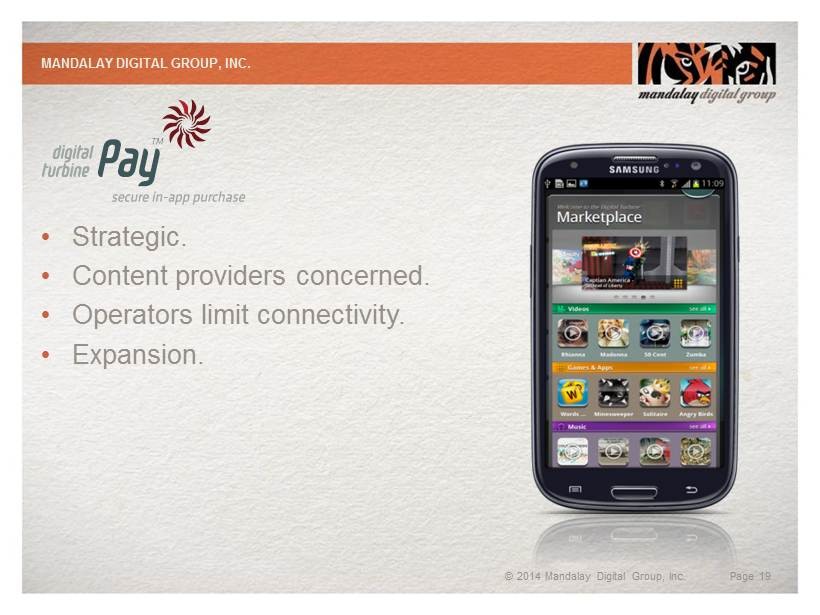
• Strategic. • Content providers concerned. • Operators limit connectivity. • Expansion. MANDALAY DIGITAL GROUP, INC. © 2014 Mandalay Digital Group, Inc. Page 19
Closing the loop: Bringing the products together. • Bundled versus a - la - carte. • Today versus tomorrow. • Google Play problem. • Revenue “double - dipping.” MANDALAY DIGITAL GROUP, INC. © 2014 Mandalay Digital Group, Inc. Page 20

Customers MANDALAY DIGITAL GROUP, INC. © 2014 Mandalay Digital Group, Inc. Page 21

Customers MANDALAY DIGITAL GROUP, INC. © 2014 Mandalay Digital Group, Inc. Page 22

Media. • > $6.5M of media sold to date for summer / fall device launches globally. • Strong demand from advertisers. • CPI ranges from $ .25 (Emerging markets) to $ 3.50 (USA ). • Across multiple categories (eg: games, travel, etc. ). • Open rates ? MANDALAY DIGITAL GROUP, INC. © 2014 Mandalay Digital Group, Inc. Page 23

Metrics: Operators and Advertisers • Ignite: – 12M by end of FY 2015. – VZ ramp Q3 and Q4. – $ 1 CPI, three - slots and 50/50 rev share is “ average of averages. ” • IQ: – 1M by end of FY 2015. – T - Mo and Vodafone launches. • Content Management and Pay: – 30M month. – 2M pay. – $3 Average ARPU. – Focus on traffic over ARPU. MANDALAY DIGITAL GROUP, INC. © 2014 Mandalay Digital Group, Inc. Page 24

Metrics: Revenue variability (Ignite and IQ) MANDALAY DIGITAL GROUP, INC. © 2014 Mandalay Digital Group, Inc. Page 25 • Baseline: 4 slots @ $2.50, 50% open rate on 1mm devices = $5 million in gross revenue • Device sell - through: – Devices increase to 1.5mm = $7.5mm in gross revenue – Devices decrease to 500k = $2.5mm in gross revenue • Number of slots: – Slots increase to 6 total = $7.5mm in gross revenue – Slots decrease to 2 total = $2.5mm in gross revenue • Open rates: – Open rates increase to 90% = $9.0mm in gross revenue – Open rates decrease to 20% = $ 2.0mm in gross revenue

Wall Street Guidance. • Fiscal 2015 (3/31/15) – Revenues of $44 million to $48 million – Gross margin mid 40% range – Adjusted EBITDA positive for full Q3 • Fiscal 2016 (3/31/16) – Revenues of $110 million to $130 million • Expected Cash OPEX increase of 10% to 15% MANDALAY DIGITAL GROUP, INC. © 2014 Mandalay Digital Group, Inc. Page 26

IR Contact: Laurie Berman PondelWilkinson Inc. Direct: 310 - 279 - 5962 Mobile: 310 - 867 - 4365 lberman@pondel.com