Attached files
| file | filename |
|---|---|
| 8-K - 8-K - PERDOCEO EDUCATION Corp | d791558d8k.htm |
 Confidential –
For Internal Use Only
Career Education
Investor Presentation
Fall 2014
“14
th
Annual BMO
Capital Markets Back
to School Education
Conference”
Exhibit 99.1 |
 Confidential –
For Internal Use Only
Cautionary Statements & Disclosures
1
This presentation contains “forward-looking statements,” as defined in Section 21E of
the Securities Exchange Act of 1934, as amended, that reflect our current expectations
regarding our future growth, results of operations, cash flows, performance and business
prospects and opportunities, as well as assumptions made by, and information currently
available to, our management. We have tried to identify forward-looking statements by using words
such as “will,” “believe,” “moving closer to,”
“opportunities,” “expect,” “estimate,” “beginning to” and similar expressions, but these words
are not the exclusive means of identifying forward-looking statements. These statements are based
on information currently available to us and are subject to various risks, uncertainties, and
other factors, including, but not limited to, those discussed in Item 1A,“Risk
Factors” of our Annual Report on Form 10-K for the year ended December 31, 2013 that
could cause our actual growth, results of operations, financial condition, cash flows, performance and
business prospects and opportunities to differ materially from those expressed in, or implied
by, these statements. Except as expressly required by the federal securities laws, we undertake
no obligation to update such factors or to publicly announce the results of any of the
forward-looking statements contained herein to reflect future events, developments, or changed
circumstances or for any other reason.
Certain financial information is presented on a non-GAAP basis. The Company believes
it is useful to present non-GAAP financial measures which exclude certain significant items
as a means to understand the performance of its core business. As a general matter, the
Company uses non-GAAP financial measures in conjunction with results presented in
accordance with GAAP to help analyze the performance of its core business, assist with preparing the
annual operating plan, and measure performance for some forms of compensation. In addition, the
Company believes that non-GAAP financial information is used by analysts and others in the
investment community to analyze the Company's historical results and to provide estimates of
future performance and that failure to report non-GAAP measures could result in a misplaced
perception that the Company's results have underperformed or exceeded expectations. The most directly
comparable GAAP information and a reconciliation between the non-GAAP and GAAP figures are
provided at the end of this presentation, and this presentation (including the reconciliation)
has been posted to our website. |
 Confidential –
For Internal Use Only
Agenda
2
•
Education Industry Dynamics
•
Evolution of Career Education
•
Main Objectives of Turnaround Strategy and Progress Report
•
Key Financial Metrics |
 Confidential –
For Internal Use Only
U.S. Macro Education Market Drivers
3
•
U.S. population has low level of educational attainment.
•
Approximately
3
million
jobs
are
unfilled
due
to
a
worker
skills
gap
(1)
.
•
Proprietary segment serves an under served demographic with a higher
concentration of minority students and older students than attend traditional
schools.
•
Due to student dependency on tuition assistance (Title IV funds), the
proprietary segment is highly regulated by the Department of Education,
Accreditors and States.
(1)
Source: Bureau of Labor Statistics |
 Confidential –
For Internal Use Only
Earnings Power of Postsecondary Education
4
($ 000)
•
Meaningful correlation between post secondary education and lifetime
earnings. •
For-profit college students that earned a Bachelor’s degree earn an
average salary greater
than
those
students
that
earned
their
degrees
from
public
and
private
colleges
(2)
.
(2
) National Center for Education Statistics issued a report in July 2014 which
included data from students who earned a Bachelor’s Degree in
2007-2008. The data from the report was derived from surveys conducted approximately four year’s post graduation.
(1)
Georgetown University Center on Education and the Workforce (June 2010).
$1,198
$1,767
$2,240
$2,255
$3,380
$3,837
$0
$500
$1,000
$1,500
$2,000
$2,500
$3,000
$3,500
$4,000
$4,500
High School
Dropout
High School
Graduate
Some College
Associate's
Degree
Bachelor's Degree
Master's Degree
Average Lifetime Earnings
(1) |
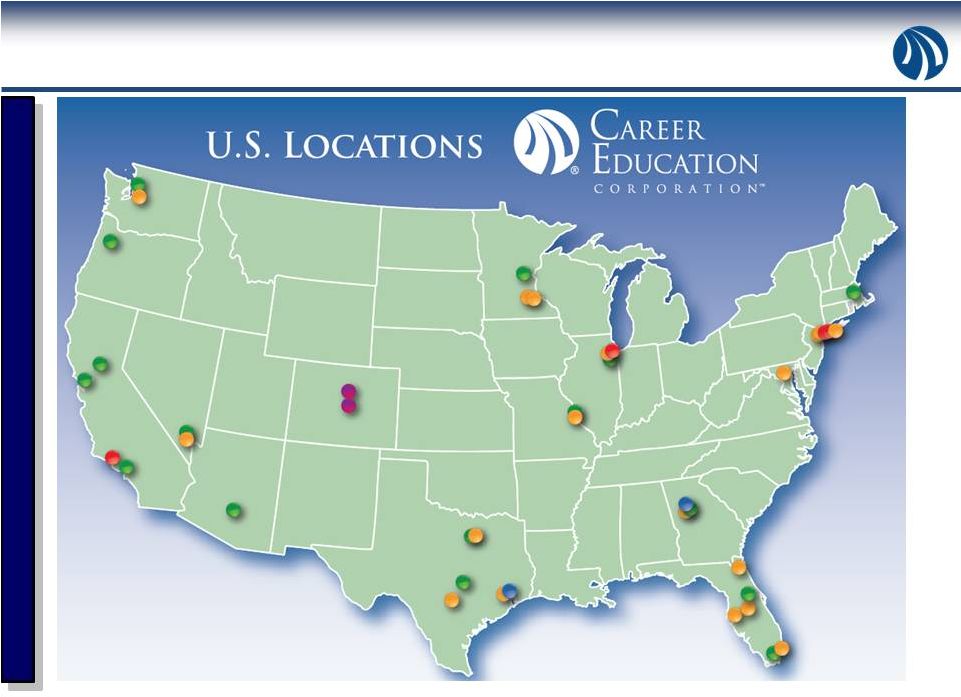
 Confidential –
For Internal Use Only
Career Education Corporation
5
Career Education is the parent of two regionally accredited Universities
with programs in business studies, information systems and technology,
and
criminal
justice
(primarily
offered
online
and
at
four
small
ground-
based campuses), two regionally accredited Career Schools (Briarcliffe
and Harrington), fifteen nationally accredited Culinary Schools (as well
as one regionally accredited school) and eighteen nationally accredited
allied health, technology and art & design schools.
|
 Confidential –
For Internal Use Only
Diverse Portfolio of Career Oriented Schools
6
University
–
Beginning to see favorable business
trends. Goal is to generate modest total student
enrollment growth.
Culinary Arts
–
Recent total student enrollment
growth due to Associate-Degree. Strategy in
place to stabilize performance.
Career Colleges
–
Completed brand
consolidation and expansion of campus mission
statements. In process of adding new programs
to better serve students and accommodate local
workforce demands. Strategy in place to
stabilize performance. |
 Confidential –
For Internal Use Only
Diverse Portfolio of Career Oriented Schools
Ongoing operations. Excludes campuses in “teach out.” |
 Confidential –
For Internal Use Only
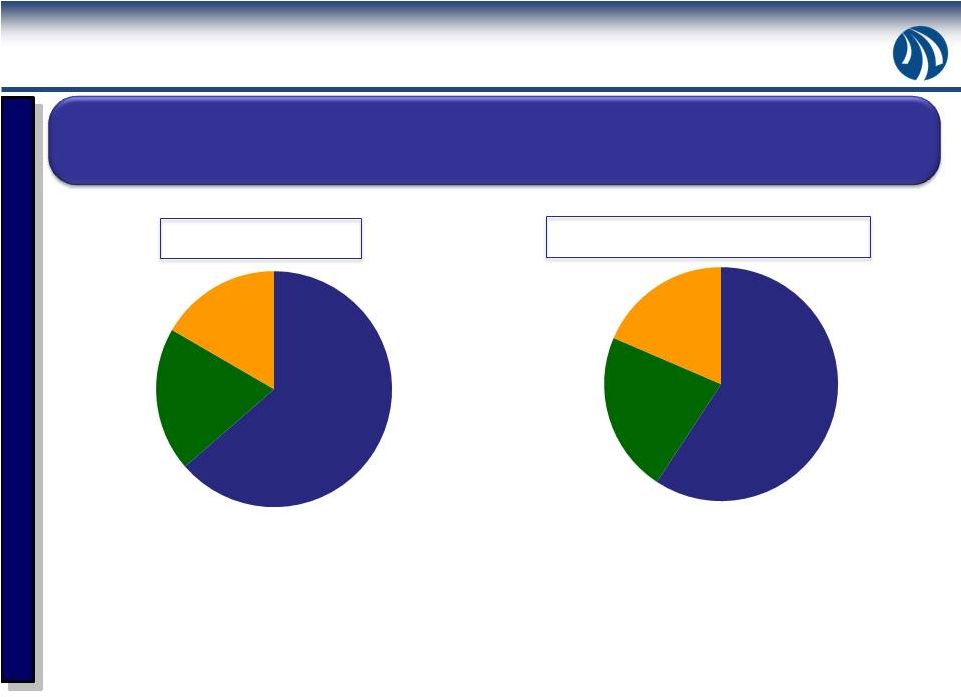
Business Overview
8
Dynamic educational services company committed to quality, career-focused
learning to a diverse student population through online, on-ground and hybrid
learning program offerings.
•
Approximately 30,250 students, or 63% of total enrollments, are online
students. •
Focus on improving the educational experiences and outcomes of students and
helping bridge
the
gap
between
learners
seeking
new
skills
and
employers
looking
for
talent
to
help them succeed.
•
Turnaround process underway, led by seasoned executive management team with
extensive industry experience.
University,
30,600
Career
Colleges,
9,500
Culinary
Arts, 8,000
Enrollments
of
48,100
As of 6/30/14
University,
$549
Career
Colleges,
$206
Culinary
Arts, $172
TTM
Revenue
of
$927
($
in
millions)
Twelve months ended 6/30/14 |
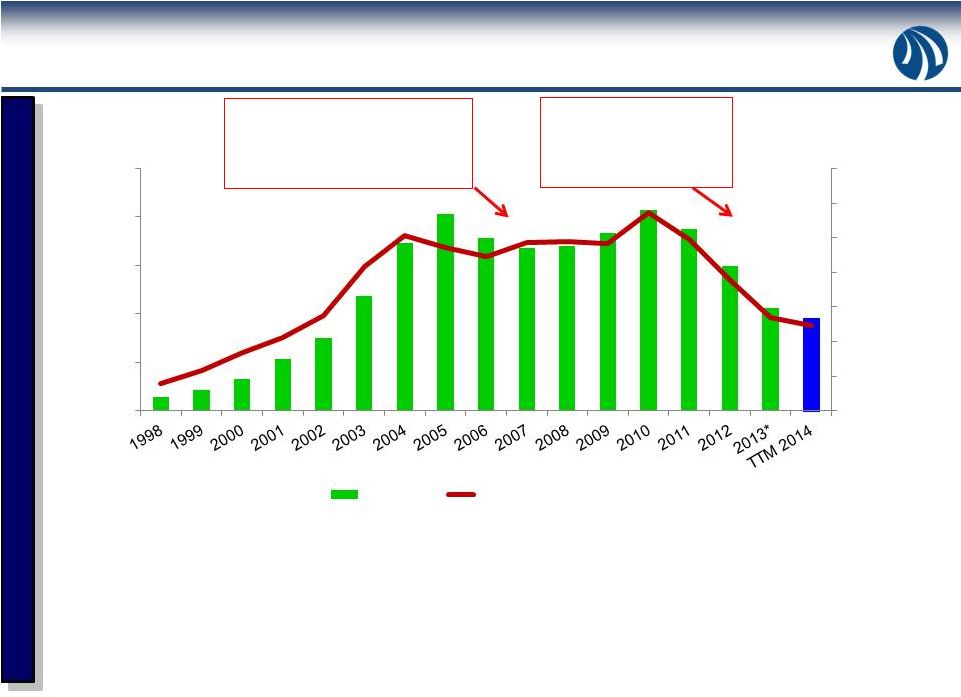 Confidential –
For Internal Use Only
A Summary of Career Education’s History
9
•
Company founded in 1994 and went public in 1998.
•
Business built through a series of acquisitions.
•
Company
and
industry
have
experienced
two
market
downturns
–
the
most
recent
one
being more severe.
Revenue ($ millions)
Heightened regulatory
environment, placement rate
investigation, economic and
competitive pressures and
negative press.
Heightened regulatory environment
(including AIU probationary status that
was lifted late in 2007), economic and
competitive pressures and negative
press.
# of Students
* A portion of the 2013 decrease is due to the Company selling its International
segment. -
20,000
40,000
60,000
80,000
100,000
120,000
140,000
$0
$500
$1,000
$1,500
$2,000
$2,500
Revenue
Total Student Enrollments |
 Confidential –
For Internal Use Only
Key Investor Objectives to Turnaround Strategy
10
•
Strengthen Academic Outcomes, Enhance Regulatory Compliance
and Simplify Business Model.
•
Generate Modest University Total Student Enrollment Growth.
•
Stabilize Career School Enrollments.
•
Reduce Organizational Cost Structure.
•
Successfully Complete the Teach Out of Transitional Schools.
We also regularly evaluate the Company’s assets to determine where
best to deploy our capital and structure our organization to provide the
greatest opportunity for long-term, sustainable shareholder growth.
|
 Confidential –
For Internal Use Only
Improving Academic Outcomes, Enhanced Regulatory
Compliance and Simplification
11
•
Improvement
in
the
rate
at
which
University
students
continue
on
to
their second class.
•
For the 2013 cohort, more than 90% of our 38 nationally-accredited
ACICS campuses that are not in teach out reported higher placement
rates when compared to the 2012 reporting year.
•
HLC acted to continue their regional accreditation of AIU and CTU in
2014 and 2013, respectively.
•
Consolidation of Health and Design & Technology programs.
•
Brand
consolidation
–
combining
legacy
Sanford-Brown,
IADT
and
Brown College into new Sanford-Brown with an expanded mission
statement. |
 Confidential –
For Internal Use Only
Generate Modest University Total Student Enrollment Growth
12
(4,900)
(4,200)
(3,300)
(3,000)
(1,400)
Change in Total Student Enrollments vs. Prior Year Quarter
Q2 2013
Q3 2013
Q4 2013
Q1 2014
Q2 2014
(2,000)
(1,300)
(700)
(800)
(600)
(2,900)
(2,900)
(2,600)
(2,200)
(800)
CTU
AIU |
 Confidential –
For Internal Use Only
Stabilize
Career
School
Enrollments
-
Total
Student
Enrollments –
Career Schools
13
20,300
18,500
18,900
20,200
17,500
Total Student Enrollments
10,800
12,300
11,000
11,800
9,500
7,700
8,000
7,900
8,400
8,000
2Q 2013
3Q 2013
4Q 2013
1Q 2014
2Q 2014
Career Colleges
Culinary Arts |
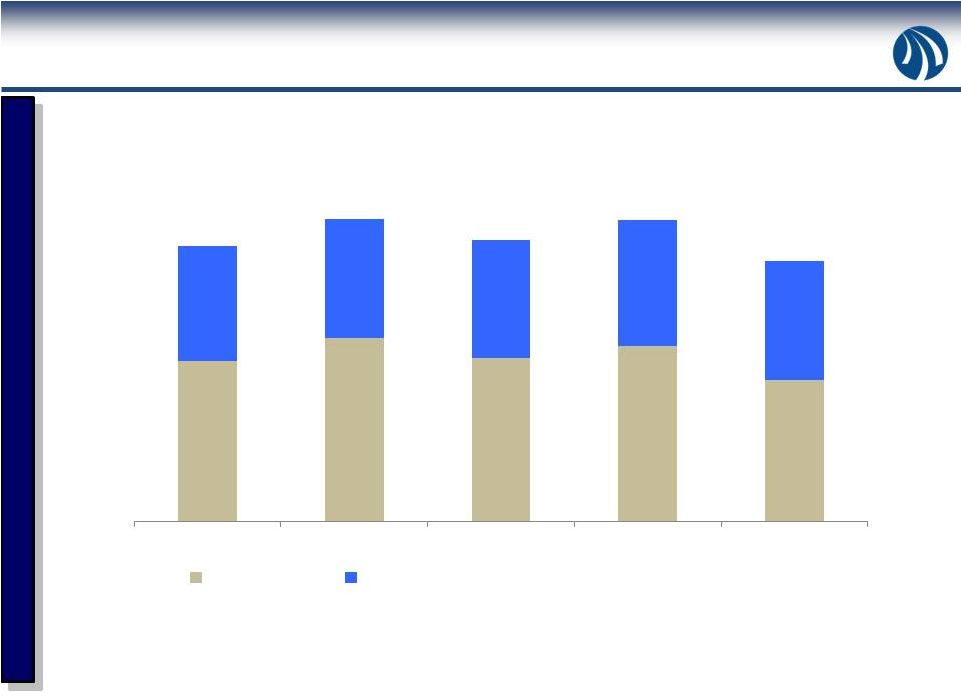
 Confidential –
For Internal Use Only
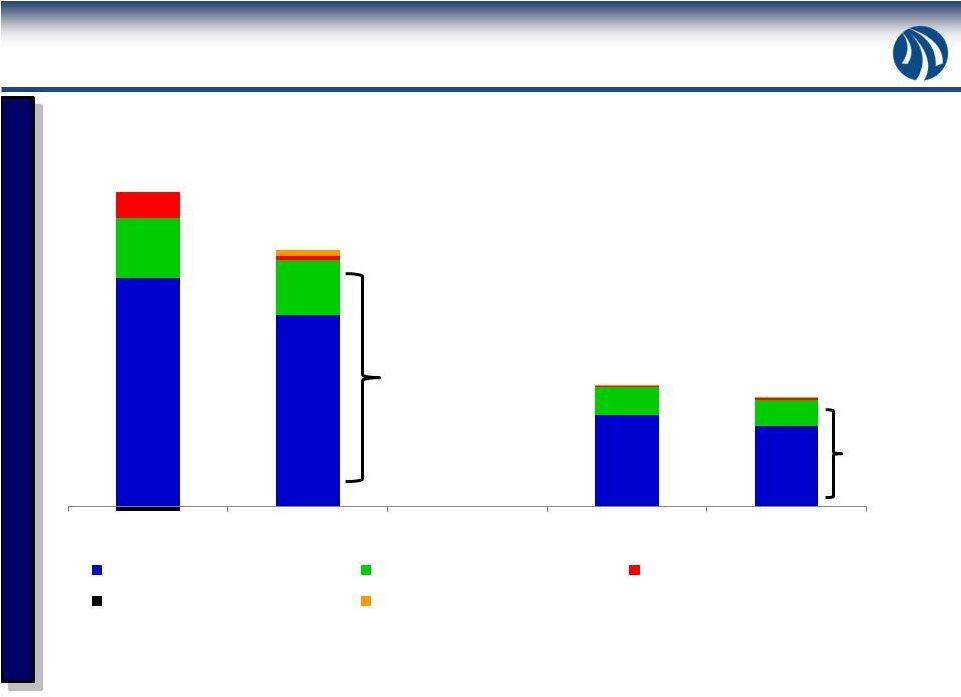
Operating Expenses ($ millions)
Reduce
Organizational
Cost
Structure
–
Progress
Underway
14
$1,542
$1,272
$606
$546
Reduced by
$212 million
Reduced by
$63 million
FY 2012 & FY 2013 data as reported in the Company’s 2013 10-K and
based on schools that were in continuing operations at 12/31/13. YTD
2Q 2013 and YTD 2Q 2014 data as reported in the Company’s 2Q 2014 10-Q and based on schools that were
in continuing operations at 6/30/14.
$1,133
$951
$455
$403
$302
$272
$139
$128
FY 2012
FY 2013
YTD 2Q 2013
YTD 2Q 2014
Other Operating Expenses
Advertising
Impairments
Insurance Recovery
Legal Settlements |
 Confidential –
For Internal Use Only
Reduce Organizational Cost Structure -
Additional Opportunities
15
•
Educational services & facilities
-
Additional opportunity to optimize real estate
footprint.
•
Advertising
–
Generate efficiencies / lower lead generator volumes.
•
Administrative expenses
-
As a percentage of revenue, Career Education
administrative expenses are approximately 30%.
–
While industry comparisons can fluctuate in terms of classification of expenses,
the industry average is closer to 20%-22%.
2Q 2014
% of
Revenue
YTD 2Q
2014
% of
Revenue
Total Revenue
$229,292
$470,659
OPERATING EXPENSES
Educational services and facilities
$80,399
35.1%
$162,665
34.6%
General & Administrative:
Advertising
$57,314
25.0%
$127,884
27.2%
Admissions
$30,806
13.4%
$63,669
13.5%
Administrative
$66,276
28.9%
$143,476
30.5%
Bad Debt
$6,474
2.8%
$12,263
2.6%
Total G&A
$160,870
70.2%
$347,292
73.8% |
 Confidential –
For Internal Use Only
Successfully Complete Teach Out of Transitional Schools
16
•
Transitional Schools operating losses in FY 2013 were approximately ($77) million
which was primarily cash outflow.
•
This fiscal year (through June 2014), we closed 16 campuses, divested one campus
and are scheduled to close an additional 4 campuses by the end of this
year. •
The 17 campuses that have been closed or divested as of June 2014 generated
approximately ($43) million of operating losses in FY 2013.
32
32
30
21
13
9
5
1
0
2Q 2013
3Q 2013
4Q 2013
1Q 2014
2Q 2014
4Q 2014
4Q 2015
4Q 2016
1Q 2017
# of Transitional Schools |
 Confidential –
For Internal Use Only
Financial Overview : Profitable University Segment
17
•
CTU financially strong with trailing twelve month operating margin of 19.7%.
•
AIU moving closer to break-even performance.
University Revenue & Operating Income -
(in $000)
Trailing 12-Months
Revenue and
Operating Income
$549,358
$134,726
$146,492
Quarter Operating
Income
$52,562
$19,626
$18,083
Quarter Revenue
($100,000)
$0
$100,000
$200,000
$300,000
$400,000
$500,000
$600,000
2Q 2014
2Q 2014
2Q 2014
2Q 2013
2Q 2014
2Q 2013
CTU
AIU |
 Confidential –
For Internal Use Only
Financial Overview : Improving Adjusted EBITDA
18
Excludes significant items as disclosed in the Non-GAAP reconciliation at the end of these
slides. •
Ongoing EBITDA exhibits seasonality fluctuations due to higher advertising
investments in 1Q and 3Q.
Trailing Twelve Month (TTM)
Adjusted EBITDA –
Ongoing
Operations (in $000)
Quarterly Adjusted EBITDA –
Ongoing Operations (in $000)
TTM 2Q
2014
TTM 1Q
2014
2Q 2014
2Q 2013
1Q 2014
4Q 2013
($35,346)
($44,083)
($3,139)
($11,876)
($14,103)
$139
($18,243)
3Q 2013 |
 Confidential –
For Internal Use Only
Financial Overview : Strong Cash Position
19
(In 000’s)
(1) Balances presented above are quarter end balances and include both Continuing and
Discontinued Operations. (2) The increase in 4Q 2013 is attributed to proceeds
from the sale of the Company’s International segment. $363,099
(2)
•
Cash projection for fiscal year 2015 assumes rolling three-month average cash
balance of not less than $190 million, excluding any payments for real
estate buyout transactions or other significant unplanned cash
payments. $241,840
$227,515
$315,661
$274,617
$0
$50,000
$100,000
$150,000
$200,000
$250,000
$300,000
$350,000
$400,000
2Q 2013
3Q 2013
4Q 2013
1Q 2014
2Q 2014
Cash, Cash Equivalents and Short-Term Investments
(1) |
 Confidential –
For Internal Use Only
Key Investment Highlights
20
•
Turnaround strategy in place with execution progressing.
•
Favorable industry dynamics in terms of market size and employer
demand for skilled workers.
•
Diverse business model with both online and campus based portfolio
of assets.
•
Strong balance sheet and cash position.
•
Dedicated management team with extensive industry experience.
|
 Confidential –
For Internal Use Only
Reconciliation of GAAP to Non-GAAP Items
21
Adjusted EBITDA
Q2 2014
Q1 2014
Q4 2013
Q3 2013
Q2 2013
Pre-tax loss from continuing operations
(33,746)
$
(41,350)
$
(45,319)
$
(56,411)
$
(49,300)
$
Transitional Schools operating loss
(2)
8,841
7,308
11,227
9,004
9,716
Interest (income) expense, net
(177)
(25)
65
16
(548)
Loss (gain) on sale of business
-
-
(68)
39
222
Depreciation and amortization
(3)
12,799
13,305
14,062
14,399
14,749
Stock based compensation
(3)
1,020
1,341
1,580
1,713
1,631
Legal settlements
(3) (4)
1,600
5,850
17,000
300
8,300
7,403
74
4,516
11,513
3,966
(879)
(606)
(2,924)
1,184
(612)
Adjusted EBITDA--Ongoing Operations
(2)
(3,139)
$
(14,103)
$
139
$
(18,243)
$
(11,876)
$
Adjusted EBITDA per diluted share
(0.05)
$
(0.21)
$
0.00
$
(0.27)
$
(0.18)
$
Pre-tax loss from discontinued operations
(10,964)
$
(16,573)
$
119,133
$
(20,290)
$
(16,287)
$
Transitional Schools operating loss
(2)
(8,841)
(7,308)
(11,227)
(9,004)
(9,716)
Loss (gain) on sale of business
311
-
(130,109)
-
-
International Schools operating (income) loss
(7)
-
-
(11,434)
7,608
3,659
Interest (income) expense, net
-
-
(51)
(22)
(14)
Depreciation and amortization
(8)
1,595
2,126
2,364
2,552
2,818
Legal settlements
(8)
-
-
-
-
1,700
51
(7)
2,467
72
-
1,436
3,099
5,766
(3,092)
(2,611)
(16,412)
$
(18,663)
$
(23,091)
$
(22,176)
$
(20,451)
$
Adjusted EBITDA per diluted share
(0.24)
$
(0.28)
$
(0.35)
$
(0.33)
$
(0.31)
$
Asset impairments
(3) (5)
Unused space charges
(3) (6)
Asset impairments
(8)
Unused space charges
(6) (8)
CAREER EDUCATION CORPORATION AND SUBSIDIARIES
(In thousands, except per share amounts)
(2)
Adjusted EBITDA--Transitional and Discontinued Operations UNAUDITED
RECONCILIATION
OF
GAAP
TO
NON-GAAP
ITEMS
(1) |
 Confidential –
For Internal Use Only
Reconciliation of GAAP to Non-GAAP Items –
con’t
22
(1)
(2)
(3)
Quarterly amounts relate to ongoing operations, which excludes
Transitional Schools. (4)
Legal
settlement
amounts
are
net
of
insurance
recoveries
and
are
recorded
within
the
following
segments:
Q2 2014
Q1 2014
Q4 2013
Q3 2013
Q2 2013
CTU
-
$
(900)
$
1,300
$
-
$
-
$
Career Colleges
-
-
200
300
8,300
Culinary Arts
2,000
3,000
15,500
-
-
Corporate & Other
(400)
3,750
-
-
-
Total
1,600
$
5,850
$
17,000
$
300
$
8,300
$
(5)
(6)
(7)
(8)
The Company believes it is useful to present non-GAAP financial
measures which exclude certain significant items as a means to understand the performance of its core business. As a general
matter,
the
Company
uses
non-GAAP
financial
measures
in
conjunction
with
results
presented
in
accordance
with
GAAP
to
help
analyze
the
performance
of
its
core
business,
assist
with
preparing
the
annual
operating
plan,
and
measure
performance
for
some
forms
of
compensation.
In
addition,
the
Company
believes
that
non-GAAP
financial
information
is
used
by
analysts
and
others
in
the
investment
community
to
analyze
the
Company's
historical
results
and
to
provide
estimates
of
future
performance
and
that
failure
to
report
non-GAAP
measures
could
result
in
a
misplaced perception that the Company's results have
underperformed or exceeded expectations. Asset
impairments
primarily
relate
to
trade
name
impairment
charges
within
Culinary
Arts
of
$7.4
million,
$10.7
million
and
$2.3
million
which
were
recorded
during
the
second
quarter
of
2014,
third
quarter
of
2013
and
the
second
quarter
of
2013,
respectively,
and
within
Career
Colleges
of
$1.7
million
during
the
second
quarter
of
2013.
Unused
space
charges
represent
the
net
present
value
of
remaining
lease
obligations
less
an
estimated
amount
for
sublease
income
as
well
as
the
subsequent
accretion
of
these
charges.
The International Schools segment was sold during the fourth quarter of
2013. As such, management excludes operations from the International Schools when assessing results and trends of
Transitional Schools and Discontinued Operations.
Quarterly amounts relate to Transitional Schools and Discontinued
Operations, excluding International. We
believe
Adjusted
EBITDA
allows
us
to
compare
our
current
operating
results
with
corresponding
historical
periods
and
with
the
operational
performance
of
other
companies
in
our
industry because it does not give effect to potential differences caused
by items we do not consider reflective of underlying operating performance. We also present Adjusted EBITDA because
we believe it is frequently used by securities analysts, investors and
other interested parties as a measure of performance. In evaluating Adjusted EBITDA, investors should be aware that in the
future we may incur expenses similar to the adjustments presented above.
Our presentation of Adjusted EBITDA should not be construed as an inference that our future results will be
unaffected by expenses that are unusual, non-routine or
non-recurring. Adjusted EBITDA has limitations as an analytical tool, and you should not consider it in isolation, or as a substitute for
net
income
(loss),
operating
income
(loss),
or
any
other
performance
measure
derived
in
accordance
and
reported
under
GAAP
or
as
an
alternative
to
cash
flow
from
operating
activities
or
as
a measure of our liquidity.
Non-GAAP
financial
measures
when
viewed
in
a
reconciliation
to
corresponding
GAAP
financial
measures,
provides
an
additional
way
of
viewing
the
Company's
results
of
operations
and
the
factors
and
trends
affecting
the
Company's
business.
Non-GAAP
financial
measures
should
be
considered
as
a
supplement
to,
and
not
as
a
substitute
for,
or
superior
to,
the
corresponding
financial results presented in accordance with GAAP.
Management assesses results of
operations for ongoing operations, which excludes Transitional Schools,
separately from Transitional Schools. As schools within the Transitional Schools
segment
are
fully
taught-out,
these
schools
will
be
recast
as
components
of
Discontinued
Operations.
As
a
result,
management
views
adjusted
EBITDA
from
ongoing
operations
separately
from Transitional Schools and Discontinued Operations to assess results
and make decisions. Accordingly, Transitional Schools operating loss is added back to pre-tax loss from continuing
operations and subtracted from pre-tax loss from discontinued
operations. |