Attached files
| file | filename |
|---|---|
| 8-K - FORM 8-K - SHORE BANCSHARES INC | v389338_8k.htm |

Nasdaq: SHBI FIG Partners 10 th Annual Bank CEO Forum September 15 - 16, 2014

Safe Harbor Regarding Forward - Looking Statements This presentation may contain “forward - looking statements” within the meaning of the Private Securities Litigation Reform Act of 1995 regarding Shore Bancshares, Inc. (the “Company”). Forward - looking statements often include the words “believes,” “expects,” “anticipates,” “estimates,” “forecasts,” “intends,” “plans,” “targets,” “potentially,” “probably,” “projects,” “outlook” or s imi lar expressions or future or conditional verbs such as “may,” “will,” “should,” “would” and “could.” These forward - looking statements are subjec t to known and unknown risks, uncertainties and other factors that could cause the actual results to differ materially from the fo rwa rd - looking statements, including, without limitation, the following: the strength of the United States economy in general and the streng th of the local economies in which the Company conducts operations; fluctuations in interest rates and in real estate values; monetary and fiscal policies of the Board of Governors of the Federal Reserve System and the U.S. Government and other governmental initiatives a ffe cting the financial services industry; the risks of lending and investing activities, including changes in the level and direction of loan delinquencies and write - offs and changes in estimates of the adequacy of the allowance for loan losses; the Company’s ability to access cost - effective funding; the timely development of and acceptance of the Bank’s new products and services and the perceived overa ll value of these products and services by users, including the features, pricing and quality compared to competitors’ products and services; expected cost savings, synergies and other benefits from the Company’s merger and acquisition activities might not be realize d w ithin the anticipated time frames or at all, and costs or difficulties relating to integration matters, including but not limited to cu sto mer and employee retention, might be greater than expected; fluctuations in real estate values and both residential and commercial re al estate market conditions; demand for loans and deposits in the Company’s market areas; legislative or regulatory changes that advers ely affect the Company’s business; results of examinations of the Company and its subsidiaries by their regulators, including the possib ili ty that such regulators may, among other things, take regulatory enforcement action or require the Company’s bank subsidiaries to inc rea se their reserves for loan losses or to write - down assets; the impact of technological changes; and the Company’s success at managing the risks involved in the foregoing. Any forward - looking statements are based upon management’s beliefs and assumptions at the time they a re made. The Company undertakes no obligation to publicly update or revise any forward - looking statements or to update the reasons why ac tual results could differ from those contained in such statements, whether as a result of new information, future events or otherw ise . In light of these risks, uncertainties and assumptions, the forward - looking statements discussed might not occur, and you should not put undue reliance on any forward - looking statements. Important Statements

Management Team 3 Years Years in with Name Title/Function Entity Banking Company L. Lloyd "Scott" Beatty, Jr.President and Chief Executive Officer SHBI 22 9 George S. Rapp EVP and Chief Financial Officer SHBI 35 1 Patrick M. Bilbrough President and Chief Executive Officer Talbot Bank 18 3 F. Winfield Trice, Jr. President and Chief Executive Officer CNB 36 7 Kathleen A. Kurtz SVP and Senior Credit Officer Talbot Bank 29 1 Charles E. Ruch, Jr. SVP/Senior Credit Officer CNB 25 7 TOTAL 165 28

Financial Summary As of June 30, 2014 4 Total Assets: $1,064.8 million Gross Loans: $709.7 million Total Deposits: $913.5 million Total Shareholder’s Equity: $137.5 million Tangible Common Equity: $124.2 million Tangible Book value per Share: $9.84 Branches: Depository 18 Insurance and Wealth Management 6 Shares Outstanding (June 30, 2014): 12,614,943 Closing Stock Price (June 30, 2014) $9.01 Market capitalization (June 30, 2014) $113.7 million Price/Tangible Book value per Share: 92% Headquarters: Easton, Maryland
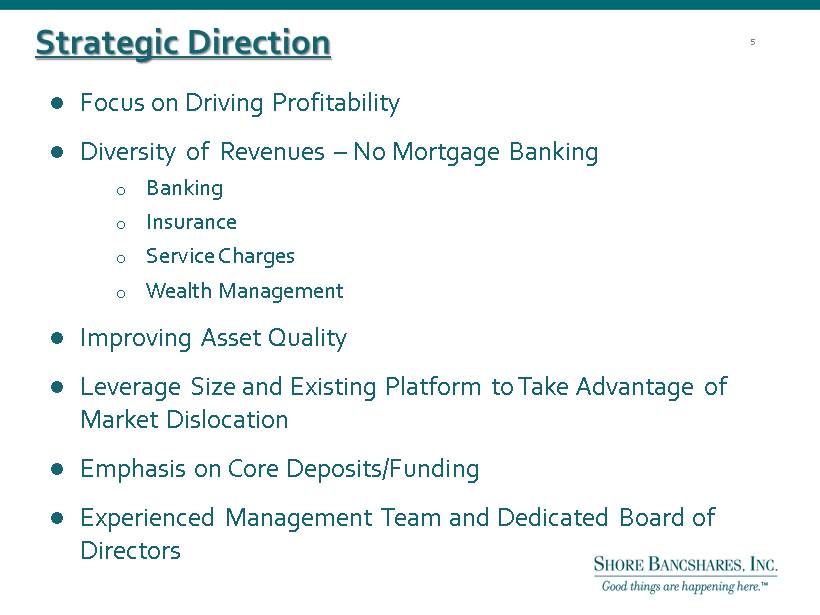
Strategic Direction 5 Focus on Driving Profitability Diversity of Revenues – No Mortgage Banking o Banking o Insurance o Service Charges o Wealth Management Improving Asset Quality Leverage Size and Existing Platform to Take Advantage of Market Dislocation Emphasis on Core Deposits/Funding Experienced Management Team and Dedicated Board of Directors

Shore Bancshares’ Community of Companies SHBI CNB ($475mm of Assets) Wye Financial & Trust 1 The Talbot Bank of Easton Maryland ($613mm of Assets) Dover Street Realty Inc. Avon - Dixon Agency LLC (Retail) 2 Jack Martin & Associates Inc. Mubell Finance LLC Elliott Wilson Insurance, LLC 1. Wye Financial & Trust is a division of CNB 2. Freestate & Son is a division of Avon Dixon Agency LLC 6
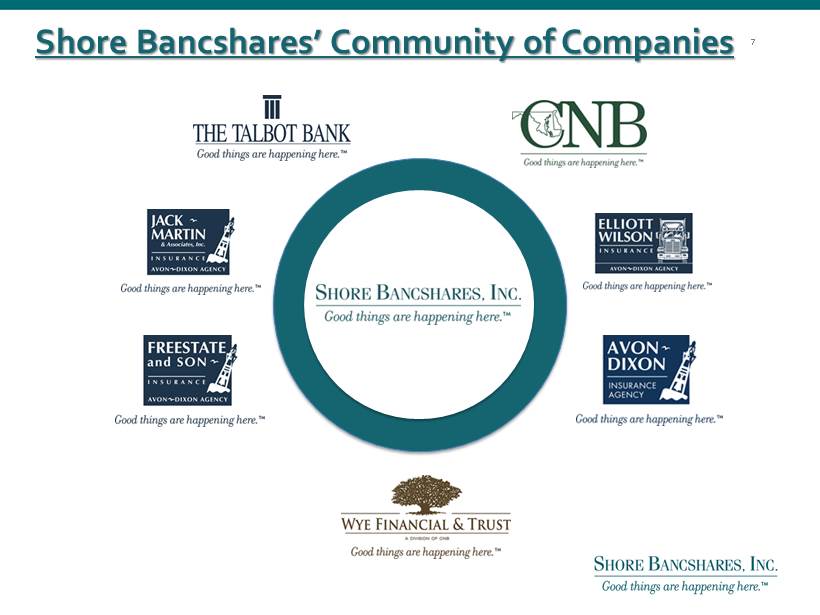
Shore Bancshares’ Community of Companies 7

24 locations 18 branches 6 non - bank offices 8 Branch Map Dover

Deposit Market Share: Delmarva Peninsula NOTE: Delmarva Peninsula defined as Maryland counties of Kent, Queen Anne’s, Talbot, Caroline, Dorchester, Wicomico, Somerse t, and Worcester; and Delaware counties of Kent and Sussex; Deposit market share excludes Discover Financial Services Data as of June 30, 2013 and adjusted for all M&A transactions. SOURCE : FDIC Mkt. In-Mkt. HQ Deposits as of '13 Market Rank Rank Ticker Company Name City (HQ) State Branches June 30, 2013 ($mm) Share (%) 1 -- PNC PNC Financial Services Group Inc. Pittsburgh PA 47 $2,027 17.6% 2 -- MTB M&T Bank Corp. Buffalo NY 33 1,801 15.7% 3 1 SHBI Shore Bancshares Inc. Easton MD 18 922 8.0% 4 2 WSFS WSFS Financial Corp. Wilmington DE 18 601 5.2% 5 -- BBT BB&T Corp. Winston-Salem NC 15 438 3.8% 6 3 - HSB Bancorp Inc. Hebron MD 11 420 3.7% 7 -- WFC Wells Fargo & Co. San Francisco CA 4 409 3.6% 8 4 - Queenstown Bancorp of Maryland Inc. Queenstown MD 8 406 3.5% 9 -- BAC Bank of America Corp. Charlotte NC 7 395 3.4% 10 5 DBCP Delmar Bancorp Salisbury MD 13 382 3.3% 11 -- RBS Royal Bank of Scotland Group Plc Edinburgh - 8 372 3.2% 12 6 TYCB Calvin B. Taylor Bankshares Inc. Berlin MD 10 362 3.1% 13 7 - Farmers Bank of Willards Willards MD 11 293 2.6% 14 8 - CB Financial Corp. Rehoboth Beach DE 7 283 2.5% 15 9 - First Shore Federal Savings and Loan Association Salisbury MD 8 263 2.3% 16 -- FULT Fulton Financial Corp. Lancaster PA 6 244 2.1% 17 -- STI SunTrust Banks Inc. Atlanta GA 7 241 2.1% 18 10 PSBP PSB Holding Corp. Preston MD 8 241 2.1% 19 11 - Bank of Ocean City Ocean City MD 6 208 1.8% 20 12 PEBC Peoples Bancorp Inc. Chestertown MD 7 201 1.8% 500 Other Market Participants (16) 37 $981 8.5% Total 289 $11,490 In-Market Participants - (DE & MD) (21) 143 $5,183 45.1% Out of Market Participants (15) 146 $6,307 54.9% 9

Competitors ’ Branch Proximity Report Within 1 Mile Within 5 Miles Competing Branches Deposits in Competing Branches Competing Branches Deposits in Competing Branches Shore Bancshares, Inc . 18 922,107 Money Centers/Regionals 27 1,210,265 42 2,020,912 Community Banks 25 851,468 46 2,063,467 TOTALS 52 2,061,733 88 4,084,379 SOURCE : FDIC 10

Loan Portfolio (Dollar Value in Thousands) As of June 30, 2014 Loan Type Balance % of Total Construction $ 68,348 9.6% Residential Real Estate 277,184 39.1% Commercial Real Estate 297,762 41.9% Commercial 56,492 8.0% Consumer 9,873 1.4% Total $ 709,659 100.0% 11 Commercial Real Estate 42% Commercial 8% Consumer 1% Construction 10% Residential Real Estate 39% 11

Improving Credit Quality As of or for 3 Months Ended 12/31/2009 12/31/2010 12/31/2011 12/31/2012 12/31/2013 6/30/2014 NON - PERFORMING ASSETS $36,474 Nonaccrual Loans $16,302 $36,238 $51,370 $18,147 $15,176 90+ or More Days Past Due 7,425 4,702 2,723 460 270 5 Other Real Estate Owned 2,572 3,702 9,385 7,659 3,779 4,201 Total Non - Performing Assets 26,299 44,642 63,478 44,593 22,196 19,382 Performing TDRs 1,722 24,957 25,208 52,353 26,088 25,402 Total NPAs + TDRs $28,021 $69,599 $88,686 $96,946 $48,284 $44,784 NPAs / Assets (%) 2.27 3.95 5.48 3.76 2.11 1.82 NPAs + TDRS / Assets (%) 2.42 7.12 7.66 8.18 4.58 4.21 RESERVES Loan Loss Reserve $10,876 $14,227 $14,288 $15,991 $10,725 $9,076 Reserves / Gross Loans (%) 1.19 1.59 1.70 2.04 1.51 1.28 Reserves / NPLs (%) 45.84 34.75 26.41 43.30 58.23 59.80 Reserves / NPLs+TDRs (%) 42.74 21.59 18.02 17.91 24.10 22.37 NET CHARGE - OFFS Net Charge - Offs $7,430 $17,768 $19,409 $26,042 $33,050 $1,943 NCOs / Avg Loans (Annualized ) (%) 0.81 1.96 2.22 3.20 4.32 1.10 12

Credit Trends: NPAs & TDRs (Dollars in thousands) December 31 , June 30 , 2009 2010 2011 2012 2013 2014 Construction $12,259 $28,175 $27,661 $37,029 $5,569 $11,878 Residential Real Estate 8,242 18,790 26,299 18,839 19,768 19,232 23,578 Commercial Real Estate 2,828 14,266 32,612 14,462 9,126 Commercial 2,028 4,548 1,804 715 1,137 317 Consumer 92 118 29 92 48 30 Total 25,449 65,897 79,301 89,287 40,984 40,583 OREO 2,572 3,702 9,385 7,659 3,779 4,201 Nonaccrual Loans Held for Sale -- -- -- -- 3,521 -- Total NPAs & TDRs $28,021 $69,599 $88,686 $96,946 $48,284 $44,784 13

Attractive Deposit Base 14 (Dollar Value in Thousands) June 30, 2014 Deposit Type Quarterly Average Balance % of Total Cost Noninterest Bearing Demand $ 168,221 18.4% 0.00% Interest Bearing Demand 171,004 18.7% 0.14% Money Market & Savings 220,850 24.1% 0.12% CDs $100,000 or more 171,830 18.8% 1.11% Other Time 183,336 20.0% 1.02% Total Deposits $ 915,241 100.0% 0.47% Noninterest Bearing Demand 18% Interest Bearing Demand 19% MMDA & Savings 24% CDs $100k or more 19% Other Time 20%
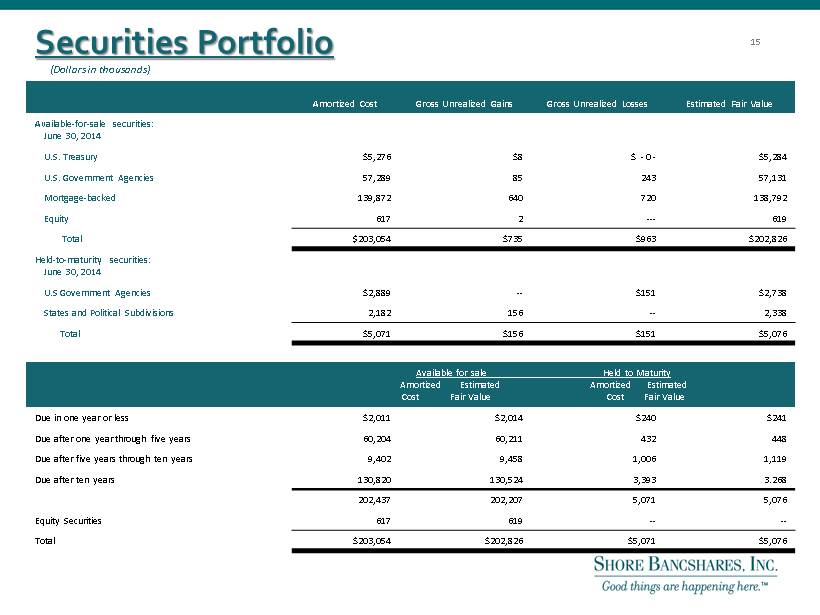
S ecurities Portfolio (Dollars in thousands) Amortized Cost G Gross Unrealized Gains G Gross Unrealized Losses E Estimated Fair Value Available - for - sale securities: June 30, 2014 U.S. Treasury $5,276 $8 $ - 0 - $5,284 U.S. Government Agencies 57,289 85 243 57,131 Mortgage - backed 139,872 640 720 138,792 Equity 617 2 --- 619 Total $ 203,054 $735 $963 $202,826 Held - to - maturity securities: June 30, 2014 U.S Government Agencies $2,889 -- $151 $2,738 States and Political Subdivisions 2,182 156 -- 2,338 Total $5,071 $156 $151 $5,076 Available for sale Held to Maturity Amortized Estimated Amortized Estimated Cost Fair Value Cost Fair Value Due in one year or less $2,011 $2,014 $240 $241 Due after one year through five years 60,204 60,211 432 448 Due after five years through ten years 9,402 9,458 1,006 1,119 Due after ten years 130,820 130,524 3,393 3.268 202,437 202,207 5,071 5,076 Equity Securities 617 619 -- -- Total $203,054 $202,826 $5,071 $5,076 15
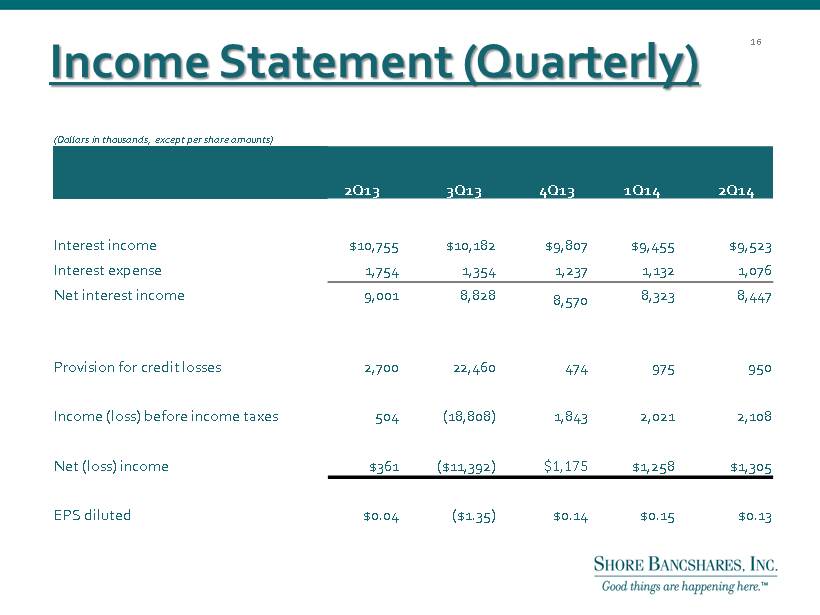
Income Statement (Quarterly) (Dollars in thousands, except per share amounts) 2Q13 3Q13 4Q13 1Q14 2Q14 Interest income $10,755 $10,182 $9,807 $9,455 $9,523 Interest expense 1,754 1,354 1,237 1,132 1,076 Net interest income 9,001 8,828 8,570 8,323 8,447 Provision for credit losses 2,700 22,460 474 975 950 Income (loss) before income taxes 504 (18,808) 1,843 2,021 2,108 Net (loss) income $361 ($11,392) $1,175 $1,258 $1,305 EPS diluted $0.04 ($1.35) $0.14 $0.15 $0.13 16
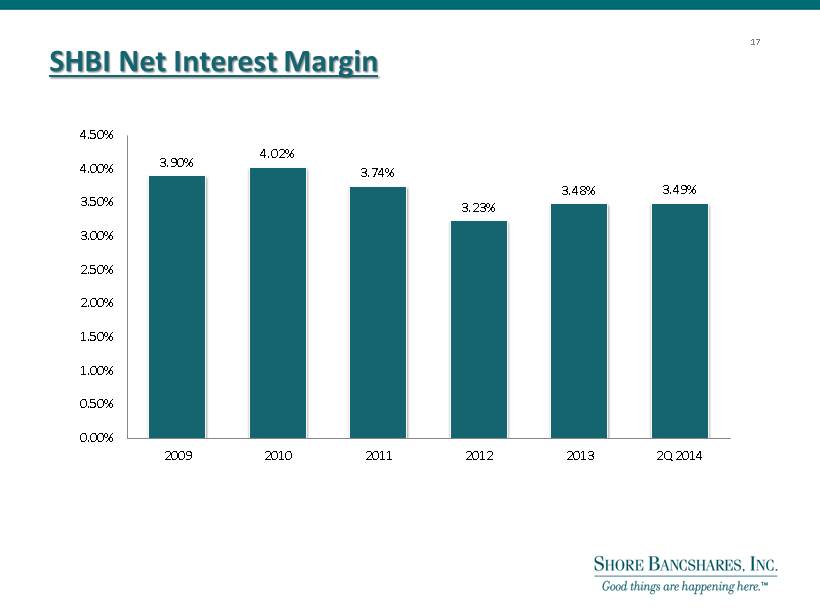
SHBI Net Interest Margin 17 3.90% 4.02% 3.74% 3.23% 3.48% 3.49% 0.00% 0.50% 1.00% 1.50% 2.00% 2.50% 3.00% 3.50% 4.00% 4.50% 2009 2010 2011 2012 2013 2Q 2014
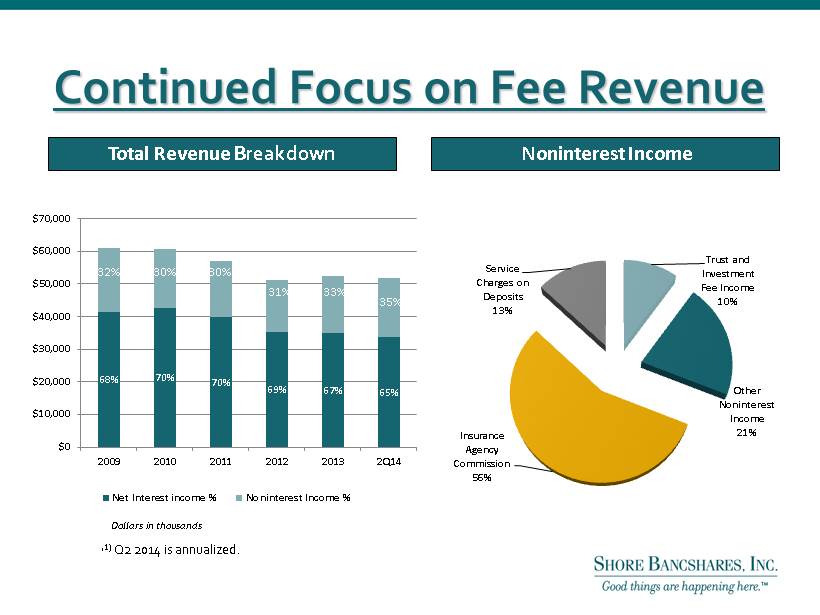
Continued Focus on Fee Revenue Total Revenue Breakdown Noninterest Income ( 1) Q2 2014 is annualized. Dollars in thousands 24% 25% 26% 34% 32% 31% 68% 70% 70% 69% 67% 65% $0 $10,000 $20,000 $30,000 $40,000 $50,000 $60,000 $70,000 2009 2010 2011 2012 2013 2Q14 Net Interest income % Noninterest Income % 32% 30% 30% 31% 333% 35% Trust and Investment Fee Income 10% Other Noninterest Income 21% Insurance Agency Commission 56% Service Charges on Deposits 13%

19 Total Revenue ($mm) Net Income ($mm) Insurance Segment Performance NOTE: In 2010, SHBI incurred $1.5mm in impairment charges related to TSGIA, its wholesale insurance business. In 2011, SHBI incurred an impairment charge of $1.3mm related to its retail insurance business. See page 29 for a reconciliation of insurance revenues and net income. $7.9 $7.5 $7.2 $7.5 $7.9 $ 8.1 $4.1 $3.4 $3.0 $3.2 $4.1 $4.2 $- $2.0 $4.0 $6.0 $8.0 $10.0 $12.0 $14.0 2009 2010 2011 2012 2013 LTM Q2 2014 Retail Wholesale $12.0 $10.9 $10.1 $10.7 $12.0 $12.3 $0.2 - $0.4 $0.3 $0.4 $0.4 - $1.0 - $0.3 - $0.2 $0.1 $0.2 - $0.8 - $0.7 $0.1 $0.5 $0.6 -$1.2 -$1.0 -$0.8 -$0.6 -$0.4 -$0.2 $0.0 $0.2 $0.4 $0.6 2010 2011 2012 2013 LTM Q2 2014 Retail Wholesale Consolidated
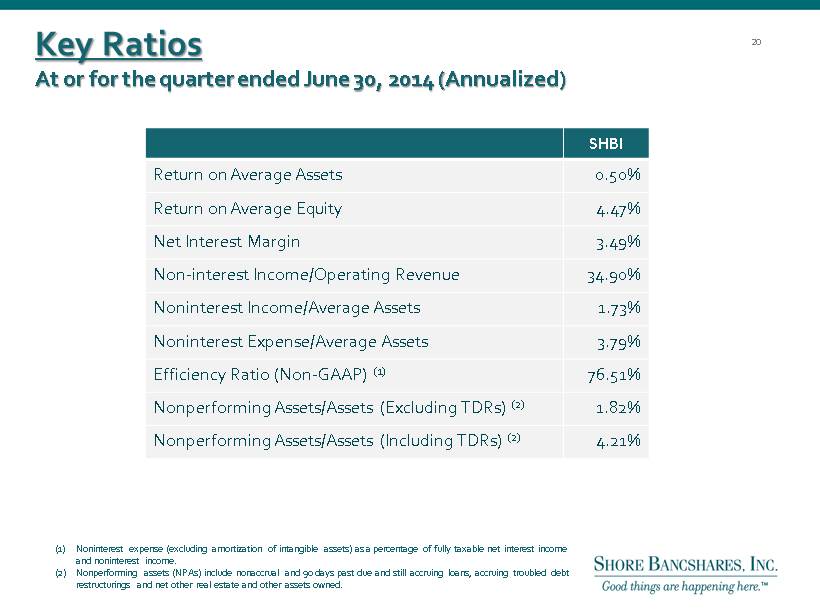
SHBI Return on Average Assets 0.50% Return on Average Equity 4.47% Net Interest Margin 3.49% Non - interest Income/Operating Revenue 34.90% Noninterest Income/Average Assets 1.73% Noninterest Expense/Average Assets 3.79% Efficiency Ratio (Non - GAAP) (1) 76.51% Nonperforming Assets/Assets (Excluding TDRs) (2) 1.82% Nonperforming Assets/Assets (Including TDRs) (2) 4.21% Key Ratios At or for the quarter ended June 30, 2014 (Annualized) (1) Noninterest expense (excluding amortization of intangible assets) as a percentage of fully taxable net interest income and noninterest income. (2) Nonperforming assets (NPAs) include nonaccrual and 90 days past due and still accruing loans , accruing troubled debt restructurings and net other real estate and other assets owned . 20

Capital Ratios 21 9.35% 9.16% 8.36% 8.41% 11.81% 11.81% 13.07% 13.80% 13.32% 11.34% 14.97% 0.00% 2.00% 4.00% 6.00% 8.00% 10.00% 12.00% 14.00% 16.00% 2010 2011 2012 2013 Q2 2014 Tangible Common equity / Tangible Assets Tier 1 Risk-Based Capital Ratio Total Risk-Based Capital Ratio 12.55% 12.05% 10.09% 10.42%

SHBI – LTM Price Change (%) 22

What Makes SHBI Unique? ● Diversity of Revenue Sources - - without Mortgage ● Strong Capital Position ● Stable Net Interest Margin ● Strong Control of Operating Expenses ● Dominant independent financial services company in all markets within footprint 23

24 ● We are a very different Company now x Improved credit process x Continuing to build organizational depth x Revamped strategic plan positions for growth x Focused on creating sustainable competitive advantages x Strengthened noninterest revenue sources x Forging a sales culture with new branding approach ● Current valuation is attractive (trade at 92% of TBV)* Compelling Investment Considerations *Market data as of May 12, 2014.

25 Talent, depth, unique skills • L. Lloyd “Scott” Beatty, Jr ., 61, CPA, President & CEO of SHBI since June 2013, Director of SHBI since December 2000, Director of Talbot Bank since 1992. COO from 2006 until 2012 and named President and COO in 2012. Formerly COO, private equity firm Darby Overseas Investments. Formerly Managing Partner of public accounting firm. • George S. Rapp , 61, CPA, Vice President and Chief Financial Officer of SHBI since February 2013. From 2010 to 2012 , Chief Financial Officer and one of the four executive founders of World Currency USA. From 2005 to 2010, Chief Financial Officer of Harleysville National Corporation . Prior to 2005, held various financial positions including CFO, SVP & Chief Accounting Officer, COO and Controller . • Patrick M. Bilbrough , 49, President and CEO of the Talbot Bank since December 2012. He joined Talbot Bank in May of 2011 as an Executive Vice President. Prior to his employment with Talbot Bank and since 2007, Mr. Bilbrough served as the Market Executive of PNC Ban k, N.A . From 1995 to 2004, Mr. Bilbrough was with the Peoples Bank of Maryland, of Denton, where he had most recently been President and CEO after be ginning as its Chief F inancial O fficer and comptroller. He was a small business owner from 1985 to 1995 . • F. Winfield Trice, Jr. , 59, President & CEO of CNB (formerly Centreville National Bank of Maryland), since June 2007. From 1997 to June 2007, EVP & Senior Loan Officer Mercantile Peninsula Bank. From 1977 to 1997 served in various capacities with The First National Bank of Maryland (now M&T), ending as President & CEO of York Bank and Trust, a subsidiary bank of First Maryland Bancorp. • Kathleen A. Kurtz , SVP and Senior Credit Officer of Talbot Bank. Began career as assistant national bank examiner with Comptroller of the Currency. Held positions as Commercial Mortgage Loan Officer, Credit & Loan Department Manager, Senior Credit Officer and Cre dit Policy manager at Girard Bank in Philadelphia. Later joined New Jersey National Bank as Commercial Mortgage/Construction Lender. • Charles E. Ruch Jr. , Senior Credit Officer of CNB since 2010 and joined CNB in 2006. Entered banking in 1977, holding various retail positions f rom teller to core m anager through the 1980s with Equitable Bank. Joined AB&T as a commercial lender in 1987 and was AB&T’s Senior Commercial Lender for 10 years. Graduated from the University of Maryland in 1983. SHBI Management Team
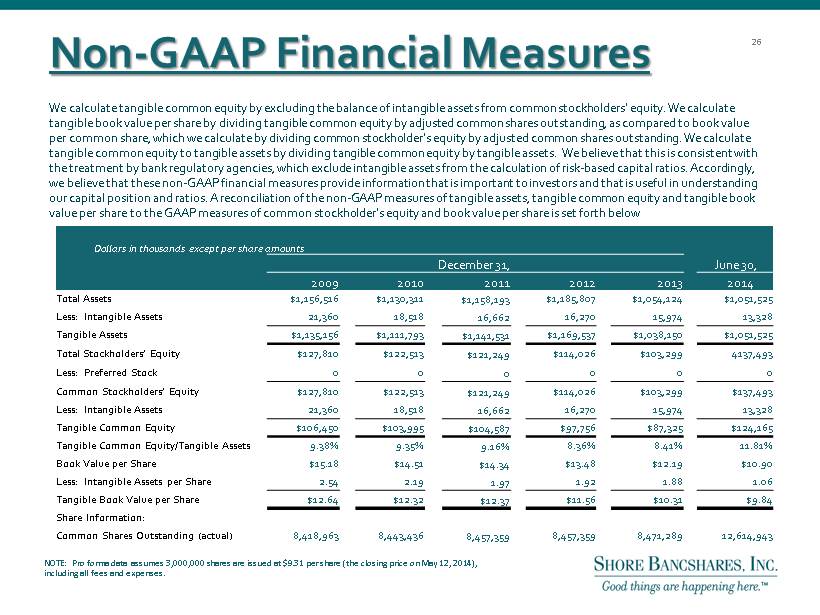
Non - GAAP Financial Measures Dollars in thousands except per share amounts December 31 , June 30 , 2009 2010 2011 2012 2013 2014 Total Assets $1,156,516 $1,130,311 $1,158,193 $1,185,807 $1,054,124 $1,051,525 Less: Intangible Assets 21,360 18,518 16,662 16,270 15,974 13,328 Tangible Assets $1,135,156 $1,111,793 $1,141,531 $1,169,537 $1,038,150 $1,051,525 Total Stockholders’ Equity $127,810 $122,513 $121,249 $114,026 $103,299 4137,493 Less: Preferred Stock 0 0 0 0 0 0 Common Stockholders’ Equity $127,810 $122,513 $121,249 $114,026 $103,299 $137,493 Less: Intangible Assets 21,360 18,518 16,662 16,270 15,974 13,328 Tangible Common Equity $106,450 $103,995 $104,587 $97,756 $87,325 $124,165 Tangible Common Equity/Tangible Assets 9.38% 9.35% 9.16% 8.36% 8.41% 11.81% Book Value per Share $15.18 $14.51 $14.34 $13.48 $12.19 $10.90 Less: Intangible Assets per Share 2.54 2.19 1.97 1.92 1.88 1.06 Tangible Book Value per Share $12.64 $12.32 $12.37 $11.56 $10.31 $9.84 Share Information: Common Shares Outstanding (actual) 8,418,963 8,443,436 8,457,359 8,457,359 8,471,289 12,614,943 We calculate tangible common equity by excluding the balance of intangible assets from common stockholders’ equity. We calcul ate tangible book value per share by dividing tangible common equity by adjusted common shares outstanding, as compared to book v alu e per common share, which we calculate by dividing common stockholder’s equity by adjusted common shares outstanding. We calcul ate tangible common equity to tangible assets by dividing tangible common equity by tangible assets. We believe that this is con sis tent with the treatment by bank regulatory agencies, which exclude intangible assets from the calculation of risk - based capital ratios. Ac cordingly, we believe that these non - GAAP financial measures provide information that is important to investors and that is useful in under standing our capital position and ratios. A reconciliation of the non - GAAP measures of tangible assets, tangible common equity and tangib le book value per share to the GAAP measures of common stockholder’s equity and book value per share is set forth below NOTE: Pro forma data assumes 3,000,000 shares are issued at $9.31 per share (the closing price on May 12, 2014), including all fees and expenses. 26