Attached files
| file | filename |
|---|---|
| 8-K - 8-K - MYERS INDUSTRIES INC | d789830d8k.htm |
| EX-99.1 - EX-99.1 - MYERS INDUSTRIES INC | d789830dex991.htm |
 Myers
Industries, Inc. Investor Presentation
September 2014
Exhibit 99.2 |
 Forward-looking Statements
Statements
in
this
presentation
concerning
the
Company’s
goals,
strategies,
and
expectations
for
business
and
financial
results
may
be
"forward-looking
statements"
within
the
meaning
of
the
Private
Securities
Litigation
Reform
Act
of
1995
and
are
based
on
current
indicators
and
expectations.
Whenever
you
read
a
statement
that
is
not
simply
a
statement
of
historical
fact
(such
as
when
we
describe
what
we
"believe,"
"expect,"
or
"anticipate"
will
occur,
and
other
similar
statements),
you
must
remember
that
our
expectations
may
not
be
correct,
even
though
we
believe
they
are
reasonable.
We
do
not
guarantee
that
the
transactions
and
events
described
will
happen
as
described
(or
that
they
will
happen
at
all).
You
should
review
this
presentation
with
the
understanding
that
actual
future
results
may
be
materially
different
from
what
we
expect.
Many
of
the
factors
that
will
determine
these
results
are
beyond
our
ability
to
control
or
predict.
You
are
cautioned
not
to
put
undue
reliance
on
any
forward-looking
statement.
We
do
not
intend,
and
undertake
no
obligation,
to
update
these
forward-looking
statements.
These
statements
involve
a
number
of
risks
and
uncertainties
that
could
cause
actual
results
to
differ
materially
from
those
expressed
or
implied
in
the
applicable
statements.
Such
risks
include:
(1) Changes in the markets for the Company’s business segments
(2) Changes in trends and demands in the markets in which the Company
competes (3) Unanticipated downturn in business relationships with customers
or their purchases (4) Competitive pressures on sales and pricing
(5) Raw material availability, increases in raw material costs, or other production
costs (6) Harsh weather conditions
(7) Future economic and financial conditions in the United States and around the
world (8) Inability of the Company to meet future capital requirements
(9) Claims, litigation and regulatory actions against the Company
(10) Changes in laws and regulations affecting the Company
(11) The Company’s ability to execute the components of its Strategic Business
Evolution process Myers
Industries,
Inc.
encourages
investors
to
learn
more
about
these
risk
factors.
A
detailed
explanation
of
these
factors
is
available
in
the
Company’s
publicly
filed
quarterly
and
annual
reports,
which
can
be
found
online
at
www.myersind.com
and
at
the
SEC.gov
web
site.
2 |
 Why Myers
3
•
Significant progress in streamlining business
•
Enhanced platform to accelerate growth
•
Strong market positions; plan to further
penetrate expansion markets
•
Financially strong; disciplined capital
deployment
•
Dedicated to enhancing shareholder value |
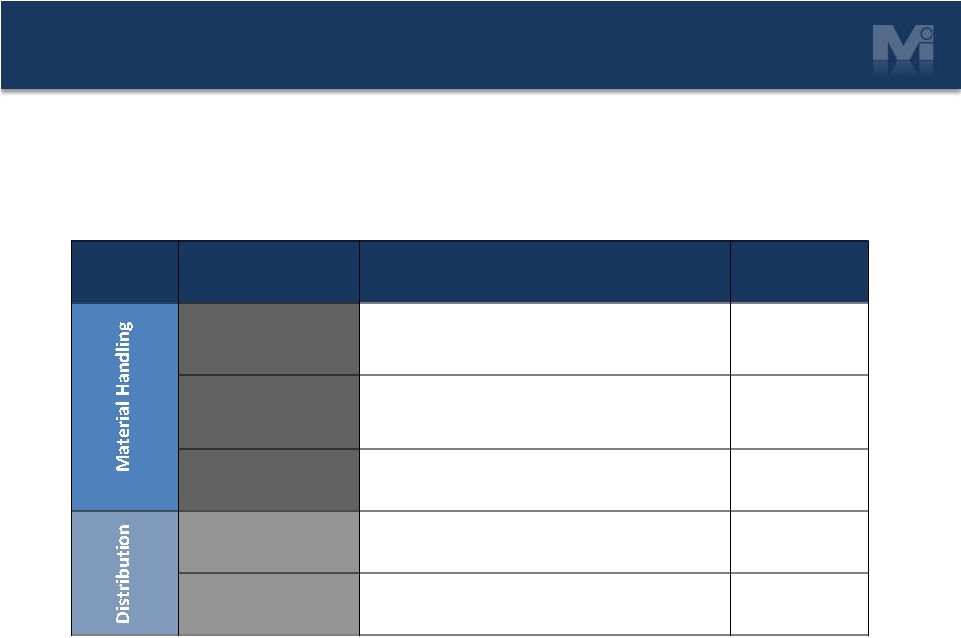
 4
Company at a Glance
Material Handling
Distribution
Two core businesses and reporting
segments:
Material Handling
•
Polymer-based returnable packaging
•
Polymer-based storage and safety products
•
Specialty molding
Distribution
•
Largest wholesale distributor of tools,
supplies and equipment for the tire, wheel
and undervehicle service segment industry;
parts production
•
Manufacturer of repair and retread products
2013 Net
Sales*
2013 Adjusted
EBIT*
Material Handing |
Distribution
•
Data
has
been
updated
to
reflect
discontinued
operations
presentation,
segment
realignment
completed
in
June
2014,
and
inclusion
of
Scepter
Corporation
Group’s
2013
sales
and
EBIT. |
 Business
Segments Material Handling
Distribution
5 |
 Growth
Drivers 6
Net Sales Growth
+
•
Select investments and acquisitions
•
Richer product mix
•
New markets and geographies
Profitability
+
•
Optimize capacity
•
Drive greater operating efficiency
•
Enhance product mix
Free Cash Flow
•
Sales growth and profitability improvement
•
Capital discipline |
 Strategic
Goals Strategic & Financial Goals
•
Focus
on
markets
that
have
strong,
sustainable growth and profit
potential
•
Material
Handling:
•
Liquid/Semi-liquid food products
•
Bulk packaging of dry, granular flowable products
•
Acquisitions
•
Distribution:
•
Auto dealer tire market
•
Value chain strategic customer partnerships
•
E-Commerce
•
Strategic geographic acquisitions
•
Invest
within
our
growth
platforms
for value creation
•
Drive
earnings growth faster than
sales growth
•
Maintain
a strong and flexible
balance sheet
7
•
Sales
Growth
>
2.0x
GDP
•
Gross
Margin
>
30%
•
EPS
Growth
>
20%
CAGR
•
Free
Cash
Flow
>
100%
of
Net
Income
•
ROIC
>
Cost
of
Capital
•
Innovation/NPD
>
10%
of
Sales
•
Ops
Excellence
Savings
=
3%
of
COGS
(gross)
Financial Goals |
 Recent
Announcements & Events 8
•
Acquisition of Scepter
•
Commencement of the sale of the Lawn & Garden Segment
•
Two-phase restructuring complete
•
Engaged William Blair to assist with the sale process
•
Expect the sale to be completed by mid-2015
•
Reported as discontinued operations
•
Sale
of
WEK
Industries,
Inc.
to
Industrial
Opportunity
Partners
for
$20
million
–
reported
as
discontinued
operations
•
Segment reporting realignment
•
Two reportable segments from four
•
Material Handling
•
Distribution |
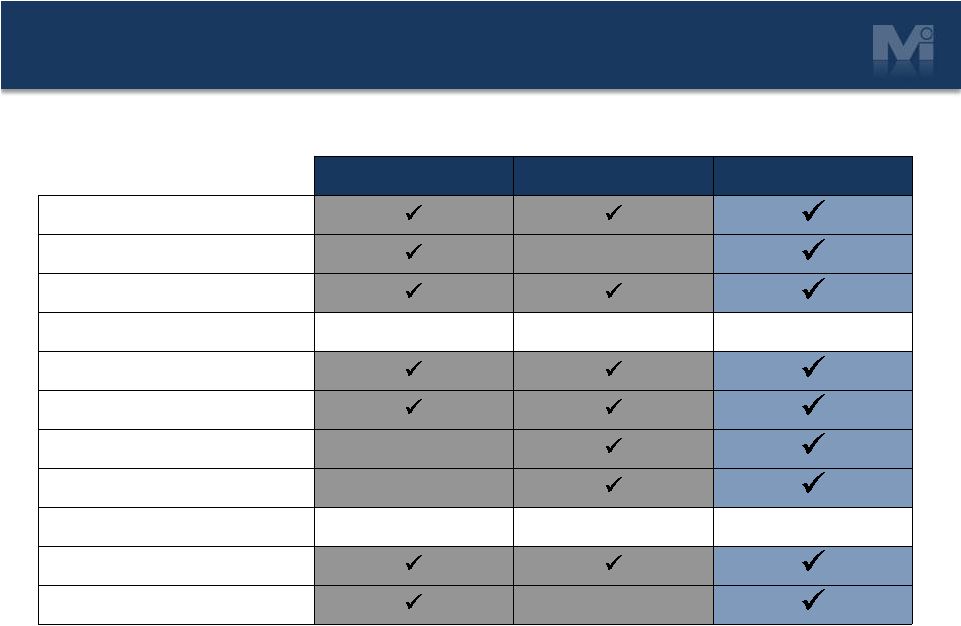
 Growth
Platforms We will continuously upgrade Myers’
performance through:
Disciplined Portfolio Management
and
Investment in Profitable Growth
9
Drive
conversions
to
reusable
products
through
further
penetration
of
existing
growth
markets,
new
end
markets
and
broader
geographic
reach.
Further
grow
platform
with
acquisitions.
Strengthen
competitive
advantage
through
distribution
channels.
Expand
our
capabilities
to
further
grow
our
positions
in
Marine
and
RV.
Grow
through
market
reach,
innovative
products
and
expanded
global
sourcing.
Leverage
product
and
customer
expertise
to
grow
niche
market.
Novel/
Scepter
Jamco
Products
Inc.
Scepter
Growth
Platform
2012-2014
Acquisitions
Returnable
Packaging
Storage & Safety
Products
Specialty Molding
Tire Supply
Distribution
Tire Repair &
Retread Products |
 Scepter
Acquisition Overview •
Completed acquisition of Scepter Corporation (Canadian
company) and Scepter Manufacturing, LLC (US company),
a manufacturer of polymer products, July 2, 2014
•
Grows Material Handling Segment with adjacent products
and technologies, and expands end markets and
geographic reach
10 |
 Transaction
Summary Structure
•
Purchase price $157M
•
Increased senior secured revolving credit facility to $300M to fund
acquisition
•
Proceeds from the divestiture of Lawn & Garden Segment will be used
to pay down debt
•
Closed July 2, 2014
Financial Contribution
•
Sales in 2013 of $94.8M
•
EBIT in 2013 of $16.7M; EBITDA in 2013 of $21.9M
•
Increases Material Handling 2013 revenue by 25%
•
Anticipate realizing synergies of more than $2M annually
•
Expected returns > cost of capital
•
Immediate contribution to adjusted EPS
11 |
 Strong
Combined Platform for Growth Myers
Scepter
New Myers
Returnable packaging
Storage and safety
Specialty molding
Industrial
Marine
Consumer
Military
North America
Latin America
12 |
 Lawn &
Garden Segment •
Completed multi-phase restructuring of the segment
in 1H 2014
•
Announced commencement of the sale of Lawn &
Garden Segment June 2, 2014
•
As of second quarter 2014, the Lawn & Garden
Segment is being reported as discontinued operations
•
Expect sale to be completed by mid-2015
13 |
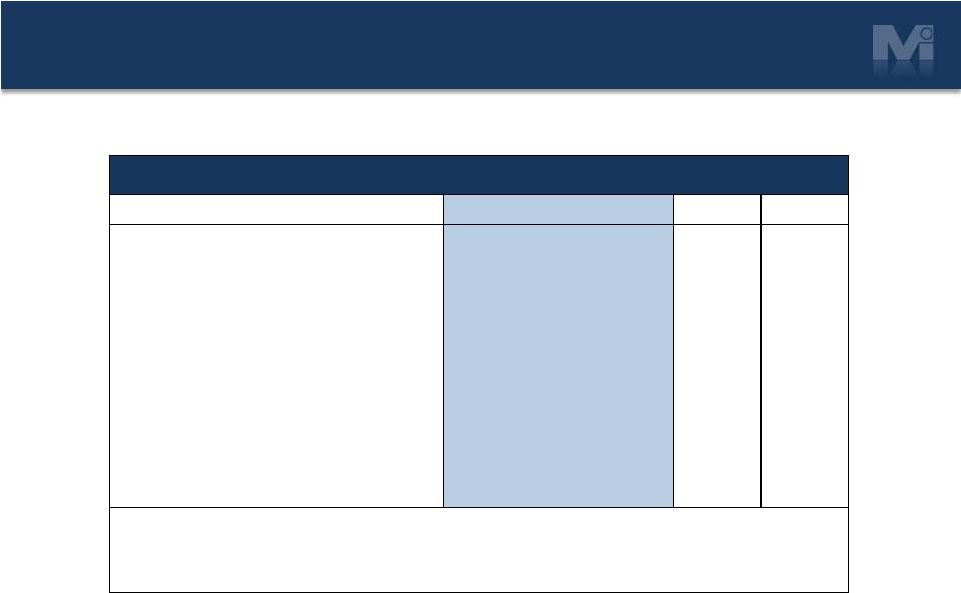 Progress
Towards Financial Goals 14
Metric
Goal
2013
(4)
2012
(4)
Sales Growth
(1)
> 2.0x GDP
7.2%
7.2%
Gross Profit Margin
> 30%
29.0%
30.0%
Adjusted EPS Growth*
>20% CAGR
28.3%
89.0%
Free Cash Flow
= 100% of Net Income
205%
90%
ROIC
(2)
> 10%
17%
15%
Innovation / NPD
(3)
>10% of Sales
7%
7%
Operations Excellence Savings
3% of COGS (gross)
2%
3%
(1) Using real GDP forecasted and actual growth rates, 2.0x GDP growth = 4.4% and 4.6% for 2013 and
2012 respectively. (2) ROIC = Net Operating Profit After Tax/(Debt + Equity).
(3) NPD = New Product Development calculation based on products/services introduced within the last
three years. (4) 2013 and 2012 reflect discontinued operations presentation and do not include
Scepter acquisition completed in 2014. Key Accomplishment Metrics |
 Solid Cash
Flow Generation 15
Notes:
1)
Free cash flow calculated as cash flow from continuing operations less capital
expenditures. 2)
Years 2012 and 2013 have been adjusted to reflect discontinued operations presentation.
$(Millions)
Free Cash Flow
As Reported
Continuing
Operations
Generating Free Cash Flow, Investing for the Future and
Returning Cash to Shareholders |
 Strong &
Flexible Balance Sheet 16
Note:
1)
Net Debt-to-Capital ratio calculated as net debt/(net debt+equity).
2)
Net Debt at June 30, 2014 was $101.9M. Available liquidity at June 30, 2014 was
$256.9M. 3)
Data has not been adjusted to reflect discontinued operations.
Net Debt-to-Capital
Maintaining strong balance sheet for investments and
returning capital to shareholders |
 Balanced
Approach to Capital Allocation 17
•
Core markets
•
Adjacencies
•
Dividends
•
Share repurchases
•
Debt reduction
Growth Through Acquisitions
Return Capital to Shareholders
Organic Growth
•
Reinvest in business
•
New product development
•
Process improvements
Investing for the future and returning cash to
shareholders |
 Returning Cash
to Shareholders •
Increasing Dividends
•
Increased Q1 2014 quarterly dividend by 44% to $0.13 per share
18
Quarterly Dividends Paid
Notes re: quarterly dividends:
1) Above adjusted for stock dividends and splits in 2000, 2001, 2002 and 2004.
2) In 2007 there was an additional special dividend (not shown above) of $0.28 or $9.9M
accrued but not paid until 2008, resulting from a merger termination payment.
•
Buying Back Shares
•
Invested $33M to buy back 2.8M shares from 2011 to 2013
•
Invested $44M to buy back 2.1M shares YTD June 2014
•
5 million shares remaining in Board authorization (as of 6-30-14)
$Millions Invested in Share Repurchases |
 Why Myers
19
•
Significant progress in streamlining business
•
Enhanced platform to accelerate growth
•
Strong market positions; plan to further
penetrate expansion markets
•
Financially strong; disciplined capital
deployment
•
Dedicated to enhancing shareholder value |
 Appendix
20 |
 Management
Team John C. Orr, President & Chief Executive Officer
•
Named President and CEO May 2005
•
Previously President and COO, responsible for global manufacturing and
distribution
•
Prior General Manager of Buckhorn
•
Previous 28 years with Goodyear, including Vice President of Manufacturing for
North America and Director of Manufacturing for Latin America Division
Gregg Branning, SVP, Chief Financial Officer & Corporate Secretary
•
Joined Myers as CFO in September 2012
•
Previously VP of Finance and CFO of Danaher subsidiary, Thomson Industries, a
global industrial manufacturing business
•
Prior President of Danaher subsidiary, Accu-Sort, global developer and
manufacturer of technological products; also CFO of Joslyn Hi-Voltage
•
Prior to Danaher, 13 years with Hamilton Sundstrand & 7 in public accounting
21
More than 100 Years of Experience in Manufacturing |
 Management
Team 22
More than 100 Years of Experience in Manufacturing
Joel Grant, SVP & General Manager, Material Handling Segment
•
Named VP & General Manager, Material Handling Segment in November of 2010, with
his title changing to Senior VP & General Manager in July of 2011
•
Previously Managing Director of Material Handling & GM of Buckhorn
•
Prior Director of Operations of Material Handling, Director
of Sales & Marketing,
Buckhorn, and Director of Sales, Buckhorn
•
Over 13 years of experience with the Sonoco Products Company and
seven years with
Continental Group of New York (division sold to Sonoco Products)
Alex Williamson, VP & General Manager, Distribution Segment
•
Joined Myers as VP & General Manager, Distribution Segment in June 2014
•
Previously Co-President of Seaman Corporation
•
Held senior leadership positions at Noveon Inc. (now Lubrizol)
•
Over 24 years of experience in business management and an extensive background in
marketing, sales, chemistry, and product engineering |
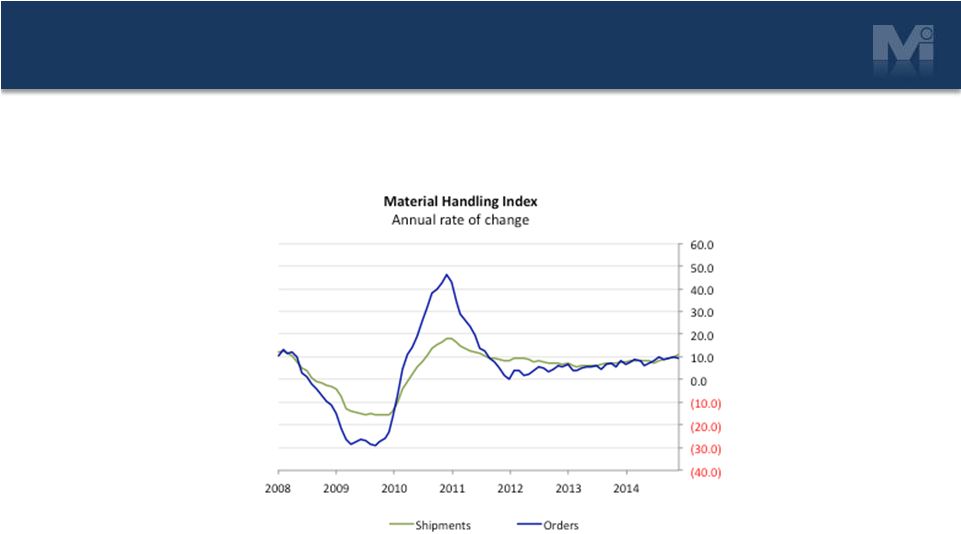 Material
Handling Macro Indicators 23
MHEM (Material Handling Equipment) Index
Source: Material Handling Industry July 2014 Forecast
MHI forecasts new orders of material handling equipment to increase 7.0%
in 2014 and shipments are forecasted to increase 8.3% in 2014.
|
 Distribution
Macro Indicators 24
Replacement Tire Shipments; Miles Driven; Fuel Prices
Source: JP Morgan, RMA, Energy Information Administration, July 2014
|
 Reconciliation
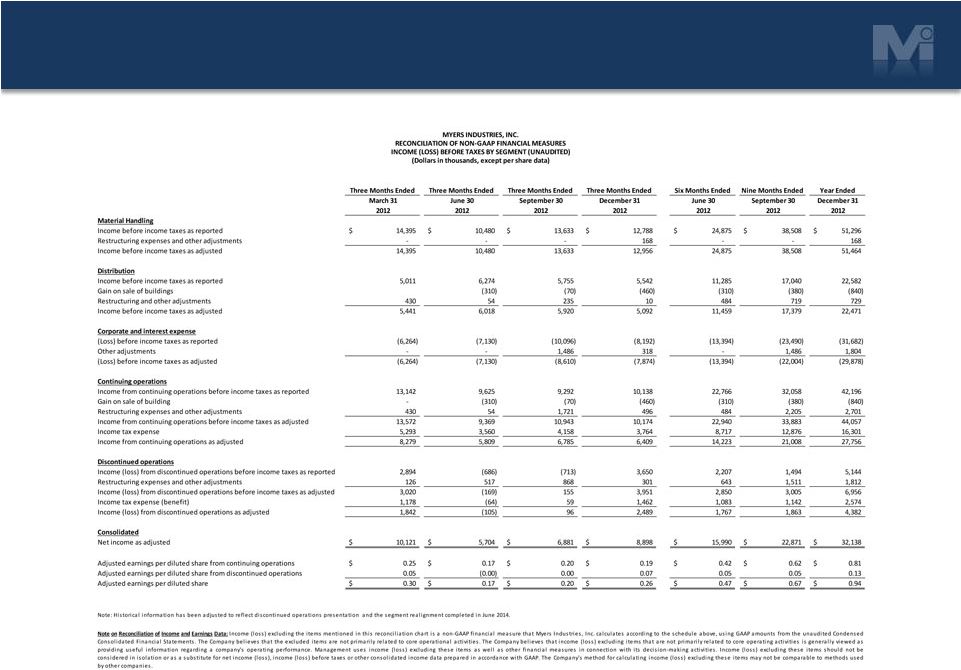
of Non-GAAP Measures 25 |
 Reconciliation
of Non-GAAP Measures 26 |
 Reconciliation
of Non-GAAP Measures 27 |
 |