Attached files
| file | filename |
|---|---|
| 8-K - FORM 8-K - HOME LOAN SERVICING SOLUTIONS, LTD. | form8-kxsep82014.htm |

Investor Presentation September 2014

2 FORWARD-LOOKING STATEMENT: This news release contains forward-looking statements within the meaning of Section 27A of the Securities Act of 1933, as amended, and Section 21E of the Securities Exchange Act of 1934, as amended. All statements, other than statements of historical facts, included in this press release, including, without limitation, statements we make about business model, dividend, future earnings, asset performance, financing, market opportunities, asset performance, asset valuation, interest rate exposure, business strategy and expectations and objectives for our future performance, are forward-looking statements. These forward-looking statements include declarations regarding our management's beliefs and current expectations. All forward-looking statements are subject to certain risks, uncertainties and assumptions. If one or more of these risks or uncertainties materialize, or if underlying assumptions prove incorrect, our actual results, performance or achievements could differ materially from those expressed in, or implied by, any such forward-looking statements. Important factors that could cause or contribute to such difference include those risks specific to our business detailed within our reports and filings with the SEC, including our Annual Report on Form 10-K for the year ended December 31, 2013 (the "2013 Form 10-K") as amended by our Amendment No.1 to the 2013 Form 10-K, filed with the SEC on August 18, 2014 (the "Form 10-K/A") and our Quarterly Report on Form 10-Q for the quarter ended June 30, 2014 (the "Q2 Form 10-Q") filed with the SEC on August 18, 2014. You should not place undue reliance on such forward-looking statements, which speak only as of their dates. We undertake no obligation to update or revise forward-looking statements, whether as a result of new information, future events or otherwise. You should carefully consider the risk factors described under the heading "Risk Factors" within our Form 10- K/A and our Q2 Form 10-Q. NON-GAAP MEASURES: In addition to financial measures prepared in accordance with generally accepted accounting principles (“GAAP”), this presentation also contains references to cash generated available for distribution, core earnings, core EPS, servicing revenue and servicing expense, which are non-GAAP performance measures. We believe these non-GAAP performance measures may provide additional meaningful comparisons between current results and results in prior periods. Non-GAAP performance measures should be viewed in addition to, and not as an alternative for, the Company’s reported results under accounting principles generally accepted in the United States.

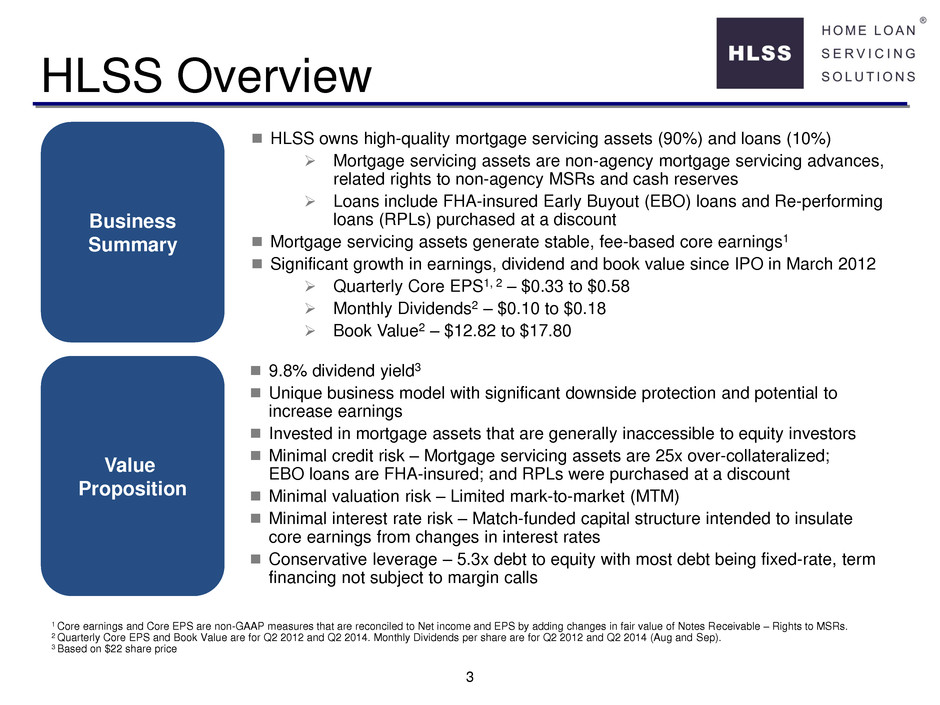
3 HLSS owns high-quality mortgage servicing assets (90%) and loans (10%) Mortgage servicing assets are non-agency mortgage servicing advances, related rights to non-agency MSRs and cash reserves Loans include FHA-insured Early Buyout (EBO) loans and Re-performing loans (RPLs) purchased at a discount Mortgage servicing assets generate stable, fee-based core earnings1 Significant growth in earnings, dividend and book value since IPO in March 2012 Quarterly Core EPS1, 2 – $0.33 to $0.58 Monthly Dividends2 – $0.10 to $0.18 Book Value2 – $12.82 to $17.80 Business Summary HLSS Overview Value Proposition 9.8% dividend yield3 Unique business model with significant downside protection and potential to increase earnings Invested in mortgage assets that are generally inaccessible to equity investors Minimal credit risk – Mortgage servicing assets are 25x over-collateralized; EBO loans are FHA-insured; and RPLs were purchased at a discount Minimal valuation risk – Limited mark-to-market (MTM) Minimal interest rate risk – Match-funded capital structure intended to insulate core earnings from changes in interest rates Conservative leverage – 5.3x debt to equity with most debt being fixed-rate, term financing not subject to margin calls 1 Core earnings and Core EPS are non-GAAP measures that are reconciled to Net income and EPS by adding changes in fair value of Notes Receivable – Rights to MSRs. 2 Quarterly Core EPS and Book Value are for Q2 2012 and Q2 2014. Monthly Dividends per share are for Q2 2012 and Q2 2014 (Aug and Sep). 3 Based on $22 share price

4 Mortgage Servicing Back office for non-agency mortgage market Receives payments from borrower Distributes payments to loan owner Advance payments for delinquent borrowers (Servicing advances) Repaid from borrower payments and liquidation proceeds Paid fixed fee (MSR Asset) Mortgage servicing assets including advances and related rights to MSRs have virtually no exposure to mortgage credit losses B o rr o w er s Ser v ice r L o a n O w n er s Borrower Borrower Borrower Borrower Borrower Monthly P&I +Liquidation Proceeds Monthly P&I + Liquidation Proceeds – Servicing Fees – Advances Repaid Bond Holders Servicer Servicing Advances New Repaid

5 $170.8 Billion Portfolio UPB $164.1 Billion Downside Protection $6.7 Billion1 ~96% decline in real estate value would be required to impair HLSS’ mortgage servicing assets1 Mortgage servicing assets are 25 times over-collateralized1 82% of assets are Servicing advances or Cash which have no mark-to-market 8% of assets are Rights to MSRs with prepayments that are not correlated to interest rates 10% of assets are Loans held for investment (FHA-insured EBOs and RPLs purchased at a discount) Assets Have Limited Credit and Valuation Risk Cash & Reserves2 $0.4 Billion or 4.7% Rights to MSRs $0.6 Billion or 7.9 % Servicing advances $6.1 Billion or 77.3% HLSS Assets 2 Reserves associated with Advance Financing Facilities Note: Data as of June 30, 2014 1 Servicing advances and related Rights to MSRs Loans held for investment $0.8 Billion or 10.1%

6 - 2,000 4,000 6,000 Fixed Rate Term Note Balance 5.44% 5.01% 3.48% 2.76% 2.48% 2.40% 2.26% 2.25% 2.26% 2.00% 3.00% 4.00% 5.00% 6.00% Q212 Q312 Q412 Q113 Q213 Q313 Q413 Q114 Q214 Advances earning variable rate Liabilities are Primarily Fixed-Rate, Term Financing Secured by Advances ($ in Millions) Servicer advance financing structure designed to stabilize core earnings Committed, fixed-rate, term financing for the majority of Servicing advances Servicing advances in excess of target earn a variable rate via an adjustment to servicer’s incentive fee Custodial account balances earn interest at a variable rate, providing a hedge against rising interest rates Negative interest rate exposure on servicing advances offsets variable rate borrowing on Loans held for investment 1 Excludes senior secured term loan and borrowing on Loans held for investment 2 Projected borrowing, Advances earning variable rate, Custodial balances earning variable rate and Variable rate exposure are projected for the June 30, 2014 portfolio assuming a 1.25% monthly reduction in the advance to UPB ratio, a 12.0% annual prepayment speed and 90% funding efficiency on Servicing advances Limited Exposure to Variable Rates Lower Effective Interest Rate 1 Custodial balances earning variable rate Variable rate exposure Projected borrowing 2

7 Stability of revenues and expenses result in predictable core earnings Stable Revenue and Expenses Predictable Revenue Stream Known Expense Structure Hedged Financing Cost Revenues based on asset balance Recurring, contractual annual revenue based on UPB Expenses based on asset balance Sub-servicing fees based on UPB – fixed schedule locks in servicing costs MSR amortization is based on prepayment speeds which have decreased relative to purchase assumptions MSR fair value changes changes do not affect cash or dividend Fixed-rate notes with maturities matched to expected borrowing needs Variable-rate exposure hedged by variable-rate income on custodial balances and excess servicing advances

8 19.2 19.0 18.5 18.2 17.8 17.7 17.5 2.7 2.65% 2.49% 2.37% 2.27% 2.17% 2.07% 1.98% 3.59% 0.00% 1.00% 2.00% 3.00% 4.00% 10.0 15.0 20.0 25.0 (% of UPB) (an nu ali zed bp s) Contractual Retained Fee Incentive Fee Reduction Target Advance Ratio Actual Advance Ratio Servicing Contract Ties Fees to Advance Ratio Scheduled step-downs in the retained fee and advance ratio Retained fees are servicing fees net of subservicing expenses Servicer’s incentive fee is reduced at the annual rate of One-Month LIBOR plus 2.75% on excess servicing advances Q2 retained fee of 21.9bps includes 2.7bps from the reduction to the incentive fee Fee split designed to achieve a targeted yield at HLSS Note: The retained fee and target advance ratio reflect the weighted averages for the June 30, 2014 portfolio

9 $185.7 $41.3 Servicing revenue Interest income Subservicing fees Interest expense Amortization of MSRs Operating expenses and other Net Income / Components of Income Second quarter EPS of $0.71 was above guidance, primarily due to a $0.13 per share benefit from an increase in the fair value of MSR assets Amortization was reduced by $9.4 million for the MSR asset valuation change Earnings exceeded dividends declared during the quarter by $16.6 million Second Quarter 2014 Earnings 4 ($ in Millions) 90.9 Basis points per UPB¹ (Annualized): 1 Management reporting format - calculated using average UPB for Q2 2014 2 Interest earned on corporate and custodial cash balances and interest on Loans held for investment 3 Non-GAAP measure. Please see our Form 10-Q dated August 18, 2014 for a reconciliation to the corresponding GAAP measure 4 Operating expenses, net of billing to Ocwen for services provided 43 bps (21) bps (9) bps (2) bps (1) bps 12 bps 40.0 8.2 7.8 2 Incentive Retained Fee Base 3.7 3 2 bps $50.7 Core Earnings3

10 $50.7 $103.8 $69.7 8.2 52.1 7.2 34.1 Net Income Amortization of MSRs Decrease in equity haircut Changes in other assets / liabilities Cash generated available for distribution Dividends declared Cash available for reinvestment Components of Cash Flow Servicing advances continued to decline in Q2 which, aided by an increase in the effective borrowing rate, released $28.4 million of equity haircut Increase in borrowing rate on EBO loans added $23.7 million of borrowing capacity Cash generated available for distribution is 3x dividends declared during Q2 Total cash and available credit of $113.1 million at June 30, 2014 1 Servicing advances decreased by $209.6 million, and the effective borrowing rate on advances increased to 91.6% on a fully-drawn basis; Increase in effective borrowing rate on EBO loans 2 Primarily accrued interest income on FHA-insured loans and advances which increased by $7.7 million ($ in Millions) Second Quarter 2014 Cash Flow 1 3x Dividend Coverage 2

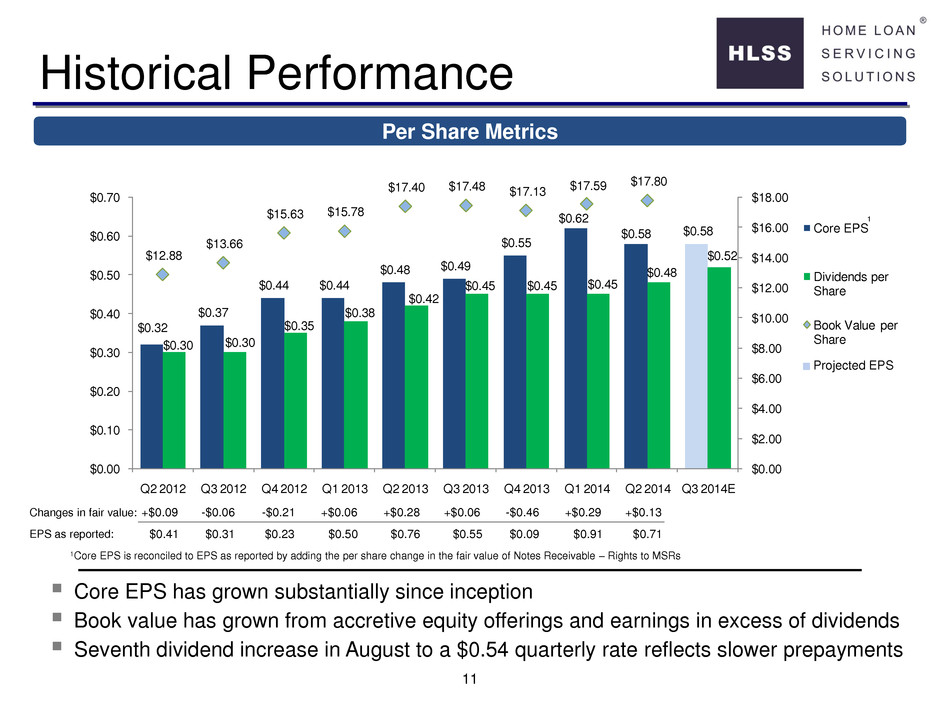
11 $0.32 $0.37 $0.44 $0.44 $0.48 $0.49 $0.55 $0.62 $0.58 $0.58 $0.30 $0.30 $0.35 $0.38 $0.42 $0.45 $0.45 $0.45 $0.48 $0.52 $12.88 $13.66 $15.63 $15.78 $17.40 $17.48 $17.13 $17.59 $17.80 $17.86 $0.00 $2.00 $4.00 $6.00 $8.00 $10.00 $12.00 $14.00 $16.00 $18.00 $0.00 $0.10 $0.20 $0.30 $0.40 $0.50 $0.60 $0.70 Q2 2012 Q3 2012 Q4 2012 Q1 2013 Q2 2013 Q3 2013 Q4 2013 Q1 2014 Q2 2014 Q3 2014E Core EPS Dividends per Share Book Value per Share Historical Performance Per Share Metrics Core EPS has grown substantially since inception Book value has grown from accretive equity offerings and earnings in excess of dividends Seventh dividend increase in August to a $0.54 quarterly rate reflects slower prepayments 1Core EPS is reconciled to EPS as reported by adding the per share change in the fair value of Notes Receivable – Rights to MSRs Changes in fair value: +$0.09 -$0.06 -$0.21 +$0.06 +$0.28 +$0.06 -$0.46 +$0.29 +$0.13 EPS as reported: $0.41 $0.31 $0.23 $0.50 $0.76 $0.55 $0.09 $0.91 $0.71 1 Projected EPS

12 HLSS Dividends and Book Value Growth vs. Selected mREITs 40.0% 60.0% 80.0% 100.0% 120.0% 140.0% 160.0% 180.0% HLSS NLY AGNC TWO CIM 2Q12 3Q12 4Q12 1Q13 2Q13 3Q13 4Q13 1Q14 2Q14 3Q14 Growth of HLSS’ dividends and book value per share has exceeded that of most mREITs

13 Investment Highlights 9.8% annualized dividend yield1 Lower credit, valuation and financing risk relative to other companies with similar yields 25x over-collateralization, FHA-guarantees and purchase price discounts reduce credit risk Asset composition – 92% servicing advances, EBOs and cash – mitigates valuation risk Profits purchased up front – achieving targeted return not dependent on asset appreciation as most assets liquidate at par Servicer retains operating risk and regulatory compliance responsibility under an incentive contract designed to stabilize core earnings Opportunity to increase earnings in an improving economy with rising interest rates Cash flow in excess of dividend has been reinvested to maintain earnings and could be used to buy back stock to maintain core earnings per share High Quality Assets Stable Core Earnings Stream Large Positive Alpha 1 Based on a $22 share price

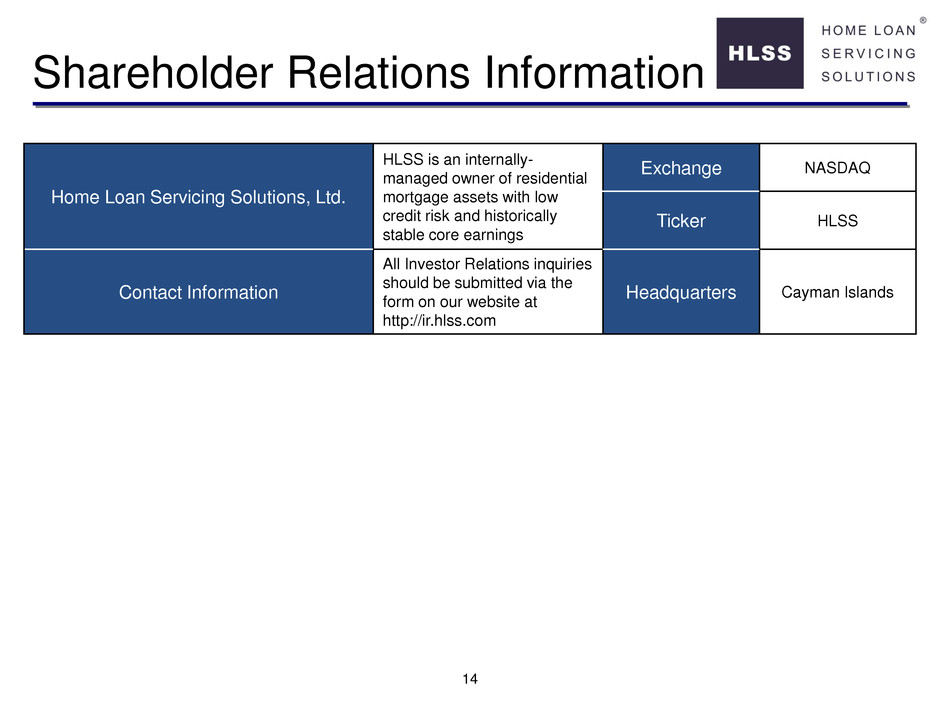
14 Shareholder Relations Information Home Loan Servicing Solutions, Ltd. HLSS is an internally- managed owner of residential mortgage assets with low credit risk and historically stable core earnings Exchange NASDAQ Ticker HLSS Contact Information All Investor Relations inquiries should be submitted via the form on our website at http://ir.hlss.com Headquarters Cayman Islands
