Attached files
| file | filename |
|---|---|
| 8-K - 8-K - Equity Commonwealth | a14-20606_18k.htm |
Exhibit 99.1
|
|
Investor Presentation September 2014 NYSE: EQC |
|
|
2 Forward-Looking Statements Some of the statements contained in this presentation constitute forward-looking statements within the meaning of the federal securities laws. Any forward-looking statements contained in this presentation are intended to be made pursuant to the safe harbor provisions of Section 21E of the Private Securities Litigation Reform Act of 1995. Forward-looking statements relate to expectations, beliefs, projections, future plans and strategies, anticipated events or trends and similar expressions concerning matters that are not historical facts. In some cases, you can identify forward-looking statements by the use of forward-looking terminology such as “may,” “will,” “should,” “expects,” “intends,” “plans,” “anticipates,” “believes,” “estimates,” “predicts,” or “potential” or the negative of these words and phrases or similar words or phrases which are predictions of or indicate future events or trends and which do not relate solely to historical matters. You can also identify forward-looking statements by discussions of strategy, plans or intentions. The forward-looking statements contained in this presentation reflect our current views about future events and are subject to numerous known and unknown risks, uncertainties, assumptions and changes in circumstances that may cause our actual results to differ significantly from those expressed in any forward-looking statement. We do not guarantee that the transactions and events described will happen as described (or that they will happen at all). The following factors, among others, could cause actual results and future events to differ materially from those set forth or contemplated in the forward-looking statements: . changes in the real estate industry, particularly in those markets in which our properties are located; . our ability to raise equity or debt capital; . our ability to internalize EQC’s corporate and business operations from RMR; . our ability to transition property management to CBRE; . the future amount of leasing activity and occupancy rates at our properties; . the future rent rates we will be able to charge at our properties; . the costs we may incur to lease space in our properties; . our ability to declare or pay distributions to our shareholders and the amounts of such distributions; . the credit quality of our tenants; . the likelihood that our tenants will pay rent, renew leases, enter into new leases or be affected by cyclical economic conditions; . our sales of properties; . our ability to compete for tenancies effectively; . our ability to pay interest on and principal of our debt; . our ability to obtain credit facilities, and the availability of borrowings under those credit facilities; and . our tax status as a REIT. While forward-looking statements reflect our good faith beliefs, they are not guarantees of future performance. We disclaim any obligation to publicly update or revise any forward-looking statement to reflect changes in underlying assumptions or factors, of new information, data or methods, future events or other changes. For a further discussion of these and other factors that could cause our future results to differ materially from any forward-looking statements, see the sections entitled “Risk Factors” in our Annual Report on Form 10-K for the year ended December 31, 2013 and in our Quarterly Report on Form 10-Q for the quarter ended June 30, 2014. |
|
|
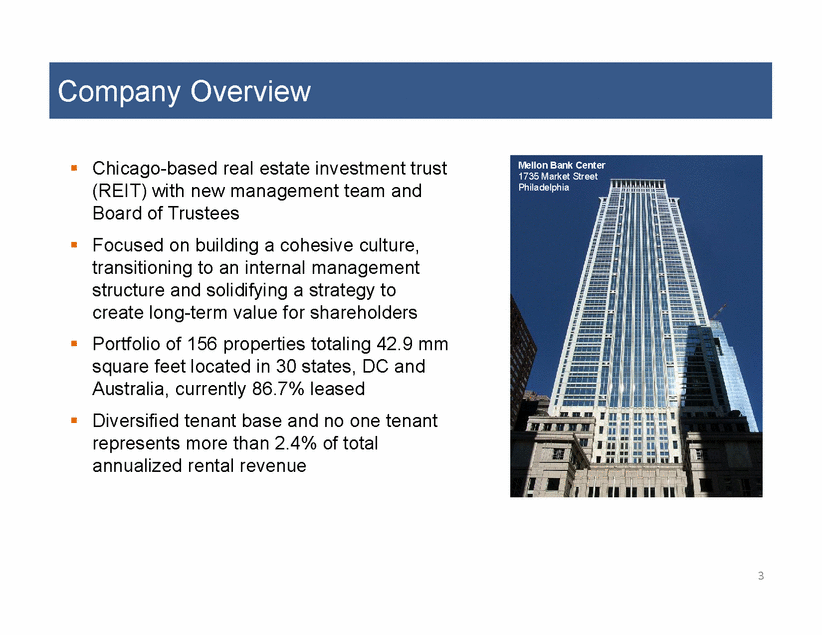
Company Overview 3 . Chicago-based real estate investment trust (REIT) with new management team and Board of Trustees . Focused on building a cohesive culture, transitioning to an internal management structure and solidifying a strategy to create long-term value for shareholders . Portfolio of 156 properties totaling 42.9 mm square feet located in 30 states, DC and Australia, currently 86.7% leased . Diversified tenant base and no one tenant represents more than 2.4% of total annualized rental revenue Mellon Bank Center 1735 Market Street Philadelphia 17th Street Plaza Denver, CO Mellon Bank Center 1735 Market Street Philadelphia |
|
|
March 25 Shareholders voted to remove prior Trustees Significant Events Since Election of New Trustees 4 Focused on transition: hiring key personnel, improving corporate governance and building a foundation for long-term growth March May June June 5 New Trustees approved new Bylaws improving corporate governance June 6 Obtained waiver of change of control default on credit facility and term loan June 13 Entered into property Sub-Management Agreement with CBRE June 17 Terminated Renewed Rights Agreement, or “Poison Pill” June 27 Sold $216 mm portfolio of non-core assets (2.8 mm sf) May 23 Shareholders elected new Board of Trustees Trustees appointed new management team August 1 Changed name to Equity Commonwealth and began trading under new ticker symbol “EQC” Prepaid at par $265 mm mortgage loan on two buildings in Chicago, IL August 15 Paid current and deferred preferred dividends July 9 Sold EQC’s entire stake in Select Income REIT (“SIR”) for $704.8 mm July 14 Hired Adam Markman, EVP, CFO and Treasurer July 18 Repaid $235 mm outstanding balance of revolving credit facility July 31 Shareholders approved amendments to Declaration of Trust improving corporate governance Shareholders elected four new Trustees July August |
|
|
Management Team: Introduction 5 Sam Zell Chairman of the Board Chairman: Equity Group Investments Equity Residential Equity International Equity Office Founder & Chairman David Helfand Chief Executive Officer Equity Group Investments Co-President Helix Funds President ARC CEO Equity Office CIO Equity Lifestyles CEO David Weinberg EVP - Chief Operating Officer Equity Group Investments Helix Funds Equity Office Orrin Shifrin EVP - General Counsel and Secretary Helix Funds ARC Terrapin Properties Katten Muchin Rosenman Adam Markman EVP - Chief Financial Officer & Treasurer Green Street Advisors Bill Griffiths SVP - Capital Markets Helix Funds Equity Office Sarah Byrnes VP - Investor Relations and Capital Markets Retail Properties of America Equity Office |
|
|
Management Team: Our Approach 6 Objective – Create value by combining: . deep real estate experience . contrarian perspective . entrepreneurial execution . rigorous risk management . conservative balance sheet . long-term view Core Values .Create alignment with shareholders and be accountable as fiduciaries .Maintain best-in-class corporate governance . Build a culture that encourages transparency and open communication based on the following guiding principles: Successful track record based on consistent objective and values . Use Your Best Judgment . Keep Your Word . Be a Team Player . No Surprises . Speak Up . Reward Outstanding Performance . Serve Our Customers . Exchange Ideas . Celebrate Diversity Herald Square 1250 H Street, NW Washington, DC |
|
|
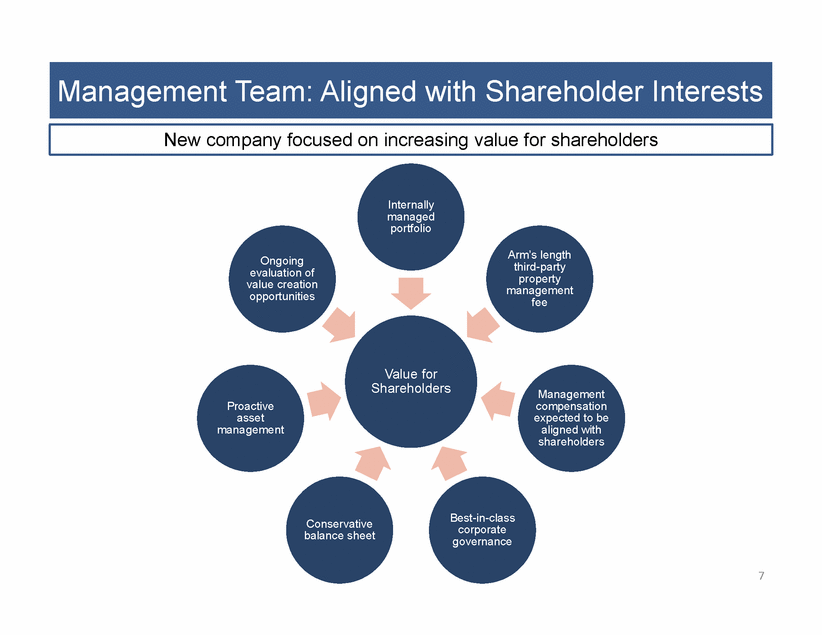
Management Team: Aligned with Shareholder Interests 7 Value for Shareholders Internally managed portfolio Arm’s length third-party property management fee Management compensation expected to be aligned with shareholders Best-in-class corporate governance Conservative balance sheet Proactive asset management Ongoing evaluation of value creation opportunities New company focused on increasing value for shareholders |
|
|
Board of Trustees David Helfand Chief Executive Officer Internal Audit David Weinberg Chief Operating Officer Orrin Shifrin General Counsel Adam Markman Chief Financial Officer Capital Markets / Treasury & Investor Relations Corporate Income Tax Financial Reporting / Corporate Accounting Information Technology Legal Human Resources / Corporate Services Investments Risk Management Asset Management (includes CBRE Property Management) Financial Services Property Accounting (includes CBRE Property Accounting) Engineering Building a lean, adaptable and experienced team. Of 55 current employees, 35 previously worked for another Equity company Staffing: Organizational Chart 8 |
|
|
Staffing: CBRE Property Management & Property Accounting 9 .Eases transition .EQC focused on building a culture and solidifying a strategy to create long-term value .CBRE facilitating transition, including on-boarding property management employees from prior external advisor, as well as sourcing and hiring additional property-level employees .Allows EQC to retain flexibility to sell assets .Subject to certain limitations, no termination fee to CBRE for property dispositions .Ensures EQC retains control .CBRE provides day-to-day property management and property accounting services based on EQC’s property budgets, business plans and oversight Structure eases transition and enhances EQC’s flexibility to buy and sell assets |
|
|
Portfolio Overview 10 1) Based on 2Q 2014 Annualized Rental Revenue per EQC’s 2Q 2014 Supplemental. Annualized rental revenue is annualized contractual rents from our tenants pursuant to existing leases as of 6/30/2014, plus straight line rent adjustments and estimated recurring expense reimbursements; includes some triple net lease rents and excludes lease value amortization. Top six US markets include Chicago, Philadelphia, Austin, Denver, Indianapolis and Bellevue Six largest US markets include Chicago, Philadelphia, Austin, Denver, Indianapolis and Bellevue1 Not shown: Australia assets (10 industrial assets and 1 office building) and 1 selfstorage asset in Honolulu, HI |
|
|
10% 11% 12% 32% 13% 9% 0% 5% 10% 15% 20% 25% 30% 35% Chicago Philadelphia Austin Denver Indianapolis Bellevue Portfolio Overview . 156 properties totaling 42.9 mm sf located in 30 states, DC and Australia .Portfolio generates 92% of annualized rental revenue from office assets, 7% from industrial/flex and 1% from other asset classes % of Annualized Rental Revenue by Market 1 1) Based on 2Q 2014 Annualized Rental Revenue per EQC’s 2Q 2014 Supplemental. Annualized rental revenue is annualized contractual rents from our tenants pursuant to existing leases as of 6/30/2014, plus straight line rent adjustments and estimated recurring expense reimbursements; includes some triple net lease rents and excludes lease value amortization. 2) Includes lease expirations from September 2014 – December 2015. CBD Suburbs Total # of Properties 40 116 156 As a % of Total 26% 74% 100% SF (in millions) 21.9 21.0 42.9 As a % of Total 51% 49% 100% Percent leased 85.4% 88.0% 86.7% Annualized Rental Revenue1 (in millions) $497.7 $300.9 $798.6 As a % of Total 62% 38% 100% CBD vs. Suburbs % of SF Expiring In Each Market Through 2015 2 Unfocused portfolio of office buildings and other product types Overview 11 All Others 54% Bellevue 3% Indianapolis 5% Denver 5% Austin 6% Philadelphia 12% Chicago 15% |
|
|
Portfolio Highlights: Lease Expiration Schedule 12 0.0% 2.0% 4.0% 6.0% 8.0% 10.0% 12.0% 14.0% 16.0% 18.0% 20.0% 0.0 mm sf 1.0 mm sf 2.0 mm sf 3.0 mm sf 4.0 mm sf 5.0 mm sf 6.0 mm sf 7.0 mm sf 2014 2015 2016 2017 2018 2019 2020 2021 2022 2023 Thereafter SF Expiring % of Portfolio Manageable near-term rollover with 4.2% of remaining expirations in 2014 and 11.5% in 2015 Source: EQC 2Q14 Supplemental; however, 2017 expirations adjusted to reflect the amendment of the John Wiley & Sons lease which extended the expiration from 6/30/2017 to 3/31/2033. |
|
|
Portfolio Highlights – A Foundation for Growth 13 Current portfolio includes a core of properties that may serve as a foundation for future long-term growth 17th Street Plaza 1225 17th Street Denver, CO 672,465 sf Chase Tower 111 Monument Circle Indianapolis, IN 1,063,695 sf Mellon Bank Center 1735 Market Street Philadelphia, PA 1,290,678 sf |
|
|
Portfolio Highlights – A Foundation for Growth 14 Herald Square 1250 H Street, NW Washington, DC 187,684 sf Waterfront Corporate Center One 111 River Street Hoboken, NJ 566,215 sf 600 West Chicago Avenue Chicago, IL 1,511,847 sf The Expedia Building 333 108th Ave NE Bellevue, WA 416,503 sf Current portfolio includes a core of properties that may serve as a foundation for future long-term growth |
|
|
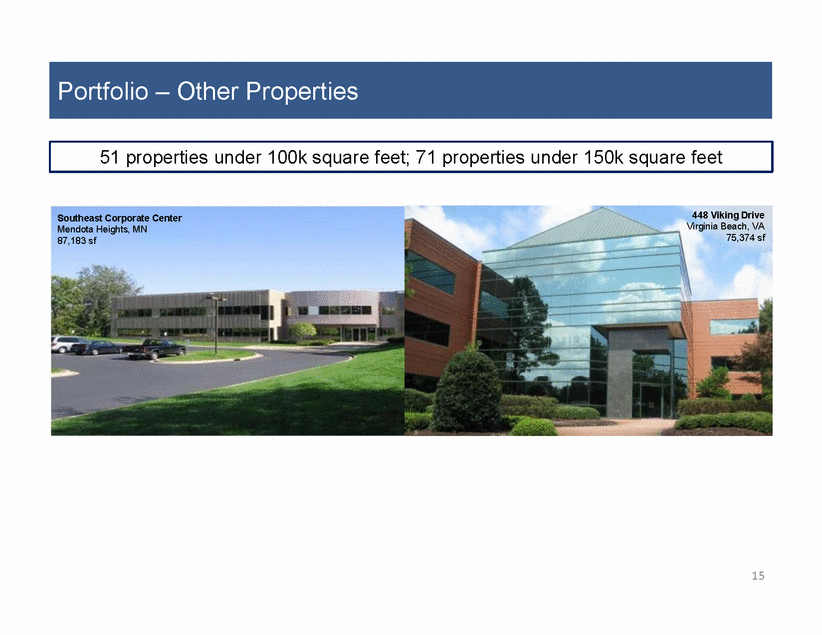
Portfolio – Other Properties 15 51 properties under 100k square feet; 71 properties under 150k square feet Southeast Corporate Center Mendota Heights, MN 87,183 sf 448 Viking Drive Virginia Beach, VA 75,374 sf |
|
|
Strategic Considerations 16 .Building-by-building review of the portfolio to understand merits of each asset and market .Sell small assets .Sell properties if we do not see an opportunity to create a competitive edge .Debate relevance of the remaining portfolio .Continue to own well-leased, liquid assets .Continue to evaluate acquisition opportunities .Aim towards creating concentrated positions in markets where we want to operate .Continue to evaluate the merit of long-term ownership of the following: .Australia portfolio .Non-office assets .Assets for which the liquidity window is currently open but may be limited .Low-quality assets .Remain open-minded to M&A options .Assess opportunities to further improve the company’s balance sheet Identify core assets, exit non-core markets and improve capital structure |
|
|
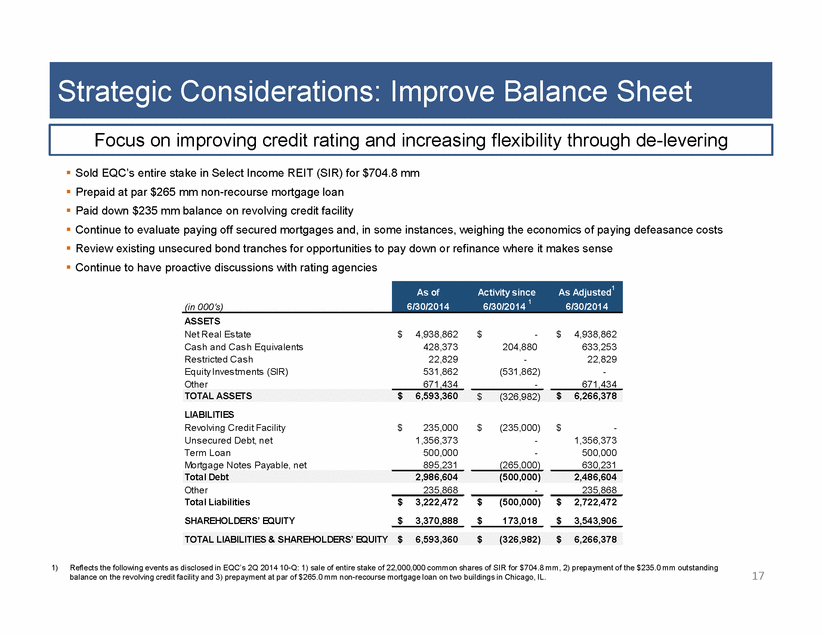
Strategic Considerations: Improve Balance Sheet 17 1) Reflects the following events as disclosed in EQC’s 2Q 2014 10-Q: 1) sale of entire stake of 22,000,000 common shares of SIR for $704.8 mm, 2) prepayment of the $235.0 mm outstanding balance on the revolving credit facility and 3) prepayment at par of $265.0 mm non-recourse mortgage loan on two buildings in Chicago, IL. As of Activity since As Adjusted1 (in 000's) 6/30/2014 6/30/2014 1 6/30/2014 ASSETS Net Real Estate 4,938,862 $ - $ 4,938,862 $ Cash and Cash Equivalents 428,373 204,880 633,253 Restricted Cash 22,829 - 22,829 Equity Investments (SIR) 531,862 (531,862) - Other 671,434 - 671,434 TOTAL ASSETS 6,593,360 $ (326,982) $ 6,266,378 $ LIABILITIES Revolving Credit Facility 235,000 $ (235,000) $ - $ Unsecured Debt, net 1,356,373 - 1,356,373 Term Loan 500,000 - 500,000 Mortgage Notes Payable, net 895,231 (265,000) 630,231 Total Debt 2,986,604 (500,000) 2,486,604 Other 235,868 - 235,868 Total Liabilities 3,222,472 $ (500,000) $ 2,722,472 $ SHAREHOLDERS' EQUITY 3,370,888 $ 173,018 $ 3,543,906 $ TOTAL LIABILITIES & SHAREHOLDERS' EQUITY 6,593,360 $ (326,982) $ 6,266,378 $ Focus on improving credit rating and increasing flexibility through de-levering . Sold EQC’s entire stake in Select Income REIT (SIR) for $704.8 mm . Prepaid at par $265 mm non-recourse mortgage loan . Paid down $235 mm balance on revolving credit facility . Continue to evaluate paying off secured mortgages and, in some instances, weighing the economics of paying defeasance costs . Review existing unsecured bond tranches for opportunities to pay down or refinance where it makes sense . Continue to have proactive discussions with rating agencies |
|
|
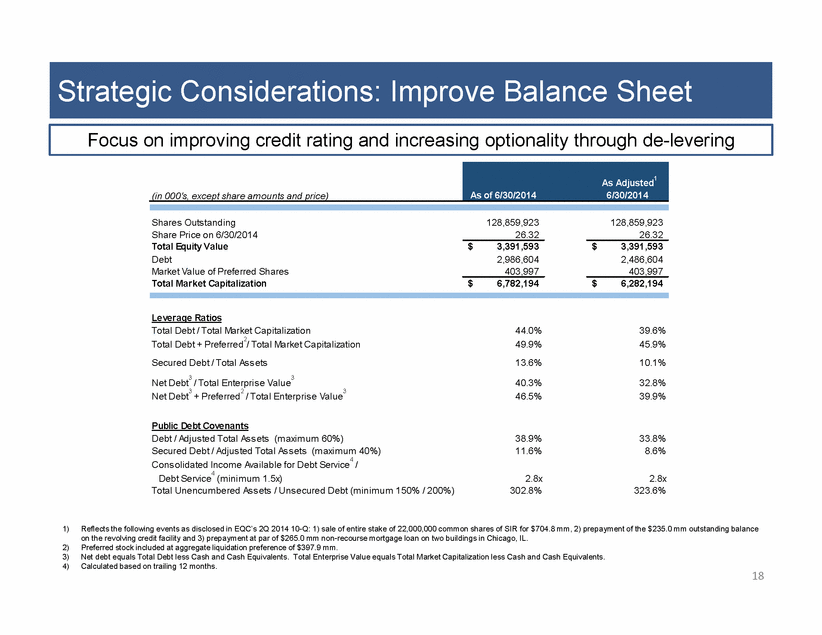
Strategic Considerations: Improve Balance Sheet 18 1) Reflects the following events as disclosed in EQC’s 2Q 2014 10-Q: 1) sale of entire stake of 22,000,000 common shares of SIR for $704.8 mm, 2) prepayment of the $235.0 mm outstanding balance on the revolving credit facility and 3) prepayment at par of $265.0 mm non-recourse mortgage loan on two buildings in Chicago, IL. 2) Preferred stock included at aggregate liquidation preference of $397.9 mm. 3) Net debt equals Total Debt less Cash and Cash Equivalents. Total Enterprise Value equals Total Market Capitalization less Cash and Cash Equivalents. 4) Calculated based on trailing 12 months. (in 000's, except share amounts and price) As of 6/30/2014 As Adjusted1 6/30/2014 Shares Outstanding 128,859,923 128,859,923 Share Price on 6/30/2014 26.32 26.32 Total Equity Value 3,391,593 $ 3,391,593 $ Debt 2,986,604 2,486,604 Market Value of Preferred Shares 403,997 403,997 Total Market Capitalization 6,782,194 $ 6,282,194 $ Leverage Ratios Total Debt / Total Market Capitalization 44.0% 39.6% Total Debt + Preferred2/ Total Market Capitalization 49.9% 45.9% Secured Debt / Total Assets 13.6% 10.1% Net Debt3 / Total Enterprise Value3 40.3% 32.8% Net Debt3 + Preferred2 / Total Enterprise Value3 46.5% 39.9% Public Debt Covenants Debt / Adjusted Total Assets (maximum 60%) 38.9% 33.8% Secured Debt / Adjusted Total Assets (maximum 40%) 11.6% 8.6% Consolidated Income Available for Debt Service4 / Debt Service4 (minimum 1.5x) 2.8x 2.8x Total Unencumbered Assets / Unsecured Debt (minimum 150% / 200%) 302.8% 323.6% Focus on improving credit rating and increasing optionality through de-levering |
|
|
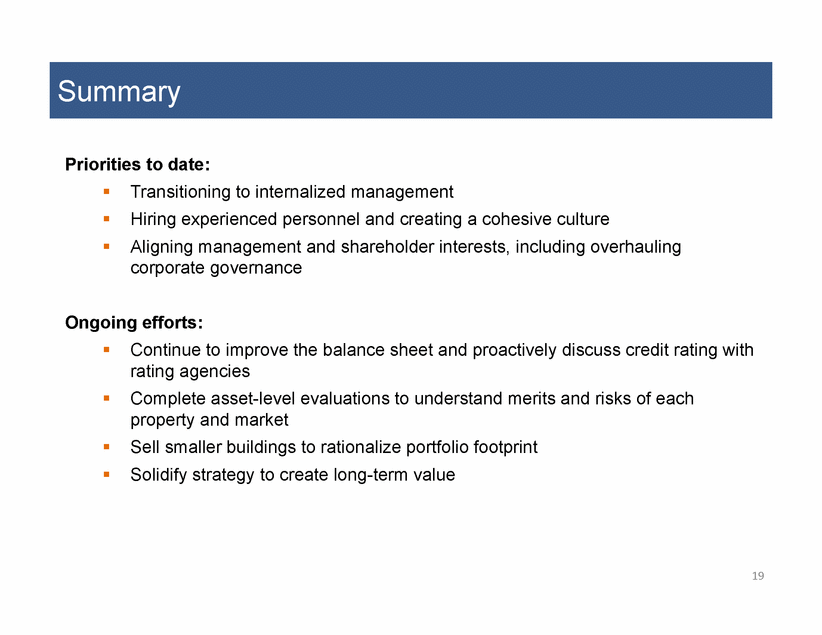
Summary 19 Priorities to date: . Transitioning to internalized management . Hiring experienced personnel and creating a cohesive culture . Aligning management and shareholder interests, including overhauling corporate governance Ongoing efforts: . Continue to improve the balance sheet and proactively discuss credit rating with rating agencies . Complete asset-level evaluations to understand merits and risks of each property and market . Sell smaller buildings to rationalize portfolio footprint . Solidify strategy to create long-term value |


