Attached files
| file | filename |
|---|---|
| 8-K - 8-K - PROVIDENT FINANCIAL SERVICES INC | d780365d8k.htm |
 Exhibit 99.1 |
 Forward Looking
Statements 2
Certain statements contained herein are "forward-looking statements" within the
meaning of Section 27A of the Securities Act of 1933 and Section 21E of the Securities
Exchange Act of 1934. Such forward-looking statements may be identified by reference
to a future period or periods, or by the use of forward-looking terminology, such as "may," "will," "believe,"
"expect,"
"estimate,"
"anticipate,"
"continue,"
or
similar
terms
or
variations
on
those
terms,
or
the
negative
of
those
terms. Forward-looking statements are subject to numerous risks and uncertainties,
including, but not limited to, those related to the economic environment, particularly in
the market areas in which Provident Financial Services, Inc. (the “Company”)
operates, competitive products and pricing, fiscal and monetary policies of the U.S. Government, changes in
government regulations affecting financial institutions, including regulatory fees and capital
requirements, changes in prevailing
interest
rates,
acquisitions
and
the
integration
of
acquired
businesses,
credit
risk
management,
asset-liability
management, the financial and securities markets and the availability of and costs associated
with sources of liquidity. The Company cautions readers not to place undue reliance on
any such forward-looking statements, which speak only as of the
date
made.
The
Company
also
advises
readers
that
the
factors
listed
above
could
affect
the
Company's
financial
performance and could cause the Company's actual results for future periods to differ materially
from any opinions or statements expressed with respect to future periods in any current
statements. The Company does not have any obligation to update any forward-looking
statements to reflect events or circumstances after the date of such statement. A
detailed discussion of factors that could affect our results is included in our SEC filings, including the “Risk Factors”
section of our Annual Report on Form 10-K for the year ended December 31, 2013.
|
 At
6/30/14 Total Assets
$8.4 B
Total Loans
$5.9 B
Total Investments
$1.7 B
Total Deposits
$5.8 B
Tangible Common Equity
$716 M
87 branch offices and 4 LPOs in NJ
and Eastern PA
Market Capitalization (8/25/14)
$1.0 B
3 Mo. Average Daily Shares Traded
(8/25/14)
192,000
(NYSE:PFS)
3 |
 EPS Growth
Opportunities 4
Recent expansion in Eastern PA and Western NJ
Growth of Wealth Management Business
Entry into Asset Based Lending
Capital strength to fund accretive acquisitions and stock
buybacks
Expense management remains a priority |
 Team Capital
Acquisition Announced 12/19/13
Closed 5/30/14
Systems Converted 8/30/14
12 branches: Lehigh Valley (3),
Bucks (2), NJ (7)
$964M FV of Assets Acquired
$634M FV of Loans Acquired
$770M FV of Deposits Acquired
$40M of Goodwill Created
Provident Bank
Team Capital Bank
5 |
 Pennsylvania
Market Entry Team’s Pennsylvania markets have an attractive business climate due to
proximity to large markets such as Philadelphia and New York, lower tax rates and
affordable real estate A large number of Fortune 500 companies have established
warehouses and distribution centers within the region, including Amazon,
Coca-Cola, WalMart, Nestle and Kraft This entry positions Provident to take advantage
of key demographic trends, including Lehigh County had the fastest population growth
from 2010-2012 across Pennsylvania Lehigh
Valley
is
the
third
most
populous
region
in
Pennsylvania,
while
Bucks
County
has
the
fourth
largest
county population
Source: Pennsylvania State Data Center, 2010 U.S. Census, SNL Financial, Deposit data as
of 9/30/13. 6
Lehigh Valley
1
Bucks
County
Pennsylvania
PFS Legacy
Markets
2
Population (2012):
651,240
629,397
12,807,296
577,234
Projected 5
-Year Population Growth:
2.4%
0.7%
1.5%
1.3%
# of Businesses:
23,592
27,664
496,809
22,873
Median Household Income:
$55,180
$73,557
$49,167
$69,276
Projected 5-Year HHI Growth:
20.6
14.4
16.3
14.8
Lehigh Valley Pennsylvania region consists of Lehigh and Northampton counties.
Represents median of Provident’s legacy markets.
1.
2. |
 Financial Impact
of Team Acquisition 7
5% EPS accretion projected in 2015
TBV per share dilution of 3.5% with projected earn-back
< 4 years
IRR > 15%
On track to meet or exceed 25% annualized cost saves |
 Growing Wealth
Management Business 8
Acquired Beacon Trust in August 2011
wholly owned subsidiary of Provident Bank
AUM at 6/30/14 $1.0 billion
AUA at 6/30/14 including managed ETF indices $2.0 billion
Average revenue per managed dollar 74 bps, compared with
57 bps median for similarly sized firms
Net income contribution projected at $750 thousand for 2014
Actively exploring additional acquisition opportunities |
 Asset Based
Lending 9
Acquired a team of 3 experienced individuals in August 2014
Acquired a loan book of $47 million in commitments with
outstandings of $25 million
Growth expectations of approximately $20 million in 2015
Generates increased fee income
Enhances credit controls over existing monitored lines |
 Strong Capital
Position / Capital Formation 10
6/30/2014
Tangible Common Equity
8.90%
Tier 1 Leverage
9.60%
Total Risk-based
12.95%
Dividend payout ratio (last twelve months)
51.72%
Provides ability to pursue accretive acquisitions and/or
repurchase common stock |
 Expense
Management 11
An historical strength of the current management team:
Efficiency Ratio
6 months
Years
2014*
2013
2012
2011
2010
59.84%
57.18%
57.03%
57.31%
57.69%
* Excludes Team Capital acquisition related items and lump sum pension distribution
costs. |
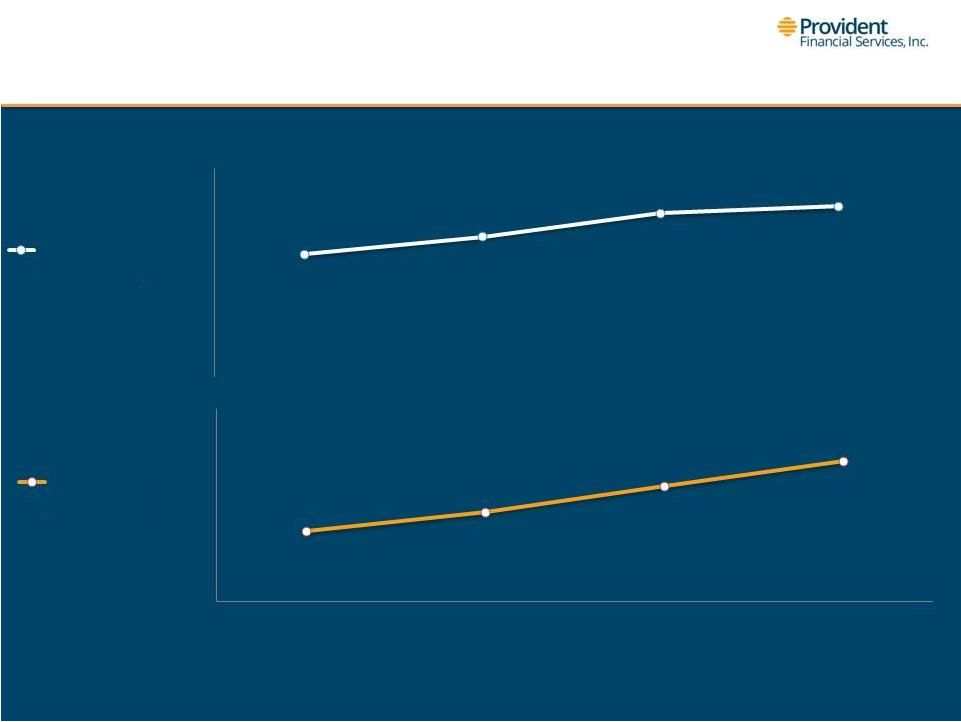 12/13/10
12/31/11
12/31/12
12/31/13
Enhancing Shareholder Value
12
$0.88
$1.01
$1.18
$1.23
Earnings per
Share 12%
CAGR
$9.47
$9.87
$10.40
$10.92
TBV per
Share 5%
CAGR |
 Return of
Capital 10% CAGR
$13.19 Average
$13.19 Average
Cost per Share
Cost per Share
Enhancing Shareholder Value
13
Regular Dividends
$26.8 M
Regular Dividends
$28.7 M
Regular Dividends
$32.2 M
Special Dividend
$12.0 M
$-
$10.0
$20.0
$30.0
$40.0
$50.0
$60.0
2011
2012
2013
Stock Repurchases
$4.1 M
Stock Repurchases
$9.4M
Stock Repurchases
$5.9 M
$30.9 M
$50.1 M
$38.2 M |
 Increasing
Profitability (*in millions)
$49.7
$57.3
$67.3
$70.5
0.73%
0.83%
0.94%
0.97%
$-
$10.0
$20.0
$30.0
$40.0
$50.0
$60.0
$70.0
$80.0
0.50%
0.60%
0.70%
0.80%
0.90%
1.00%
1.10%
12/31/10
12/31/11
12/31/12
12/31/13
Net Income*
ROAA
14 |
 Increasing
Profitability 8.97%
9.81%
10.88%
11.04%
5.46%
6.09%
6.88%
7.08%
12/31/10
12/31/11
12/31/12
12/31/13
ROATE
ROAE
15 |
 Capable Risk
Management 16
ERM Process
Diversified Loan Portfolio
Disciplined Loan Growth
Solid Credit Quality
Well-managed Interest Rate Risk
Plain Vanilla Investment Portfolio
$10 billion Threshold Readiness |
 Diversified Loan
Portfolio - 6/30/14
Total Loans: $5.9 billion
Average Loan Yield: 4.25%
Duration: 2.5 years
Residential
21%
Commercial
Mortgage
28%
16%
Commercial
20%
Consumer
11%
Construction
4%
Multi-family
17 |
 Commercial Real
Estate - 6/30/14
Multi-family
36%
Retail
20%
Office
16%
Industrial
11%
3%
Residential
3%
Hotel
3%
Land
1%
Other
Special Use
Mixed Used
6%
1%
18 |
 Asset Quality
Trend $135.4 M
$
82.2 M
1.91%
1.53%
1.10%
0.86%
0.52%
0.43%
0.22%
0.10%
2011
2012
2013
6/30/2014
NPAs
NPAs/Assets
Annualized NCOs
$111.5 M
$72.3 M
19 |
 Investment
Portfolio – 6/30/14
Agency Notes-
Fixed
6%
Corporate
Notes -
Fixed
1%
Agency MBS -
ARM
5%
Agency CMBS -
Fixed
1%
Agency MBS -
Fixed
36%
Agency CMO -
Fixed
23%
Municipal
28%
Weighted Average Life:
AFS
3.7 yrs
HTM
5.0 yrs
Combined Duration: 4.1 yrs
20 |
 21
Notable Items
IPO 2003
Acquired
First
Sentinel
Bancorp
–
2004
Acquired
First
Morris
Bank
and
Trust
–
2007
Acquired
Beacon
Trust
Company
–
2011
Acquired
Team
Capital
Bank
–
2014
Shifted to a community bank balance sheet
69% commercial loans
85% core deposits
17%
CAGR
NIB
deposits
2010
–
2013
No TARP
No dilutive stock offerings
No debt restructurings
No discounted bulk asset sales
No material credit losses or OTTI charges |