Attached files
| file | filename |
|---|---|
| 8-K - FORM 8-K - BROCADE COMMUNICATIONS SYSTEMS INC | brcd-8keprxfy14q3.htm |
| EX-99.1 - PRESS RELEASE - BROCADE COMMUNICATIONS SYSTEMS INC | brcd-8keprxfy14q3xex991.htm |
 |
Q3 FY 2014 Earnings
Prepared Comments and Slides
August 21, 2014
Steve Coli
Investor Relations
Phone: 408-333-6208
scoli@brocade.com
John Noh
Senior Director, Public Relations
Phone: 408-333-5108
jnoh@brocade.com
NASDAQ: BRCD
Brocade Q3 FY 2014 Earnings 8/21/2014
 |
Prepared comments provided by Steve Coli, Investor Relations
Thank you for your interest in Brocade’s Q3 Fiscal 2014 earnings presentation, which includes prepared remarks, safe harbor, slides, and a press release detailing fiscal third quarter 2014 results. The press release, along with these prepared comments and slides, has been furnished to the SEC on Form 8-K and has been made available on the Brocade Investor Relations website at www.brcd.com. The press release will be issued subsequently via Marketwired.
© 2014 Brocade Communications Systems, Inc. Page 2 of 25
Brocade Q3 FY 2014 Earnings 8/21/2014
 |
© 2014 Brocade Communications Systems, Inc. Page 3 of 25
Brocade Q3 FY 2014 Earnings 8/21/2014
 |
Today’s prepared comments include remarks by Lloyd Carney, Brocade CEO, regarding the company’s quarterly results, its strategy, and a review of operations, as well as industry trends and market/technology drivers related to its business; and by Dan Fairfax, Brocade CFO, who will provide a financial review.
A management discussion and live question and answer conference call will be webcast at
2:30 p.m. PT on August 21 at www.brcd.com and will be archived on the Brocade Investor Relations website.
© 2014 Brocade Communications Systems, Inc. Page 4 of 25
Brocade Q3 FY 2014 Earnings 8/21/2014
 |
Prepared comments provided by Lloyd Carney, CEO
© 2014 Brocade Communications Systems, Inc. Page 5 of 25
Brocade Q3 FY 2014 Earnings 8/21/2014
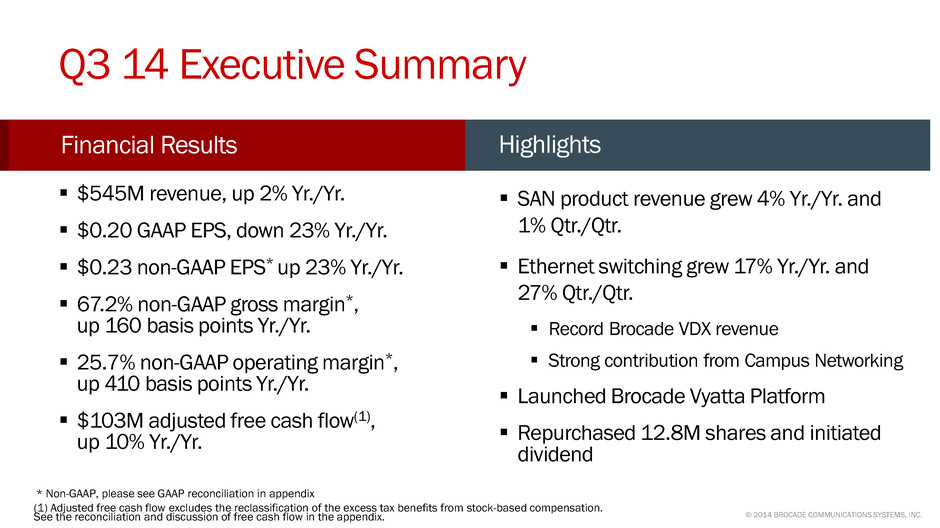 |
With another positive quarter behind us, the company continues to move in the right direction. Many of our financial metrics exceeded expectations, a good example of our focus and execution.
In terms of our business performance, we achieved sequential revenue growth in both SAN and IP Networking. SAN performance was led by strength in international markets and Gen 5 Fibre Channel migration. Our IP Networking revenue was driven by record Brocade VDX® sales in the data center, and strong contribution from our campus networking business. Software continues to be a key differentiator across our core products with Brocade Fabric Vision and Brocade VCS technology playing a strategic role in major customer wins.
Our investments in software are also providing us with incremental opportunities for market disruption and leadership. During Q3, we launched the Brocade Vyatta Platform, an open and modular architecture to deliver virtualized, cloud-ready software networking products. Our technology leadership in network functions virtualization (NFV) and software-defined networking (SDN), including our commitment to an open architecture, is being validated through an increasing number of proof-of-concept trials in large carrier and enterprise data centers.
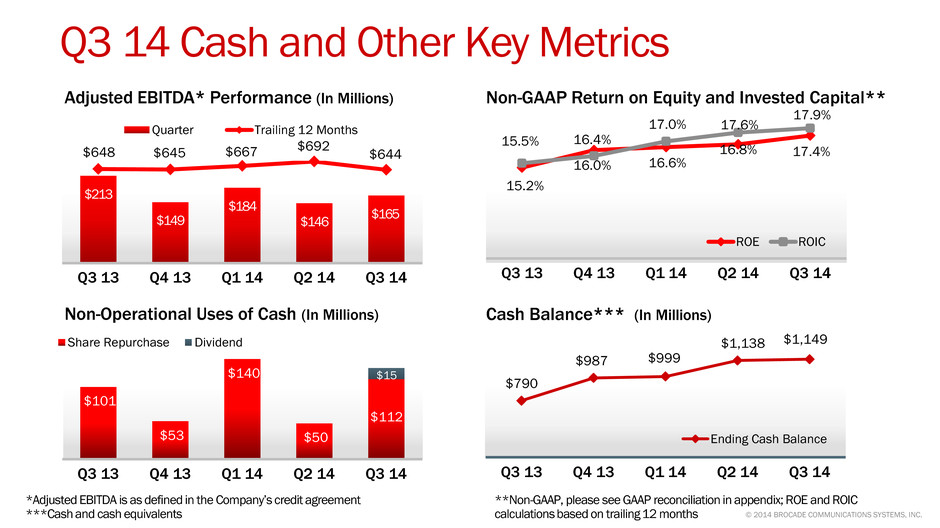
As a result of our positive operating performance, we generated strong cash flow in the quarter and made good progress in returning cash to our shareholders. We paid the company’s first dividend and repurchased nearly 13 million shares of common stock. Through the first three quarters of FY14 we have returned more than 80% of adjusted free cash flow to shareholders.
© 2014 Brocade Communications Systems, Inc. Page 6 of 25
Brocade Q3 FY 2014 Earnings 8/21/2014
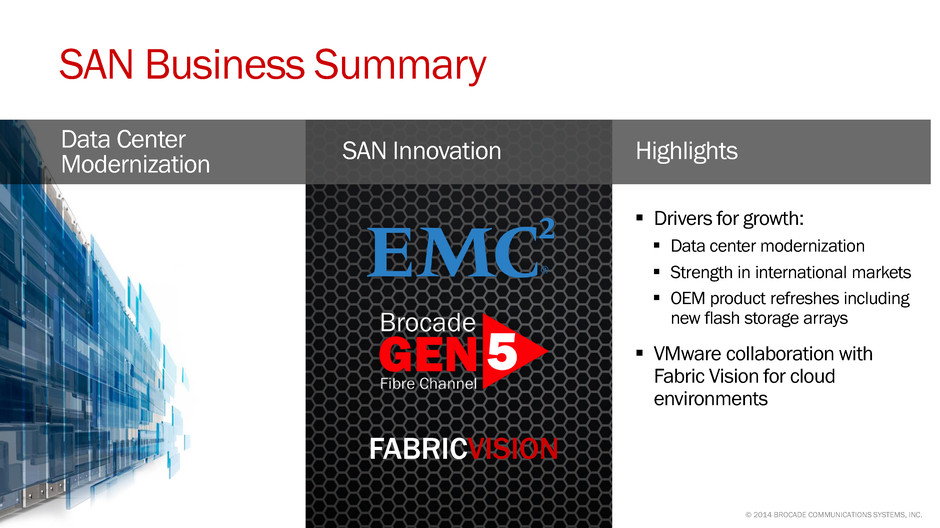 |
SAN product revenue exceeded our outlook for the quarter, growing both sequentially and year-over-year. Data center modernization and SAN refresh projects in international markets were growth drivers. In fact, one of our largest customer wins of the year was a major financial institution in Brazil where we displaced the incumbent as a result of our superior performance and key software feature differentiation.
We are also seeing new opportunities in emerging storage technologies, such as flash, which require high levels of scalability, reliability, and deterministic performance. Our Gen 5 Fibre Channel delivers on these requirements, and as a result, our flash partners are reporting high attach rates. In Q3, the flash market added new products with EMC announcing disk and flash storage solutions that leverage Brocade Gen 5 technology. In addition, we are developing market preference for Gen 5 technology through a broad network of flash partners using the Brocade Solid State Ready Program. We expect to have more news on this program at VMworld in late August.
Finally, in Q3 we announced a collaboration with VMware to provide expanded analytics for Fibre Channel SANs supporting cloud environments. This collaboration allows for more efficient management of cloud-based storage.
© 2014 Brocade Communications Systems, Inc. Page 7 of 25
Brocade Q3 FY 2014 Earnings 8/21/2014
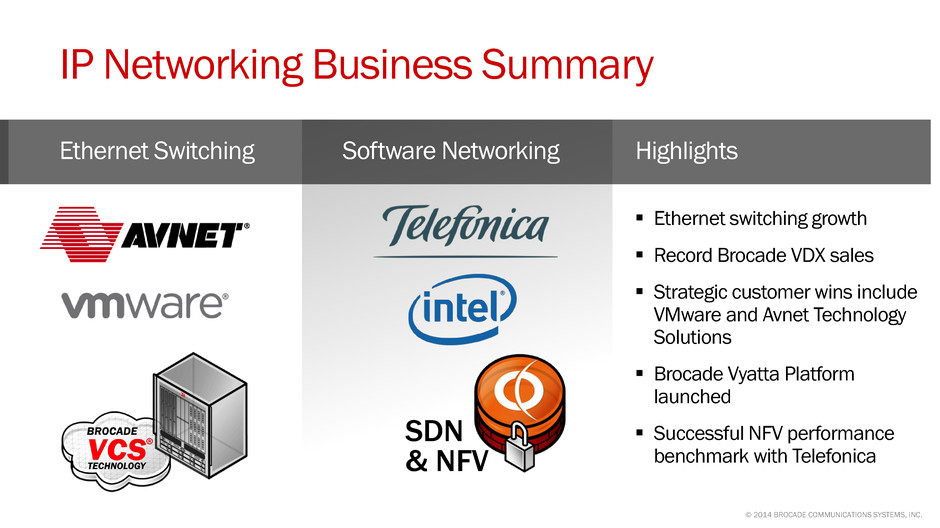 |
IP Networking revenue was in-line within our expectations, growing sequentially and down slightly year-over-year. Much of the sequential increase was driven by strong performance in our Ethernet switching products, highlighted by record Brocade VDX sales and a strong contribution from campus networking. Customer wins for VDX in Q3 included VMware and Avnet Technology Solutions, both for their internal data centers. These wins are significant because they highlight the value of our VCS Fabric technology as the foundation for virtualized data centers and as an underlay for SDN.
Across our portfolio, strategic investments in software technology are enhancing and creating opportunities for our IP networking products. We are making strides in our existing software networking portfolio through leading innovation and commitment to open architectures. We delivered on this commitment in Q3 by announcing the Brocade Vyatta® Platform that delivers an open and modular networking architecture for cloud and mobile service providers.
This strategy is being validated through an increasing number of proof-of-concept trials, including five of the top 10 mobile providers. We recently announced the results of one of these trials with Telefónica, the sixth largest mobile operator in the world. Under the Telefónica NFV Reference Lab framework, Brocade and Telefónica established new benchmarks for software networking performance and deployment using an Intel®-based x86 server.
© 2014 Brocade Communications Systems, Inc. Page 8 of 25
Brocade Q3 FY 2014 Earnings 8/21/2014
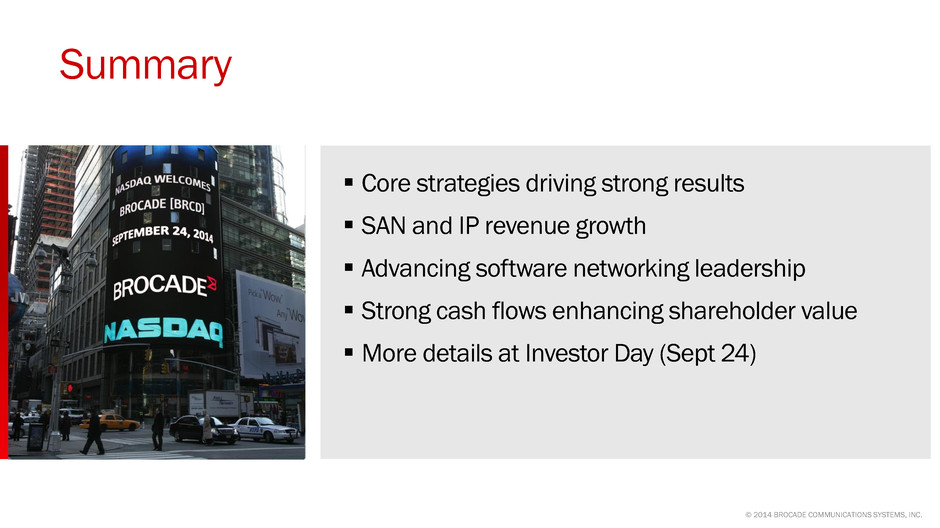 |
In summary, we remain focused on our core strategies and the exciting opportunities for both our hardware and software products. Storage networking continues to generate a healthy base of revenue and contribute positively to our financial model. Our IP Networking business is growing, driven by improved execution in key geographies and customer segments. We continue to make strategic investments in software that provide differentiation and additional market opportunities.
We remain focused on our commitments to our shareholders and we are ahead of plan to return at least 60% of our free cash flow.
On September 24 we will host an Investor Day event in New York City. At that time, we will provide further details about our progress, take you through our market opportunities, and provide an updated financial model. I encourage you to attend in person or participate virtually, and look forward to speaking with you soon.
© 2014 Brocade Communications Systems, Inc. Page 9 of 25
Brocade Q3 FY 2014 Earnings 8/21/2014
 |
Prepared comments provided by Dan Fairfax, CFO
© 2014 Brocade Communications Systems, Inc. Page 10 of 25
Brocade Q3 FY 2014 Earnings 8/21/2014
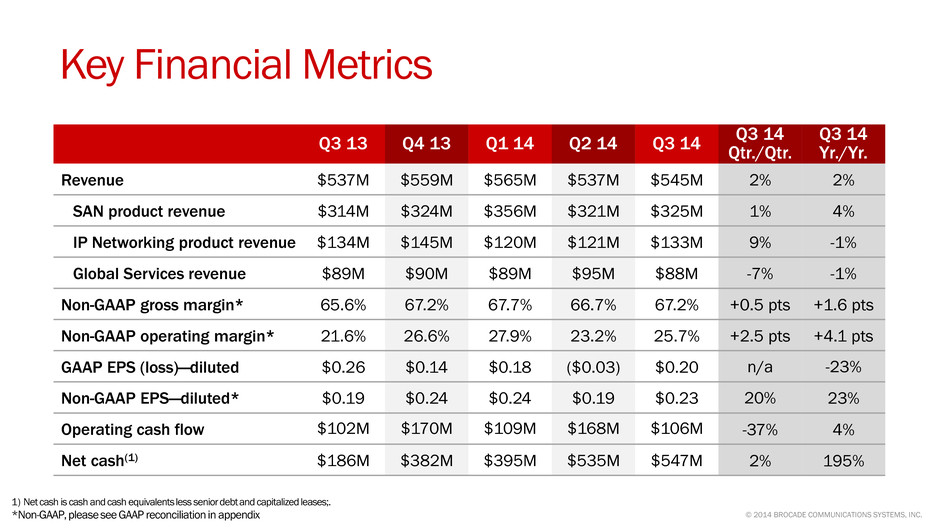 |
In Q3 14, revenue was $545M, up 2% Yr./Yr. and up 2% Qtr./Qtr. SAN product revenue was $325M, an increase of 4% Yr./Yr. and 1% Qtr./Qtr. in what is typically a seasonally soft quarter. Revenue from our IP Networking products in Q3 14 was $133M, down 1% Yr./Yr. and up 9% Qtr./Qtr. Q3 14 Global Services revenue was $88M, down 1% Yr./Yr. and down 7% sequentially. The sequential decrease was primarily due to Q2 14 having 14 weeks of amortized support revenue compared to 13 weeks in Q3 14.
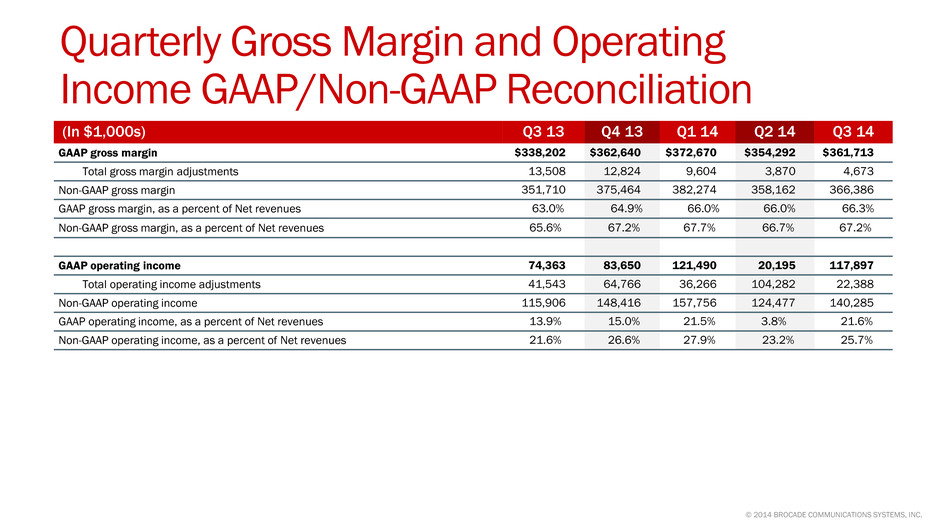
Non-GAAP gross margin was 67.2% in Q3 14, up 160 basis points from Q3 13 and up 50 basis points from Q2 14. The improvement in gross margin was due to higher revenues combined with lower manufacturing and overhead costs. Non-GAAP operating margin was 25.7% in Q3, up 410 basis points from Q3 13 and up 250 basis points from Q2 14, primarily due to higher revenue and lower spending.
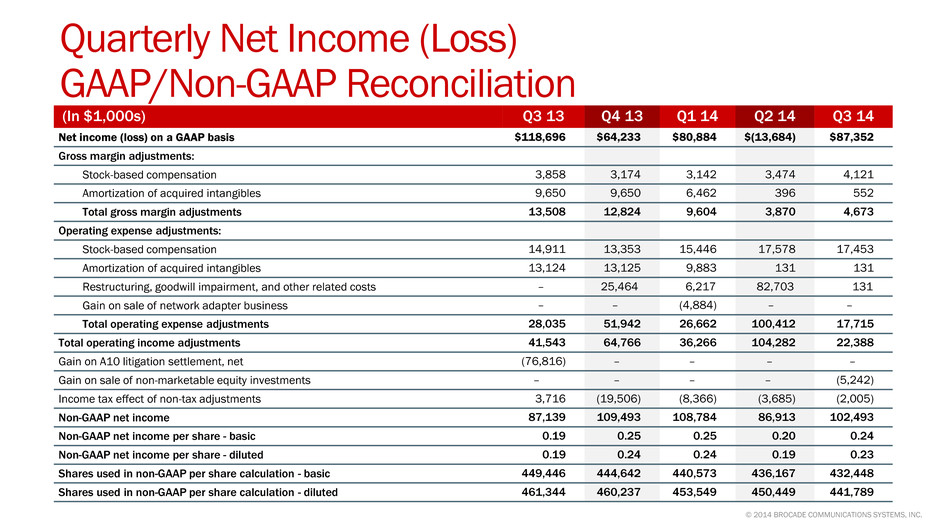
Q3 14 GAAP earnings per share (EPS) was $0.20, down from EPS of $0.26 in Q3 13, which included the A10 Networks litigation settlement payment of $77M (increased EPS by $0.13), and up from a loss per share of $0.03 in Q2 14, which included a $83M non-cash goodwill impairment charge (decreased EPS by $0.19) associated with the strategic repositioning of the Brocade ADX® product family. Non-GAAP diluted EPS was $0.23 in the quarter, up from $0.19 in Q3 13 and up from $0.19 in Q2 14.
In Q3 14, the effective GAAP tax rate was 23.4% and the effective non-GAAP tax rate was 21.9%. The effective GAAP and non-GAAP tax rates for Q3 14 were higher year-over-year due to the benefit of the federal R&D tax credit last year as well as tax reserve releases in Q3 13 associated with the final settlement of certain disputed tax assessments.
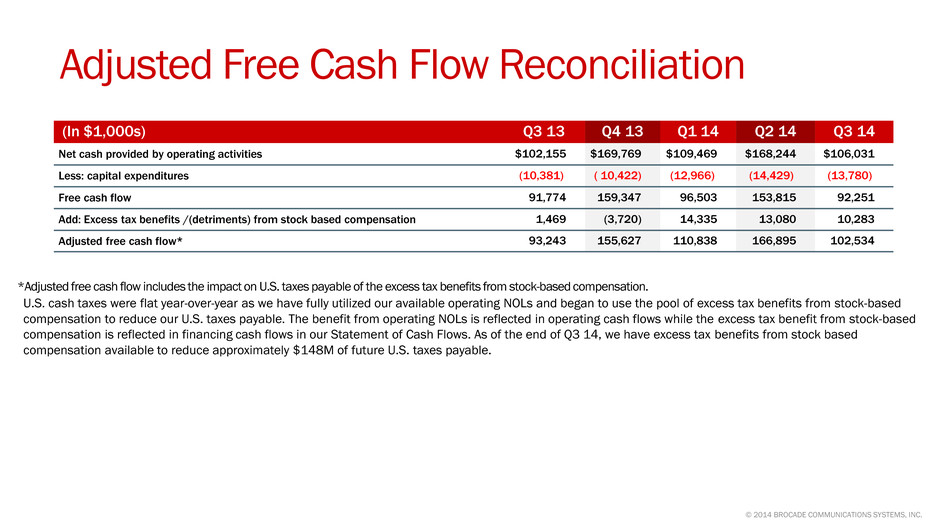
In Q3 14, we generated $106M in operating cash flow, up 4% Yr./Yr. and down 37% Qtr./Qtr. The year-to-year increase in operating cash flow was primarily due to lower days sales outstanding (DSOs), increased operating profits, offset by an increase in the excess tax benefit from stock-based compensation. The decrease in operating cash flow from Q2 14 was due to the timing of variable compensation and long-term debt interest payments, which are both paid semi-annually. Average diluted shares outstanding for Q3 14 was 442 million shares, down 4% Yr./Yr. and 2% Qtr./Qtr.
© 2014 Brocade Communications Systems, Inc. Page 11 of 25
Brocade Q3 FY 2014 Earnings 8/21/2014
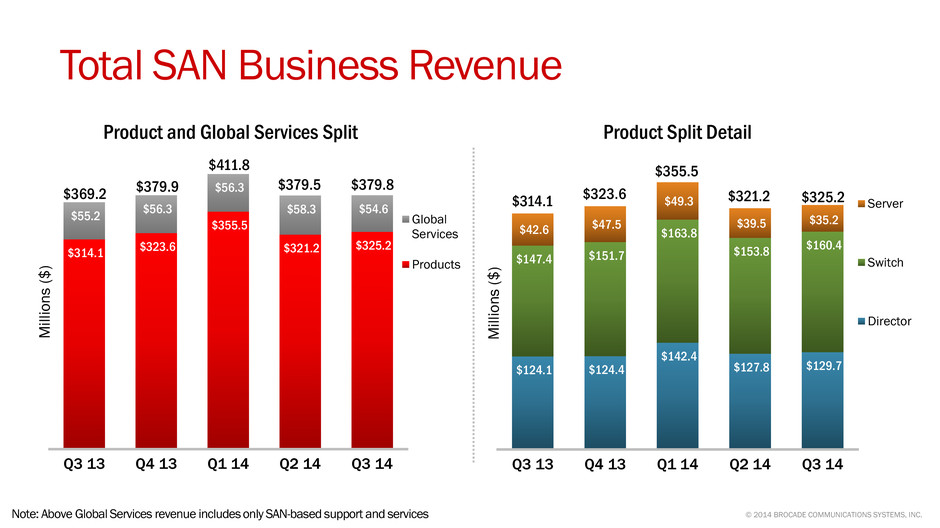 |
Revenue from our total SAN business, including hardware products and SAN-based support and services, in Q3 14 was $380M, up 3% from Q3 13 and flat sequentially.
Our SAN product revenue in the quarter saw strong performance in our switch and director product families. SAN product revenue was $325M in the quarter, up 4% Yr./Yr. and up 1% sequentially. When adjusted for the sale of the network adapter business that occurred in Q1 14, SAN product revenue was up 5% Yr./Yr.
Looking at the SAN product families, director revenue was up 5% Yr./Yr. and up 2% sequentially due to strength in international markets and continued customer migration to Gen 5. SAN switch revenue was up 9% Yr./Yr. and up 4% Qtr./Qtr. due to Gen 5 migration and growth in high-end switch sales. Our Server product group, including embedded switches and server adapter products, was down 17% Yr./Yr. and down 11% Qtr./Qtr. When adjusted for the sale of the network adapter business, Server product group revenue was down 11% Yr./Yr. and down 11% sequentially due to softness in APAC and lower seasonal revenue from some OEM partners, as well as certain OEM specific operational factors.
SAN-based support and services revenue was $55M in the quarter, down 1% Yr./Yr. and down 7% sequentially due to Q2 14 having 14 weeks of amortized support revenue compared to 13 weeks in Q3 14.
© 2014 Brocade Communications Systems, Inc. Page 12 of 25
Brocade Q3 FY 2014 Earnings 8/21/2014
 |
Revenue from our total IP Networking business, including hardware and IP-based support and services, in Q3 14 was $166M, down 1% Yr./Yr. and up 5% sequentially. The sequential increase was principally due to higher sales to the U.S. Federal government and strong VDX sales to data center customers, partially offset by lower routing sales to service provider customers. Our Federal revenue was approximately $23M in the quarter, up 16% Yr./Yr. and up 74% Qtr./Qtr.
Q3 14 IP Networking product revenue was $133M, down 1% Yr./Yr. and up 9% sequentially. The year-over-year decline was primarily due to lower routing product revenue, the divestiture of the network adapter business and the changes in the wireless and Brocade ADX business strategies, which offset growth in Ethernet switching revenue. Excluding network adapters, wireless, and ADX hardware products, the IP Networking product revenue grew 6% Yr./Yr. on an adjusted basis. The sequential increase was due to higher sales of Ethernet switching products, primarily to the U.S Federal government, and strong VDX sales, partially offset by lower routing sales.
As we look at the product splits for IP Networking in the quarter, our Ethernet switch revenue, which includes products for the data center and campus LAN environments, was $91M, up 17% Yr./Yr. and 27% Qtr./Qtr. Our switch revenue includes Brocade VDX products, which were up 38% Yr./Yr. and up 37% Qtr./Qtr. Our routing products generated $34M in revenue, down 19% Yr./Yr. and down 20% Qtr./Qtr due to a pause in customer orders in anticipation of new products scheduled for release in fiscal Q4 14.
Other IP Networking revenue of $7M was down 47% Yr./Yr. and up 14% Qtr./Qtr. The year-over-year decrease was due to the divestiture of the network adapter business as well as lower Brocade ADX sales. IP Networking-based support and services revenue was $33M in the quarter, down 1% Yr./Yr. and down 9% sequentially due to Q2 14 having 14 weeks of amortized support revenue compared to 13 weeks in Q3 14.
The split of our IP Networking business based on customer use cases is an important measurement of the progress we are making on our data center strategy. Although it is difficult to identify all end users and their specific network deployments due to our two-tier distribution channel, we are providing estimates of the split of our IP Networking business. Our data center customers represented approximately 55% of IP Networking revenue in Q3 14, compared with 57% in Q2 14 and 48% in Q3 13. The estimated percentage of revenue coming from data center IP Networking customers may fluctuate quarter-to-quarter due to the timing of large data center customer transactions, minor changes to classification from improved visibility of actual customer deployments, as well as the seasonality of the public sector, including Federal. Other use cases, such as enterprise campus and carrier networks (MAN/WAN) represent the balance of the business.
Looking at revenue geographically from a ship-to location, the Americas region (excluding Federal) was down approximately 11% Yr./Yr., the EMEA region was up 6% Yr./Yr., the APAC region was up 2% Yr./Yr., and the Japan region was down 2% Yr./Yr. On a sequential basis, the Americas region (excluding Federal) was down 6%, EMEA was flat, APAC was down 2%, and Japan was up 3%.
© 2014 Brocade Communications Systems, Inc. Page 13 of 25
Brocade Q3 FY 2014 Earnings 8/21/2014
 |
In Q3 14, three customers (EMC, HP , and IBM) each contributed at least 10% of total Company revenue. Our 10% customers collectively contributed 48% of revenue in Q3 14, down 8% from Q2 14 and up 1% from Q3 13. All other OEMs represented 19% of revenue in Q3 14, unchanged from Q3 13 and up 7% from Q2 14 when HDS was a 10% customer. Channel and direct routes to market contributed 33% of revenue in Q3 14, up 1% from Q2 14 and down 1% from Q3 13.
The mix of business based on ship-to location was 56% domestic and 44% international in the quarter, a lower domestic share compared to 59% in Q2 14 and 61% in Q3 13. Since some of our OEMs take delivery of our products domestically and then ship internationally to their end users, the percentage of international revenue based on end-user location would be higher.
© 2014 Brocade Communications Systems, Inc. Page 14 of 25
Brocade Q3 FY 2014 Earnings 8/21/2014
 |
Q3 14 non-GAAP company gross margin of 67.2% exceeded our original guidance range for the
quarter primarily due to a higher mix of SAN sales.
Q3 14 non-GAAP product gross margin was 68.8%, above our FY14 target model range of 66.0% to 68.0%. This represents an increase of approximately 50 basis points from Q2 14 and an increase of approximately 210 basis points from Q3 13. The sequential improvement was primarily due to higher revenue and lower manufacturing and overhead costs. The year-over-year increase was due to a favorable revenue mix shift to more SAN products, a favorable product and customer mix within the IP Networking business, and lower manufacturing and overhead costs.
Q3 14 non-GAAP SAN product gross margin percentage was in the mid-70’s, slightly better quarter-over-quarter and year-over-year. Q3 14 non-GAAP IP Networking product gross margin percentage was in the mid-50’s, slightly up quarter-over-quarter and up over the prior year.
Non-GAAP Global Services gross margin was 58.8% in Q3 14, down 40 basis points quarter-over-quarter primarily due to lower revenue when compared to the 14-week second quarter. Non-GAAP Global Services gross margin was down 80 basis points year-over-year on lower support revenue.
© 2014 Brocade Communications Systems, Inc. Page 15 of 25
Brocade Q3 FY 2014 Earnings 8/21/2014
 |
Non-GAAP gross margin was 67.2% in Q3 14, higher than our FY14 target model of 65.0% to 66.0%. The over-performance was due to higher revenue, favorable mix shift to more SAN products, and lower manufacturing and overhead costs.
On a non-GAAP basis, total operating expenses of $226M, or 41.5% of revenues in Q3 14, were within our FY14 target model range of 40.0% to 42.0%.
Non-GAAP operating margin was 25.7% in Q3 14, an improvement of 410 basis points compared with Q3 13 and a 250 basis points improvement compared with Q2 14. The increase was primarily due to higher revenue, improved gross margins, and lower overall spending.
Ending headcount was 4,103 in Q3 14, up 42 from 4,061 in Q2 14, and down 462 from 4,565 in Q3 13.
© 2014 Brocade Communications Systems, Inc. Page 16 of 25
Brocade Q3 FY 2014 Earnings 8/21/2014
 |
Operating cash flow was $106M in Q3 14, up 4% Yr./Yr. and down 37% sequentially. The increase in cash flow from the prior year was primarily due to lower DSOs as well as increased non-GAAP net income. The sequential decrease in cash from operations was primarily due to the timing of variable compensation and long-term debt interest payments, which are both paid semi-annually. We saw better shipment linearity in Q3 14, resulting in DSOs of 32.0 days, a solid improvement from 35.4 days in Q2 14 and 37.1 days in Q3 13.
The excess tax benefit from stock-based compensation resulted in a decrease of operating cash flow and an offsetting increase in cash flows from financing activities for Q3 14 of $10M as compared with a decrease of $13M in Q2 14 and a decrease of $1M in Q3 13. We describe the free cash flow impact of the excess tax benefit from stock-based compensation in the appendix.
Total capital expenditures in the quarter were $14M. Cash and cash equivalents were $1,149M in Q3 14, up $12M from Q2 14 and up $359M from Q3 13. The U.S. cash balance was $382M at the end of Q3 14.
In Q3 14, we initiated a quarterly cash dividend of $0.035 per share of common stock and
repurchased $112M of common stock at an average purchase price of $8.77. Year to date, we have repurchased $303M of common stock as of the end of Q3 14. Combined with the dividend, this represents a return to our shareholders of more than 80% of adjusted free cash flow over the first nine months of FY14. In Q4 14, we have repurchased $7M of common stock as of the close of market on August 20, 2014.
© 2014 Brocade Communications Systems, Inc. Page 17 of 25
Brocade Q3 FY 2014 Earnings 8/21/2014
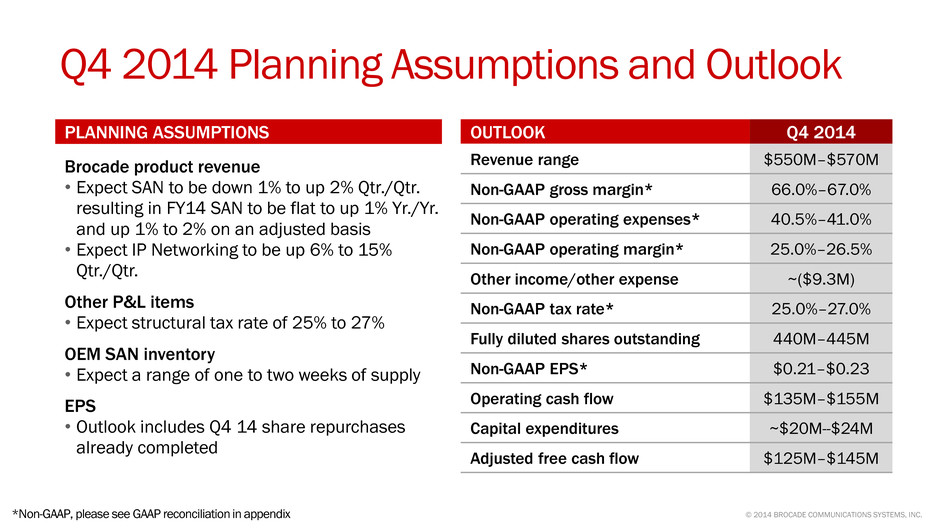 |
Looking forward to Q4 14, we considered a number of factors, including the following, in setting our outlook:
• | For Q4 14, we expect SAN revenue to be down 1% to up 2% Qtr./Qtr. Typically we see stronger buying patterns from our OEM partners in our fiscal Q4. However, we considered the potential impact of the geo-political environment in certain emerging markets and business transitions within certain OEM partners in our outlook. |
• | We expect our Q4 14 IP Networking revenue to be up 6% to 15% Qtr./Qtr., principally driven by growth in our service provider revenue with the launch of new high-density routing products and a seasonally stronger quarter for our U.S. Federal customers. |
• | We expect our Global Services revenue to be up 2% Qtr./Qtr. |
• | We expect non-GAAP operating expenses to be flat to up 2% Qtr./Qtr. |
• | At the end of Q3 14, OEM inventory was approximately 1.4 weeks of supply based on SAN business revenue. We expect inventory to be between one to two weeks in Q4 14, as OEM inventory levels may fluctuate due to both seasonality and large end-user order patterns at the OEMs. |
• | We have assumed a structural non-GAAP tax rate of 25% to 27% for Q4 14. |
• | We expect Q4 14 operating cash flow to be higher sequentially due to the timing of variable compensation and bond interest payments, offset by higher DSOs. |
• | We expect Q4 14 non-GAAP gross margin to be between 66.0% to 67.0%, better than our two-year target model range, and non-GAAP operating margin to be between 25.0% to 26.5%, also above our two-year target model range. |
© 2014 Brocade Communications Systems, Inc. Page 18 of 25
Brocade Q3 FY 2014 Earnings 8/21/2014
 |
Prepared comments provided by Steve Coli, Investor Relations
That concludes Brocade’s prepared comments. At 2:30 p.m. Pacific Time on August 21, Brocade will host a webcast conference call at www.brcd.com.
Thank you for your interest in Brocade.
© 2014 Brocade Communications Systems, Inc. Page 19 of 25
Brocade Q3 FY 2014 Earnings 8/21/2014
 |
© 2014 Brocade Communications Systems, Inc. Page 20 of 25
Brocade Q3 FY 2014 Earnings 8/21/2014
 |
Additional Financial Information:
Q3 13 | Q2 14 | Q3 14 | ||||
GAAP gross margin | 63.0 | % | 66.0 | % | 66.3 | % |
Non-GAAP gross margin | 65.6 | % | 66.7 | % | 67.2 | % |
GAAP product gross margin | 64.2 | % | 67.8 | % | 68.2 | % |
Non-GAAP product gross margin | 66.7 | % | 68.3 | % | 68.8 | % |
GAAP services gross margin | 57.2 | % | 57.4 | % | 56.4 | % |
Non-GAAP services gross margin | 59.6 | % | 59.2 | % | 58.8 | % |
GAAP operating margin | 13.9 | % | 3.8 | % | 21.6 | % |
Non-GAAP operating margin | 21.6 | % | 23.2 | % | 25.7 | % |
© 2014 Brocade Communications Systems, Inc. Page 21 of 25
Brocade Q3 FY 2014 Earnings 8/21/2014
 |
© 2014 Brocade Communications Systems, Inc. Page 22 of 25
Brocade Q3 FY 2014 Earnings 8/21/2014
 |
© 2014 Brocade Communications Systems, Inc. Page 23 of 25
Brocade Q3 FY 2014 Earnings 8/21/2014
 |
© 2014 Brocade Communications Systems, Inc. Page 24 of 25
Brocade Q3 FY 2014 Earnings 8/21/2014
 |
© 2014 Brocade Communications Systems, Inc. Page 25 of 25