Attached files
| file | filename |
|---|---|
| 8-K - 8-K - Boardwalk Pipeline Partners, LP | bwp14088kinvestorconference.htm |
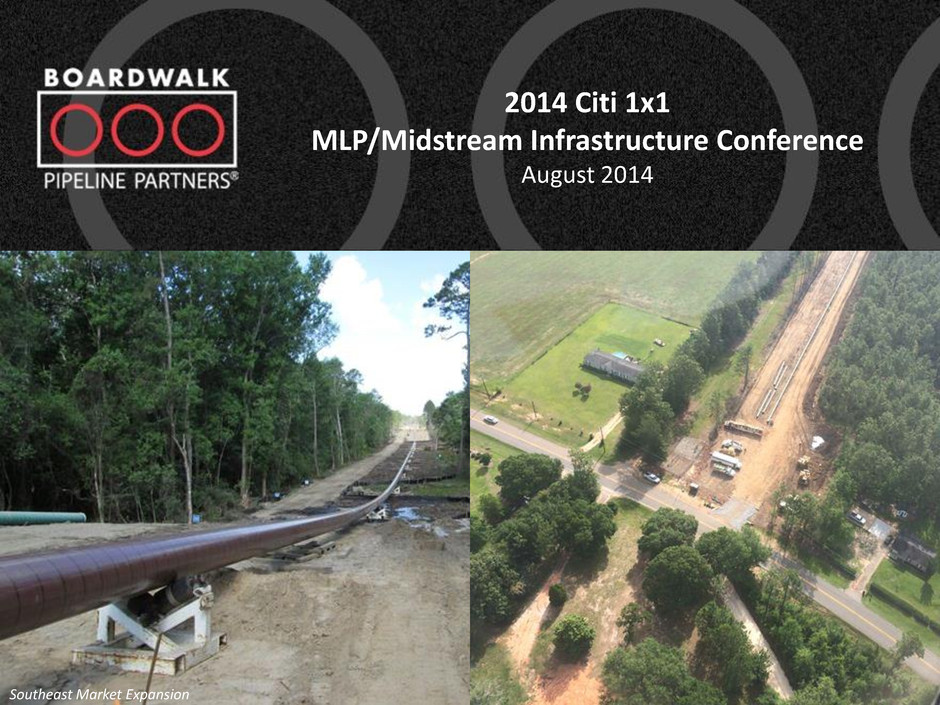
1 2014 Citi 1x1 MLP/Midstream Infrastructure Conference August 2014 Southeast Market Expansion
2 Important Information Forward-looking statements disclosure Statements made at this conference or in the materials distributed in conjunction with this conference that contain "forward-looking statements" include, but are not limited to, statements using the words “believe”, “expect”, “plan”, “intend”, “anticipate”, “estimate”, “project”, “should” and similar expressions, as well as other statements concerning our future plans, objectives, and expected performance, including statements with respect to the completion, cost, timing and financial performance of growth projects. Such statements are inherently subject to a variety of risks and uncertainties that could cause actual results to differ materially from those projected. Forward-looking statements speak only as of the date they are made, and the company expressly disclaims any obligation or undertaking to release publicly any updates or revisions to any forward-looking statement contained herein or made at this conference to reflect any change in our expectations with regard thereto or any change in events, conditions or circumstances on which any such statement is based. For information about important Risk Factors that could cause our actual results to differ from those expressed in the forward-looking statements contained in this presentation or discussed at this conference please see “Available Information and Risk Factors,” below. Given the Risk Factors referred to below, investors and analysts should not place undue reliance on forward-looking statements. Available Information and Risk Factors We file annual, quarterly and current reports and other information with the Securities and Exchange Commission, or “SEC”. Our SEC filings are available to the public over the internet at our website, www.bwpmlp.com, and at the SEC’s website www.sec.gov. Our filings with the SEC contain important information which anyone considering the purchase of our limited partnership units should read. Our business faces many risks. We have described in our SEC filings some of the more material risks we face. There may be additional risks that we do not yet know or that we do not currently perceive to be material that may also impact our business. Each of the risks and uncertainties described in our SEC filings could lead to events or circumstances that may have a material adverse effect on our business, financial condition, results of operations or cash flows, including our ability to make distributions to our unitholders. Our limited partnership units are listed on the New York Stock Exchange under the trading symbol “BWP”.
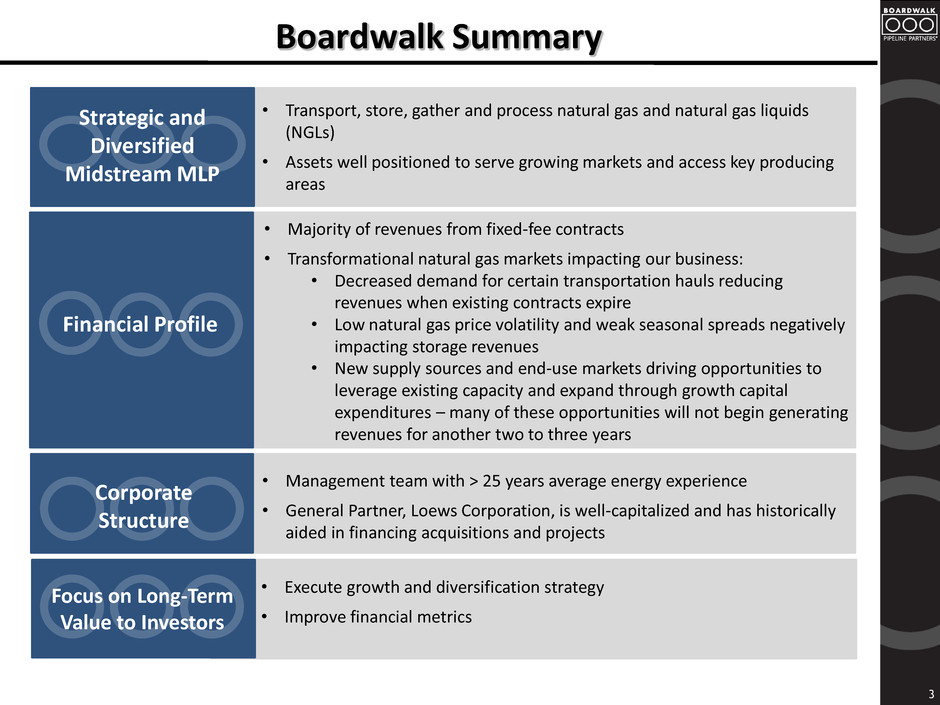
3 • Transport, store, gather and process natural gas and natural gas liquids (NGLs) • Assets well positioned to serve growing markets and access key producing areas Strategic and Diversified Midstream MLP • Execute growth and diversification strategy • Improve financial metrics Focus on Long-Term Value to Investors • Management team with > 25 years average energy experience • General Partner, Loews Corporation, is well-capitalized and has historically aided in financing acquisitions and projects Corporate Structure Financial Profile • Majority of revenues from fixed-fee contracts • Transformational natural gas markets impacting our business: • Decreased demand for certain transportation hauls reducing revenues when existing contracts expire • Low natural gas price volatility and weak seasonal spreads negatively impacting storage revenues • New supply sources and end-use markets driving opportunities to leverage existing capacity and expand through growth capital expenditures – many of these opportunities will not begin generating revenues for another two to three years Financial Profile Boardwalk Summary
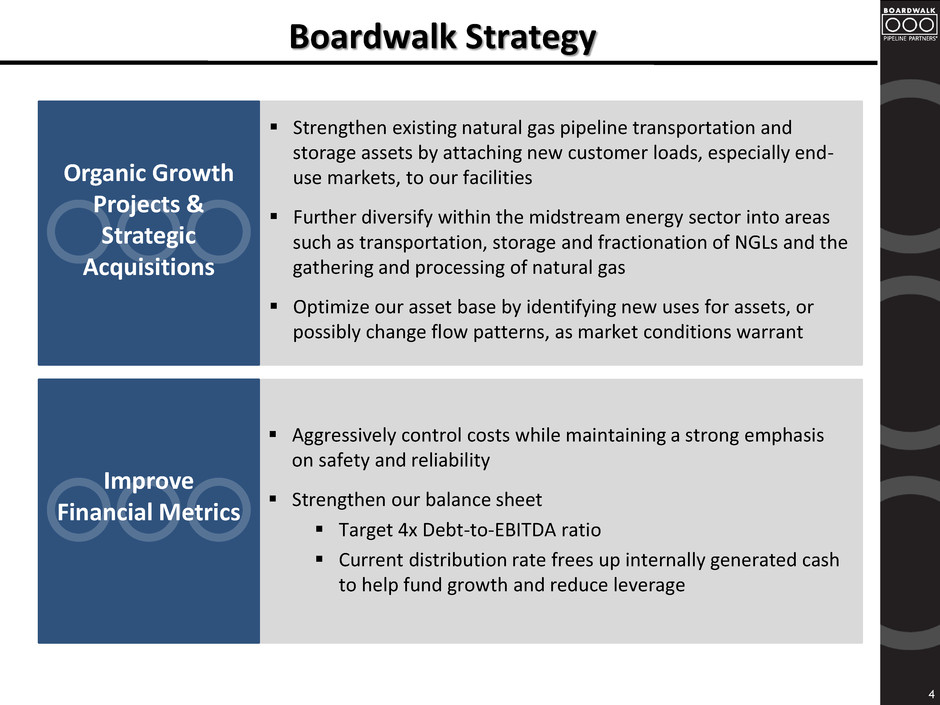
Boardwalk Strategy 4 Strengthen existing natural gas pipeline transportation and storage assets by attaching new customer loads, especially end- use markets, to our facilities Further diversify within the midstream energy sector into areas such as transportation, storage and fractionation of NGLs and the gathering and processing of natural gas Optimize our asset base by identifying new uses for assets, or possibly change flow patterns, as market conditions warrant Aggressively control costs while maintaining a strong emphasis on safety and reliability Strengthen our balance sheet Target 4x Debt-to-EBITDA ratio Current distribution rate frees up internally generated cash to help fund growth and reduce leverage Organic Growth Projects & Strategic Acquisitions Improve Financial Metrics
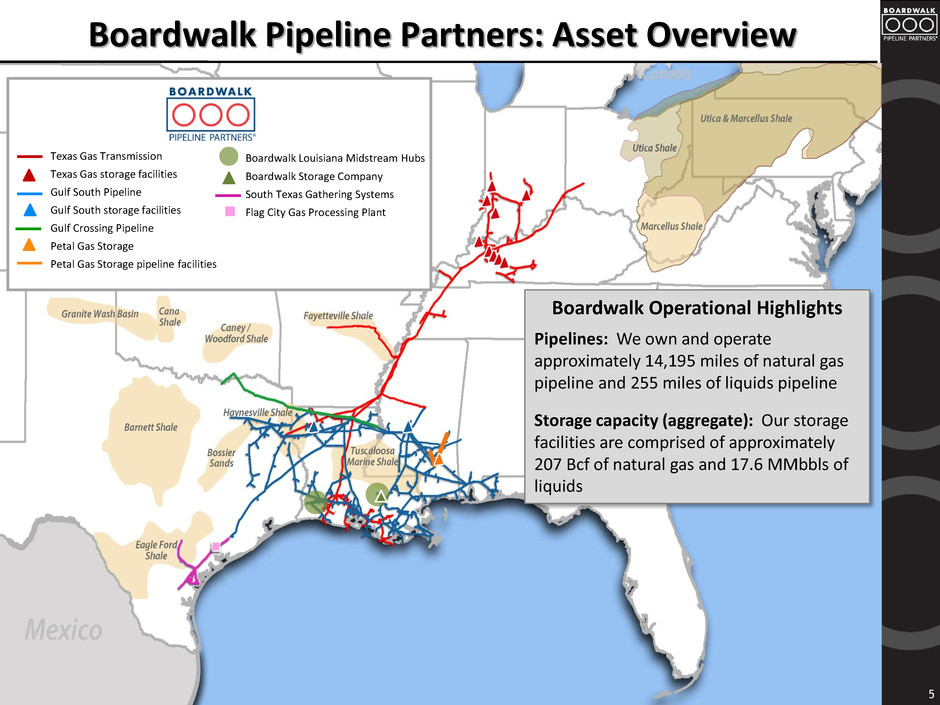
5 Boardwalk Pipeline Partners: Asset Overview Texas Gas Transmission Texas Gas storage facilities Gulf South Pipeline Gulf South storage facilities Gulf Crossing Pipeline Petal Gas Storage Petal Gas Storage pipeline facilities Boardwalk Louisiana Midstream Hubs Boardwalk Storage Company South Texas Gathering Systems Flag City Gas Processing Plant Boardwalk Operational Highlights Pipelines: We own and operate approximately 14,195 miles of natural gas pipeline and 255 miles of liquids pipeline Storage capacity (aggregate): Our storage facilities are comprised of approximately 207 Bcf of natural gas and 17.6 MMbbls of liquids
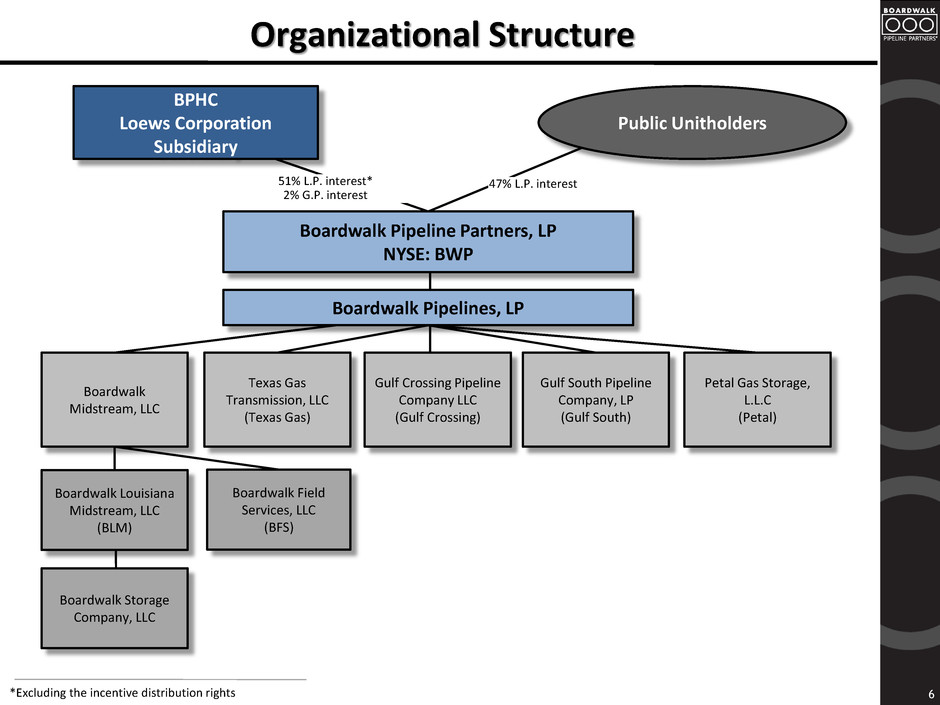
6 Organizational Structure *Excluding the incentive distribution rights Boardwalk Midstream, LLC 51% L.P. interest* 2% G.P. interest 47% L.P. interest BPHC Loews Corporation Subsidiary Boardwalk Pipeline Partners, LP NYSE: BWP Public Unitholders Texas Gas Transmission, LLC (Texas Gas) Gulf Crossing Pipeline Company LLC (Gulf Crossing) Gulf South Pipeline Company, LP (Gulf South) Boardwalk Pipelines, LP Boardwalk Field Services, LLC (BFS) Petal Gas Storage, L.L.C (Petal) Boardwalk Louisiana Midstream, LLC (BLM) Boardwalk Storage Company, LLC
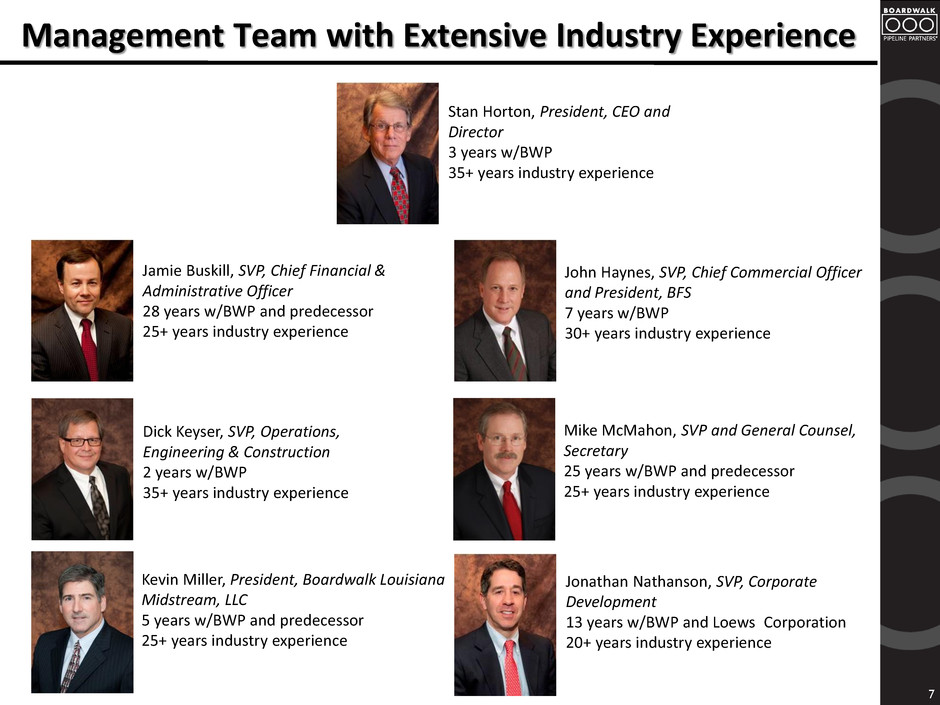
Management Team with Extensive Industry Experience Stan Horton, President, CEO and Director 3 years w/BWP 35+ years industry experience Jamie Buskill, SVP, Chief Financial & Administrative Officer 28 years w/BWP and predecessor 25+ years industry experience John Haynes, SVP, Chief Commercial Officer and President, BFS 7 years w/BWP 30+ years industry experience Dick Keyser, SVP, Operations, Engineering & Construction 2 years w/BWP 35+ years industry experience Mike McMahon, SVP and General Counsel, Secretary 25 years w/BWP and predecessor 25+ years industry experience Jonathan Nathanson, SVP, Corporate Development 13 years w/BWP and Loews Corporation 20+ years industry experience Kevin Miller, President, Boardwalk Louisiana Midstream, LLC 5 years w/BWP and predecessor 25+ years industry experience 7
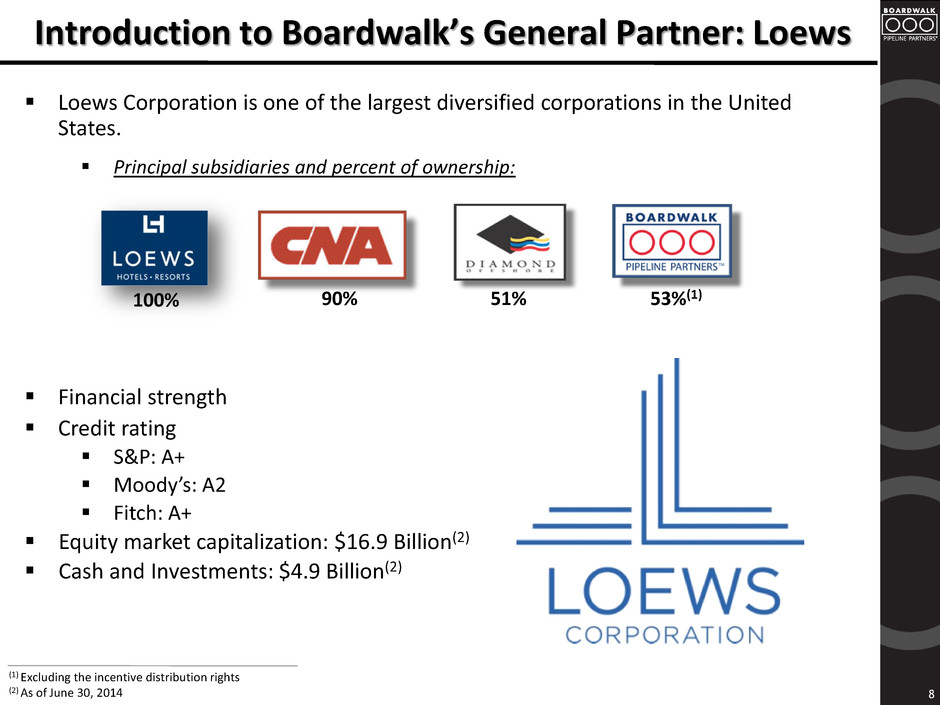
(1) Excluding the incentive distribution rights (2) As of June 30, 2014 Loews Corporation is one of the largest diversified corporations in the United States. Principal subsidiaries and percent of ownership: Financial strength Credit rating S&P: A+ Moody’s: A2 Fitch: A+ Equity market capitalization: $16.9 Billion(2) Cash and Investments: $4.9 Billion(2) Introduction to Boardwalk’s General Partner: Loews 100% 53%(1) 90% 51% 8
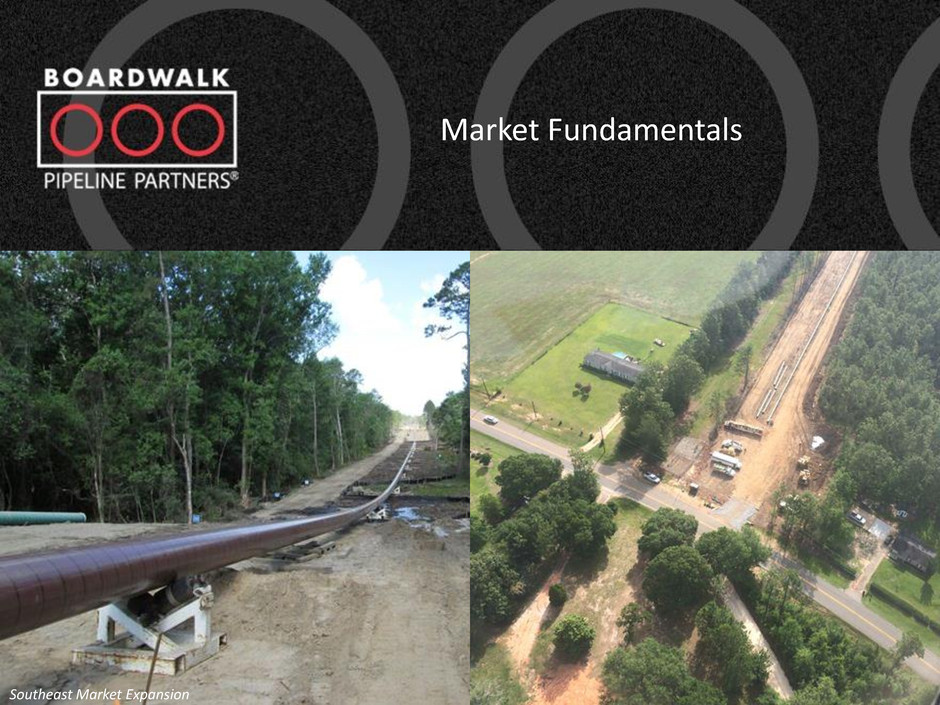
9 Market Fundamentals Southeast Market Expansion
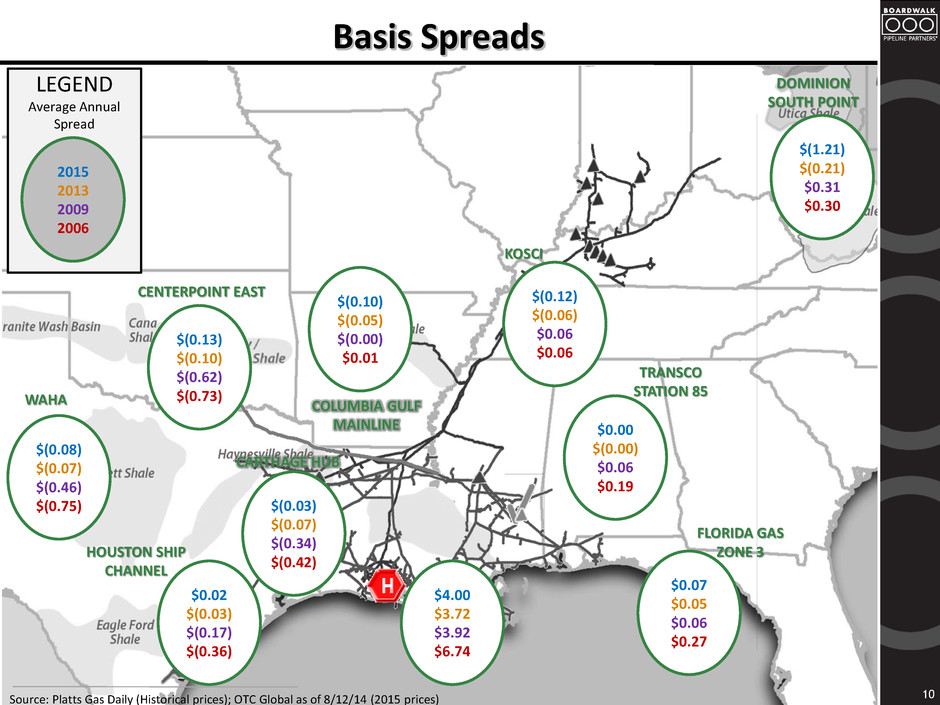
Basis Spreads 10 Source: Platts Gas Daily (Historical prices); OTC Global as of 8/12/14 (2015 prices) LEGEND Average Annual Spread CENTERPOINT EAST HOUSTON SHIP CHANNEL CARTHAGE HUB KOSCI TRANSCO STATION 85 DOMINION SOUTH POINT FLORIDA GAS ZONE 3 $(0.08) $(0.07) $(0.46) $(0.75) WAHA COLUMBIA GULF MAINLINE $(0.13) $(0.10) $(0.62) $(0.73) $0.02 $(0.03) $(0.17) $(0.36) $(0.03) $(0.07) $(0.34) $(0.42) $(0.10) $(0.05) $(0.00) $0.01 $4.00 $3.72 $3.92 $6.74 $(0.12) $(0.06) $0.06 $0.06 $0.00 $(0.00) $0.06 $0.19 $0.07 $0.05 $0.06 $0.27 $(1.21) $(0.21) $0.31 $0.30 2015 2013 2009 2006
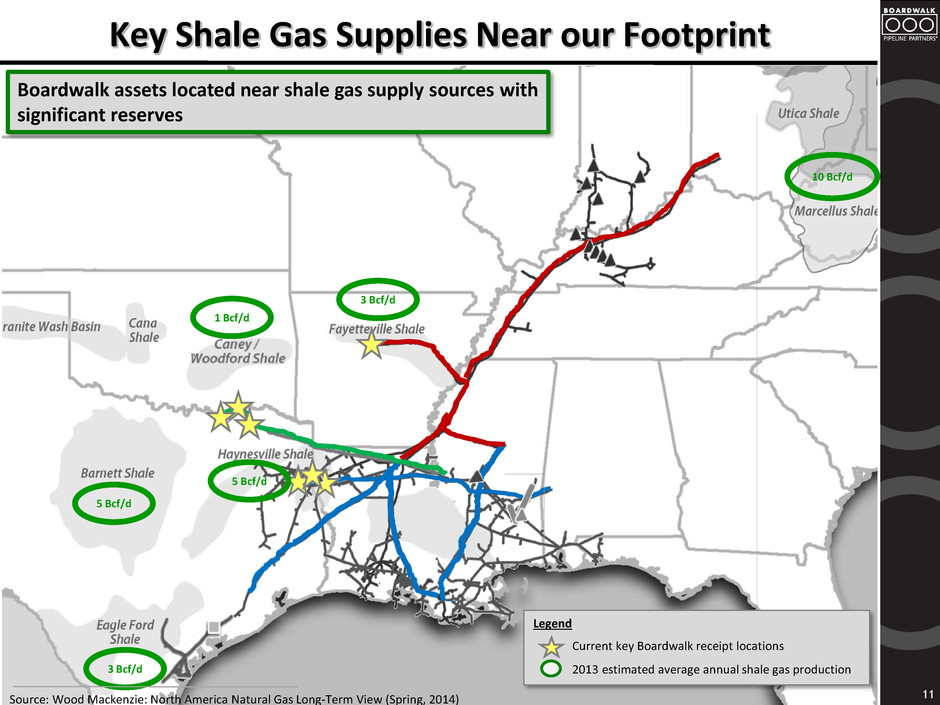
11 Key Shale Gas Supplies Near our Footprint 3 Bcf/d Boardwalk assets located near shale gas supply sources with significant reserves Source: Wood Mackenzie: North America Natural Gas Long-Term View (Spring, 2014) Legend Current key Boardwalk receipt locations 2013 estimated average annual shale gas production 5 Bcf/d 5 Bcf/d 1 Bcf/d 3 Bcf/d 10 Bcf/d
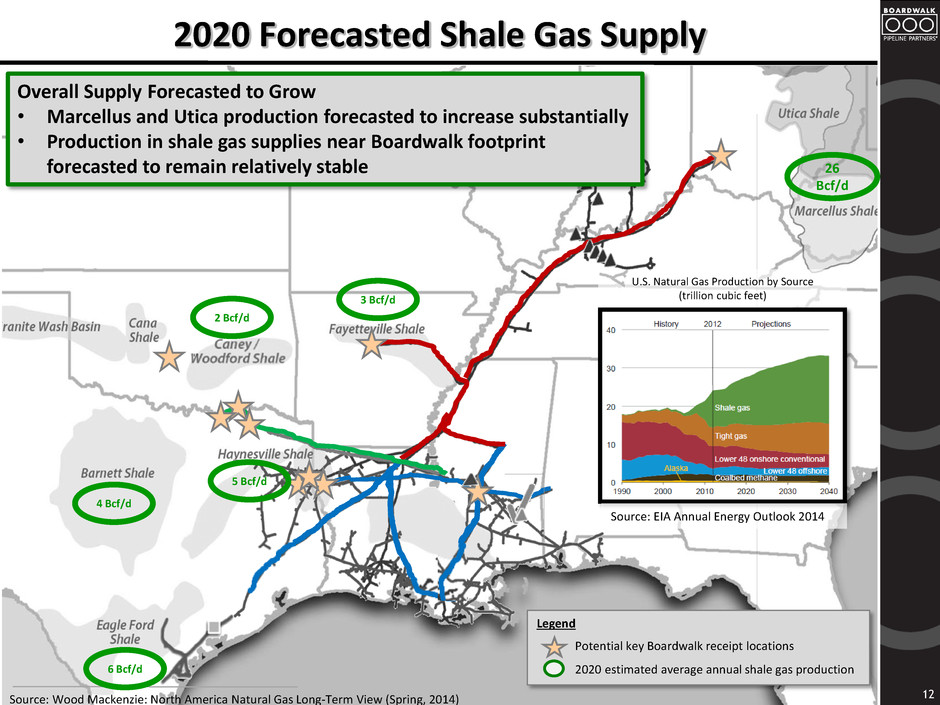
12 2020 Forecasted Shale Gas Supply Source: Wood Mackenzie: North America Natural Gas Long-Term View (Spring, 2014) Legend Potential key Boardwalk receipt locations 2020 estimated average annual shale gas production Source: EIA Annual Energy Outlook 2014 U.S. Natural Gas Production by Source (trillion cubic feet) 6 Bcf/d 4 Bcf/d 5 Bcf/d 2 Bcf/d 3 Bcf/d 26 Bcf/d Overall Supply Forecasted to Grow • Marcellus and Utica production forecasted to increase substantially • Production in shale gas supplies near Boardwalk footprint forecasted to remain relatively stable
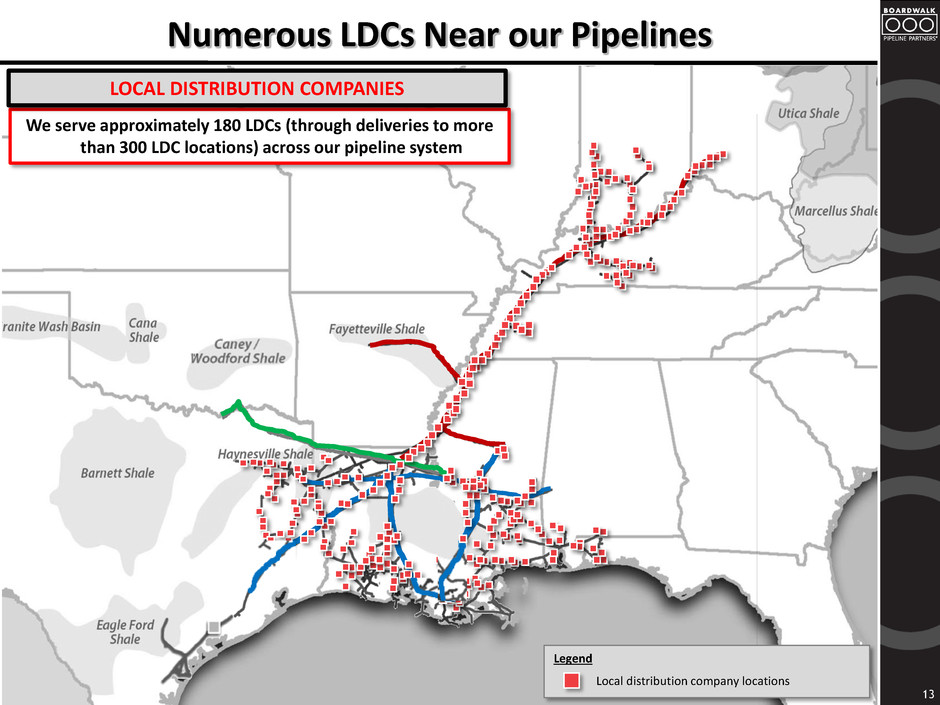
13 Numerous LDCs Near our Pipelines We serve approximately 180 LDCs (through deliveries to more than 300 LDC locations) across our pipeline system LOCAL DISTRIBUTION COMPANIES Legend Local distribution company locations
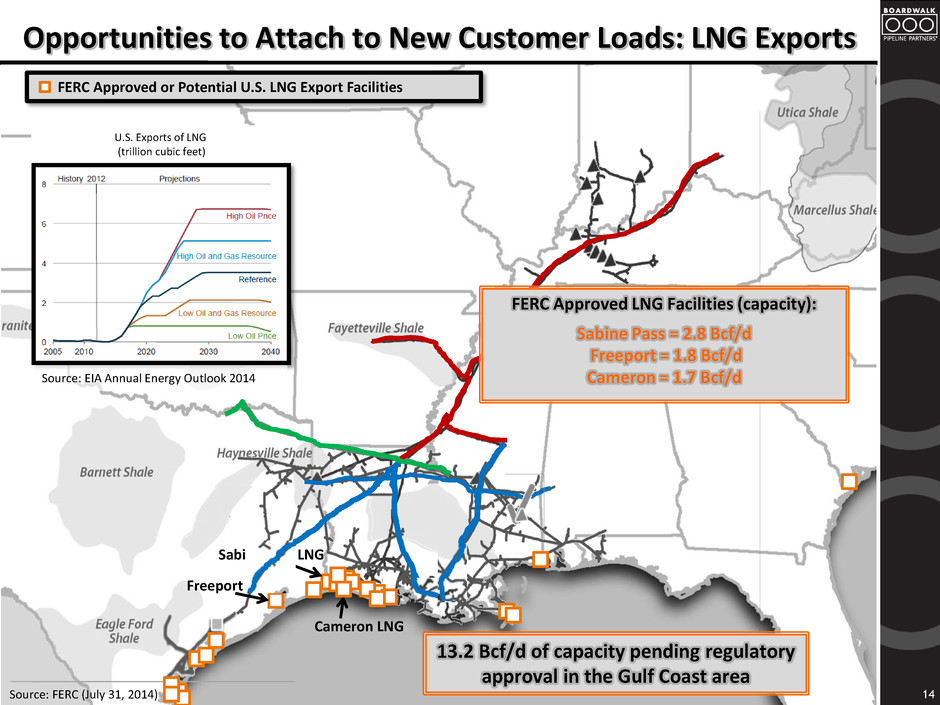
14 Opportunities to Attach to New Customer Loads: LNG Exports FERC Approved or Potential U.S. LNG Export Facilities 13.2 Bcf/d of capacity pending regulatory approval in the Gulf Coast area U.S. Exports of LNG (trillion cubic feet) Source: EIA Annual Energy Outlook 2014 Freeport LNG Sabine Pass LNG Cameron LNG Source: FERC (July 31, 2014) FERC Approved LNG Facilities (capacity): Sabine Pass = 2.8 Bcf/d Freeport = 1.8 Bcf/d Cameron = 1.7 Bcf/d
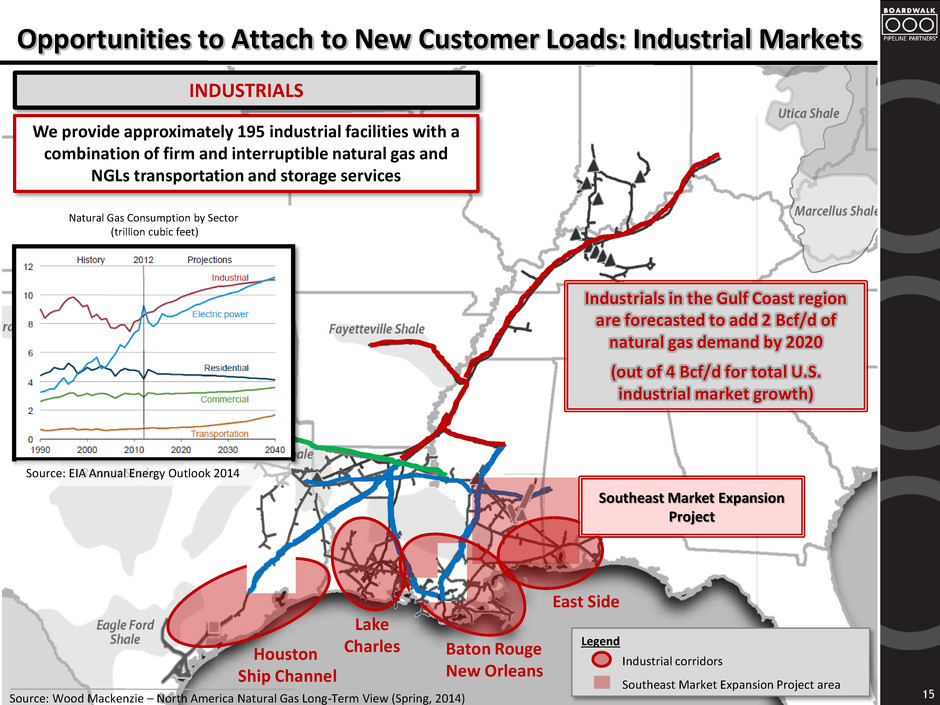
15 Opportunities to Attach to New Customer Loads: Industrial Markets We provide approximately 195 industrial facilities with a combination of firm and interruptible natural gas and NGLs transportation and storage services INDUSTRIALS Source: Wood Mackenzie – North America Natural Gas Long-Term View (Spring, 2014) Industrials in the Gulf Coast region are forecasted to add 2 Bcf/d of natural gas demand by 2020 (out of 4 Bcf/d for total U.S. industrial market growth) Natural Gas Consumption by Sector (trillion cubic feet) Source: EIA Annual Energy Outlook 2014 East Side Baton Rouge New Orleans Lake Charles Houston Ship Channel Southeast Market Expansion Project Legend Industrial corridors Southeast Market Expansion Project area
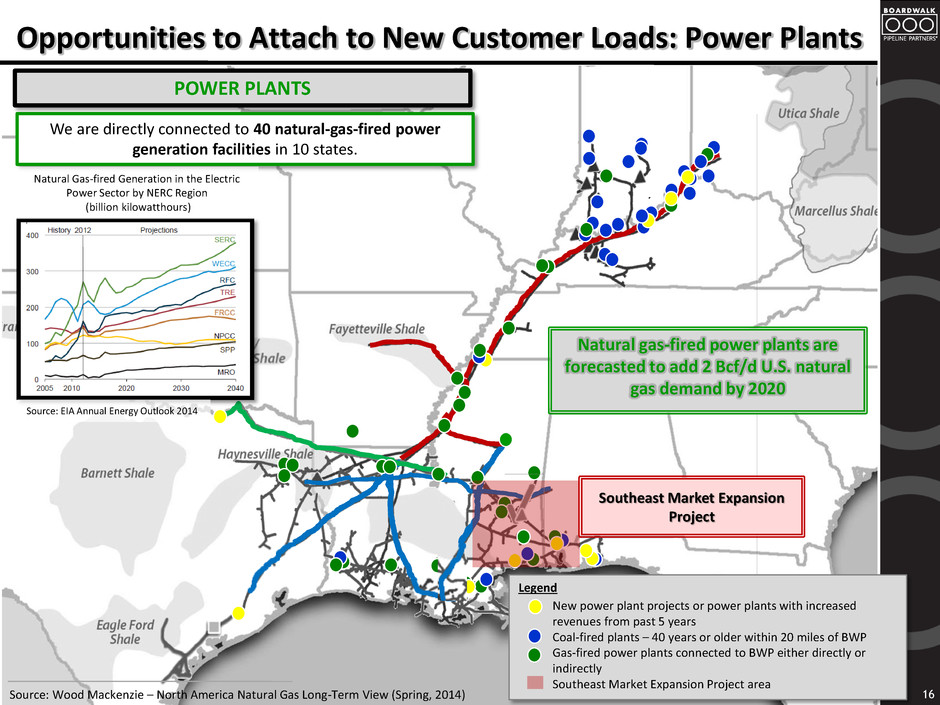
16 Opportunities to Attach to New Customer Loads: Power Plants We are directly connected to 40 natural-gas-fired power generation facilities in 10 states. POWER PLANTS Natural gas-fired power plants are forecasted to add 2 Bcf/d U.S. natural gas demand by 2020 Source: Wood Mackenzie – North America Natural Gas Long-Term View (Spring, 2014) Source: EIA Annual Energy Outlook 2014 Natural Gas-fired Generation in the Electric Power Sector by NERC Region (billion kilowatthours) Southeast Market Expansion Project Legend New power plant projects or power plants with increased revenues from past 5 years Coal-fired plants – 40 years or older within 20 miles of BWP Gas-fired power plants connected to BWP either directly or indirectly Southeast Market Expansion Project area
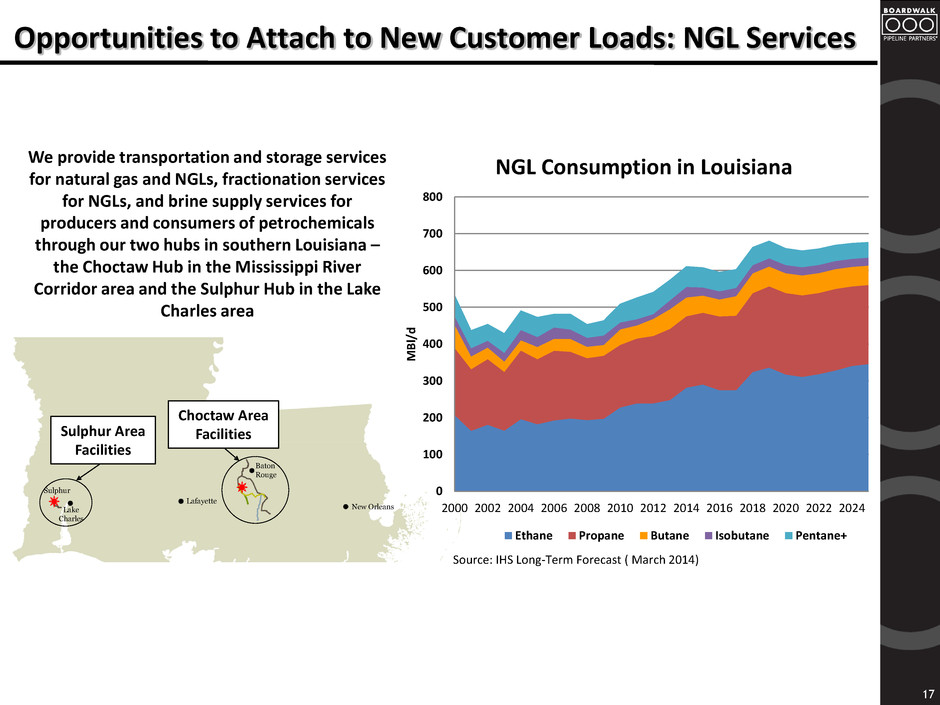
Opportunities to Attach to New Customer Loads: NGL Services 17 Lake Charles Lafayette New Orleans Sulphur Choctaw Area Facilities Sulphur Area Facilities Ethylene Pipeline Propylene Pipeline Natural Gas Pipeline Brine Pipeline E/P Pipeline PL Midstream Hubs Baton Rouge Sulphur Area Facilities Choctaw Area Facilities We provide transportation and storage services for natural gas and NGLs, fractionation services for NGLs, and brine supply services for producers and consumers of petrochemicals through our two hubs in southern Louisiana – the Choctaw Hub in the Mississippi River Corridor area and the Sulphur Hub in the Lake Charles area Source: IHS Long-Term Forecast ( March 2014) 0 100 200 300 400 500 600 700 800 2000 2002 2004 2006 2008 2010 2012 2014 2016 2018 2020 2022 2024 M B l/ d NGL Consumption in Louisiana Ethane Propane Butane Isobutane Pentane+
18 Commercial Activities Southeast Market Expansion
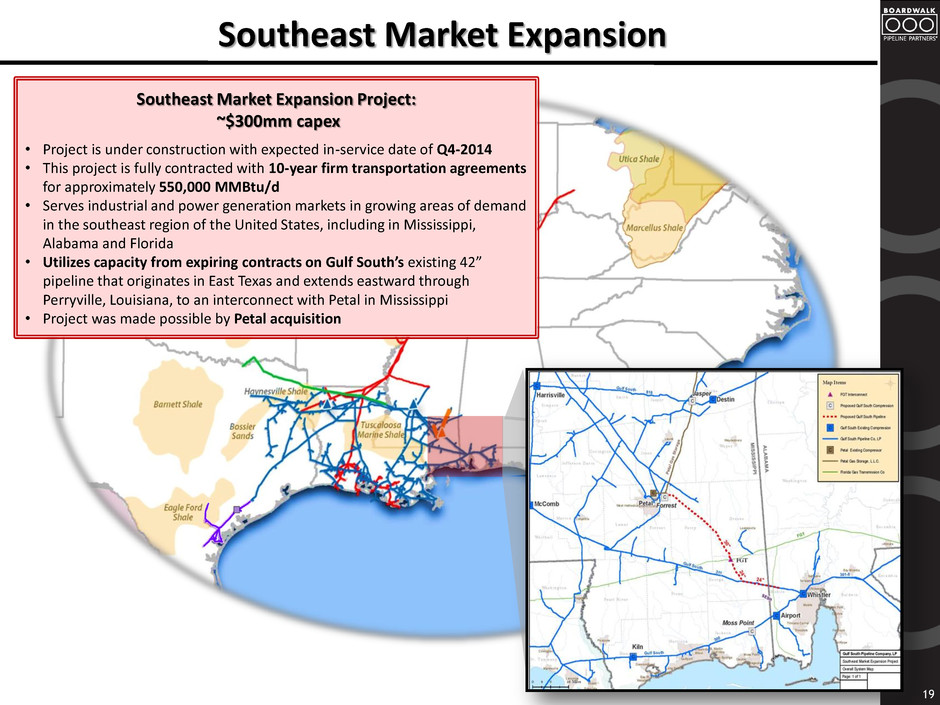
19 Southeast Market Expansion Project: ~$300mm capex • Project is under construction with expected in-service date of Q4-2014 • This project is fully contracted with 10-year firm transportation agreements for approximately 550,000 MMBtu/d • Serves industrial and power generation markets in growing areas of demand in the southeast region of the United States, including in Mississippi, Alabama and Florida • Utilizes capacity from expiring contracts on Gulf South’s existing 42” pipeline that originates in East Texas and extends eastward through Perryville, Louisiana, to an interconnect with Petal in Mississippi • Project was made possible by Petal acquisition Southeast Market Expansion
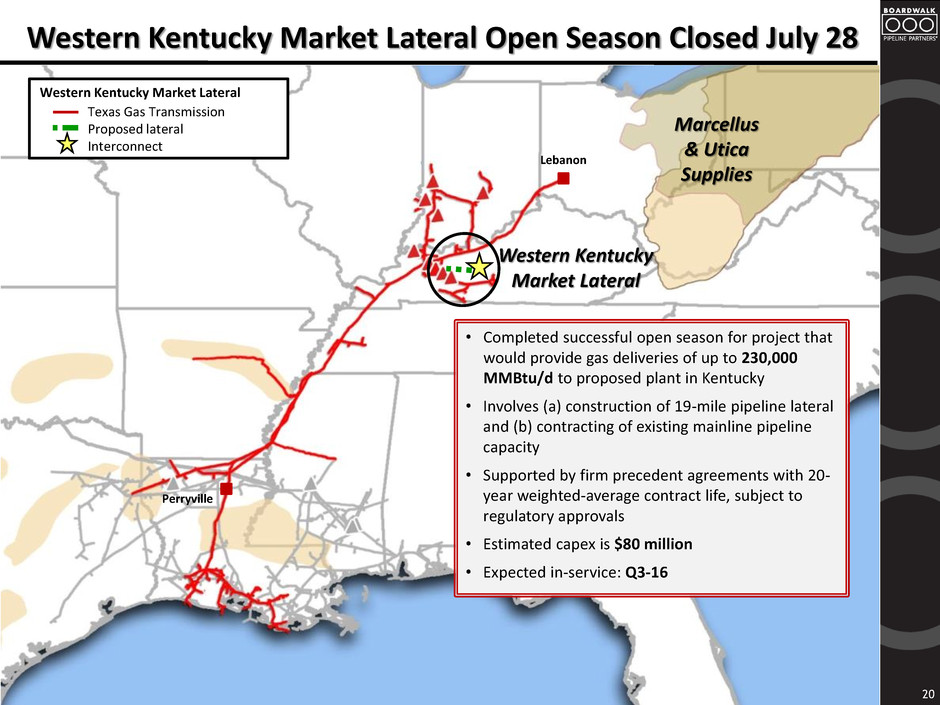
Western Kentucky Market Lateral Open Season Closed July 28 20 Lebanon Perryville • Completed successful open season for project that would provide gas deliveries of up to 230,000 MMBtu/d to proposed plant in Kentucky • Involves (a) construction of 19-mile pipeline lateral and (b) contracting of existing mainline pipeline capacity • Supported by firm precedent agreements with 20- year weighted-average contract life, subject to regulatory approvals • Estimated capex is $80 million • Expected in-service: Q3-16 Western Kentucky Market Lateral Texas Gas Transmission Proposed lateral Interconnect Marcellus & Utica Supplies Western Kentucky Market Lateral
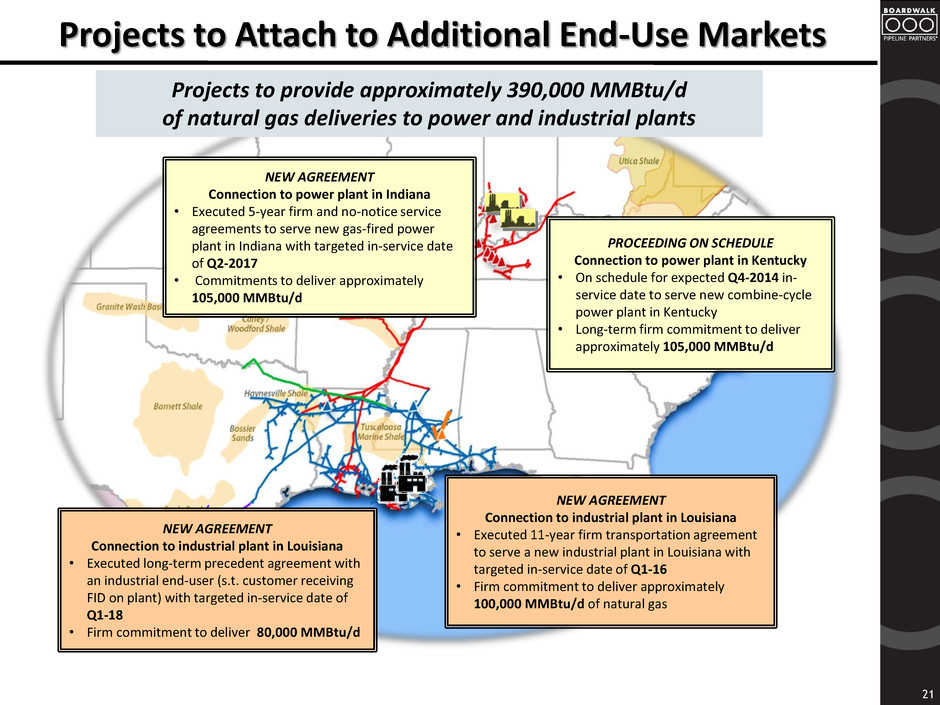
21 PROCEEDING ON SCHEDULE Connection to power plant in Kentucky • On schedule for expected Q4-2014 in- service date to serve new combine-cycle power plant in Kentucky • Long-term firm commitment to deliver approximately 105,000 MMBtu/d Projects to Attach to Additional End-Use Markets NEW AGREEMENT Connection to power plant in Indiana • Executed 5-year firm and no-notice service agreements to serve new gas-fired power plant in Indiana with targeted in-service date of Q2-2017 • Commitments to deliver approximately 105,000 MMBtu/d NEW AGREEMENT Connection to industrial plant in Louisiana • Executed 11-year firm transportation agreement to serve a new industrial plant in Louisiana with targeted in-service date of Q1-16 • Firm commitment to deliver approximately 100,000 MMBtu/d of natural gas NEW AGREEMENT Connection to industrial plant in Louisiana • Executed long-term precedent agreement with an industrial end-user (s.t. customer receiving FID on plant) with targeted in-service date of Q1-18 • Firm commitment to deliver 80,000 MMBtu/d Projects to provide approximately 390,000 MMBtu/d of natural gas deliveries to power and industrial plants
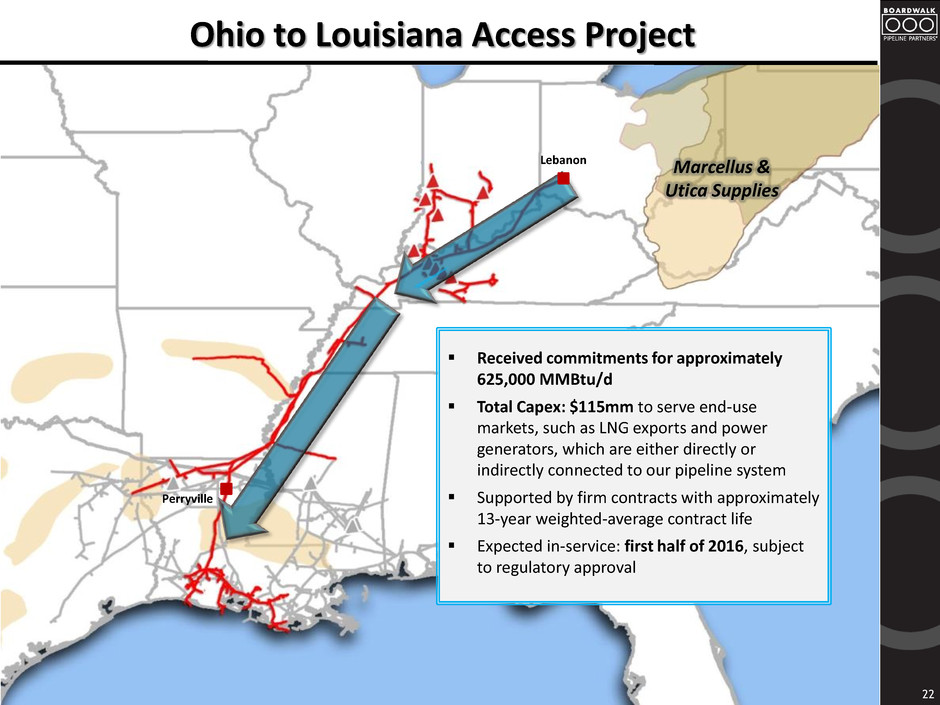
Ohio to Louisiana Access Project 22 Lebanon Perryville Marcellus & Utica Supplies Received commitments for approximately 625,000 MMBtu/d Total Capex: $115mm to serve end-use markets, such as LNG exports and power generators, which are either directly or indirectly connected to our pipeline system Supported by firm contracts with approximately 13-year weighted-average contract life Expected in-service: first half of 2016, subject to regulatory approval
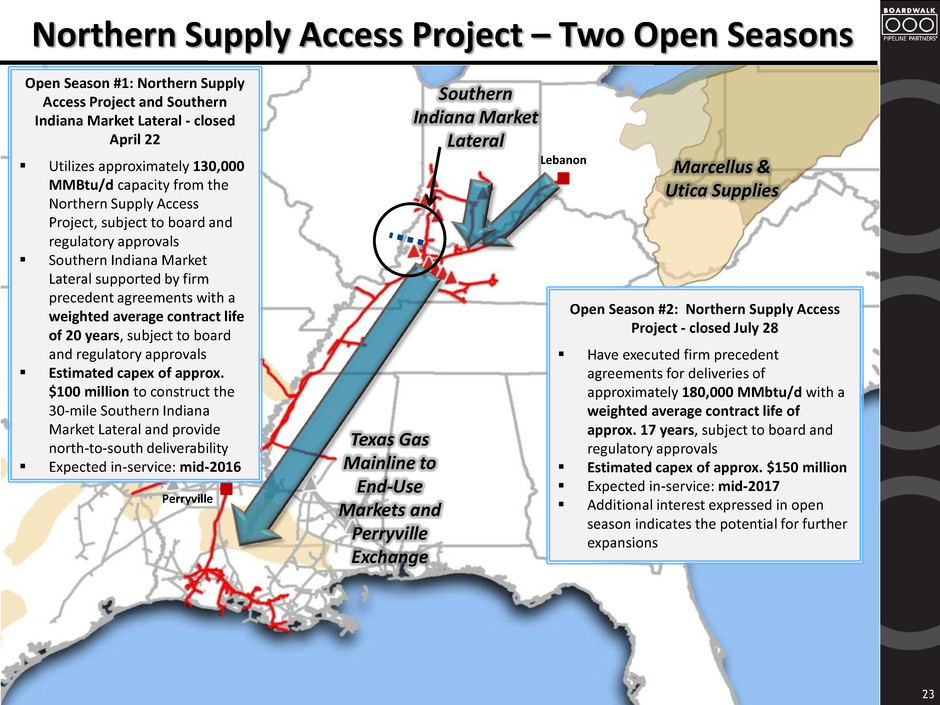
Northern Supply Access Project – Two Open Seasons Marcellus & Utica Supplies Texas Gas Mainline to End-Use Markets and Perryville Exchange 23 Lebanon Perryville Southern Indiana Market Lateral Open Season #2: Northern Supply Access Project - closed July 28 Have executed firm precedent agreements for deliveries of approximately 180,000 MMbtu/d with a weighted average contract life of approx. 17 years, subject to board and regulatory approvals Estimated capex of approx. $150 million Expected in-service: mid-2017 Additional interest expressed in open season indicates the potential for further expansions Open Season #1: Northern Supply Access Project and Southern Indiana Market Lateral - closed April 22 Utilizes approximately 130,000 MMBtu/d capacity from the Northern Supply Access Project, subject to board and regulatory approvals Southern Indiana Market Lateral supported by firm precedent agreements with a weighted average contract life of 20 years, subject to board and regulatory approvals Estimated capex of approx. $100 million to construct the 30-mile Southern Indiana Market Lateral and provide north-to-south deliverability Expected in-service: mid-2016
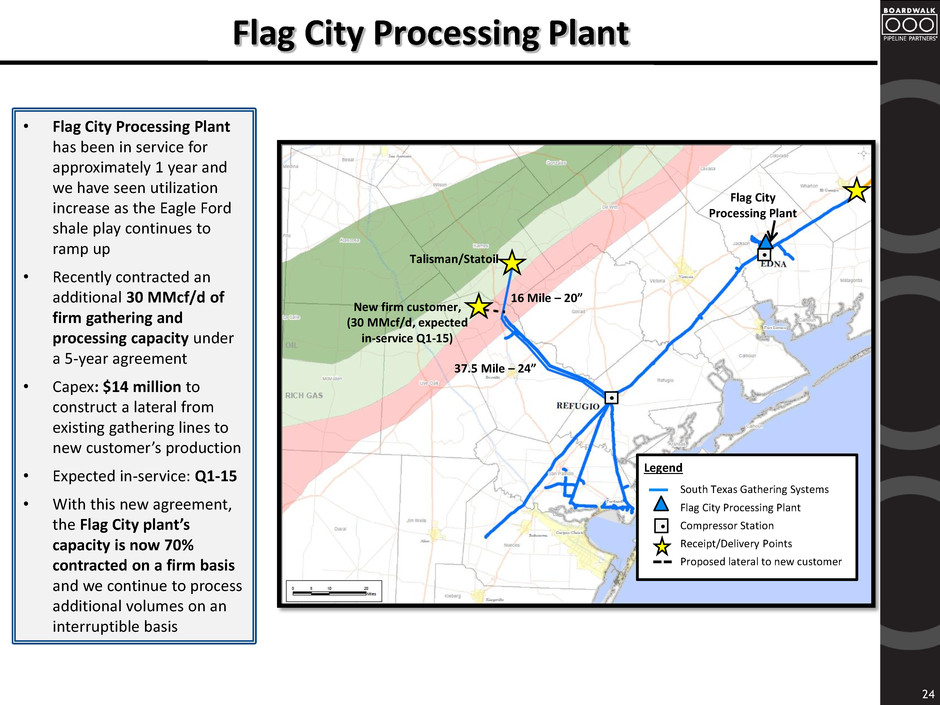
Flag City Processing Plant 24 • Flag City Processing Plant has been in service for approximately 1 year and we have seen utilization increase as the Eagle Ford shale play continues to ramp up • Recently contracted an additional 30 MMcf/d of firm gathering and processing capacity under a 5-year agreement • Capex: $14 million to construct a lateral from existing gathering lines to new customer’s production • Expected in-service: Q1-15 • With this new agreement, the Flag City plant’s capacity is now 70% contracted on a firm basis and we continue to process additional volumes on an interruptible basis Talisman/Statoil New firm customer, (30 MMcf/d, expected in-service Q1-15) 16 Mile – 20” 37.5 Mile – 24” South Texas Gathering Systems Flag City Processing Plant Compressor Station Receipt/Delivery Points Proposed lateral to new customer Legend Flag City Processing Plant
Other Midstream Projects We are engaged in discussions with customers looking to build large-scale ethane crackers in Louisiana, reinforcing our bullish point of view on demand for liquids services in Louisiana. We recently executed long-term firm agreements with Sasol for ethane and ethylene transportation and storage services contingent on their ethane cracker receiving a final investment decision. This $145 million project would expand capacity at our Sulphur Hub – further advancing our strategy to diversify within the midstream sector and enabling us to realize some of the growth potential we anticipated when we acquired Boardwalk Louisiana Midstream. Anticipated to go into service in the second half of 2017 Also in discussions with other petrochemical customers to support their NGLs storage and transportation needs. 25
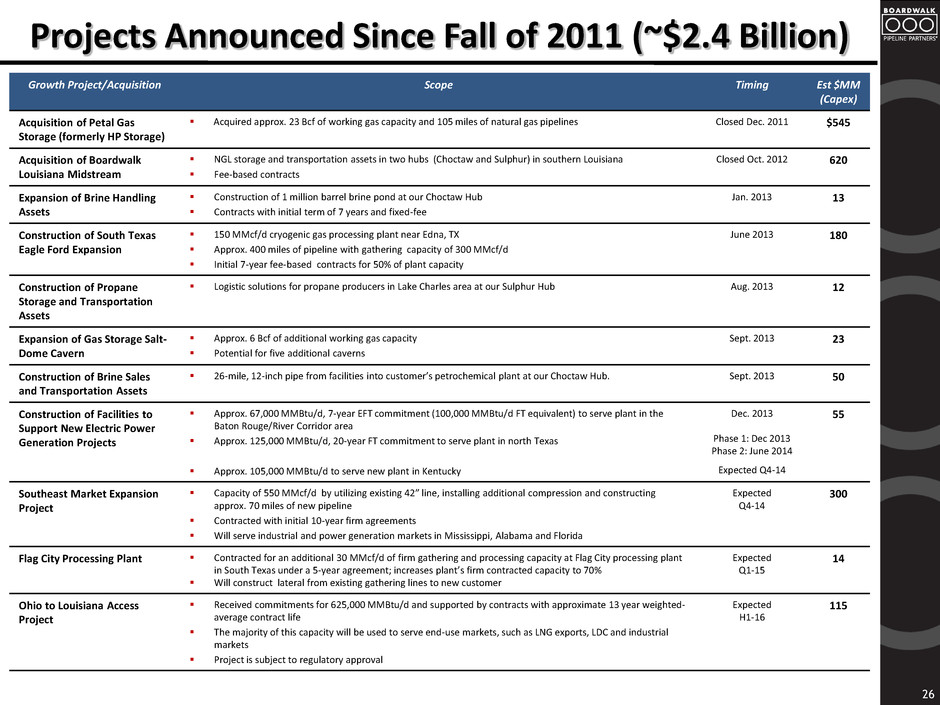
Projects Announced Since Fall of 2011 (~$2.4 Billion) 26 Growth Project/Acquisition Scope Timing Est $MM (Capex) Acquisition of Petal Gas Storage (formerly HP Storage) Acquired approx. 23 Bcf of working gas capacity and 105 miles of natural gas pipelines Closed Dec. 2011 $545 Acquisition of Boardwalk Louisiana Midstream NGL storage and transportation assets in two hubs (Choctaw and Sulphur) in southern Louisiana Fee-based contracts Closed Oct. 2012 620 Expansion of Brine Handling Assets Construction of 1 million barrel brine pond at our Choctaw Hub Contracts with initial term of 7 years and fixed-fee Jan. 2013 13 Construction of South Texas Eagle Ford Expansion 150 MMcf/d cryogenic gas processing plant near Edna, TX Approx. 400 miles of pipeline with gathering capacity of 300 MMcf/d Initial 7-year fee-based contracts for 50% of plant capacity June 2013 180 Construction of Propane Storage and Transportation Assets Logistic solutions for propane producers in Lake Charles area at our Sulphur Hub Aug. 2013 12 Expansion of Gas Storage Salt- Dome Cavern Approx. 6 Bcf of additional working gas capacity Potential for five additional caverns Sept. 2013 23 Construction of Brine Sales and Transportation Assets 26-mile, 12-inch pipe from facilities into customer’s petrochemical plant at our Choctaw Hub. Sept. 2013 50 Construction of Facilities to Support New Electric Power Generation Projects Approx. 67,000 MMBtu/d, 7-year EFT commitment (100,000 MMBtu/d FT equivalent) to serve plant in the Baton Rouge/River Corridor area Approx. 125,000 MMBtu/d, 20-year FT commitment to serve plant in north Texas Approx. 105,000 MMBtu/d to serve new plant in Kentucky Dec. 2013 Phase 1: Dec 2013 Phase 2: June 2014 Expected Q4-14 55 Southeast Market Expansion Project Capacity of 550 MMcf/d by utilizing existing 42” line, installing additional compression and constructing approx. 70 miles of new pipeline Contracted with initial 10-year firm agreements Will serve industrial and power generation markets in Mississippi, Alabama and Florida Expected Q4-14 300 Flag City Processing Plant Contracted for an additional 30 MMcf/d of firm gathering and processing capacity at Flag City processing plant in South Texas under a 5-year agreement; increases plant’s firm contracted capacity to 70% Will construct lateral from existing gathering lines to new customer Expected Q1-15 14 Ohio to Louisiana Access Project Received commitments for 625,000 MMBtu/d and supported by contracts with approximate 13 year weighted- average contract life The majority of this capacity will be used to serve end-use markets, such as LNG exports, LDC and industrial markets Project is subject to regulatory approval Expected H1-16 115
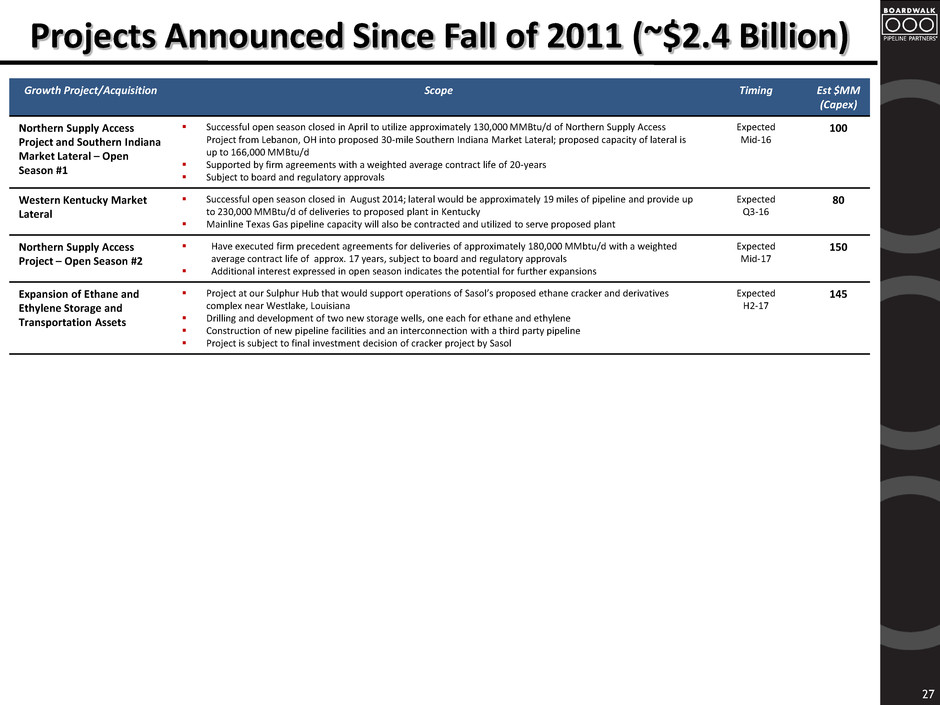
27 Growth Project/Acquisition Scope Timing Est $MM (Capex) Northern Supply Access Project and Southern Indiana Market Lateral – Open Season #1 Successful open season closed in April to utilize approximately 130,000 MMBtu/d of Northern Supply Access Project from Lebanon, OH into proposed 30-mile Southern Indiana Market Lateral; proposed capacity of lateral is up to 166,000 MMBtu/d Supported by firm agreements with a weighted average contract life of 20-years Subject to board and regulatory approvals Expected Mid-16 100 Western Kentucky Market Lateral Successful open season closed in August 2014; lateral would be approximately 19 miles of pipeline and provide up to 230,000 MMBtu/d of deliveries to proposed plant in Kentucky Mainline Texas Gas pipeline capacity will also be contracted and utilized to serve proposed plant Expected Q3-16 80 Northern Supply Access Project – Open Season #2 Have executed firm precedent agreements for deliveries of approximately 180,000 MMbtu/d with a weighted average contract life of approx. 17 years, subject to board and regulatory approvals Additional interest expressed in open season indicates the potential for further expansions Expected Mid-17 150 Expansion of Ethane and Ethylene Storage and Transportation Assets Project at our Sulphur Hub that would support operations of Sasol’s proposed ethane cracker and derivatives complex near Westlake, Louisiana Drilling and development of two new storage wells, one each for ethane and ethylene Construction of new pipeline facilities and an interconnection with a third party pipeline Project is subject to final investment decision of cracker project by Sasol Expected H2-17 145 Projects Announced Since Fall of 2011 (~$2.4 Billion)
28 Financial Overview Southeast Market Expansion
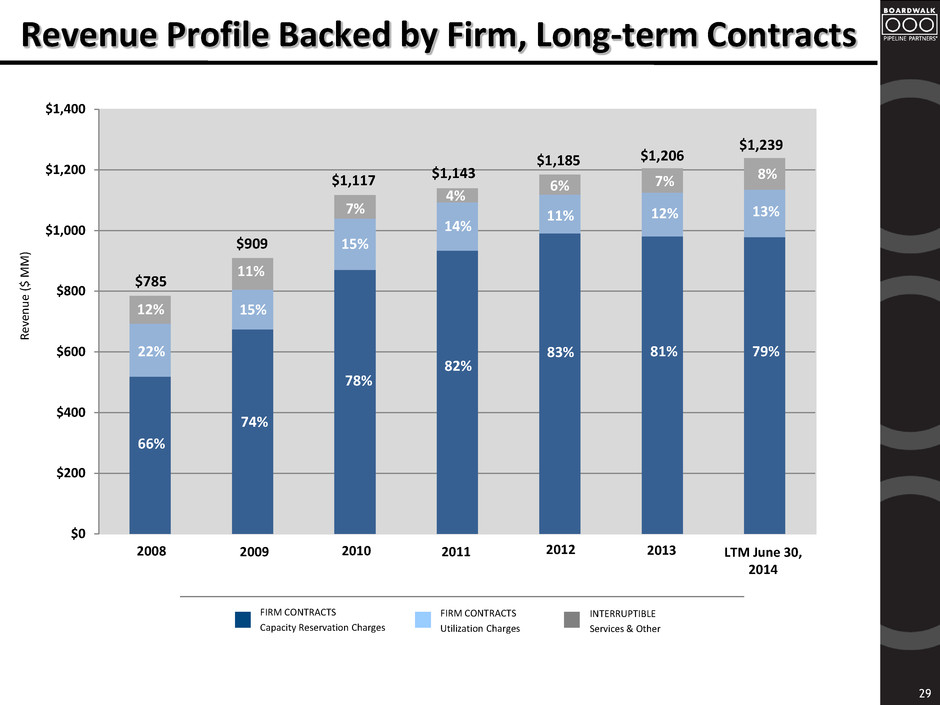
$0 $200 $400 $600 $800 $1,000 $1,200 $1,400 Revenue Profile Backed by Firm, Long-term Contracts 29 R ev en u e ($ MM ) FIRM CONTRACTS Capacity Reservation Charges FIRM CONTRACTS Utilization Charges INTERRUPTIBLE Services & Other 2008 2009 2010 2011 2012 2013 LTM June 30, 2014 $1,206 66% 22% 12% 74% 15% 11% $1,143 $785 $909 $1,117 78% 15% 7% 82% 14% 4% $1,185 6% 11% 83% 81% 12% 7% $1,239 8% 13% 79%
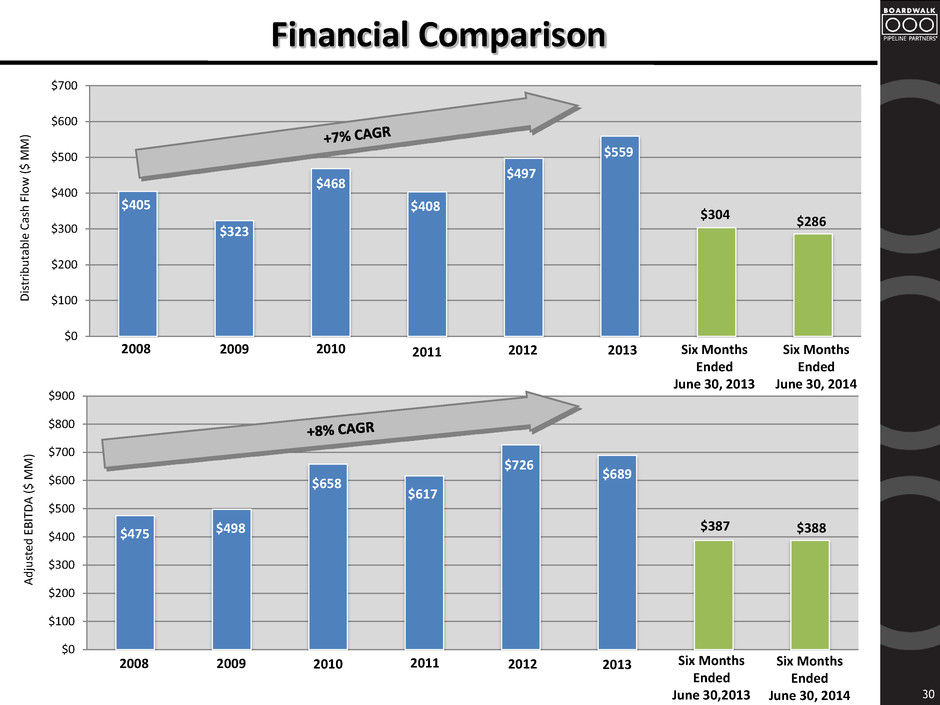
$0 $100 $200 $300 $400 $500 $600 $700 $800 $900 $0 $100 $200 $300 $400 $500 $600 $700 Financial Comparison 30 Di stri b u ta b le Ca sh Fl o w ($ MM ) A d ju ste d E BI TDA ($ MM ) $405 $323 $468 $408 $497 $304 $286 $559 $475 $498 $658 $617 $726 $689 $387 $388 2008 2009 2010 2011 2012 2013 Six Months Ended June 30, 2013 Six Months Ended June 30, 2014 2008 2009 2010 2011 2012 2013 Six Months Ended June 30,2013 Six Months Ended June 30, 2014
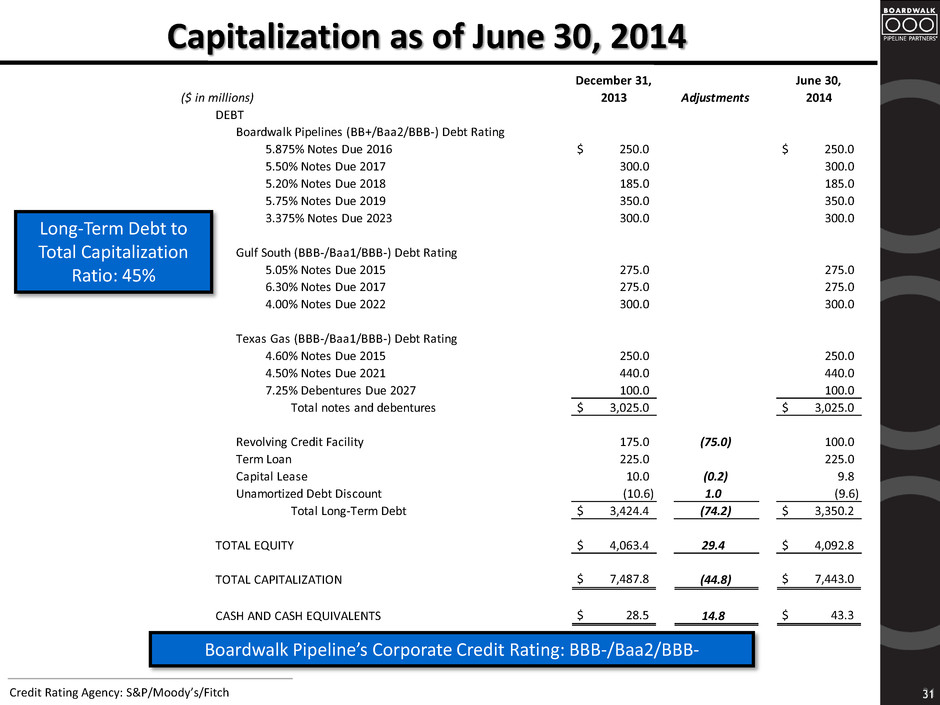
($ in millions) December 31, 2013 Adjustments June 30, 2014 DEBT Boardwalk Pipelines (BB+/Baa2/BBB-) Debt Rating 5.875% Notes Due 2016 $ 250.0 $ 250.0 5.50% Notes Due 2017 300.0 300.0 5.20% Notes Due 2018 185.0 185.0 5.75% Notes Due 2019 350.0 350.0 3.375% Notes Due 2023 300.0 300.0 Gulf South (BBB-/Baa1/BBB-) Debt Rating 5.05% Notes Due 2015 275.0 275.0 6.30% Notes Due 2017 275.0 275.0 4.00% Notes Due 2022 300.0 300.0 Texas Gas (BBB-/Baa1/BBB-) Debt Rating 4.60% Notes Due 2015 250.0 250.0 4.50% Notes Due 2021 440.0 440.0 7.25% Debentures Due 2027 100.0 100.0 Total notes and debentures $ 3,025.0 $ 3,025.0 Revolving Credit Facility 175.0 (75.0) 100.0 Term Loan 225.0 225.0 Capital Lease 10.0 (0.2) 9.8 Unamortized Debt Discount (10.6) 1.0 (9.6) Total Long-Term Debt $ 3,424.4 (74.2) $ 3,350.2 TOTAL EQUITY $ 4,063.4 29.4 $ 4,092.8 TOTAL CAPITALIZATION $ 7,487.8 (44.8) $ 7,443.0 CASH AND CASH EQUIVALENTS $ 28.5 14.8 $ 43.3 Capitalization as of June 30, 2014 31 Credit Rating Agency: S&P/Moody’s/Fitch Boardwalk Pipeline’s Corporate Credit Rating: BBB-/Baa2/BBB- Long-Term Debt to Total Capitalization Ratio: 45%
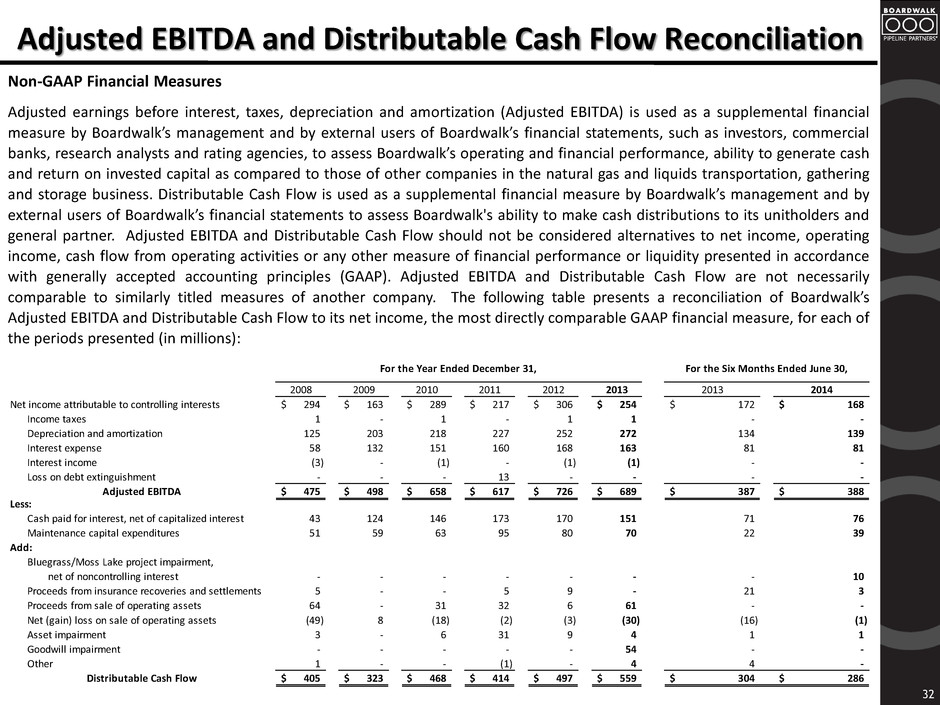
Adjusted EBITDA and Distributable Cash Flow Reconciliation 32 Non-GAAP Financial Measures Adjusted earnings before interest, taxes, depreciation and amortization (Adjusted EBITDA) is used as a supplemental financial measure by Boardwalk’s management and by external users of Boardwalk’s financial statements, such as investors, commercial banks, research analysts and rating agencies, to assess Boardwalk’s operating and financial performance, ability to generate cash and return on invested capital as compared to those of other companies in the natural gas and liquids transportation, gathering and storage business. Distributable Cash Flow is used as a supplemental financial measure by Boardwalk’s management and by external users of Boardwalk’s financial statements to assess Boardwalk's ability to make cash distributions to its unitholders and general partner. Adjusted EBITDA and Distributable Cash Flow should not be considered alternatives to net income, operating income, cash flow from operating activities or any other measure of financial performance or liquidity presented in accordance with generally accepted accounting principles (GAAP). Adjusted EBITDA and Distributable Cash Flow are not necessarily comparable to similarly titled measures of another company. The following table presents a reconciliation of Boardwalk’s Adjusted EBITDA and Distributable Cash Flow to its net income, the most directly comparable GAAP financial measure, for each of the periods presented (in millions): 2008 2009 2010 2011 2012 2013 2013 2014 Net income attributable to controlling interests 294$ 163$ 289$ 217$ 306$ 254$ 172$ 168$ Income taxes 1 - 1 - 1 1 - - Depreciation and amortization 125 203 218 227 252 272 134 139 Interest expense 58 132 151 160 168 163 81 81 Interest income (3) - (1) - (1) (1) - - Loss on debt extinguishment - - - 13 - - - - 475$ 498$ 658$ 617$ 726$ 689$ 387$ 388$ Less: Cash paid for interest, net of capitalized interest 43 124 146 173 170 151 71 76 Maintenance capital expenditures 51 59 63 95 80 70 22 39 Add: Bluegrass/Moss Lake project impairment, net of noncontrolling interest - - - - - - - 10 Proceed from insurance recoveries and settlements 5 - - 5 9 - 21 3 Pr cee from sale of operating assets 64 - 31 32 6 61 - - N t ( i ) loss on sale of operating assets (49) 8 (18) (2) (3) (30) (16) (1) Asset impairment 3 - 6 31 9 4 1 1 Goodwill impairment - - - - - 54 - - Other 1 - - (1) - 4 4 - 405$ 323$ 468$ 414$ 497$ 559$ 304$ 286$ For the Year Ended December 31, For the Six Months Ended June 30, Adjusted EBITDA Distributable Cash Flow
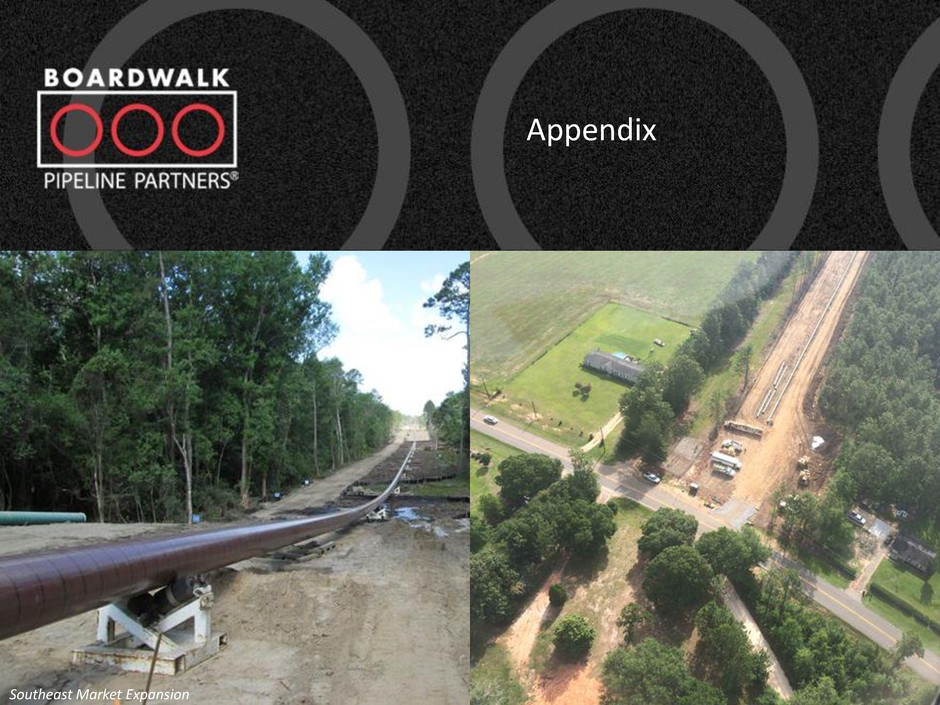
33 Appendix Southeast Market Expansion
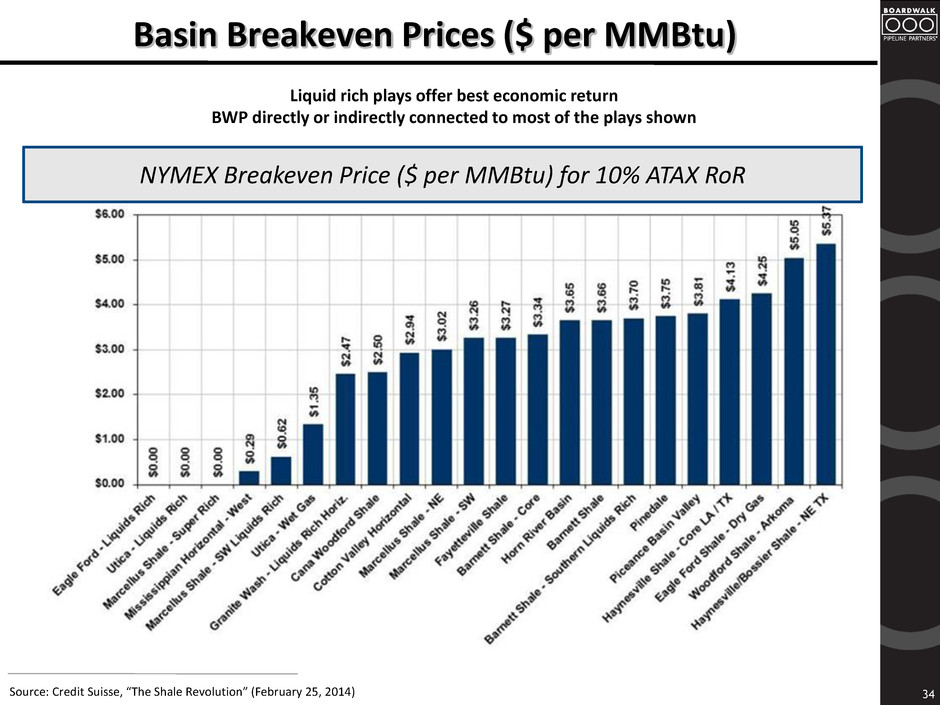
Basin Breakeven Prices ($ per MMBtu) Liquid rich plays offer best economic return BWP directly or indirectly connected to most of the plays shown Source: Credit Suisse, “The Shale Revolution” (February 25, 2014) NYMEX Breakeven Price ($ per MMBtu) for 10% ATAX RoR 34
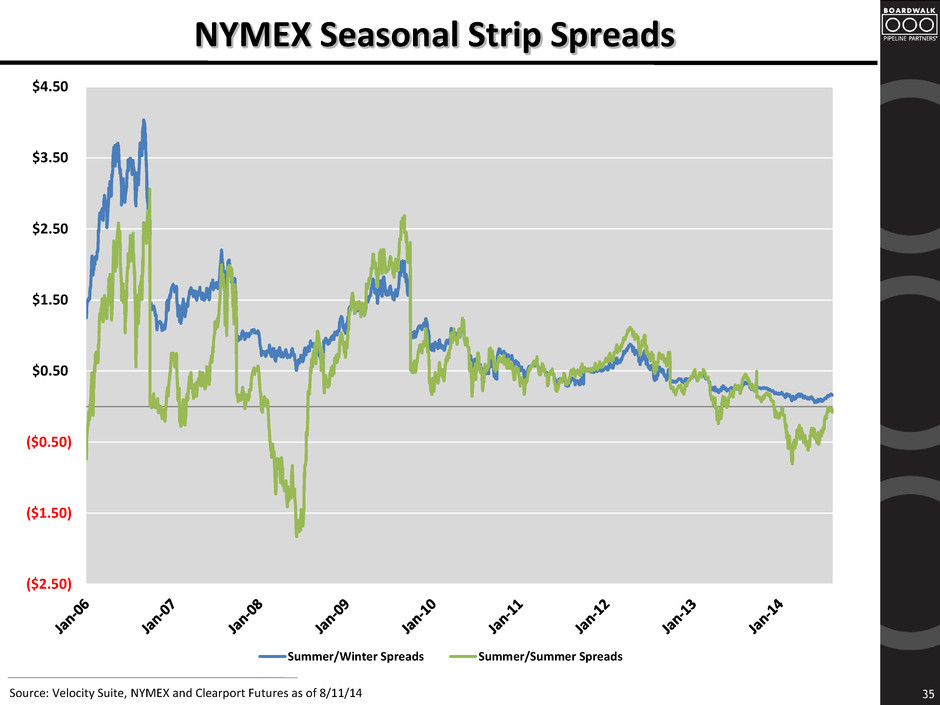
NYMEX Seasonal Strip Spreads Source: Velocity Suite, NYMEX and Clearport Futures as of 8/11/14 35 ($2.50) ($1.50) ($0.50) $0.50 $1.50 $2.50 $3.50 $4.50 Summer/Winter Spreads Summer/Summer Spreads
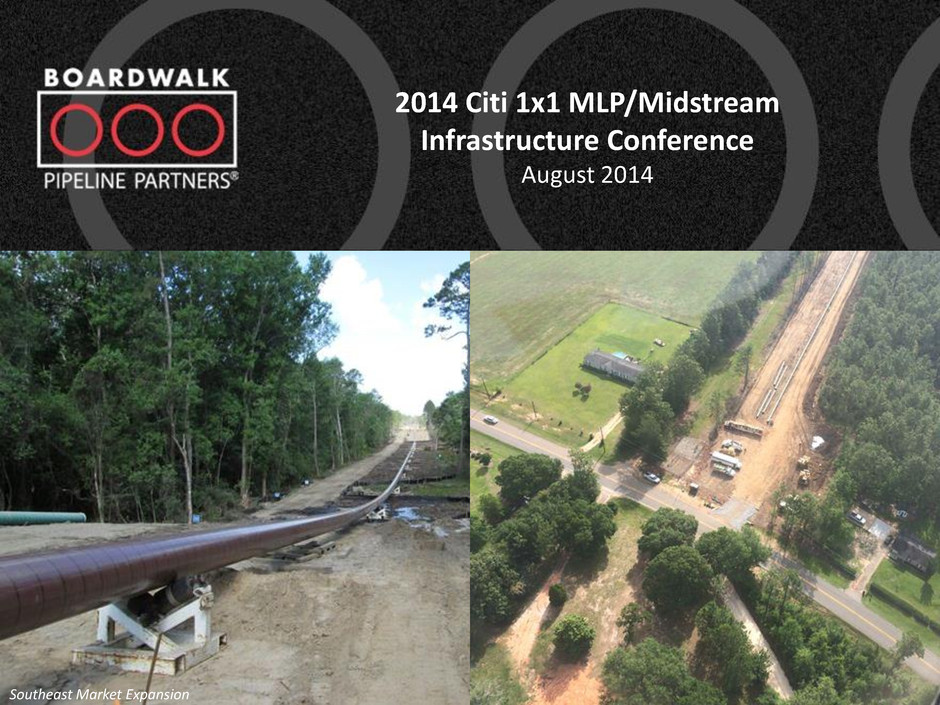
36 2014 Citi 1x1 MLP/Midstream Infrastructure Conference August 2014 Southeast Market Expansion
