Attached files
| file | filename |
|---|---|
| 8-K - FORM 8-K - Manitex International, Inc. | d775933d8k.htm |
 Manitex
International, Inc. Corporate Presentation
(NASDAQ: MNTX)
Q2 2014
Exhibit 99.1 |
 2
Forward Looking Statements & Non-GAAP Measures
Safe Harbor Statement under the U.S. Private Securities Litigation Reform Act of 1995: This
presentation contains statements that are forward-looking in nature which express
the beliefs and expectations of management including statements regarding the
Company’s expected results of operations or liquidity; statements concerning projections,
predictions, expectations, estimates or forecasts as to our business, financial and
operational results and future economic performance; and statements of
management’s goals and objectives and other similar expressions concerning matters
that are not historical facts. In some cases, you can identify forward-looking
statements by terminology such as “anticipate,”
“estimate,”
“plan,”
“project,”
“continuing,”
“ongoing,”
“expect,”
“we believe,”
“we intend,”
“may,”
“will,”
“should,”
“could,”
and similar expressions. Such statements are based on current plans, estimates and
expectations and involve a number of known and unknown risks, uncertainties and other
factors that could cause the Company's future results, performance or achievements to
differ significantly from the results, performance or achievements expressed or
implied
by
such
forward-looking
statements.
These
factors
and
additional
information
are
discussed
in
the
Company's
filings with the Securities and Exchange Commission and statements in this presentation should
be evaluated in light of these important factors. Although we believe that these
statements are based upon reasonable assumptions, we cannot guarantee future results.
Forward-looking statements speak only as of the date on which they are made, and the
Company undertakes no obligation to update publicly or revise any forward-looking
statement, whether as a result of new information, future developments or otherwise.
Non-GAAP
Measures:
Manitex
International
from
time
to
time
refers
to
various
non-GAAP
(generally
accepted
accounting
principles) financial measures in this presentation. Manitex believes that this
information is useful to understanding its operating results without the impact of
special items. See Manitex’s Q2 2014 earnings release on the Investor Relations
section of our website www.manitexinternational.com for a description and/or reconciliation of
these measures. Nasdaq: MNTX
8/15/2014 |
 Company
Snapshot Manitex
International, Inc.
Niches
Served
Company
Origin
Energy exploration and
field development
(includes Canadian oil
sands and recent oil and
natural gas initiatives
throughout U.S.)
Power line construction
Military
Railroads
Ports
Government/agency
Launched as a private
company in 2003
Publicly traded on
NASDAQ: MNTX
Steady organic growth
Industry consolidator:
consistently adding
branded product lines
through M&A since
going public in 2006
3
8/15/2014
Nasdaq: MNTX
Global provider of highly
specialized and custom
configured cranes-
Straight-mast and
knucklebooms
Materials and container
handling equipment also
sold through
dealerships, globally |
 •
Leading Italian
manufacturer of truck-
mounted hydraulic knuckle
boom cranes
•
Diverse product lines
ranging up to 108 ton
meters in lifting capacity;
sales in 50 countries
•
Engineered lifting equipment
•
Manitex boom trucks
•
SkyCrane aerial platforms
•
Sign cranes
•
RT forklifts
•
Special mission-oriented
vehicles
•
Carriers
•
Heavy material handling
•
Transporters & steel mill
equipment
•
Manufacturer of container
handling equipment for
the global port & inter-
modal sectors
•
Products: reach stackers,
laden and unladen
container forklifts &
straddle carriers
Product Overview
4
Nasdaq: MNTX
*
* PM transaction expected to close Q4 2014
8/15/2014 |
 Competitive
Positioning 5
Core Competencies
Strong brand history
Acknowledged product
development record
International dealers enable us to
follow demand
Focused on specialized equipment
and niche end-markets
Products
Niche markets
Broad end-user base
Highly customized/specialized;
will configure-to-order
Parts and service an important
part of business model
Lower capital commitment for a boom truck vs.
competitors’
custom cranes of similar lifting capacity
Usually less or no special permitting vs. competitors’
custom cranes of similar lifting capacity
8/15/2014
Nasdaq: MNTX
Superior ROI |
 Financial Summary
$000, except %
2009
2010
2011
2012
2013
Revenues
$55,887
$95,875
$142,291
$205,249
245,072
Gross Margin (%)
20.0%
24.3%
20.6%
19.7%
19.0%
EBITDA
$1,982
$8,676
$11,120
$17,957
21,483
EBITDA Margin (%)
3.5%
9.0%
7.8%
8.7%
8.8%
Net income
$3,639
(1)
$2,109
$2,780
$8,077
$10,178
Backlog
$22,122
$39,905
$83,700
$130,352
$77,281
(1)
2009 GAAP Net Income includes gain on bargain purchase of $3,815
Key Statistics
Stock Price
(at 8/13/14)
$12.05/share
Market Cap (at
8/13/14) $166.6M
Total Ent. Value
(8/13/14)
$223.2M
2013 Revenue
$245.1M
2013 Net Income
$10.2M
2013 EBITDA
$21.5M
Ticker / Exchange
MNTX/NasdaqCM
Capitalization
Basic Shares O/S (at
6/30/14) 13.8M
Diluted Shares O/S
(at 6/30/14)
13.9M
Total Debt (at
6/30/14) $59.9M
6
8/15/2014
Nasdaq: MNTX |
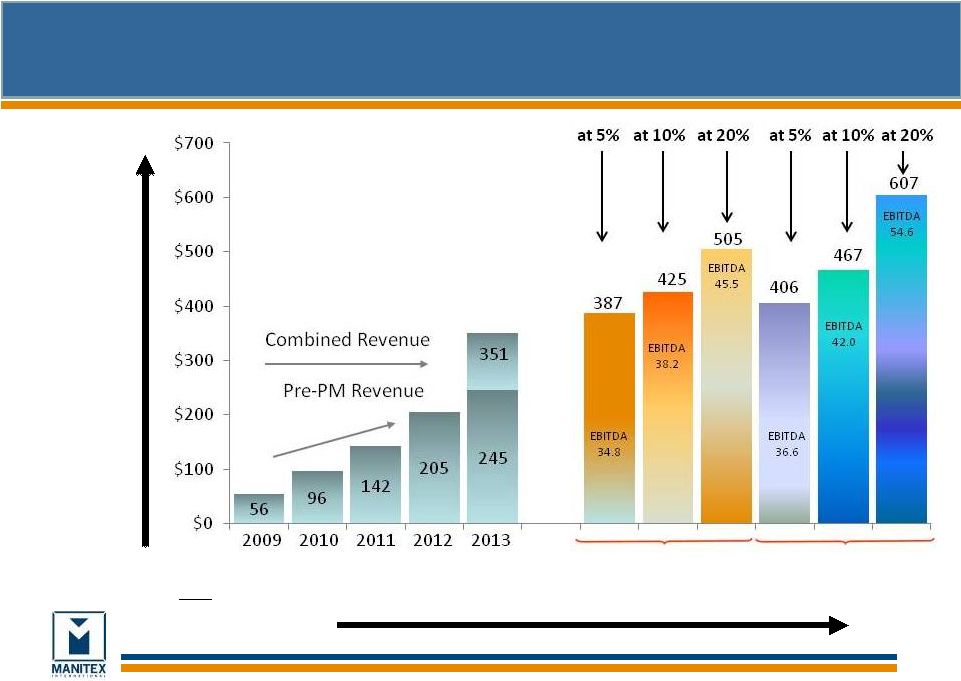  Consistently Growing
Our Top- and Bottom-
Lines ($ Millions)
7
Historically
Consistent
EBITDA
Margin of
9.0%
2009-2012
CAGR was
45.3% (pre-
PM Group)
$M
Opportunity
2016E
2015E |
 Pending
Acquisition-Agreement with PM-Group, July 2014
8
8/15/2014
Nasdaq: MNTX
•
Consideration of $107 million, subject to post-closing adjustments and
earnout provisions, is expected to consist of a combination of debt,
equity, and the assumption of $68 million in PM debt and liabilities.
(Final purchase price subject to adjustment based on market
conditions at close; assumed debt remains separate with recourse only to
PM.) •
The acquisition is expected to close in the fourth quarter of 2014,
subsequent to the pending Italian Court approval of a debt restructuring
plan.
•
PM-Group has trailing twelve months revenues of $106 million and adjusted
EBITDA margins of approximately 9% . |
 Acquisition
Rationale: 9
Acquisition fits into Manitex International stated growth objectives to achieve
growth both organically and through acquisitions. PM-Group
represents our largest acquisition to date.
PM-Group is a strong strategic fit:
•
Adds product classes -
knuckle boom cranes and truck mounted aerial
platforms-
both are a highly desired product categories with strong demand.
•
Adds new manufacturing facilities/capacity
•
Adds new distributors, geographies and niche markets
Accelerates Manitex growth both within Europe and globally
Compelling synergies create value for shareholders
•
Accretion to EBITDA and Earnings expected in 2014
8/15/2014
Nasdaq: MNTX |
 The Knuckleboom
Market- $2.3 Billion Globally
(Management Estimates)
10
8/15/2014
Nasdaq: MNTX
•
Large Market of $2.3 BN is roughly 2X the size of
the straight-mast boom truck market (global)
•
PM has a geographically diverse customer base with
70% of its business outside Europe
•
North American knuckleboom market is growing
•
Opportunity to increase PM Group’s No. American
market presence through Manitex’s distribution
network |
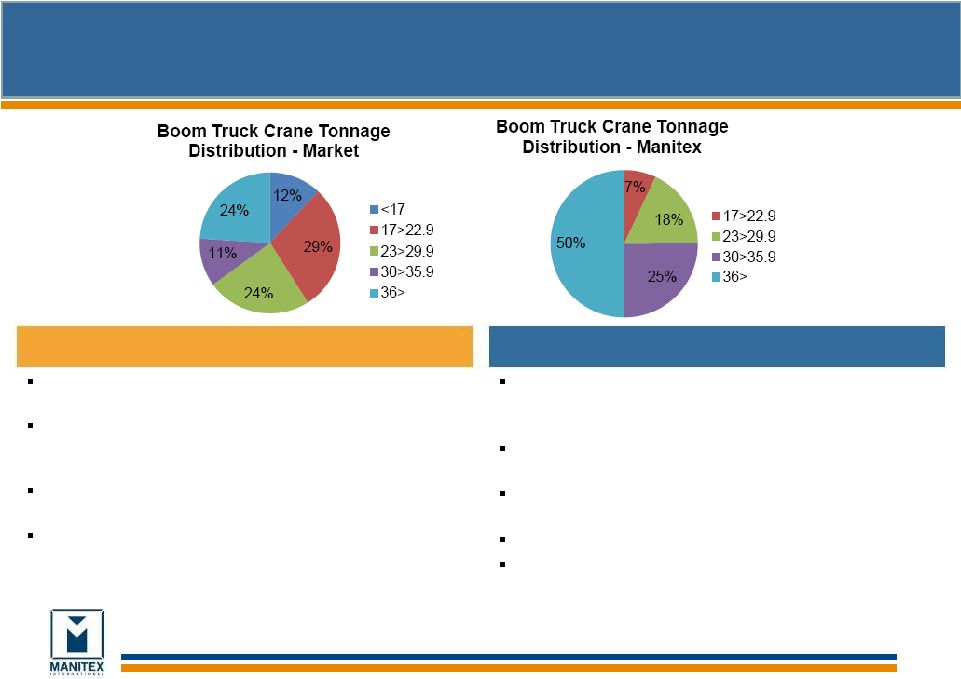 Lifting Equipment
Market Overview—Straight Mast
Principal products: boom truck cranes that vary in height
& tonnage capacity
Smaller tonnage cranes (<30 tons) more focused on
general construction markets; larger cranes (30+ tons)
focus on power line construction and energy
Larger tonnage cranes in higher demand since economic
downturn
Boom truck cranes typically less expensive than rough
terrain and all terrain cranes
Broader market: ~65% of cranes shipped in the smaller
tonnage range; ~75% of Manitex shipments have been in
larger tonnage
Focus on being a niche player allows specialization tailored
towards customers’
needs
Production distribution skewed toward larger tonnage
machines
First to launch 50-ton crane (May 2007)
Have developed a series of products around the demand
for larger tonnage cranes
11
Nasdaq: MNTX
Market Overview
Manitex Market Position
8/15/2014 |
 Replacement
Parts & Service Consistent Recurring Revenue
12
•
Consistent recurring revenue stream throughout the cycle
•
Spares relate to swing drives, rotating components, and booms
among others, many of which are proprietary
–
Serve additional brands
–
Service team for crane equipment
–
Automated proprietary system implemented in principal operations
Nasdaq: MNTX
8/15/2014 |
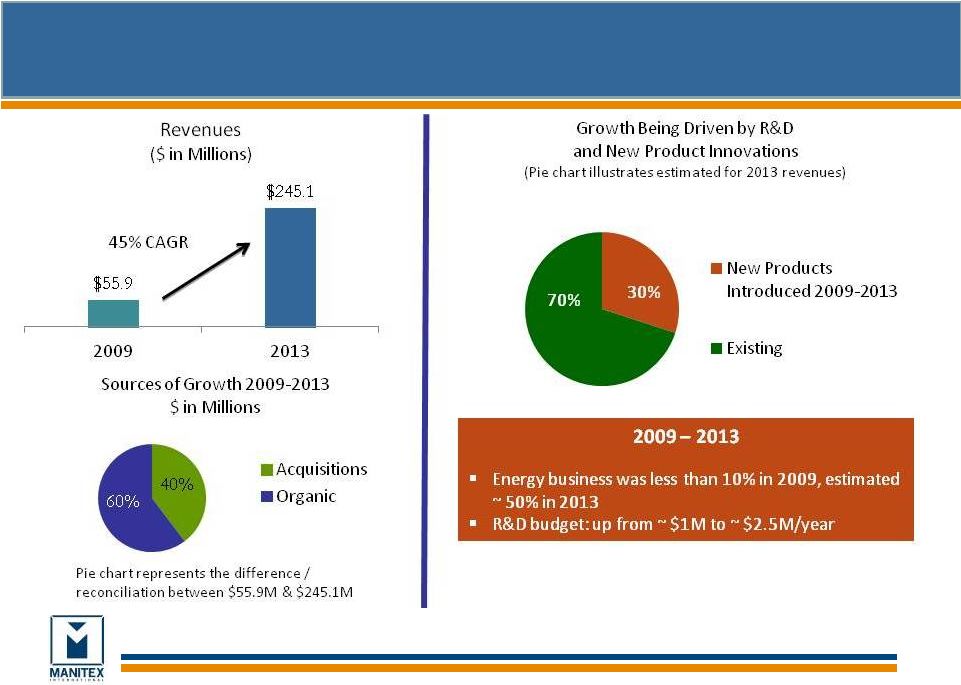 Revenue Growth
Drivers 13
Nasdaq: MNTX
8/15/2014 |
 Investment
Highlights 14
•
Niche markets with
solid demand
drivers for products
•
Steadying of
construction
environment and
energy markets
driving demand
•
Diverse end
markets result in
risk mitigation
•
Customer focused
design strategy
•
Diversified product
offering
•
Quickly adaptable
to changes in
demand
•
Commitment to
innovation,
research, &
product
development
•
Revenue and
earnings growth
have consistently
outpaced market
and industrial peers
since 2009
•
Backlog at $103M
as of 6/30/2014
•
Manitex dealer
network provides
footprint for on-
going North
American expansion
•
PM Group has little
penetration in US
and has excellent
non-US and non-
Europe customer
base
•
No Customer
represents over 10%
of annual revenues
•
Seasoned senior
management:
over 70 years of
collective industry
experience
•
Successfully
integrated
multiple
acquisitions
•
Significant
management
ownership
Growth in
End Markets
Flexible
Operating
Model
Broad Industry
& Geographic
Distribution
Growth in
Key Financial
Metrics
Experienced
Management
Nasdaq: MNTX
A
consolidator
in
the
lifting
and
hauling
industry,
Manitex
International
is
among
the
market
leaders
in
each
of
its
addressable
markets
with
an
estimated
$4
BN
in
annual
sales
8/15/2014 |
 15
Financial Overview
Manitex International, Inc.
Q2 2014
Nasdaq: MNTX
8/15/2014 |
 Key Figures
- Quarterly
$235M
16
$6,293
$5,513
$4,722
$2,986
$2,655
$1,877
$0
$1,000
$2,000
$3,000
$4,000
$5,000
$6,000
$7,000
$8,000
$9,000
$10,000
$0
$20,000
$40,000
$60,000
Q2-2014
Q2-2013
Q1-2014
Revenue
EBITDA
Net Income
USD thousands except as noted
Q2-2014
Q2-2013
Q1-2014
Net sales
$68,399
$62,554
$62,576
Gross profit
13,144
12,260
11,604
Gross margin %
19.2%
19.6%
18.5%
Operating expenses
7,966
7,656
7,993
Net Income
2,986
2,655
1,877
EBITDA
6,293
5,513
4,722
EBITDA % of Sales
9.2%
8.8%
7.5%
Backlog ($ million)
102.5
96.6
100.0
Nasdaq: MNTX
8/15/2014
$68,399
$62,554
$62,576 |
 Summary Balance
Sheet 17
$000s
30-Jun-14
31-Dec-13
31-Dec-12
31-Dec-11
31-Dec-10
Current Assets
139,898
$122,037
$104,777
$71,209
$54,703
Fixed Assets
10,477
11,143
10,297
11,017
10,659
Other Long-Term Assets
48,340
49,550
36,430
39,365
40,155
Total Assets
198,715
$182,730
$151,504
$121,591
$105,517
Current Liabilities
55,506
$48,016
$43,351
$30,177
$23,011
Long-Term Liabilities
52,711
49,723
48,620
44,620
39,232
Total Liabilities
108,217
97,739
91,971
74,797
62,243
Shareholders’
Equity
90,498
84,991
59,533
46,794
43,274
Total Liabilities & Shareholders’
Equity
198,715
$182,730
$151,504
$121,591
$105,517
Nasdaq: MNTX
8/15/2014 |
 18
Working Capital
“Focused
manufacturer of
engineered lifting
equipment”
$000
Q2-2014
Q4-2013
Working Capital
$84,392
$73,873
Days sales outstanding (DSO)
70
53
Days payable outstanding (DPO)
50
45
Inventory turns
2.8
2.9
Current ratio
2.5
2.5
Operating working capital
102,778
86,682
Operating working capital % of
annualized LQS
37.6%
33.1%
•Working capital increase Q2-2014 v Q4-2013, of $10.5m:
•Trade & Other Receivables $13.2m, Inventory $7.0m, partially offset
by reduced cash $2.9m, increased accounts payable $4.2m, short term
working capital borrowings $2.5m and accruals & other current liabilities $0.9m.
•Inventory increase includes governmental units shipped not recognized as
revenue in Q2 •Working capital ratios: DSO increase from a higher
proportion of international sales and timing of payments on
military |
 19
“Focused
manufacturer of
engineered lifting
equipment”
$000
Q2-2014
Q4-2013
Total Cash
$3,189
$6,091
Total Debt
59,828
54,231
Total Equity
90,498
84,991
Net capitalization
147,137
133,131
Net debt / capitalization
38.5%
36.2%
Trailing 12 month EBITDA
$22,864
$21,483
Debt / EBITDA
x2.6
x2.5
•Increase in debt of $5.6 million from 12/31/13 principally reflects increase
in working capital facilities in N.A. ($4.1m) and Italy ($2.3m) funding
increased activity levels. •Other debt repayments in the quarter of $0.6
million •N. American revolver facilities, based on available collateral
at 6/30/14 was $50.8m. •N. American revolver availability at 6/30/14 of
$6.7m. •
Net capitalization is the sum of debt plus equity minus cash
•
Net debt is total debt less cash
Debt and Liquidity |
 Experienced
Management Team 20
Name & Title
Experience
David Langevin
Chairman & CEO
20+ years principally with Terex
Andrew Rooke
President & COO
20+ years principally with Rolls Royce, GKN Sinter Metals,
Off-Highway & Auto Divisions
David Gransee
CFO & Treasurer
Formerly with Arthur Andersen, 15+ years with Eon Labs
(formerly listed)
Robert Litchev
President –
Manufacturing Operations
10+ years principally with Terex
Scott Rolston
SVP Strategic Planning
13+ years principally with Manitowoc
Bruce Peterson
SVP Sales and Marketing
20+ years principally with Manitowoc
Nasdaq: MNTX
8/15/2014 |
 Company
Timeline 21
Nasdaq: MNTX
July 2013: Acquires
Sabre Manufacturing LLC
December 2009: Acquires
Load King Trailers
July 2009: Acquires
Badger Equipment Co.
November 2006:
Veri-Tek
Acquires LiftKing
July 2007: VCC
acquires Noble
forklift
May 2008: Name changed to Manitex International
and listed on Nasdaq (MNTX)
October 2008:
Crane &
Machinery and
Schaeff Forklift
acquired
July 2006: Manitex
merges into Veri-Tek,
Intl. (VCC)
July 2010: CVS
Operating Agreement
July 2011: Closes
Acquisition of CVS
January 2003:
Manitowoc
divests
Manitex
March 2002:
Manitowoc
(NYSE:MTW)
acquires Grove
November 2013:
Acquires Valla SpA
of Piacenza, Italy
July 2014: Agreement to
Acquire
PM Group SpA
8/15/2014 |
 Operating
Companies 22
Brand
Products
End Markets
Drivers
•
Boom trucks and cranes
•
Sign cranes
•
Parts
•
Energy exploration
•
Power transmission
•
Industrial projects
•
Infrastructure development
•
Strong end market demand for specialized,
competitively differentiated products for oil, gas,
and energy sectors
•
Product development
•
Rough terrain cranes
•
Specialized construction
equipment
•
Parts
•
Railroad
•
Construction
•
Refineries
•
Municipality
•
Equipment replacement cycle in small tonnage
flexible cranes for refinery market
•
More efficient product offering across end
markets
•
Rough terrain forklifts
•
Special mission-oriented vehicles
•
Custom specialized carriers
•
Parts
•
Military
•
Utility
•
Ship building
•
Commercial
•
Steady, profitable growth from both commercial
and military application of products
•
Custom trailers
•
Hauling systems for heavy
equipment transport
•
Parts
•
Energy
•
Mining
•
Railroad
•
Commercial construction
•
U.S. energy exploration build-out
•
Oil and gas exploration
•
General infrastructure construction
•
Reach stackers
•
Container handling forklifts
•
Parts
•
Global container market
•
International container market and global trade
•
Re-establishing customer relationships and select
product categories
•
Specialized equipment for liquid
storage & containment
•
8,000-21,000 gallon capacities
•
Large client base in energy sector
•
Petrochemical
•
Waste management
•
Oil & gas drilling
•
Reputation for quality & innovation
•
Serves a market of over $1B annually
•
At acquisition, TTM (3/31/13) revenues ~ $39.1M,
adjusted EBITDA ~ $4.5M, EBIT ~ $4.2M
Nasdaq: MNTX
8/15/2014 |
 Operating
Companies 23
Brand
Products
End Markets
Drivers
•
Precision pick & carry cranes
•
Automotive
•
Chemical / petrochemical
•
Industrial projects
•
Infrastructure development
•
Aerospace
•
Construction
•
Strong end market demand for specialized,
competitively differentiated products
•
Environmental (electric) or hazardous (spark free)
developments
•
Product development
Nasdaq: MNTX
•
Knuckleboom cranes
•
Aerial Platforms
•
Energy
•
Construction
•
Infrastructure
•
Utilities
•
Growing acceptance of knucklebooms in North
American markets
•
Oil and gas exploration creating demand
•
Product development
8/15/2014 |