Attached files
| file | filename |
|---|---|
| 8-K - 8-K - DOLLAR GENERAL CORP | a14-19227_18k.htm |
| EX-99.1 - EX-99.1 - DOLLAR GENERAL CORP | a14-19227_1ex99d1.htm |
Exhibit 99.2
|
|
Dollar General Proposal to Acquire Family Dollar AUGUST 18, 2014 |

|
|
This presentation contains forward-looking information within the meaning of the federal securities laws. A reader can identify forward-looking statements because they are not limited to historical fact or they use words such as “outlook,” “may,” “should,” “could,” “believe,” “anticipate,” “plan,” “expect,” “estimate,” “forecast,” ”project,” “goal,” “objective,” “intend,” “committed,” “continue,” or “would,” and similar expressions that concern Dollar General Corporation’s (the “Company”) strategy, plans, intentions or beliefs about future occurrences or results, including by way of example and not limitation, plans, intentions and expectations regarding the Company’s proposal to acquire Family Dollar Stores, Inc. (“Family Dollar”), the financing of a potential transaction, and the anticipated results, benefits, synergies, earnings accretion, costs, timing and other expectations of the benefits of a potential transaction. These matters involve risks, uncertainties and other factors that may cause the actual results or the actual performance of the Company to differ materially from that which the Company expected. Many of these statements are derived from the Company’s operating budgets and forecasts, which are based on many detailed assumptions that the Company believes are reasonable or are based on various assumptions about certain plans, activities, or events which the Company expects will or may occur in the future. However, it is very difficult to predict the effect of known factors, and the Company cannot anticipate all factors that could affect actual results that may be important to an investor. All forward-looking information should be evaluated in the context of these risks, uncertainties and other factors, including those factors disclosed under “Risk Factors” in the Company’s most recent Annual Report on Form 10-K and any subsequent quarterly filings on Form 10-Q filed with the Securities and Exchange Commission and such other factors as may be discussed in this presentation. All forward-looking statements are qualified in their entirety by these and other cautionary statements that the Company makes from time to time in its SEC filings and public communications. The Company cannot assure the reader that it will realize the results or developments the Company anticipates, including, without limitation, the expected synergies, earnings accretion or benefits from a potential transaction or, even if substantially realized, that they will result in the consequences or affect the Company or its operations in the way the Company expects. Forward-looking statements speak only as of the date made. The Company undertakes no obligation to update or revise any forward-looking statements to reflect events or circumstances arising after the date on which they were made, except as otherwise required by law. As a result of these risks and uncertainties, readers are cautioned not to place undue reliance on any forward-looking statements included herein or that may be made elsewhere from time to time by, or on behalf of, the Company. Disclaimer and Safe Harbor statement |

|
|
Key Transaction Highlights |

|
|
Transaction Overview CONSIDERATION VALUATION FINANCING SYNERGIES FINANCIAL IMPACT TIMING LEADERSHIP $78.50 per Family Dollar share 100% cash offer Valuation represents an LTM Q3 2014 EBITDA multiple of 11.6x Price represents a 5.4% premium to the alternative transaction and a 29.4% premium to the July 25 Family Dollar share price of $60.66 Bank Agreement to provide committed financing of $12.3 billion Expected financing structure includes a revolver, term loan and notes Estimated run-rate synergies of $550 to $600 million One-time implementation costs estimated at $300 to $400 million Low double-digit accretion to earnings in the first year after closing, excluding implementation and transaction costs Prepared to move immediately to complete diligence with Family Dollar management Estimated closing as early as mid 2015 |

|
|
Attractive Proposal for Family Dollar Shareholders Higher value and certainty of 100% cash offer Goldman Sachs and Citigroup Global Markets Inc. agreement to provide committed financing Extensive economic analysis completed on potential regulatory impacts Dollar General management ready to move immediately on completing diligence of Family Dollar Terms and conditions consistent with alternative transaction, modified for all-cash proposal, antitrust matters and permitted dividend payments |

|
|
Solidify Position as the Leading Small-Box Discount Retailer Combined Adjusted EBITDA (LTM) (excluding synergies) STATES REVENUE (LTM) STORES 11,338 19,584 8,246 40 46 46 $ 17,793 $ 28,171 $ 10,378 $ 2,083 $ 2,917 $ 834 Note: See Non-GAAP reconciliations States and store count are as of most recent quarter end 2014. Financials are as of Q12014 ending May 2, 2014 for DG and Q32014 ending May 31, 2014 for FDO, on an LTM basis. |

|
|
Highly Complementary Business Models PRICING FORMAT PRODUCT MIX 100% Multi Price-Point Most items priced at $10 or less ~25% priced at $1 or less 100% Multi Price-Point Most items priced at $10 or less ~27% priced at $1 or less STORE SIZE ~7,400 square feet ~7,200 square feet Source: Family Dollar 2013 Form 10K |

|
|
Clear Operational Synergies and Integration Plan SIGNIFICANT OPERATIONAL SYNERGIES EXTENSIVE PLANS Detailed integration plans developed across work streams: Store Operations Merchandising Supply Chain Administration INTEGRATION COSTS $550-600 million of run-rate synergies by year 3 Approximately $300 to $400 million in one-time costs to capture synergies Investment of $400 million in capital expenditures |

|
|
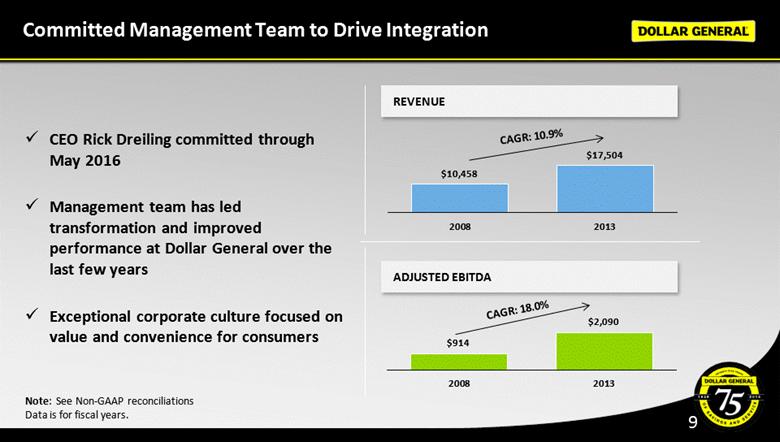
Committed Management Team to Drive Integration CEO Rick Dreiling committed through May 2016 Management team has led transformation and improved performance at Dollar General over the last few years Exceptional corporate culture focused on value and convenience for consumers REVENUE ADJUSTED EBITDA CAGR: 10.9% CAGR: 18.0% |
|
|
Significant Earnings Accretion Through Synergies METRIC DG LTM Combined LTM Sales $ 17,793 $28,171 Adjusted EBITDA $2,083 $2,917 Pro Forma Adjusted EBITDA (midpoint synergies)(1) -- $3,492 Low double-digit percentage accretive in year one, excluding integration and transaction costs |

|
|
Financing and Credit Considerations Agreement by Goldman Sachs and Citi to provide committed financing, consisting of a combination of the following: Cash on balance sheet Revolver Term Loan Notes Pro forma adjusted debt to LTM EBITDAR of 5.5x Compelling long-term financial model allowing for continued strong liquidity and consistent cash flow Significant debt reduction in the near term Commitment to return to investment grade credit profile – anticipated three years post closing EXPECTED SOURCES OF FUNDS KEY CREDIT CONSIDERATIONS |

|
|
Key Transaction Highlights |
|
|
Non GAAP Reconciliations Certain information provided in this presentation has not been derived in accordance with U.S. generally accepted accounting principles (“GAAP”), including Adjusted EBITDA for Dollar General’s 2008 and 2013 fiscal years and calculations of Sales and Adjusted EBITDA for both Dollar General and Family Dollar and their combined totals based on their respective latest reported 52 weeks. In addition, Adjusted EBITDAR, a non-GAAP measure, is utilized in calculating a pro forma ratio of Adjusted Debt to Adjusted EBITDAR referenced herein. Reconciliations of these non-GAAP measures are provided in the following slides. The Company believes that the presentation of EBITDA, Adjusted EBITDA, and the ratio of Adjusted Debt to Adjusted EBITDAR is useful to investors because these or similar measures are frequently used by securities analysts, investors and other interested parties in the evaluation of the operating performance and financial leverage of companies in industries similar to Dollar General’s and that the combined data is useful in evaluating the financial impact of the transaction being discussed in this presentation. EBITDA is defined as income (loss) from continuing operations before cumulative effect of changes in accounting principles plus interest and other financing costs, net, provision for income taxes, and depreciation and amortization. Adjusted EBITDA is defined as EBITDA, further adjusted to give effect to adjustments noted in the accompanying non-GAAP reconciliation tables. Adjusted EBITDAR is defined as Adjusted EBITDA plus total rent expense and Adjusted Debt is defined as total long-term obligations, including the current portion, plus total rent expense multiplied by eight, which is an estimate of the hypothetical capitalization of operating leases, consistent with practices used by the Company’s rating agencies. The non-GAAP measures discussed above are not measures of financial performance or condition, liquidity or profitability in accordance with GAAP, and should not be considered alternatives to net income, diluted earnings per share, operating income, cash flows from operations or any other performance measures determined in accordance with GAAP. These non-GAAP measures have limitations as analytical tools and should not be considered in isolation or as substitutes for analysis of the Company’s financial results as reported under GAAP. Because not all companies use identical calculations, these presentations may not be comparable to other similarly titled measured of other companies. |

|
|
Non GAAP Reconciliations Combined Fiscal Year 13 Weeks 13 Weeks 52 Weeks Fiscal Year 39 Weeks 39 Weeks 52 Weeks Ended Ended Ended Ended Ended Ended Ended Ended Most January 31, May 3, May 2, May 2, August 31, June 1, May 31, May 31, Recent (In millions) 2014 2013 2014 2014 2013 2013 2014 2014 52 Weeks Net Sales 17,504 $ 4,234 $ 4,522 $ 17,793 $ 10,391 $ 7,889 $ 7,875 $ 10,378 $ 28,171 $ Net income 1,025 220 222 1,027 444 341 250 352 1,380 Add (subtract): Interest expense 89 25 22 87 26 20 22 28 115 Depreciation and amortization 327 78 83 331 224 166 183 242 573 Income taxes 603 132 135 607 247 192 133 187 794 EBITDA 2,044 455 463 2,052 941 719 588 809 2,861 Adjustments: (Gain) loss on debt retirement, net 19 19 - - - - - - - Non-cash expense for share-based awards 21 5 9 25 - - - - 25 Litigation settlement and related costs, net 9 - - 9 - - - - 9 Indirect costs related to merger and stock offering 1 1 - 0 - - - - - Other non-cash charges (including LIFO) (5) 1 1 (5) - - - - (5) Other 1 - 1 2 - - - - 2 Cost of sales - restructuring - - - - - - 1 1 1 Selling, general and administrative - restructuring - - - - - - 23 23 23 Total Adjustments 46 26 11 31 - - 24 24 55 Adjusted EBITDA 2,090 480 473 2,083 941 719 612 834 2,917 Rent Expense 687 164 188 711 564 1,275 Adjusted EBITDAR 2,776 $ 644 $ 662 $ 2,794 $ 1,398 $ 4,192 $ (1) Family Dollar information derived from 2013 Annual Report and quarterly earnings releases. Assumed rent expense for latest twelve months to approximate rent expense for FDO's fiscal 2013 full year. Reconciliation of Net Income to EBITDA, Adjusted EBITDA and Adjusted EBITDAR and Calculation of Net Sales For the Lastest Reported 52 Week Periods Dollar General Family Dollar (1) |

|
|
Non GAAP Reconciliations January 30, January 31, (In millions) 2009 2014 Net income 108.2 $ 1,025.1 $ Add (subtract): Interest expense 388.8 89.0 Depreciation and amortization 235.1 326.7 Income taxes 86.2 603.2 EBITDA 818.3 2,044.0 Adjustments: (Gain) loss on debt retirement, net (3.8) 18.9 (Gain) loss on hedging instruments 1.1 - Contingent gain on distribution center leases (5.0) - Impact of markdowns related to clearance activities, net of purchase accounting adjustments (24.9) - Non-cash expense for share-based awards 10.0 21.0 Litigation settlement and related costs, net 32.0 8.5 Indirect costs related to merger and stock offering 20.7 0.8 Advisory and consulting fees to affiliates 8.6 - Other non-cash charges (including LIFO) 54.7 (4.8) Other 2.2 1.1 Total Adjustments 95.6 45.5 Adjusted EBITDA 913.9 $ 2,089.5 $ For the Fiscal Year (52 Weeks) Ended Dollar General Reconciliation of Net Income to EBITDA and Adjusted EBITDA |
