Attached files
| file | filename |
|---|---|
| 8-K - FORM 8-K - CNL LIFESTYLE PROPERTIES INC | d773183d8k.htm |
| EX-99.1 - PRESS RELEASE - CNL LIFESTYLE PROPERTIES INC | d773183dex991.htm |
 CNL Lifestyle
Properties, Inc. CNL Lifestyle Properties, Inc.
Owning
Owning
America’s
America’s
Lifestyle
Lifestyle
®
®
Second Quarter 2014 Update
Second Quarter 2014 Update
August 14, 2014
August 14, 2014
Exhibit 99.2 |
 2
Forward Looking Statements
Certain statements in this document may constitute forward-looking statements within the meaning
of Section 27A of the Securities Act of 1933, as amended (the “Securities Act”) and
of Section 21E of the Securities Exchange Act of 1934, as amended (the “Exchange Act”). CNL Lifestyle Properties, Inc. (herein also referred to as the “Company”)
intends that all such forward-looking statements be covered by the safe-harbor provisions for
forward-looking statements of Section 27A of the Securities Act and Section 21E of the
Exchange Act, as applicable.
All statements, other than statements that relate solely to historical facts, including, among others,
statements regarding the Company’s future financial position, business strategy, projected
levels of growth, projected costs and projected financing needs, are forward-looking statements. Those statements include statements regarding the intent,
belief or current expectations of the management team, as well as the assumptions on which such
statements are based, and generally are identified by the use of words such as “may,”
“will,” “seeks,” “anticipates,” “believes,” “estimates,” “expects,” “plans,” “intends,” “should,” “continues,” “pro forma” or similar
expressions. Forward-looking statements are not guarantees of future performance and actual
results may differ materially from those contemplated by such forward-looking statements due to a variety of
risks, uncertainties and other factors, including but not limited to, the factors detailed in our
Annual Report on Form 10-K for the year ended December 31, 2013, and other documents filed
from time to time with the Securities and Exchange Commission.
Many of these factors are beyond the Company’s ability to control or predict. Such factors
include, but are not limited to: changes in general economic conditions in the U.S. or globally
(including financial market fluctuations); risks associated with our investment strategy; risks associated with the real estate markets in which the Company invests;
risks of doing business internationally and global expansion, including unfamiliarity with new markets
and currency risks; risks associated with the use of debt to finance the Company’s
business activities, including refinancing and interest rate risk and the Company’s failure to comply with its debt covenants; the Company’s failure to obtain, renew
or extend necessary financing or to access the debt or equity markets; competition for properties
and/or tenants in the markets in which the Company engages in business; the impact of current
and future environmental, zoning and other governmental regulations affecting the Company’s properties; the Company’s ability to make necessary
improvements to properties on a timely or cost-efficient basis; risks related to development
projects or acquired property value-add conversions, if applicable (including construction
delays, cost overruns, the Company’s inability to obtain necessary permits and/or public opposition to these activities); defaults on or non-renewal of leases by
tenants; failure to lease properties at all or on favorable terms; unknown liabilities in connection
with acquired properties or liabilities caused by property managers or operators; the
Company’s failure to successfully manage growth or integrate acquired properties and operations; material adverse actions or omissions by any joint venture
partners; increases in operating costs and other expense items and costs, uninsured losses or losses
in excess of the Company’s insurance coverage; the impact of outstanding or potential
litigation; risks associated with the Company’s tax structuring; the Company’s failure to qualify and maintain its status as a real estate investment trust
and the Company’s ability to protect its intellectual property and the value of its brand.
Management believes these forward-looking statements are reasonable; however, such
statements are necessarily dependent on assumptions, data or methods that may be incorrect or
imprecise and the Company may not be able to realize them. Investors are cautioned not to
place undue reliance on any forward-looking statements which are based on current expectations. All written and oral forward-looking statements attributable
to the Company or persons acting on its behalf are qualified in their entirety by these cautionary
statements. Further, forward-looking statements speak only as of the date they are
made and the Company undertakes no obligation to update or revise forward-looking statements to reflect changed assumptions, the occurrence of unanticipated
events or changes to future operating results over time unless otherwise required by law. |
 Portfolio of 151 lifestyle-oriented
properties and five loans as of
August 8, 2014
Diversified by asset type,
geography and operator
Iconic assets and industry-
leading operators
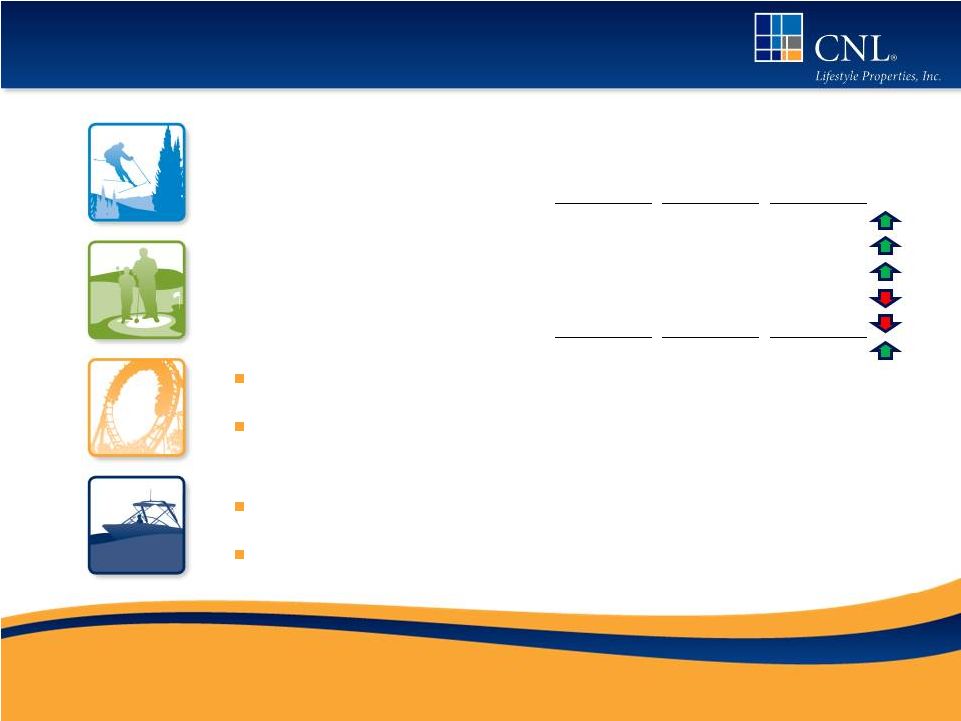
Ski & Mountain
Golf
Attractions
Senior Housing
Marinas
Additional
•
24 properties
•
48 properties
•
24 properties
•
36 properties
•
17 properties
•
2 properties
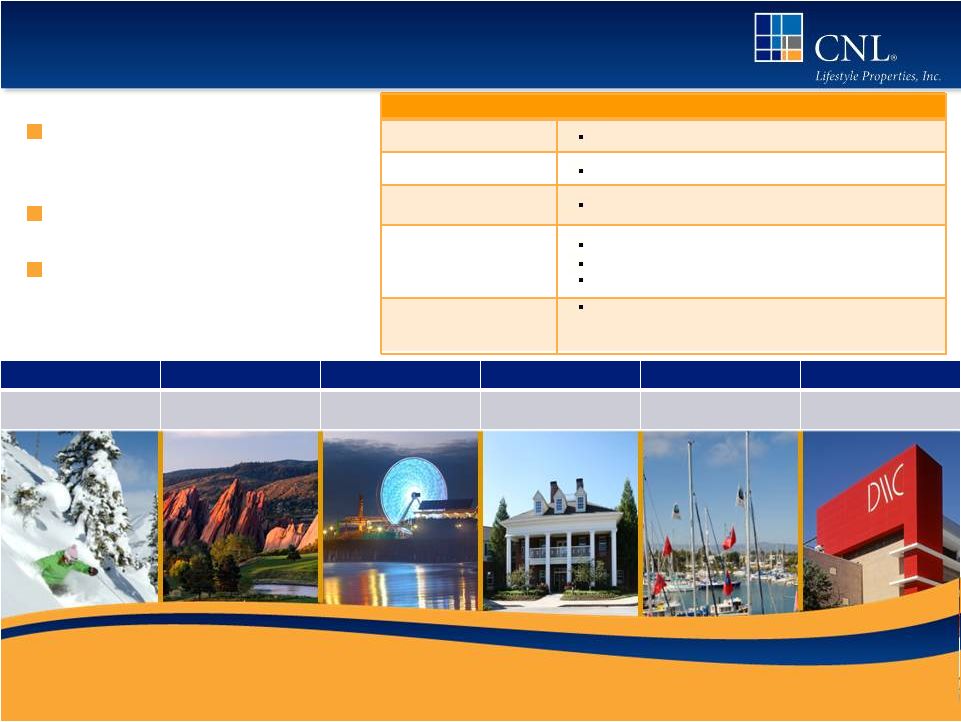
CNL Lifestyle Properties, Inc.
Summary REIT Information
GAAP Total Assets
$2.7 billion
Property
Focus
Demographically Driven / Lifestyle-Oriented
Geographic
Diversification
37 states and 2 Canadian provinces
Established Assets
Conservative
Capital Structure
Leasing
and Preferred Return Structures
Diversified Portfolio
Exit
Strategy
The
board
of
directors
will
consider
a listing, merger,
sale or other liquidity opportunities on or before
December 31, 2015
3 |
 Recent Highlights
Entered into a purchase and sale agreement to sell our 48-property golf
portfolio in June 2014 for $320 million and we expect the transaction to be
completed in 2014; Net proceeds after retiring existing golf debt will be
used to retire other secured debt, make capital expenditures at other
properties or acquire additional properties
Jefferies LLC, a leading global investment banking and advisory firm, is currently
assisting in the evaluation of various strategic alternatives to
provide liquidity to
shareholders
Acquired three senior housing communities in Q2 2014 totaling $38 million and
three
additional
senior
housing
communities
in
July
totaling
$67
million
Over $5 million of owner capital invested into various portfolio
assets in Q2 2014
In June 2014, we completed the sale of our only multi-family residential
property, Mizner Court, and received approximately $73.5 million in
proceeds, which were primarily used to retire debt
Expected to complete the acquisition of two additional senior housing
communities in September totaling $34 million
4 |
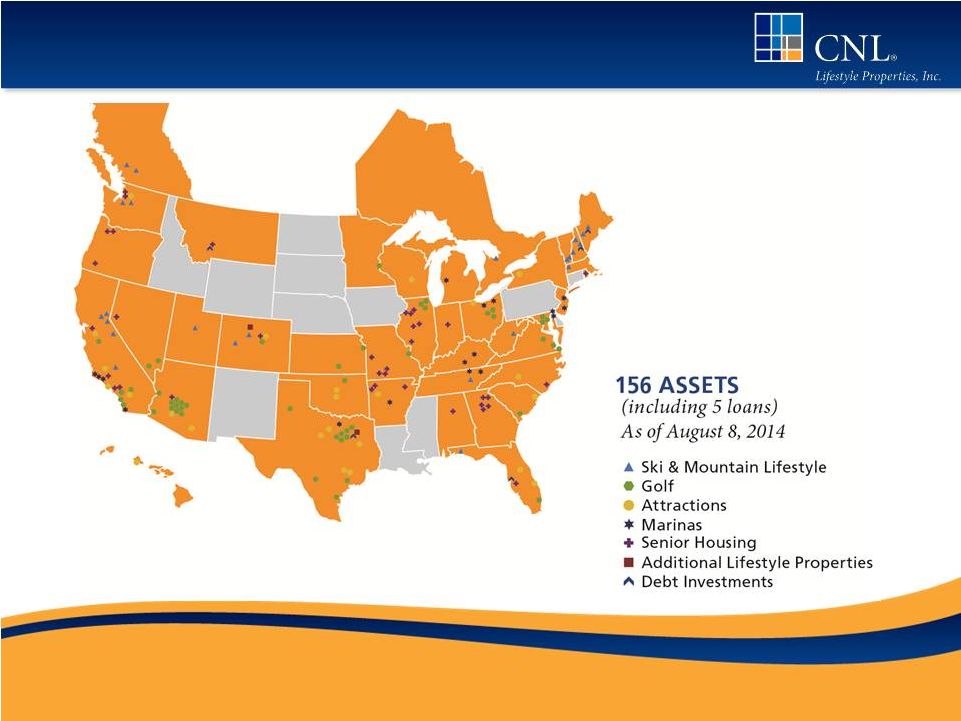 Geographic Diversification
5 |
 The portfolio is broadly diversified across asset classes to
mitigate against seasonality and volatility
Sector Diversification
As of August 8, 2014
Ski & Mountain Lifestyle (24)
Golf (48)
Attractions (24)
Senior Housing (36)
Marinas (17)
Additional Lifestyle Properties (2)
By Initial Purchase Price
6 |
 Sector Performance
7
151 properties as of August 8, 2014
Source: CNL Lifestyle Properties, Inc. June 30, 2014, Form 10-Q
Past performance is not indicative of future returns.
Ski & Mountain
24 properties
-
Late season favorable
conditions. Summer
operations (zip-lining,
mountain biking and scenic
lift rides) have been strong
and have driven revenue
and EBITDA up in Q2
versus prior year.
Golf
48 properties
-
Golf rounds are down -
consistent with the 2.1%
industry decrease in
overall rounds played
YTD through June 2014
as reported by Golf
Datatech. Our property
EBITDA is up slightly.
Attractions
24 properties
-
Increase in revenue YTD
due to early season efforts
to drive activity and
visitation resulting in a
significant increase in
season pass sales over
prior year.
Senior Housing
36 properties
-
Occupancy slightly off while
Revenue per Occupied Unit is
up over the last year. Average
occupancy for the entire
portfolio was 91.0% for the
quarter ended June 30, 2014,
exceeding the industry
average of 90.2%. Certain
locations had increased labor
and R&M costs caused by
severe winter storms.
Marinas
17 properties
-
Revenue and EBITDA were
down slightly in Q2
compared to the prior year.
Management
proactively
transitioned the last four
leased marinas to managed
structures in April 2014
which have impacted
revenue and earnings
during
transition.
Additional Lifestyle
2
properties
-
Steady performance at
Dallas Market Center.
Multi-family property sold
in June. |
 Same-Store Property Performance
8
Three Months Ended June 30, 2014, Compared to Same Period 2013
Note: Includes results for comparable consolidated leased and managed properties
owned for the entirety of 2014 and 2013. Source: CNL Lifestyle
Properties, Inc. June 30, 2014, Form 10-Q The
increase
in
both
revenue
and
EBITDA
are
primarily
due
to
the
performance
of
the
ski
and
mountain
lifestyle and attractions sectors
Ski
and
mountain
lifestyle
properties
experienced
favorable
late
season
conditions
in
certain
locations,
inclusive
of
both
snowfall
and
temperatures
allowing
some
of
our
properties
to
remain
in
operations
through
April; In addition, summer operations (zip lining, scenic lift rides and mountain
biking) were strong due to favorable weather conditions in June
The attractions sector experienced an increase in revenues due to early season
efforts to drive activity and visitation, which resulted in a significant
increase in season pass sales compared to the prior year The marina and
senior housing sectors were impacted due to the transition of the properties to multiple new
managers and higher weather related repairs and maintenance expenses, however, we
expect to see performance upside over the long term as a result of the
changes # of
Properties
Revenue
EBITDA
Ski and Mountain Lifestyle
17
12.7%
22.6%
Golf
48
-0.8%
1.0%
Attractions
21
8.4%
21.3%
Senior Housing
20
3.3%
-3.4%
Marinas
17
-2.3%
-0.8%
123
5.9%
35.3% |
 Same-Store Property Performance
9
Six Months Ended June 30, 2014, Compared to Same Period 2013
Note: Includes results for comparable consolidated leased and managed properties
owned for the entirety of 2014 and 2013. Source: CNL Lifestyle
Properties, Inc. June 30, 2014, Form 10-Q The decreases in both revenue
and EBITDA are primarily due to the performance of the ski and mountain
lifestyle
and
marina
sectors
-
Ski
resorts
in
the
West
(particularly
California)
experienced
unusually
warm,
drought
conditions
causing
poor
operating
results
as
compared
to
the
2012/2013
ski
season
Marina sector was down due to record-breaking cold temperatures and ice storms
which resulted in the temporary
closure
of
our
largest
marina,
reducing
operating
results
-
the
marinas
were
also
impacted
by
our
proactive
transition
of
the
properties
to
multiple
new
managers,
which
was
completed
in
April
2014
Attractions
portfolio
benefited
from
the
warm,
dry
conditions
in
Southern
California
and
tight
expense
controls
at many properties throughout the offseason
TTM lease coverage was 1.46x through Q2 2014 primarily due to the addition of the
senior housing assets improved performance for the leased attraction
portfolio # of
Properties
Revenue
EBITDA
Ski and Mountain Lifestyle
17
-3.5%
-5.5%
Golf
48
-0.8%
0.4%
Attractions
21
8.3%
72.8%
Senior Housing
20
3.4%
-4.1%
Marinas
17
-6.3%
-16.9%
123
-0.6%
-1.6% |
 Full Year Financial Summary (in Millions)
FFO
Adjusted EBITDA
10
MFFO
Source: CNL Lifestyle Properties, Inc. 2013 Form 10-K and June 30, 2014, Form
10-Q The
Company
believes
that
its
presentation
of
historical
non-GAAP
financial
measures
provides
useful
supplementary
information
to
and
facilitates
additional
analysis
by
investors.
These
historical
non-GAAP
financial
measures
are
in
addition
to,
not
a
substitute
for,
or
superior
to,
measures
of
financial
performance
prepared
in
accordance
with
U.S.
Generally
Accepted Accounting Principles. See reconciliation to GAAP net income (loss)
contained in the Appendix. Past performance is not indicative of future
returns. Trailing 12 month 2014 FFO higher due to:
An increase in rental income from properties acquired after Q2 2013
and increases in same store rents and NOI
Reduced asset management fees due to the sale of 42 senior
housing properties held in three unconsolidated joint ventures and a
reduction in fees charged by our Advisor, effective April 1, 2014, as
well as a reduction in bad debt expense
Partially offset by an increase in interest expense and loan cost
amortization from additional borrowings, a loan loss provision and a
reduction in FFO contribution from the sale of 42 senior housing
properties held in three unconsolidated joint ventures
|
 Credit Metrics
Interest Coverage (1)
(1) Calculated as adjusted EBITDA divided by interest
expense (2) Net debt is total debt less cash
(3) Debt includes line of credit
Net Debt / Adjusted EBITDA (2)
11
Debt / GAAP Total Assets (3)
Source: CNL Lifestyle Properties, Inc. 2013 Form 10-K and June 30, 2014, Form
10-Q The
Company
believes
that
its
presentation
of
historical
non-GAAP
financial
measures
provides
useful
supplementary
information
to
and
facilitates
additional
analysis
by
investors.
These
historical
non-GAAP
financial
measures
are
in
addition
to,
not
a
substitute
for,
or
superior
to,
measures
of
financial
performance
prepared
in
accordance
with
U.S.
Generally
Accepted Accounting Principles. See reconciliation to GAAP net income (loss)
contained in the Appendix. Past performance is not indicative of future
returns. Year
Coverage
2011
2.4x
2012
2.5x
2013
2.6x
TTM June 2014
2.4x
Year
Coverage
2011
5.5x
2012
6.3x
2013
6.1x
Jun-14
6.2x
Consolidated
Leverage Including Share
Year
Coverage
of Unconsolidated Entities
2011
32.0%
43.3%
2012
38.7%
45.3%
2013
44.6%
48.1%
June 2014
46.3%
49.4% |
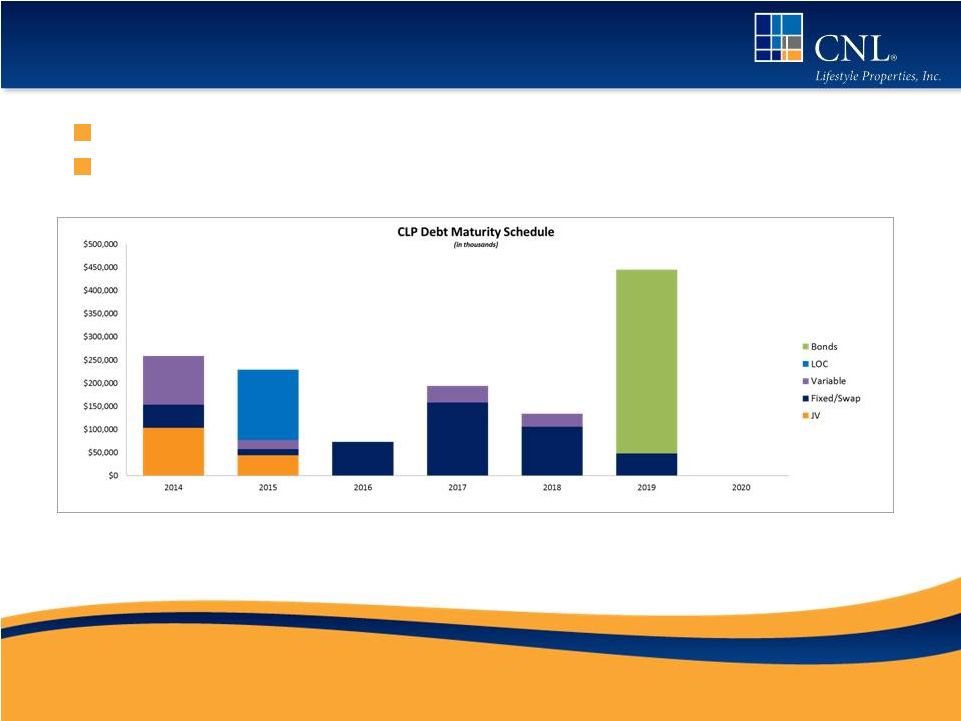 Key
Credit Information 12
Weighted average interest rate is 5.70% (5.98% without JV debt)
72% fixed rate debt, 3% hedged and 25% variable rate debt
Note: Chart as of June 30, 2014. 2014 maturities are expected to be
refinanced or retired with proceeds from asset sales. |
 Contact Information
13
For more information about
CNL Lifestyle Properties, please contact
CNL Client Services at 866-650-0650. |
 Appendix
14
Appendix |
 Reconciliation of FFO and MFFO to Net Loss
15
Source: CNL Lifestyle Properties, Inc. June 30, 2014, Form 10-Q
The
Company
believes
that
its
presentation
of
historical
non-GAAP
financial
measures
provides
useful
supplementary
information
to
and
facilitates
additional
analysis
by
investors.
These
historical
non-GAAP
financial
measures
are
in
addition
to,
not
a
substitute
for,
or
superior
to,
measures
of
financial
performance
prepared
in
accordance
with
U.S.
Generally
Accepted Accounting Principles.
Past performance is not indicative of future returns.
2014
2013
2014
2013
Net loss
(8,505)
$
(55,205)
$
(28,858)
$
(78,504)
$
Adjustments:
Depreciation and amortization:
(1)
Continuing operations
31,098
28,837
63,032
57,595
Discontinued operations
-
7,796
4,925
15,221
Impairment of real estate assets:
(1)
Continuing operations
-
42,451
-
42,451
Discontinued operations
1,150
-
4,464
-
(Gain) loss on sale of
real estate investment: (1)
Discontinued operations
73
(2,080)
70
(2,083)
Net effect of FFO adjustment from unconsolidated entities:
(2)
Continuing operations
6,658
4,293
8,389
10,337
Total funds from operations
30,474
26,092
52,022
45,017
Acquisition fees and expenses:
(3)
Continuing operations
1,279
546
2,003
913
Straight-line adjustments for leases and notes receivable:
(1)(4)
Continuing operations
(2,737)
(771)
(6,164)
(1,042)
Discontinued operations
-
(321)
-
(536)
(Gain) loss from early
extinguishment of debt: (5)
Continuing operations
600
-
600
-
Discontinued operations
(266)
-
(266)
-
Amortization of above/below market
intangible assets and liabilities (1)
Continuing operations
7
(1)
24
(2)
Discontinued operations
-
349
359
683
Loan loss
provision: (6)
Continuing operations
2,520
-
2,520
-
Accretion of discounts/amortization
of premiums: Continuing
operations 3
3
6
6
MFFO adjustments from
unconsolidated entities: (2)
Straight-line adjustments for leases and notes
receivable: (4)
Continuing operations 48
(78)
62
(146)
Amortization of above/below market intangible
assets and liabilities:
Continuing operations (88)
(3)
(76)
(7)
Modified funds
from operations 31,840
$
25,816
$
51,090
$
44,886
$
Weighted average number of shares of common stock
324,197
317,959
323,424
317,175
outstanding (basic and diluted)
FFO per share (basic and diluted)
0.09
$
0.08
$
0.16
$
0.14
$
MFFO per share (basic and diluted)
0.10
$
0.08
$
0.16
$
0.14
$
Quarter Ended
June 30,
Six Months Ended
June 30,
(1)
Includes
amounts
related
to
the
properties
that
are
classified
as
assets
held
for
sale
and
for
which the
related results are classified as income (loss) from discontinued
operations in the accompanying condensed
consolidated
statements
of
operations.
(2)
This
amount
represents
our
share
of
the
FFO
or
MFFO
adjustments
allowable
under
the
NAREIT
or
IPA
definitions,
respectively,
multiplied
by
the
percentage
of
income
or
loss
recognized
under
the HLBV
method.
(3)
In
evaluating
investments
in
real
estate,
management
differentiates
the
costs
to
acquire
the
investment
from
the
operations
derived
from
the
investment.
By
adding
back
acquisition
fees
and
expense
relating
to
business
combinations,
management
believes
MFFO
provides
useful
supplemental
information
of
its
operating
performance
and
will
also
allow
comparability
between
real
estate
entities
regardless
of
their
level
of
acquisition
activities.
Acquisition
fees
and
expenses
include
payments
to
our
advisor
or
third
parties.
Acquisition
fees
and
expenses
relating
to
business
combinations
under
GAAP
are
considered
operating
expenses
and
as
expenses
included
in
the
determination
of
net
income
(loss)
and
income
(loss)
from
continuing
operations,
both
of
which
are
performance
measures
under
GAAP.
All
paid
and
accrued
acquisition
fees
and
expenses
will
have
negative
effects
on
returns
to
investors,
the
potential
for
future
distributions,
and
cash
flows
generated
by
us,
unless
earnings
from
operations
or
net
sales
proceeds
from
the
disposition of
properties
are
generated
to
cover
the
purchase
price
of
the
property.
(4)
Under
GAAP,
rental
receipts
are
allocated
to
periods
using
various
methodologies.
This
may
result
in
income
recognition
that
is
significantly
different
than
underlying
contract
terms. By
adjusting
for
these
items
(to
reflect
such
payments
from
a
GAAP
accrual
basis
to
a
cash
basis of
disclosing
the
rent
and
lease
payments),
MFFO
provides
useful
supplemental
information
on the
realized
economic
impact
of
lease
terms
and
debt
investments,
providing
insight
on
the
contractual
cash
flows
of
such
lease
terms
and
debt
investments,
and
aligns
results
with
management’s
analysis of
operating performance.
(5)
(Gain)
loss
from
early
extinguishment
of
debt
includes
swap
breakage
fees,
write-off of
unamortized
loan
costs
and
reclassification
of
loss
on
termination
of
cash
flow
hedges
from
other
comprehensive
income
(loss)
into
interest
expense.
(6)
In
June
2014,
we
recorded
a
loan
loss
provision
on
one
of
our
mortgages
and
other
notes
receivable
as
a
result
of
uncertainty
related
to
the
collectability
of
the
note
receivable. |
 Reconciliation of Adjusted EBITDA to Net
Income (Loss)
16
Source: CNL Lifestyle Properties, Inc. June 30, 2014, Form 10-Q
The
Company
believes
that
its
presentation
of
historical
non-GAAP
financial
measures
provides
useful
supplementary
information
to
and
facilitates
additional
analysis
by
investors.
These
historical
non-GAAP
financial
measures
are
in
addition
to,
not
a
substitute
for,
or
superior
to,
measures
of
financial
performance
prepared
in
accordance
with
U.S.
Generally
Accepted Accounting Principles.
Past performance is not indicative of future returns.
2014
2013
2014
2013
Net loss
(8,505)
$
(55,205)
$
(28,858)
$
(78,504)
$
(Income) loss from discontinued operations
(7,936)
(1,486)
(6,328)
155
Interest and other income
(89)
(71)
(91)
(397)
Interest expense and loan cost amortization
19,707
16,397
38,767
32,661
Equity in (earnings) loss of unconsolidated entities
(1)
526
(6,159)
(3,773)
(5,036)
Depreciation and amortization
31,098
28,837
63,032
57,595
Impairment provision
-
42,451
-
42,451
Loss from extinguishment of debt
196
-
196
-
Loan loss provision
2,520
-
2,520
-
Recovery on lease terminations
(741)
-
(741)
-
Straight-line adjustments for
leases and notes receivables (2)
(2,737)
(1,092)
(6,164)
(1,578)
Cash distributions from unconsolidated entities
(1)
3,455
8,787
6,575
20,113
Adjusted EBITDA
37,494
$
32,459
$
65,135
$
67,460
$
Quarter Ended
June 30,
Six Months Ended
June 30,
(1) Investments in our unconsolidated joint ventures are accounted for under the
HLBV method of accounting. Under this method, we recognize income or loss based on the change in liquidating
proceeds
we
would
receive
from
a
hypothetical
liquidation
of
our
investments
based
on
depreciated
book
value.
We
adjust
EBITDA
for
equity
in
earnings
(loss)
of
our
unconsolidated
entities
because
we
believe
this
is
not
reflective
of
the
joint
ventures’
operating
performance
or
cash
flows
available
for
distributions
to
us.
We
believe
cash
distributions
from
our
unconsolidated
entities,
exclusive
of
any
financing
transactions,
are
reflective
of
their
operating
performance
and
its
impact
to
us
and
have
been
added
back
to
adjusted
EBITDA
above.
(2) We believe that adjusting for straight-line adjustments for leased
properties and mortgages and other notes receivable is appropriate because they are non-cash adjustments and reflect the actual cash
receipts received by us from our tenants and borrowers.
|