Attached files
| file | filename |
|---|---|
| 8-K - CURRENT REPORT - ANGIODYNAMICS INC | an31248225-8k.htm |

Joseph M. DeVivo, President and CEO August 2014 AngioDynamics, the AngioDynamics logo and other trademarks displayed in this presentation are trademarks owned and used by AngioDynamics, Inc. © Copyright 2014 AngioDynamics, Inc. All rights reserved. *

Forward-Looking Statements Notice Regarding Forward Looking Statements This presentation contains forward-looking statements within the meaning of the Private Securities Litigation Reform Act of 1995. All statements regarding AngioDynamics’ expected future financial position, results of operations, cash flows, business strategy, budgets, projected costs, capital expenditures, products, competitive positions, growth opportunities, plans and objectives of management for future operations, as well as statements that include the words such as “expects,” “reaffirms” “intends,” “anticipates,” “plans,” “believes,” “seeks,” “estimates,” “optimistic,” or variations of such words and similar expressions, are forward-looking statements. These forward looking statements are not guarantees of future performance and are subject to risks and uncertainties. Investors are cautioned that actual events or results may differ from AngioDynamics’ expectations. Factors that may affect the actual results achieved by AngioDynamics include, without limitation, the ability of AngioDynamics to develop its existing and new products, technological advances and patents attained by competitors, future actions by the FDA or other regulatory agencies, domestic and foreign health care reforms and government regulations, results of pending or future clinical trials, overall economic conditions, the results of on-going litigation, the effects of economic, credit and capital market conditions, general market conditions, market acceptance, foreign currency exchange rate fluctuations, the effects on pricing from group purchasing organizations and competition, the ability of AngioDynamics to integrate purchased businesses, as well as the risk factors listed from time to time in AngioDynamics’ SEC filings, including but not limited to its Annual Report on Form 10-K for the year ended May 31, 2013 and the current report on Form 8-K, filed with the SEC on July 23, 2014. AngioDynamics does not assume any obligation to publicly update or revise any forward-looking statements for any reason. In the United States, NanoKnife has been cleared by the FDA for use in the surgical ablation of soft tissue. NanoKnife has not been cleared for the treatment or therapy of a specific disease or condition. This document may discuss the use of NanoKnife for specific clinical indications for which it is not cleared in the United States at this time. Notice Regarding Non-GAAP Financial Measures Management uses non-GAAP measures to establish operational goals, and believes that non-GAAP measures may assist investors in analyzing the underlying trends in AngioDynamics’ business over time. Investors should consider these non-GAAP measures in addition to, not as a substitute for or as superior to, financial reporting measures prepared in accordance with GAAP. In this presentation, AngioDynamics has reported non-GAAP sales growth, non-GAAP gross margin, non-GAAP operating income, adjusted EBITDA (income before interest, taxes, depreciation and amortization), non-GAAP net income and non-GAAP earnings per share. Management uses these measures in its internal analysis and review of operational performance. Management believes that these measures provide investors with useful information in comparing AngioDynamics’ performance over different periods. By using these non-GAAP measures, management believes that investors get a better picture of the performance of AngioDynamics’ underlying business. Management encourages investors to review AngioDynamics’ financial results prepared in accordance with GAAP to understand AngioDynamics’ performance taking into account all relevant factors, including those that may only occur from time to time but have a material impact on AngioDynamics’ financial results. Please see the tables that follow for a reconciliation of non-GAAP measures to measures prepared in accordance with GAAP. *

Profile of AngioDynamics Corporate History Founded 1988 | IPO May 2004—ANGO (NASDAQ) Acquired Microsulis (2013) | Vortex Medical (2012) Navilyst (2012) | Oncobionic (2008) | RITA Medical (2007) Worldwide Presence Albany NY – HQ | 1,300 Employees | 7 Operating Locations Recognized globally as a leading provider of innovative, image guided, minimally invasive solutions. *

Performance Update Novation BioFlo PICC & BioFlo Port Contract CFGs for VA & PV products made in Queensbury, N.Y. Celerity Agreement & first U.S. clearance BioFlo DuraMax chronic hemodialysis catheter U.S. clearance AngioVac expanded indication Howard Donnelly elected Chairman Opened Distribution Center of Excellence & began construction of New York Center of Excellence Received Premier Inc.’s first Supplier Horizon Award in Nursing Category ERP implementation completed AngioVac CE Mark approval BioFlo clinical data John Soto appointed Chief Commercial Officer New CMS reimbursement for in-hospital thermal vein ablations Operational excellence initiative BioFlo Ports FDA clearance Clinical Devices, B.V. acquisition CROES & PROOF patient enrollments LIDN agreement NICE guidance on varicose veins Q4 FY14 Results FY14 Highlights EPS Sales * FY14 Revenue $354.5M 4% Rev. Growth • $0.58 Adjusted EPS

Financial Snapshot Peripheral Vascular 55% Vascular Access 30% Oncology/ Surgery 15% US 80% Int’l 20% As of Q4 FY14 * $365M FY15 Revenue Guidance Midpoint FISCAL 2004 49M NET SALES FISCAL 2014 354.5M NET SALES

Innovative Technology Develop innovative Technology that improves patient outcomes while reducing overall healthcare costs Operational Excellence Enhance our profitability by driving operation excellence across the entire organization Above Market Growth Focus our investments in product categories and geographic markets that offer sustainable, profitable growth Strategic Imperatives *

Three Global Businesses Peripheral Vascular PV Fluid Management Thrombolytics Laser Vein Ablation Angiographic Catheters/Drainage Oncology/ Surgery O/S Thermal Ablation Non-Thermal Ablation Resection Vascular Access VA PICCs Ports Dialysis *

Oncology/ Surgery O/S Thermal Ablation Non-Thermal Ablation Resection Vascular Access VA Peripheral Vascular PV Fluid Management Thrombolytics Laser Vein Ablation Angiographic Catheters/Drainage PICCs Ports Dialysis *
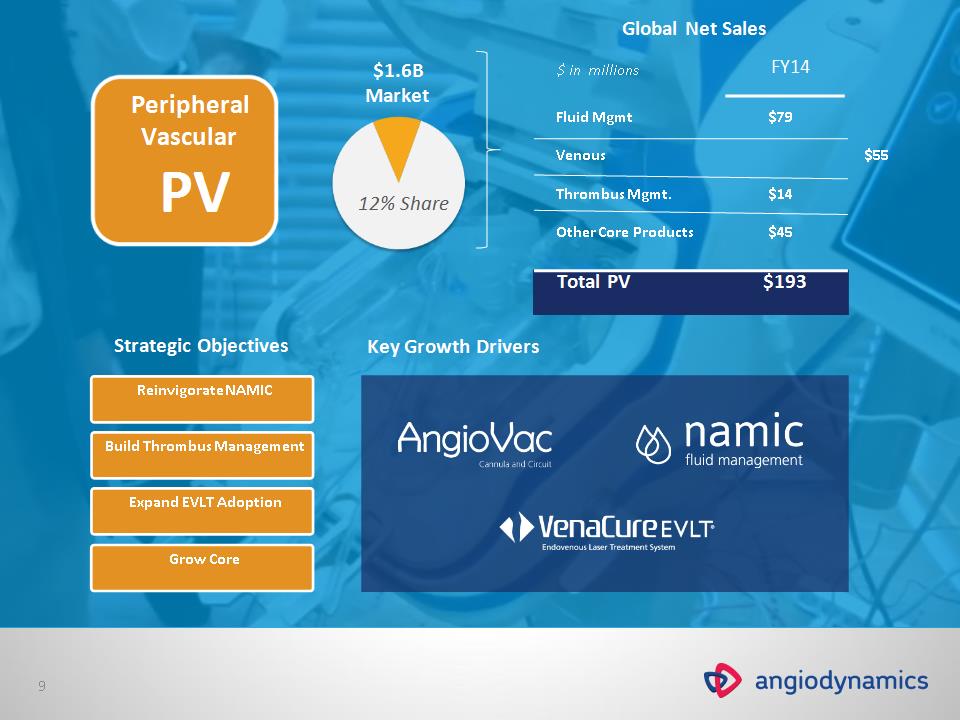
Peripheral Vascular PV Reinvigorate NAMIC Build Thrombus Management Grow Core Strategic Objectives Key Growth Drivers $1.6B Market Global Net Sales $ in millions FY14 Fluid Mgmt $79 Venous $55 Thrombus Mgmt. $14 Other Core Products $45 Total PV $193 Expand EVLT Adoption 12% Share *

Additional: Annual Incidence Venous Thromboembolism (VTE) Incidence ~1 Million VTE Events per Year in US ~300,000 VTE Deaths per Year in US - #3 cause Heit JA, et al. Blood. 2005;106:267A. Murphy SL, et al. Deaths: Preliminary Data for 2010. National Vital Statistics Reports; 2012 Catheter/Lead RA 200,000 RA Mass 47,000 IVCF Thrombosis 14,000 TV Endocarditis 2,500 Mechanical / PharmacoMechanical Oral Anticoagulation Systemic and Catheter Directed Thrombolysis Current Options Large Unmet Opportunity Surgical Embolectomy *
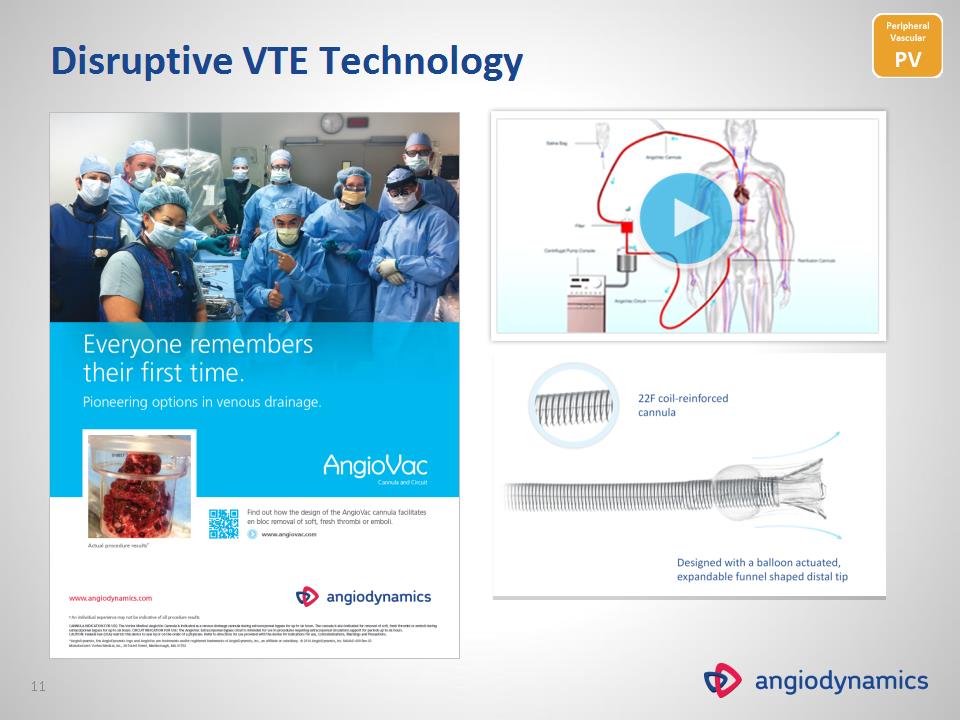
Disruptive VTE Technology *

FDA cleared & CE Mark approved Attractive pricing & higher margins Scalable platform for next generation devices Disruptive VTE Technology ~900+ CASES TO DATE Newly expanded U.S. indication *

U.S. Auto Injectors: A Significant Opportunity ANGIO Mkt Share Expected CAGR >50% Contracting 20-25% Low Single Digit Growth 0% Double Digit Growth Automated (Interv. Cardiology) $40M Manual (Interv. Cardiology) $75M Manual (Periph. Vascular) $55M Source: Millennium Research Group reports; company analysis Rapidly converting from manual to automated systems Fluid Management Market Summary ROW $200M 70% Manual 30% Auto US $170M 80% Manual 20% Auto EUROPE $160M 50% Manual 50% Auto ~500M WW MARKET ~10M PROCEDURES PER YEAR $170M *

NAMIC Duet—Next Generation API NAMIC Duet is expected to build on AngioDynamics' leading position in fluid management by creating economic and clinical value for facilities through its ability to dilute and reduce contrast to the patient. *

Leading Laser Vein Treatment 30M People in U.S. w/ varicose veins Large Underpenetrated Market Opportunity <2% Receive treatment 145,000+ VenaCure EVLT procedures in FY2013 ANGO has 28% share of Venous Ablation market and 65% share of the Laser Ablation market Installed base of 4,000 units WW, including 700 new 1470 lasers since launch in June 2011 ~240M MARKET 3-5% CAGR *

Leading Laser Vein Treatment NICE ruling establishes thermal ablation, including laser, as the standard of care for the treatment of varicose veins in the United Kingdom New CMS APC includes in-hospital endovenous RF and laser varicose vein ablations, increasing payment for laser by 9% while creating parity for thermal procedures *

Peripheral Vascular PV Fluid Management Thrombolytics Laser Vein Ablation Angiographic Catheters/Drainage Oncology/ Surgery O/S Thermal Ablation Non-Thermal Ablation Resection Vascular Access VA PICCs Ports Dialysis *

Drive NanoKnife Adoption Increase Thermal Ablation Share Strategic Objectives Global Net Sales Invest in Clinical Development $225M Market 22% Share $ in millions FY14 Thermal Ablation $30 NanoKnife $14 Resection/Other $5 Total O/S $49 Oncology/ Surgery O/S Key Growth Drivers *

THERMAL NON-THERMAL “The US Nonvascular Interventional Radiology market with the fastest growth and greatest potential is the ablation device market” – MRG Nov. 2012 Expanding Leadership in Tissue Ablation AngioDynamics offers a full complement of tissue ablation products that provide clinicians maximum choice in treating patients *
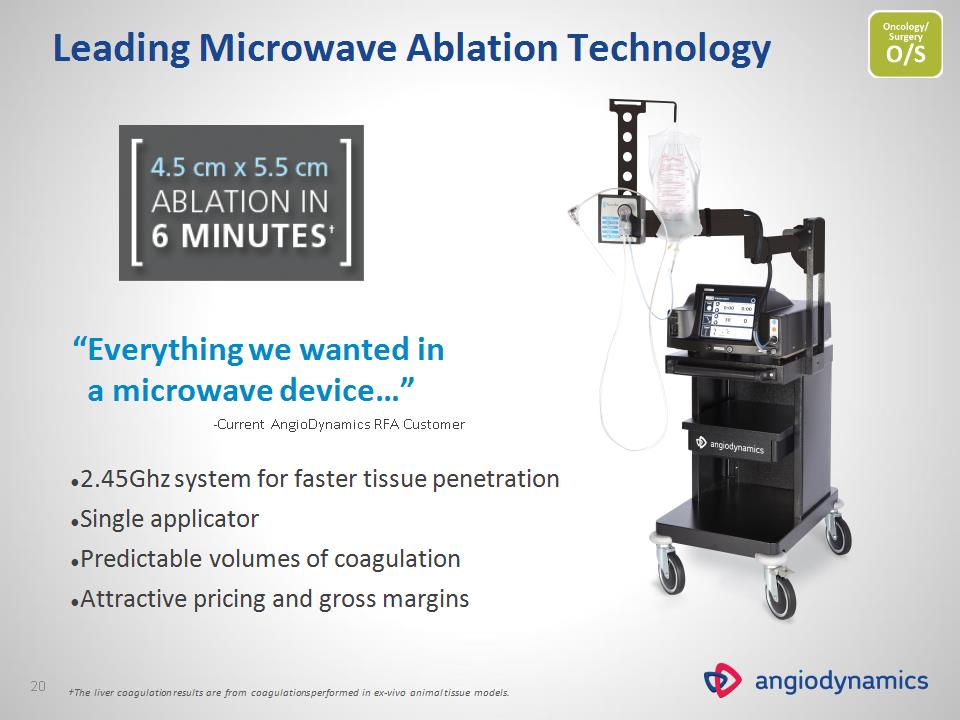
Leading Microwave Ablation Technology “Everything we wanted in a microwave device…” -Current AngioDynamics RFA Customer 2.45Ghz system for faster tissue penetration Single applicator Predictable volumes of coagulation Attractive pricing and gross margins †The liver coagulation results are from coagulations performed in ex-vivo animal tissue models. *

Building NanoKnife Clinical Data 16 PATIENTS TO BE ENROLLED 1 STUDY SITE WORLDWIDE AngioDynamics Partners with Clinical Research Office of the Endourological Society (CROES) NanoKnife Safety and Efficacy Study A Single-Arm Study Focused on the Ablation of Prostate Cancer CROES STUDY FDA Grants Prostate IDE Approval for NanoKnife System Clinical Study to Evaluate feasibility and short-term safety and effectiveness of the NanoKnife System in the ablation of focal prostate cancer IDE PROSTATE 6 PATIENTS TO BE ENROLLED 2 STUDY SITE WORLDWIDE *

Vascular Access VA PICCs Ports Dialysis Peripheral Vascular PV Fluid Management Thrombolytics Laser Vein Ablation Angiographic Catheters/Drainage Oncology/ Surgery O/S Thermal Ablation Non-Thermal Ablation Resection *

Penetrate & Convert Penetration of IDNs/GPOs Strategic Objectives Key Growth Drivers $1.0B Market Global Net Sales $ in millions FY14 PICCs $51 Ports $32 Dialysis $19 Other $4 Total VA $106 Grow Int’l from 10% to 25% of revenue Vascular Access VA Tip Location Clinical Data 11% Share *

Estimated Cost Per Incident4 $11,957 PICC-Related UEDVT Incidence Rates2, 3 2.7M PICCs placed by nurses & Physicians in 20121 2Evans SR, Sharp JH, Lorraine LH, et al. CHEST 2010 ; 138; 803-810 1US MARKETS FOR VASCULAR ACCESS DEVICES 2012 - Millennium Research Group U.S. Cost of Hospital-Acquired DVT $1B – $2.5B 4Lissovoy Gd, et al. Cost for Inpatient Care of Venous Thrombosis. Arch Intern Med. 2000;160:3160-3165. Symptomatic 3-7.8% 3Cowl CT, et al. Complications and cost associated with parenteral nutrition delivered to hospitalized patients through either subclavian or peripherally inserted central catheters Clinical Nutrition (2000) 19 (4): 237-243 UEDVT Incidents 81,000-211,000 Large Unmet Opportunity *

Hospital BioFlo PICC Placements DVTs DVT RATE 1 167 1 0.6% 2 533 6 1.1% 3 1251 7 0.6% BioFlo Technology *Data based on results presented at the Association for Vascular Access 27th Annual Scientific Meeting. Prospective Customer Evaluation of BioFlo* *

Celerity Tip Location Strategy Tip location, coupled with our innovative BioFlo technology, will improve our competitive position in the PICC market. Ease of use Use with existing ultrasound Three lead EKG-based platform Predictable and reliable confirmation 50% less cost vs. competitors Clinical efficacy Cost effective Fall 2013 – Canadian Launch March 6, 2014 – Acquired regulatory control over Celerity platform and rights to next generation technology Mid-summer 2014 – U.S. clearance *

Expanding BioFlo Platform – Ports Levitan, N et al. Rates of Initial and Recurrent Thromboembolic Disease Among Patients with Malignancy Versus Those Without Malignancy. Medicine: 1999: 78; 285-291. *

Expanding BioFlo Platform – Dialysis Thrombotic occlusions can occur within 24 hours and are prevalent in up to 40 percent of chronic dialysis patients.1 [ ] 90% Less Thrombus Accumulation In vitro blood loop model test compared to non-coated conventional catheters based on platelet count.2 [ ] 83% Less Thrombus Accumulation In vitro blood loop model test compared to a heparin coated dialysis catheter.3 1 Whitman ED: Complications associated with the use of central venous access devices. Curr Probl Surg 33: 319-378, 1996 2 The reduction in thrombus accumulation (based on platelet count) is supported by acute in-vitro testing. Pre-clinical in-vitro evaluations do not necessarily predict clinical performance with respect to thrombus formation. 3 Based on benchtop testing performed up to two hours using bovine blood which may not be indicative of clinical results. Data on file *
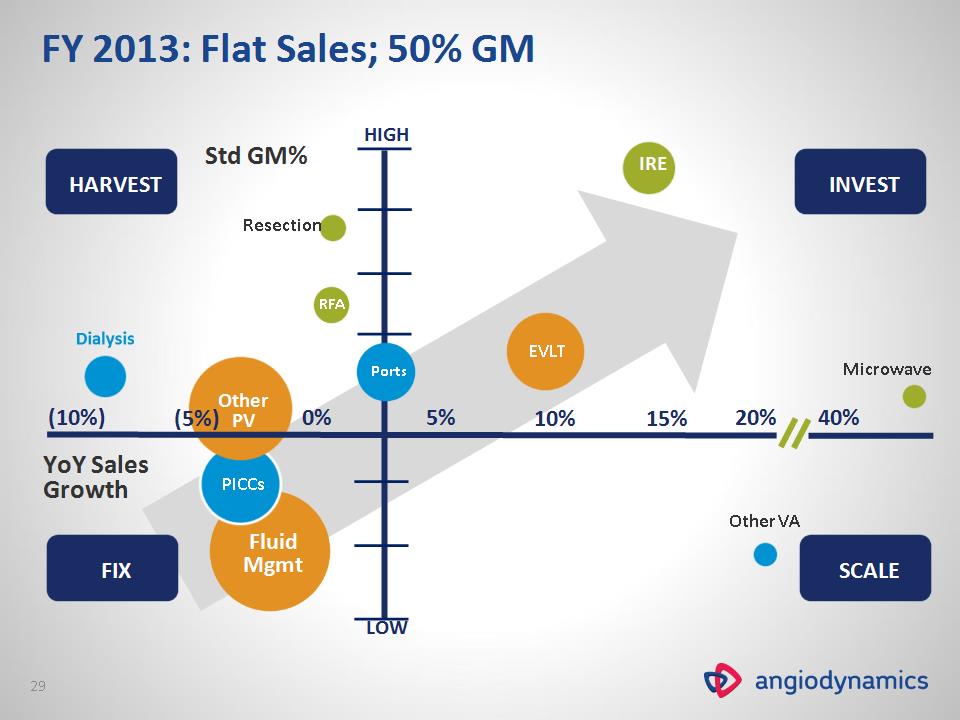
Fluid Mgmt PICCs Other PV YoY Sales Growth EVLT Ports 0% 5% 10% 15% 20% 40% HARVEST FIX INVEST SCALE Microwave IRE RFA Resection Other VA Std GM% (10%) (5%) HIGH LOW FY 2013: Flat Sales; 50% GM *
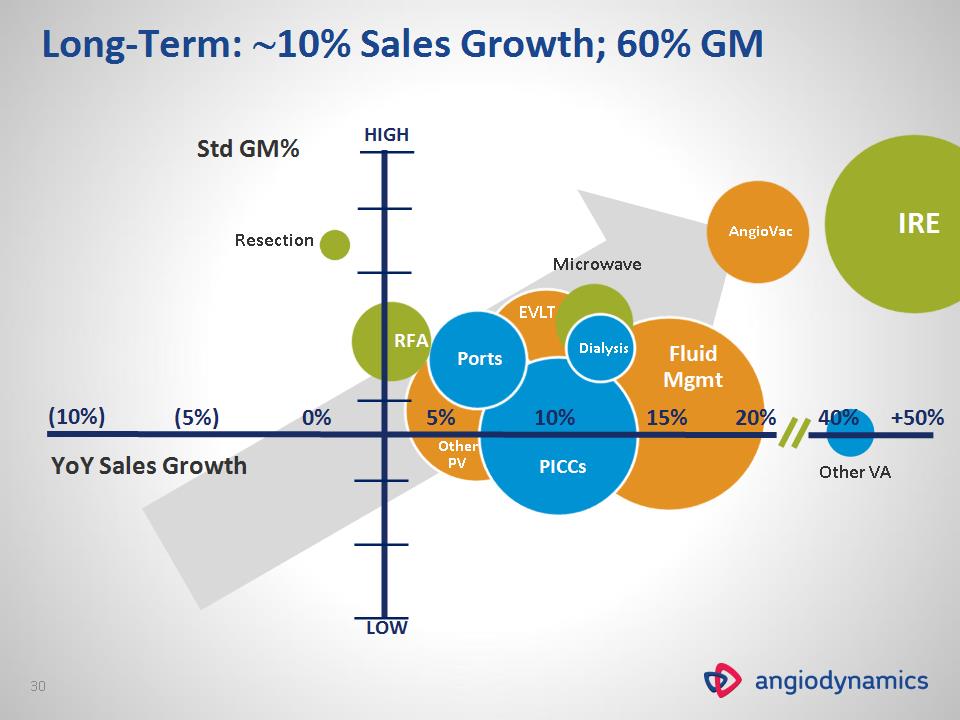
Ports 0% 5% 10% 15% 20% +50% YoY Sales Growth 40% EVLT AngioVac Resection Other VA Other PV Fluid Mgmt Dialysis Microwave Std GM% PICCs RFA (10%) (5%) IRE Long-Term: 10% Sales Growth; 60% GM HIGH LOW *

Enterprise resource planning implementation Consolidation of N.Y. distribution center Consolidation of N.Y. manufacturing plants Supply Chain Optimization Product rationalization Lean Initiatives Operational Excellence $15-18M TO BE SAVED OVER THREE YEARS *
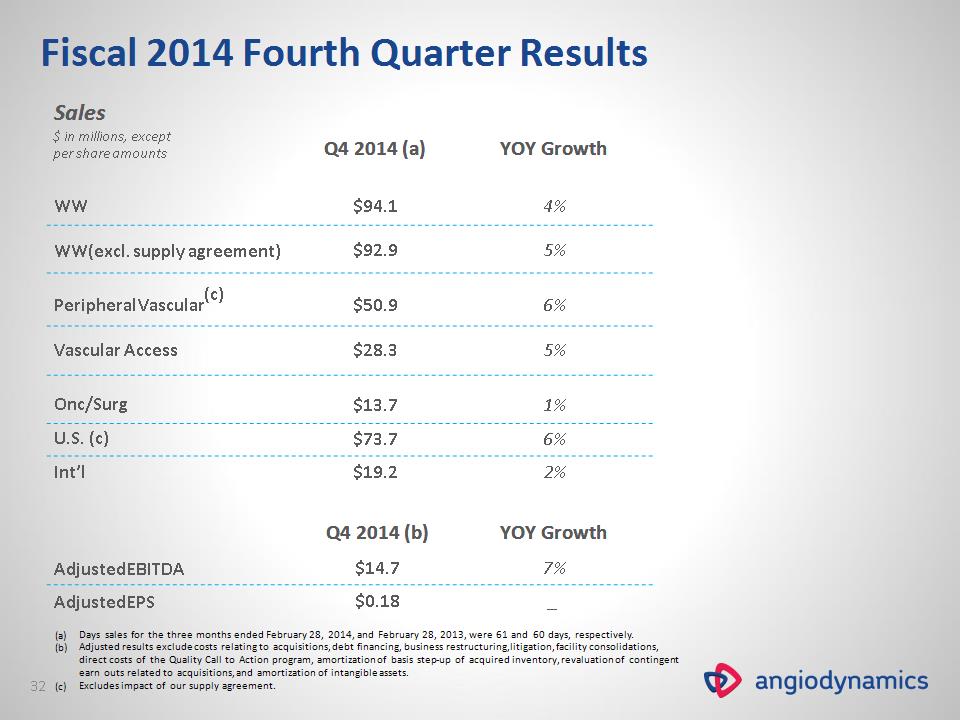
Q4 2014 (b) YOY Growth Adjusted EBITDA $14.7 7% Adjusted EPS $0.18 _ Fiscal 2014 Fourth Quarter Results Sales $ in millions, except per share amounts Q4 2014 (a) YOY Growth WW WW(excl. supply agreement) $94.1 $92.9 4% 5% Peripheral Vascular(c) Vascular Access $50.9 $28.3 6% 5% Onc/Surg $13.7 1% U.S. (c) $73.7 6% Int’l $19.2 2% Days sales for the three months ended February 28, 2014, and February 28, 2013, were 61 and 60 days, respectively. Adjusted results exclude costs relating to acquisitions, debt financing, business restructuring, litigation, facility consolidations, direct costs of the Quality Call to Action program, amortization of basis step-up of acquired inventory, revaluation of contingent earn outs related to acquisitions, and amortization of intangible assets. Excludes impact of our supply agreement. *

Fiscal 2015 Guidance $ in millions, except per share amounts Adjusted Non-GAAP Q1 Adjusted Non-GAAP Full Year Sales $83 — $86 $362 — $368 EPS (a) $0.08 — $0.12 $0.64 — $0.70 Adjusted results exclude costs relating to acquisitions, debt financing, business restructuring, litigation, facility consolidations, direct costs of the Quality Call to Action program, amortization of basis step-up of acquired inventory, revaluation of contingent earn outs related to acquisitions, and amortization of intangible assets. * Quarterly Sales Growth Trend Q4 FY13 Q1 FY14 Q2 FY14 Q3 FY14 Q4 FY14 Q1 FY15 (Guidance) %

Int’l growth & upside High growth products Optimized capital structure Optimized R&D team Investment Summary Strong talent pool Quality management Operational excellence Accelerated long-term growth & profitability *

AngioDynamics, the AngioDynamics logo and other trademarks displayed in this presentation are trademarks owned and used by AngioDynamics, Inc. © Copyright 2012 AngioDynamics, Inc. All rights reserved. *

$ in millions May 31, 2014 May 31, 2013 Cash and investments $17.9 $24.0 Net working capital $80.0 $78.1 Total assets $800.2 $791.6 Total debt $142.7 $142.5 Total stockholders’ equity $537.9 $526.8 Balance Sheet and Cash Flow $ in millions, except per share amounts 12 months ended May 31, 2014 12 months ended May 31, 2013 Cash flow from operations $25.3 $26.9 CFFO/share $0.72 $0.77 Free cash flow $13.5 $14.8

$ in millions, except per share amounts 12 months ended May 31, 2014 12 months ended May 31, 2013 Sales $354.5 $342.0 Gross Margin 50.8% 50.8% Operating Expenses $140.6 $130.2 Operating Income $39.4 $43.5 Operating Margin 11.1% 12.7% Net Income $20.6 $22.7 EPS $0.58 $0.64 EBITDA $52.2 $57.0 Adjusted results excludes amortization, acquisition & restructurings, QCTA, Inventory step-up, contingent earn out revaluation, debt financing costs, litigation and facility consolidation. Adjusted Income Statement(a)