Attached files
| file | filename |
|---|---|
| 8-K - 8-K - XERIUM TECHNOLOGIES INC | a2014jefferiesindustrialco.htm |

Innovative Performance That Delivers Results Exhibit 99.1

2 Various statements herein and remarks that we may make today about Xerium's future expectations, plans and prospects are forward-looking statements which reflect our current views with respect to future events and financial performance. Statements which include the words “expect,” “intend,” “plan,” “believe,” “project,” anticipate”, and similar statements of a future or forward-looking nature identify forward-looking statements for the purposes of the federal securities laws or otherwise. Our actual results may differ materially from these forward- looking statements and estimates as a result of various important factors, including those discussed in our earnings press release dated August 5, 2014, which is posted in the Investor Relations section of our website at www.xerium.com, and other factors discussed in our filings with the SEC, including our Form 10-K for the year ended December 31, 2013, all of which are on file with the SEC and are also available in the investor relations section of our website at www.xerium.com under the heading "SEC Filings." In addition, market data about the production volumes of our end-users is no guarantee of future production levels. Last, any forward-looking statements which we make in this presentation or in remarks today, represent our views only as of today. We disclaim any duty to update any such forward looking statements. We also plan to discuss supplementary non-GAAP financial measures, such as Adjusted EBITDA, that we use internally to assess financial performance, and therefore, believe will assist you in better understanding our company. Reconciliations of these measures to the comparable GAAP numbers are available in our most recent earnings press release, in this presentation and in an additional reconciliation schedule, all of which are posted in the Investor Relations section of our website at www.xerium.com. Forward Looking Statements and Non-GAAP Reconciliations

3 Harold Bevis President, CEO and Director Mr. Bevis has been the President and CEO since August 2012. He has 29 years of experience leading manufacturing companies and has been a CEO for 14 years. Key Management Cliff Pietrafitta Chief Financial Officer Mr. Pietrafitta has served as Chief Financial Officer since March 2011. Mr. Pietrafitta served as the Chief Financial Officer of CSS Industries, a consumer products company, for 11 years. For the previous 10 years he served in various capacities at CSS Industries, including Vice President— Finance and Treasurer. David Pretty President – Xerium North America & Europe Mr. Pretty is the President of the largest divisions of Xerium and has responsibility for North America and Europe. He has been with the company for over 25 years and rose from a field salesman to the top of the organization. He is a respected and globally known leader in the industries served by Xerium.

4 Xerium is a Leading Specialty Manufacturer of Industrial Consumables Key Financials $550 Million Sales $116 - $120 Million Adj. EBITDA Main Products Machine Clothing Roll Covers Mechanical Services Main Markets Pulp, Paper & Tissue Building Products Nonwovens Key Stats 27 Plants 3200 Employees 370 Patents Goals #1 or #2 in Every Market Cost Leadership

5 Value-Added Supplier Continuously better solutions to help them make their products better, cheaper, faster AND be responsible with regards to its impact on the environment What Xerium Customers Want Full Line Supplier Contemporary Supplier Consistent Quality No product gaps, no geographic gaps, no capacity or service restraints Transparent and electronic business practices, dependable and predictable supply chain Every piece, every service provided needs to be the same top quality, every time

6 Help Our Customers Win Increase our delivered value Multifunctional effort by R&D, manufacturing plants & sales teams Xerium 20/20 Business Strategy Be a Strong #1 or #2 Choice for Our Customers Transform Organizational Structure to Win More Often Have a ~$400 million gap towards accomplishing this Cost leadership, everyday, everywhere

7 Underway Now Commercial Success 27 Programs 17 new product programs 10 growth capacity programs Cost Leadership 9 programs Plant closures Operational Excellence programs at each plant Centralized procurement of services and materials Lean SG&A program Xerium’s Business Strategy is Being Implemented via 36 Programs to Achieve Commercial Success and Cost Leadership

8 Solid Financial Results Global Market Demand, Sales, Orders, Gross Margin, SG&A, and Adjusted EBITDA Continue to Improve Market Demand Overall global markets are strong and stable ~$4 billion addressable market Orders 3.3% CAGR over the last 2 ½ years. Sales growth programs are working Gross Margins 5.5% CAGR over the last 2 ½ years. Cost-out projects and operational excellence programs are working SG&A (5.2)% CAGR over the last 2 ½ years. Lean SG&A programs are working. Capital Spending $68 million of capital spending to enable future period sales growth. Will begin contributing to financial results in Q4 2014 and ramp up into 2017. 19.4% CAGR over the last 2 ½ years. Top quartile performance. Adjusted EBITDA
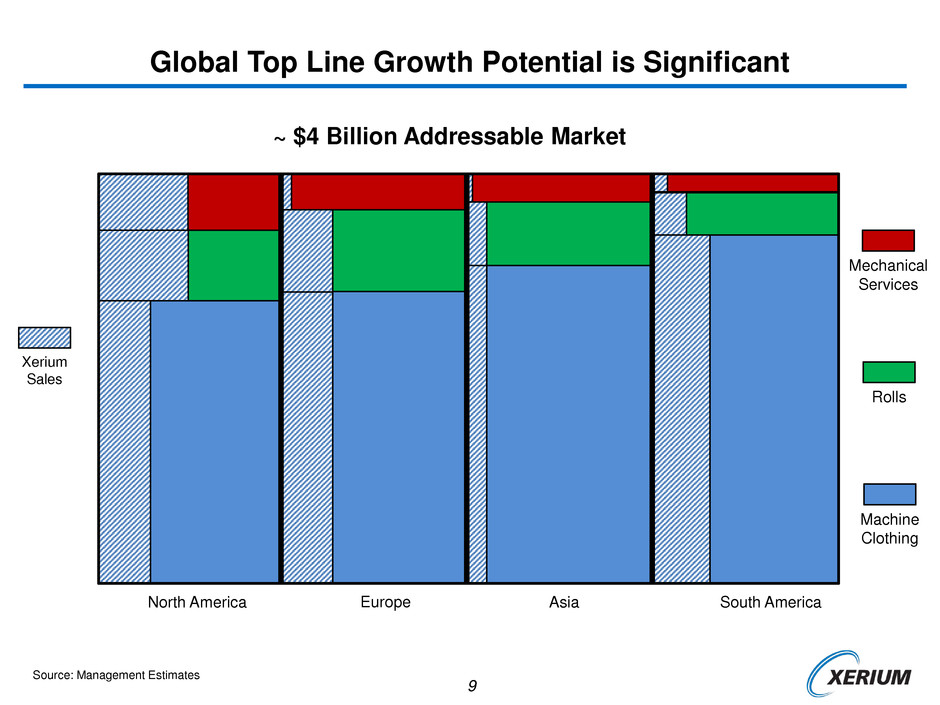
9 Global Top Line Growth Potential is Significant ~ $4 Billion Addressable Market North America Europe Asia South America Source: Management Estimates Xerium Sales Machine Clothing Rolls Mechanical Services

10 2.9% 2.6% 1.1% 0.5% 0.6% 1.7% 2.2% 0% 1% 2% 3% 4% A n n u a l D emand G ro w th R ate % Global Paper and Board Market is Large and Growing Global demand for pulp and paperboard showed a 0.6% gain in 2013, with stronger growth in packaging and tissue offset by continued declines in graphic paper demand RISI predicts world paper and board demand growth to continue to increase driven primarily by containerboard and tissue Containerboard is forecast to grow at an average of 3.4 million tons per year through 2018 driven by economic development in global markets and increasing disposable income Sources: RISI, Numera Analytics, Bloomberg, Wall Street research, US Census Bureau, Freedonia Group 1%-2% Annual Growth World Market for Pulp, Paper and Board Xerium provides machine clothing, roll covers and mechanical services that are used in the production of these products

11 Fiber Cement Market is Growing 2.3 2.0 1.7 1.7 1.7 1.9 2.1 2.2 2.4 2.6 2.9 0.0 0.5 1.0 1.5 2.0 2.5 3.0 2007 2008 2009 2010 2011 2012 2013 2014 2015 2016 2017 U .S . D emand M ill io n T o n s 8.5% CAGR Fiber cement products continue to gain share as a building material choice (and vinyl siding continues to lose share) due to its performance characteristics and customer desirability – life, weather resistance, fire resistance, durability Global fiber cement market is growing. Rates and timing will be correlated to home construction and remodeling Fiber cement products have multiple uses in the construction market (data from 2012 market break out): Residential improvement/repair 49% Residential new construction 24.7% Non-residential new construction 12.6% Non-residential improvement/repair 13.7% U.S. Fiber Cement Market Sources: Freedonia Group, Plastics News Xerium makes the main production belts and roll covers that are used in the production of these building materials

12 Nonwoven Market is Growing 5.7 5.8 5.9 6.1 6.4 7.0 7.4 7.8 8.2 8.6 9.1 0 1 2 3 4 5 6 7 8 9 10 2007 2008 2009 2010 2011 2012 2013 2014 2015 2016 2017 W orl d w id e D emand M ill io n M et ri c T o n s 5.4% CAGR World demand for Nonwoven products is expected to grow at 5.4% CAGR through 2017 Nonwoven products range in application and use including: personal care, hygiene, medical, wipes, filters, insulation and geotextiles Demand examples: Nonwoven fabrics used in infant diapers and baby wipes, grows as the number of births and standards of living in a particular area rise, while use of nonwovens in medical garments, textiles and adult incontinence products generally climbs along with the age of the population Worldwide Nonwoven Market Sources: Freedonia Group Xerium makes the main production belts and roll covers that are used in the production of nonwoven materials

13 Source: Numera Analytics (data is years 2009 to 2013) 0.2% 2.2% 2.2% 2.1% 1.2% -2.6% -3.3% 0.7% 2.6% -4% -3% -2% -1% 0% 1% 2% 3% North America (US & Canada) All Geographies Have Grown Over Last 5 Years (2009 – 2013) - CAGR Every Geography Has Grown Over The Last 5 Years With Asia Being Both the Biggest Market and the Highest Growth Rate 2.2% 3.8% 3.6% 4.1% 2.0% -0.8% -7.4% 4.0% 3.6% -10% -8% -6% -4% -2% 0% 2% 4% 6% South America 3.5% 4.5% 4.7% 4.2% 4.0% 2.8% -2.5% 6.1% 10.3% -4% -2% 0% 2% 4% 6% 8% 10% 12% Asia 1.1% 3.7% 3.2% 4.2% 1.5% -0.6% -3.3% 2.7% 2.9% -4% -3% -2% -1% 0% 1% 2% 3% 4% 5% Europe

14 1.2% 2.9% 0.4% 0.3% -4.8% 2.9% 0.8% -6% -5% -4% -3% -2% -1% 0% 1% 2% 3% 4% Y T D A p ri l 2 0 1 4 v s 2 0 1 3 World Market Segments World Paper/Board/Pulp Market Grew 1.7% in Q1 2014 (data lags) 2014 Update -- Global Paper, Board & Pulp Market has Grown 1.2% April YTD but with Monthly and Regional Volatility Sources: Numera Analytics 26 28 30 32 J F M A M J J A S O N D M ill ion Me tr ic T o nne s World Volume 2013 2014 YTD + 1.2%
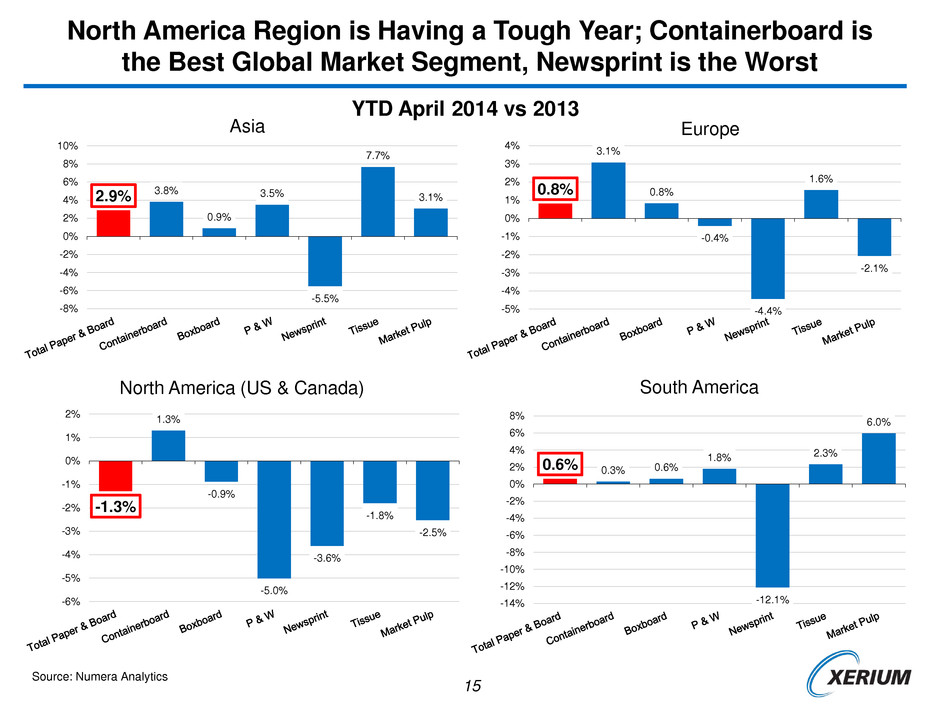
15 Europe 0.6% 0.3% 0.6% 1.8% -12.1% 2.3% 6.0% -14% -12% -10% -8% -6% -4% -2% 0% 2% 4% 6% 8% South America 0.8% 3.1% 0.8% -0.4% -4.4% 1.6% -2.1% -5% -4% -3% -2% -1% 0% 1% 2% 3% 4% Source: Numera Analytics YTD April 2014 vs 2013 -1.3% 1.3% -0.9% -5.0% -3.6% -1.8% -2.5% -6% -5% -4% -3% -2% -1% 0% 1% 2% North America (US & Canada) 2.9% 3.8% 0.9% 3.5% -5.5% 7.7% 3.1% -8% -6% -4% -2% 0% 2% 4% 6% 8% 10% Asia North America Region is Having a Tough Year; Containerboard is the Best Global Market Segment, Newsprint is the Worst
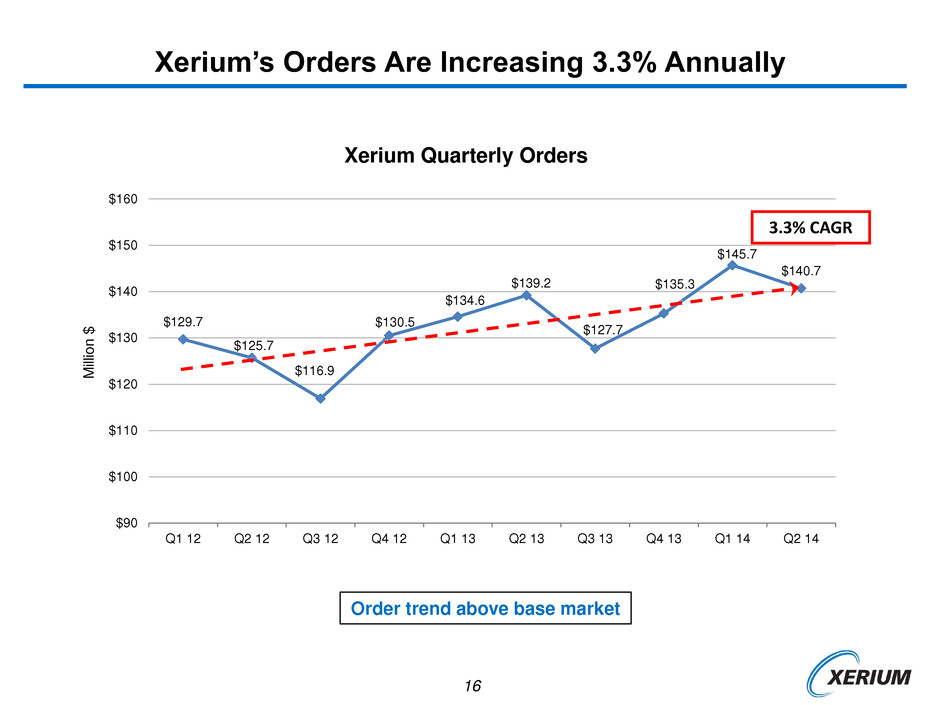
16 $129.7 $125.7 $116.9 $130.5 $134.6 $139.2 $127.7 $135.3 $145.7 $140.7 $90 $100 $110 $120 $130 $140 $150 $160 Q1 12 Q2 12 Q3 12 Q4 12 Q1 13 Q2 13 Q3 13 Q4 13 Q1 14 Q2 14 M ill io n $ Xerium Quarterly Orders Xerium’s Orders Are Increasing 3.3% Annually 3.3% CAGR Order trend above base market

17 Historical Sales Trend @ Constant Currency Xerium’s Sales Are Increasing ~3% Annually $130.1 $134.4 $133.4 $131.5 $137.2 $137.7 $135.9 $133.2 $134.5 $139.7 $110 $115 $120 $125 $130 $135 $140 $145 $150 Q1 12 Q2 12 Q3 12 Q4 12 Q1 13 Q2 13 Q3 13 Q4 13 Q1 14 Q2 14 M ill io n $ Xerium's Sales @ Constant Currency Rates 2.9% CAGR Sales growth inline with order trend and above base market

18 Xerium’s Gross Margin Rate Is Increasing ~5% Annually Improvement result of cost out initiatives and operational excellence programs 35% 37% 37% 35% 39% 38% 40% 37% 39% 40% 25% 27% 29% 31% 33% 35% 37% 39% 41% 43% 45% Q1 12 Q2 12 Q3 12 Q4 12 Q1 13 Q2 13 Q3 13 Q4 13 Q1 14 Q2 14 % o f S a les Xerium Quarterly Gross Margin Rate 5.5% CAGR

19 Xerium SG&A is Declining ~5% Annually $40 $36 $37 $38 $36 $36 $35 $35 $35 $35 $32 $34 $36 $38 $40 $42 $44 Q1 12 Q2 12 Q3 12 Q4 12 Q1 13 Q2 13 Q3 13 Q4 13 Q1 14 Q2 14 M ill io n $ Xerium Quarterly SG&A Expenses - 5.2% CAGR SG&A Expenses continue to trend downward as a result of our cost out initiatives

20 Xerium Quarterly Adjusted EBITDA is Increasing ~19% Annually $18.8 $25.4 $24.4 $20.6 $29.1 $26.9 $27.2 $24.1 $25.7 $29.4 $14 $16 $18 $20 $22 $24 $26 $28 $30 $32 $34 Q1 12 Q2 12 Q3 12 Q4 12 Q1 13 Q2 13 Q3 13 Q4 13 Q1 14 Q2 14 Xerium Quarterly Adjusted EBITDA 19.4% CAGR Adjusted EBITDA is trending up reflecting improved sales and cost structure

21 $89.1 $99.5 $101.0 $103.9 $107.3 $103.9 $106.4 $80 $84 $88 $92 $96 $100 $104 $108 $112 $116 Q4 12 Q1 13 Q2 13 Q3 13 Q4 13 Q1 14 Q2 14 M ill ion $ Xerium Trailing Twelve Month (TTM) Adjusted EBITDA Xerium Trailing Twelve Month (TTM) Adjusted EBITDA is Increasing ~11% Annually 10.7% CAGR

22 Adjusted Earnings Per Share were $0.43 in Q2 – up 16% and were $1.75 over the Trailing Twelve Months – up 54% Q2 TTM Per Share Amounts (basic and adjusted, net of taxes) 2013 2014 Q2 2013 Q2 2014 Net Income $ (0.45) $ 0.05 $ (0.92) $ 0.49 Adjustments: Restructuring Expenses 0.33 0.37 1.41 1.14 Loss on Debt Extinguishment 0.44 - 0.44 - Inventory Write-off Related to a Closed Plant 0.05 - 0.05 0.02 FX Losses - 0.01 0.04 0.10 CEO Retirement Non-recurring Expenses - - 0.12 - Net Income, adjusted $ 0.37 $ 0.43 $ 1.14 $ 1.75 +16% +54%

23 Xerium is Investing $69 Million to Grow Sales Over the Next Several Years. Xerium is Investing $68 Million to Grow Sales -- A Few Examples from 10 Projects in Process -- New Press Felt Plant in Ba Cheng, China Construction is underway to expand high-end press felt capacity for Asian market. These felts are key consumable products for newer, high-speed machines installed in the region. Redeployment of Assets from France Plant Assets from closed rolls facility in France have been repurposed in Changzhou and Xi’an, China Rolls Plants Commissioned in February 2014. The first roll – Rebel was successfully produced two months ahead of schedule. Installation of State of the Art polyurethane line at Changzhou, China Plant

24 Xerium is Investing $68 Million to Grow Sales -- A Few Examples from 10 Projects in Process -- Rolls / Parts Storage Area & NDT & Wash Bay High Bay Space & Heavy Crane Rubber Storage Area New Conference Room Windows to be installed Expansion of Rolls and Mechanical Services Plant in Ruston, LA Construction is underway to expand suction box overhaul capacity for Southeast USA market. A key service requirement of tissue makers and board makers. Expansion of Plant in Gloggnitz, Austria Erection and installation of high-tech needle loom. Expands capacity for press felt production.

25 Xerium is Investing $68 Million to Grow Sales -- A Few Examples from 10 Projects in Process -- Building Expansions Piracicaba, Brazil Transferring assets from João Pessoa to expand capacity for local market. Heat setting machine Warping Area Expansion of Dryer Fabric Plant in Kentville, Nova Scotia Site preparation is underway to expand dryer fabric production capacity using assets from João Pessoa.

26 Xerium Has Invested To Permanently Lower Its Cost Structure and Improve its Quality in its Core Product and Service Categories 2013 - took out over $23 million of costs 2014 - taking out over $25 million of costs 2015 & beyond - formalizing plans now Xerium Is Improving Its Cost and Operational Structure -- A Few Examples from 9 Programs in Process -- Specifically, we spent $22.3 million on restructuring activities and took out over $23 million of costs in 2013, with over an additional $25 million of savings projected in 2014. Here are a few examples: Consolidation of production from Heidenheim, Germany to Duren, Germany and upgrade of equipment to improve quality and lower costs. Consolidation and Upgrade of Rolls and Mechanical Services in Duren, Germany Plant Consolidation of production from Buenos Aires, Argentina to Piracicaba, Brazil and upgrade of equipment to improve quality and lower costs. Consolidation and Upgrade of Dryer Fabric Production in Piracicaba, Brazil Plant

27 Xerium is Investing $69 Million to Grow Sales Over the Next Several Years. Xerium is Developing New Products to Grow Sales -- A Few Examples from 17 Programs in Process -- TAD Tissue Product A 2-year new product development program for Through-Air-Dryer fabrics is nearing completion, with market introduction in the 2nd half of 2014. Completes PMC product portfolio for the growing tissue market. SMART® Roll for Suction Press Applications A Xerium exclusive - paper and tissue makers can now view and manage nip conditions in suction roll applications. Competitive field validation trials now in process with Q4 2014 launch. Special high-end machine clothing belt for press rolls on high-demand press configurations. It is in the field validation phase and slated for launch in early 2015. Shoe Press Belt
28 Xerium Has Invested To Permanently Lower Its Cost Structure and Improve its Quality in its Core Product and Service Categories Have been actively litigating case within Administrative Courts Have not changed our ASC 740-10 position An applicable Amnesty Program has been made available in Brazil during a short window until August 25, 2014. This is a settlement program. Rules for participation were finalized and just issued on August 1, 2014 There is an opportunity for sharp reductions in penalties & interest depending on how quickly tax debt is paid. If Xerium chooses to participate, secures necessary financing, and is accepted, then: The Company would anticipate taking a charge to net income of approximately $26 million to $29 million (subject to currency exchange rates and fees). This would not impact Adjusted EBITDA. This would close out and settle this matter, which dates back to a 2005 event. Xerium Update on Brazilian Tax Litigation
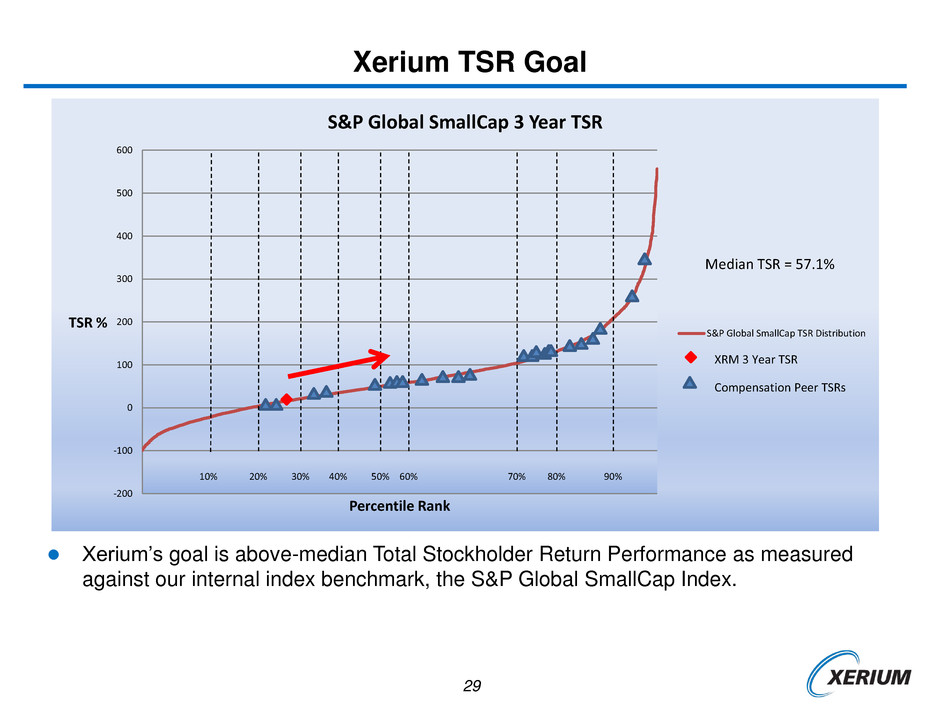
29 Xerium Has Invested To Permanently Lower Its Cost Structure and Improve its Quality in its Core Product and Service Categories Xerium TSR Goal Xerium’s goal is above-median Total Stockholder Return Performance as measured against our internal index benchmark, the S&P Global SmallCap Index. -200 -100 0 100 200 300 400 500 600 TSR % Percentile Rank S&P Global SmallCap 3 Year TSR S&P Global SmallCap TSR Distribution 10% XRM 3 Year TSR Compensation Peer TSRs Median TSR = 57.1% 20% 30% 40% 50% 60% 70% 80% 90%

30 Xerium Investment Thesis We Believe There is Opportunity for Substantial Returns for Shareholders We are a small cap stock, currently trading at 6x trailing twelve month Adjusted EBITDA. Our enterprise value per share is currently $41.79 per share and our market cap per share is $13.40. We have historically enjoyed strong cash generation and are currently in the middle of a transformation of our business which has led to Adjusted EBITDA growth of 19% since 2012 and has more room to run. If we achieve the midpoint of our current Adjusted EBITDA guidance, and maintain our current debt and 6x multiple, our stock price could move from $13.40 per share to $17.60 per share, an increase of 31%. From a longer term perspective, we believe Xerium can outperform the market. We have a goal to be a 3rd quartile TSR relative to S&P Global Small Cap index. Our customers want a strong Xerium to compete with market leaders in PMC & Rolls across all product categories. This is a long-term opportunity that is currently limited by production capacity. Obtaining market share comparable to the market leaders across all of our product offerings could result in $400 million in additional annual sales. Xerium has an opportunity to grow in non-paper product lines such as non-woven and fiber cement. Achieving an approximate 25% market share over time in these markets could add around $20 million in incremental annual sales. As earnings improve and our need to invest our cash in large capital spending and restructuring projects diminishes we will have significant free cash flow from which to pay down debt. A reduction of $15 million of net debt from the current level of $437 million adds approximately $1 per share to the stock price on a pro forma basis.
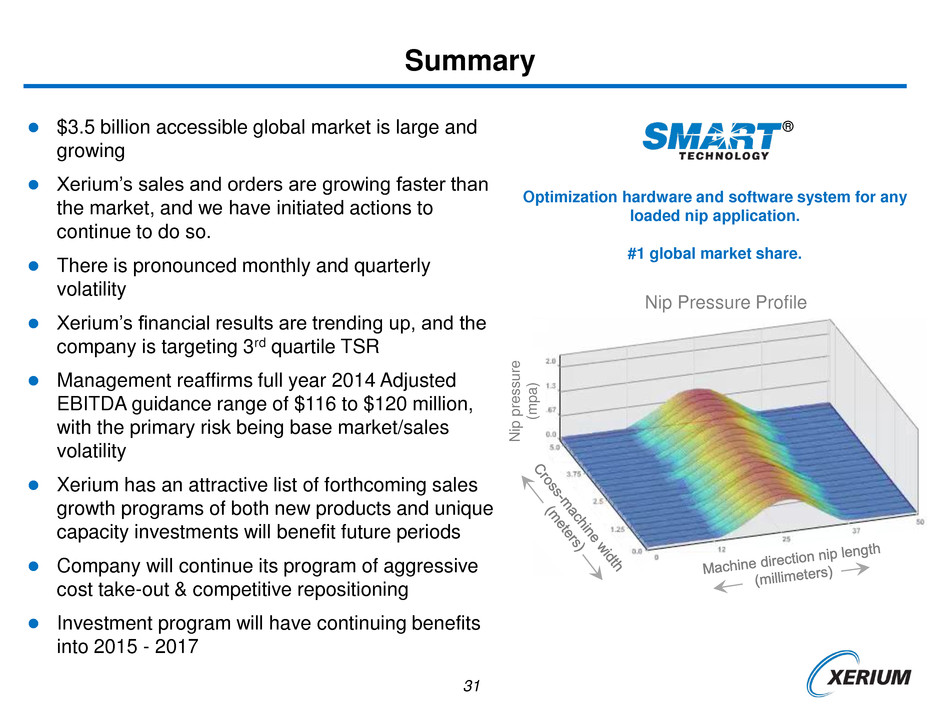
31 $3.5 billion accessible global market is large and growing Xerium’s sales and orders are growing faster than the market, and we have initiated actions to continue to do so. There is pronounced monthly and quarterly volatility Xerium’s financial results are trending up, and the company is targeting 3rd quartile TSR Management reaffirms full year 2014 Adjusted EBITDA guidance range of $116 to $120 million, with the primary risk being base market/sales volatility Xerium has an attractive list of forthcoming sales growth programs of both new products and unique capacity investments will benefit future periods Company will continue its program of aggressive cost take-out & competitive repositioning Investment program will have continuing benefits into 2015 - 2017 Summary Optimization hardware and software system for any loaded nip application. #1 global market share. N ip pressure (m p a ) ® Nip Pressure Profile
Innovative Performance That Delivers Results
