Attached files
| file | filename |
|---|---|
| 8-K - 8-K - EarthLink Holdings, LLC | a14-18502_18k.htm |
Exhibit 99.1
|
|
EarthLink Overview |

|
|
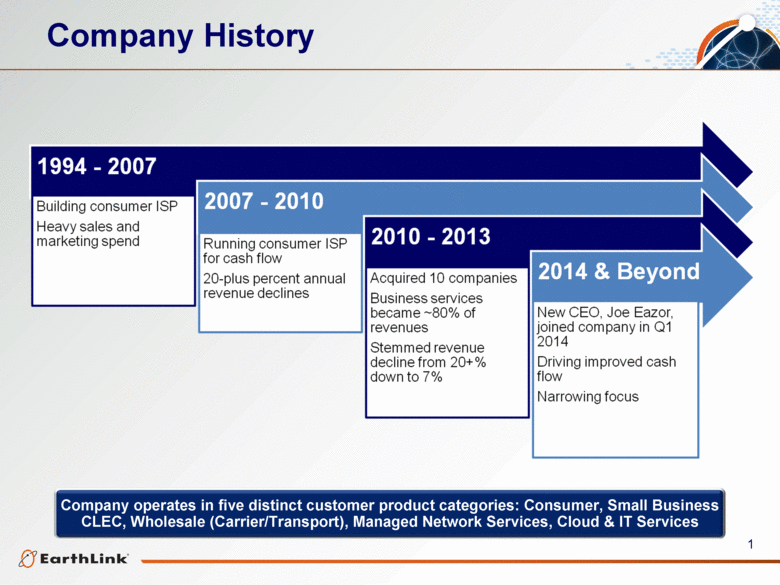
Company History Company operates in five distinct customer product categories: Consumer, Small Business CLEC, Wholesale (Carrier/Transport), Managed Network Services, Cloud & IT Services |
|
|
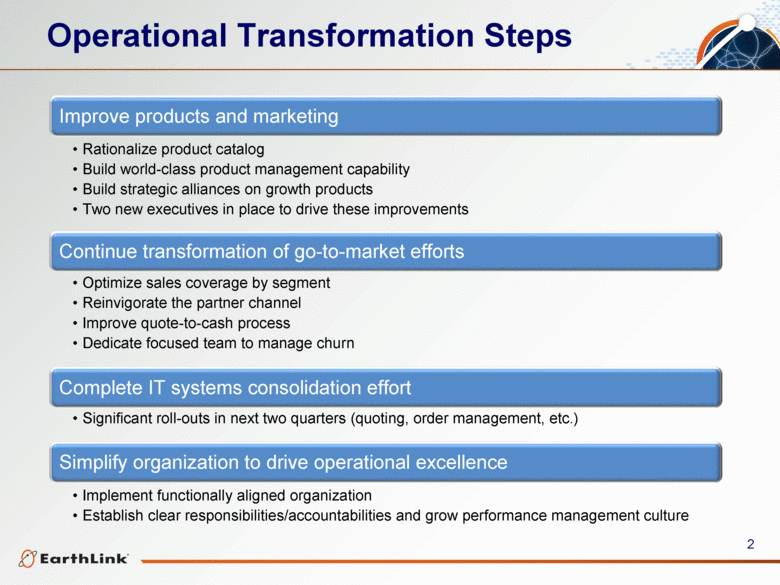
Operational Transformation Steps Improve products and marketing Rationalize product catalog Build world-class product management capability Build strategic alliances on growth products Two new executives in place to drive these improvements Continue transformation of go-to-market efforts Optimize sales coverage by segment Reinvigorate the partner channel Improve quote-to-cash process Dedicate focused team to manage churn Complete IT systems consolidation effort Significant roll-outs in next two quarters (quoting, order management, etc.) Simplify organization to drive operational excellence Implement functionally aligned organization Establish clear responsibilities/accountabilities and grow performance management culture |
|
|
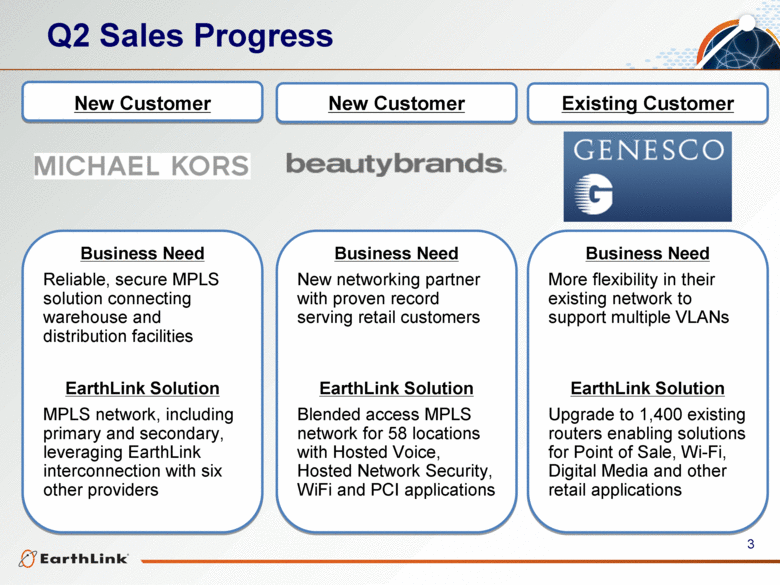
Q2 Sales Progress New Customer Business Need New networking partner with proven record serving retail customers EarthLink Solution Blended access MPLS network for 58 locations with Hosted Voice, Hosted Network Security, WiFi and PCI applications Business Need More flexibility in their existing network to support multiple VLANs EarthLink Solution Upgrade to 1,400 existing routers enabling solutions for Point of Sale, Wi-Fi, Digital Media and other retail applications Business Need Reliable, secure MPLS solution connecting warehouse and distribution facilities EarthLink Solution MPLS network, including primary and secondary, leveraging EarthLink interconnection with six other providers New Customer Existing Customer |
|
|
Q2 Operating Highlights Operational Improvements Service Delivery Improvements Reduced mean time to install by 23 percent year over year Improved overall customer satisfaction rating to highest level since July 2013 Improved customer satisfaction rating in our customer care and repair organizations by 13% since Q1 Network Cost Management Improvements Increased margin on newly installed services by 9% compared to Q4 2013 Created $1M in new MRC savings Organizational Focus Corporate Marketing. Re-organized team to support product and segment strategy. Go-to Market Model. Coordinating across customer-facing teams and rationalize investment that has been directed at any other area. Product Management. Centralized organization to bring together key product roles. Operating Model. Incorporating service delivery, network management, and IT to drive performance in revenue production and customer service. |

|
|
Market Opportunity |

|
|
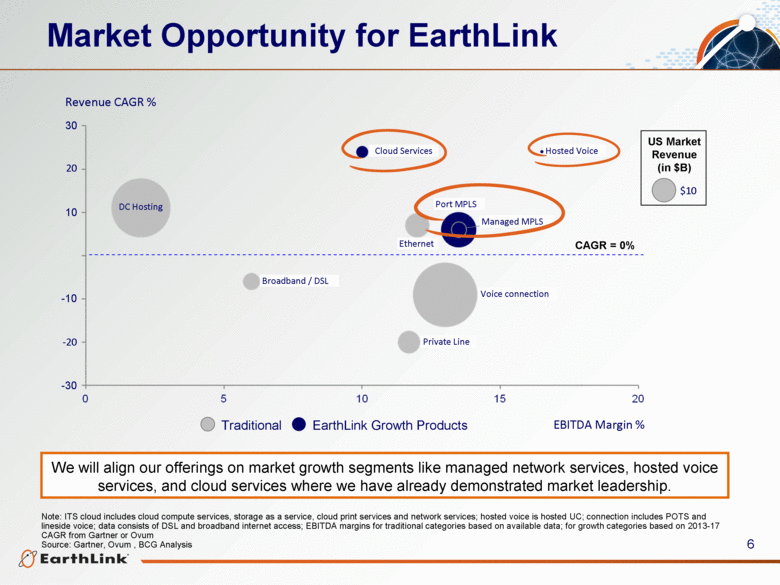
We will align our offerings on market growth segments like managed network services, hosted voice services, and cloud services where we have already demonstrated market leadership. Market Opportunity for EarthLink -20 20 -30 -10 10 30 Hosted Voice DC Hosting Port MPLS Ethernet EBITDA Margin % Revenue CAGR % Cloud Services Managed MPLS Broadband / DSL Private Line Voice connection Traditional EarthLink Growth Products US Market Revenue (in $B) CAGR = 0% $10 Note: ITS cloud includes cloud compute services, storage as a service, cloud print services and network services; hosted voice is hosted UC; connection includes POTS and lineside voice; data consists of DSL and broadband internet access; EBITDA margins for traditional categories based on available data; for growth categories based on 2013-17 CAGR from Gartner or Ovum Source: Gartner, Ovum , BCG Analysis |
|
|
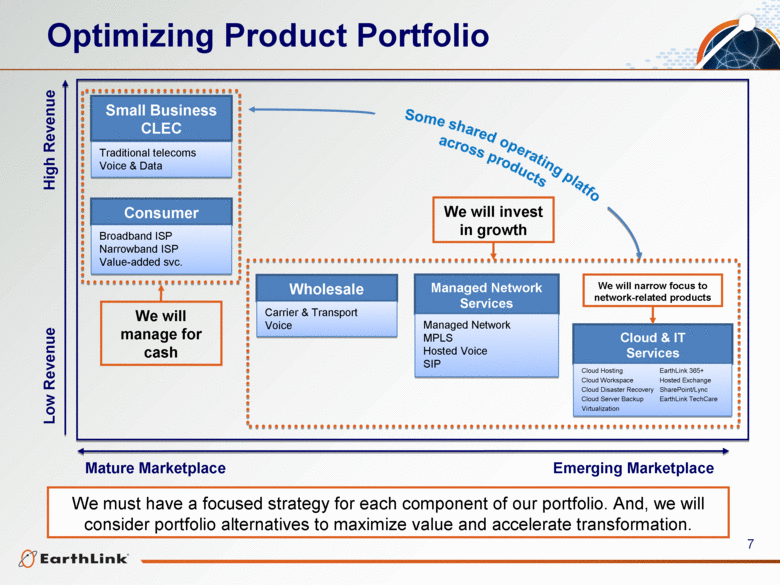
Optimizing Product Portfolio Mature Marketplace Emerging Marketplace Low Revenue High Revenue Small Business CLEC Traditional telecoms Voice & Data Consumer Broadband ISP Narrowband ISP Value-added svc. Wholesale Carrier & Transport Voice Managed Network Services Managed Network MPLS Hosted Voice SIP Cloud & IT Services Cloud Hosting EarthLink 365+ Cloud Workspace Hosted Exchange Cloud Disaster Recovery SharePoint/Lync Cloud Server Backup EarthLink TechCare Virtualization We will invest in growth We will manage for cash We will narrow focus to network-related products We must have a focused strategy for each component of our portfolio. And, we will consider portfolio alternatives to maximize value and accelerate transformation. |
|
|
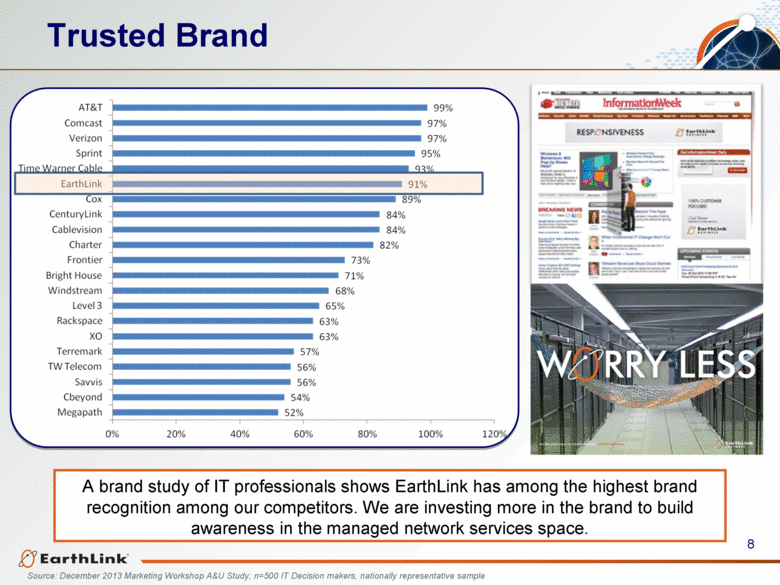
A brand study of IT professionals shows EarthLink has among the highest brand recognition among our competitors. We are investing more in the brand to build awareness in the managed network services space. Source: December 2013 Marketing Workshop A&U Study; n=500 IT Decision makers, nationally representative sample Trusted Brand |
|
|
Revenue Trends |

|
|
NOTES: Revenue component amounts sourced from billing data. Revenue outlook information does not represent guidance, is subject to various risks and uncertainties, one or more of which could cause actual results to differ, and is not subject to being updated. Revenue Components $ in Millions Q2 2013 Q1 2014 Q2 2014 Q2 ’14 vs. Q2 ’13 Outlook / Commentary Consumer $70 $63 $63 -10% In Q2 2014, churn and ARPU increased following some pricing actions. We expect the decline rate of the consumer business to continue to improve as it has in the past. CLEC (Primarily Small Business) $165 $151 $148 -11% Sequential stabilization due to pricing actions concentrated in the first half of 2014. Anticipate decline rate of ~11% in 2014 as a result of the full year impact of the elevated churn in mid 2013. Expect further improvement over subsequent periods as segment customers and we target retention efforts Wholesale (Carrier/Transport) $39 $36 $38 -3% Expect to decline ~3% in 2014 as a result of the FY impact of the Sprint/Nextel disconnect, and grow low single digits long-term Quarterly results will continue to be lumpy as we complete settlements as in this period Managed Network and Cloud & IT Services $39 $47 $49 26% YoY growth rate will be lower in Q3 due to inclusion of CenterBeam revenue in Q3 2013 Anticipate long term annual growth ~20% Total Company $313 $297 $297 -6% ~$346 million annual run rate |

|
|
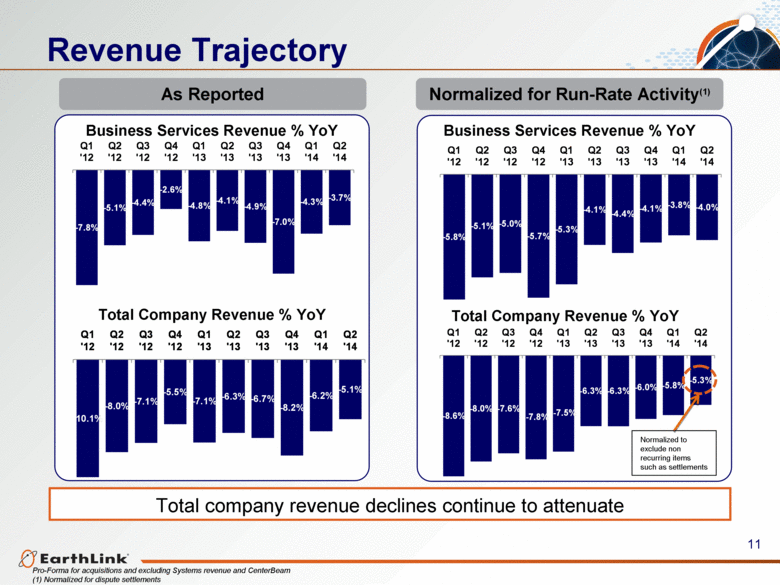
Revenue Trajectory Pro-Forma for acquisitions and excluding Systems revenue and CenterBeam (1) Normalized for dispute settlements Total company revenue declines continue to attenuate Business Services Revenue % YoY Business Services Revenue % YoY Normalized for Run-Rate Activity(1) As Reported Total Company Revenue % YoY Total Company Revenue % YoY Normalized to exclude non recurring items such as settlements - 7.8% - 5.1% - 4.4% - 2.6% - 4.8% - 4.1% - 4.9% - 7.0% - 4.3% - 3.7% Q1 '12 Q2 '12 Q3 '12 Q4 '12 Q1 '13 Q2 '13 Q3 '13 Q4 '13 Q1 '14 Q2 '14 - 5.8% - 5.1% - 5.0% - 5.7% - 5.3% - 4.1% - 4.4% - 4.1% - 3.8% - 4.0% Q1 '12 Q2 '12 Q3 '12 Q4 '12 Q1 '13 Q2 '13 Q3 '13 Q4 '13 Q1 '14 Q2 '14 - 10.1% - 8.0% - 7.1% - 5.5% - 7.1% - 6.3% - 6.7% - 8.2% - 6.2% - 5.1% Q1 '12 Q2 '12 Q3 '12 Q4 '12 Q1 '13 Q2 '13 Q3 '13 Q4 '13 Q1 '14 Q2 '14 |
|
|
Cash Flow & Balance Sheet |

|
|
Capital Expenditures Expect to invest $105M - $115M in 2014, down 20% - 27% from 2013 Approximately two-thirds of capital has historically been success based. Improved processes and efficiencies around CPE, LEC, Outsourced Installs and Internal Capitalized Labor driving down costs Driving vendor cost savings through improved procurement practices $49M CapEx YTD $147 $144 $125 - $135 $115 - $125 Driving Lower Capital Expenditures $105 - $115 |

|
|
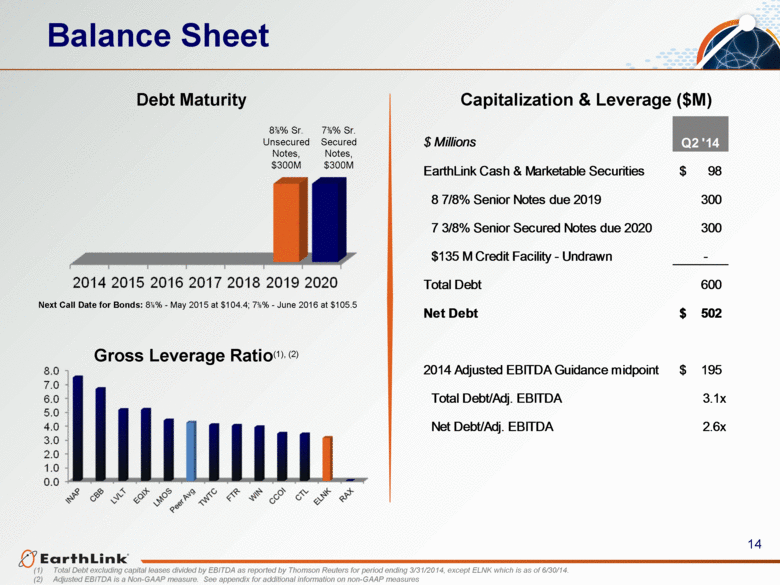
Balance Sheet Debt Maturity Capitalization & Leverage ($M) Next Call Date for Bonds: 87/8% - May 2015 at $104.4; 73/8% - June 2016 at $105.5 87/8% Sr. Unsecured Notes, $300M (1) Total Debt excluding capital leases divided by EBITDA as reported by Thomson Reuters for period ending 3/31/2014, except ELNK which is as of 6/30/14. (2) Adjusted EBITDA is a Non-GAAP measure. See appendix for additional information on non-GAAP measures 73/8% Sr. Secured Notes, $300M Gross Leverage Ratio(1), (2) $ Millions Q2 '14 EarthLink Cash & Marketable Securities 98 $ 8 7/8% Senior Notes due 2019 300 7 3/8% Senior Secured Notes due 2020 300 $135 M Credit Facility - Undrawn - Total Debt 600 Net Debt 502 $ 2014 Adjusted EBITDA Guidance midpoint 195 $ Total Debt/Adj. EBITDA 3.1x Net Debt/Adj. EBITDA 2.6x |
|
|
Summary (1) Total Debt excluding capital leases divided by EBITDA as reported by Thomson Reuters for period ending 12/31/2013 (2) Adjusted EBITDA is a Non-GAAP measure. See appendix for additional information on non-GAAP measures |
|
|
Appendix |

|
|
Executive & Financial Leadership Brad Ferguson, EVP and Chief Financial Officer Chief Financial Officer since August 2009. EarthLink's Vice President, Controller since September 2005 and Principal Accounting Officer; previously EarthLink's Vice President, Commercial Finance and Treasurer. Joined EarthLink with merger with MindSpring Enterprises, Inc. in 2000, where he was Vice President, Treasurer of MindSpring. CPA; previously member of the audit practice at Arthur Andersen LLP. Joseph F. Eazor President and Chief Executive Officer Joined EarthLink in January 2014 Served as Executive Vice President, Global Accounts and OEM at EMC Corporation, where he managed the company’s Global Accounts to help customers maximize the benefits of EMC’s technologies and services. Joined EMC in 2010 from McKinsey & Co., where he was a senior partner focusing on large technology companies and consulted with EMC, a McKinsey client. Prior to that, head of HP Enterprise Services, a $25 billion division with 130,000 employees worldwide. He joined HP in 2008, when the company acquired the leading services provider EDS, where he led acquisition negotiations and integration with HP over the subsequent two years. For 15 years before the merger, served in key strategic and executive roles with EDS, A.T. Kearney, and in the oil and gas industry. Louis M. Alterman, SVP Finance and Treasurer Oversees EarthLink’s Financial Planning, Treasury, Investor Relations and Business Intelligence activities Joined EarthLink in 2003 and has served in a wide range of leadership roles, leading departments with responsibility for financial modeling, budgeting, controllership, internal audit and acquisitions, among others. Previously served in a number of domestic and international roles at BellSouth Corporation (now AT&T), most recently in the Management Assurance organization. |

|
|
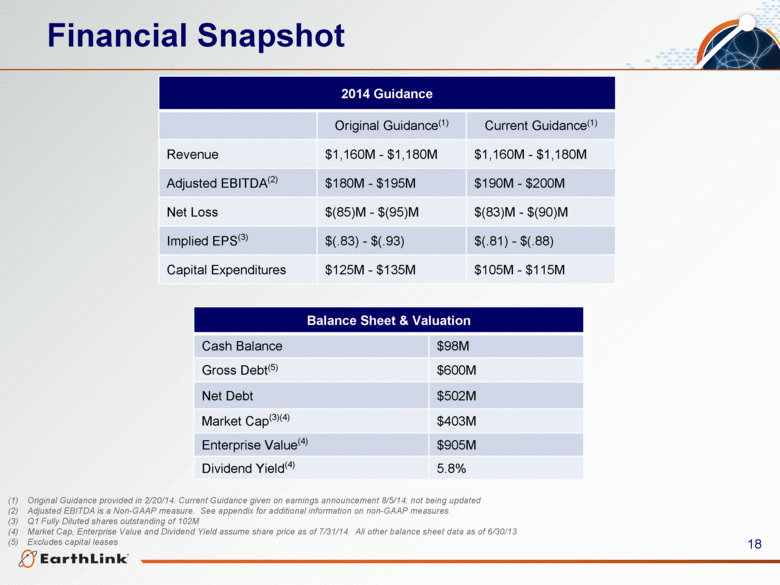
Financial Snapshot 2014 Guidance Original Guidance(1) Current Guidance(1) Revenue $1,160M - $1,180M $1,160M - $1,180M Adjusted EBITDA(2) $180M - $195M $190M - $200M Net Loss $(85)M - $(95)M $(83)M - $(90)M Implied EPS(3) $(.83) - $(.93) $(.81) - $(.88) Capital Expenditures $125M - $135M $105M - $115M Balance Sheet & Valuation Cash Balance $98M Gross Debt(5) $600M Net Debt $502M Market Cap(3)(4) $403M Enterprise Value(4) $905M Dividend Yield(4) 5.8% (1) Original Guidance provided in 2/20/14. Current Guidance given on earnings announcement 8/5/14; not being updated (2) Adjusted EBITDA is a Non-GAAP measure. See appendix for additional information on non-GAAP measures (3) Q1 Fully Diluted shares outstanding of 102M (4) Market Cap, (5) Enterprise Value and Dividend Yield assume share price as of 7/31/14. All other balance sheet data as of 6/30/13 Excludes capital leases |
|
|
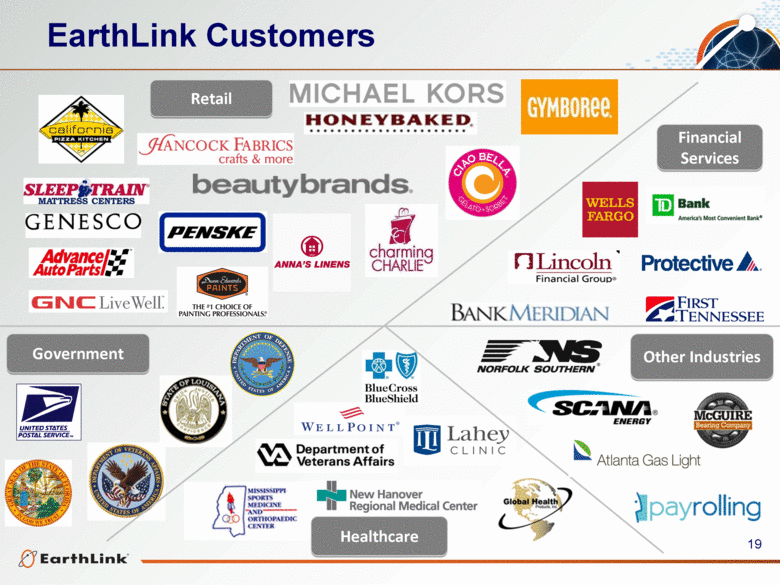
Financial Services Retail Government Other Industries Healthcare EarthLink Customers |
|
|
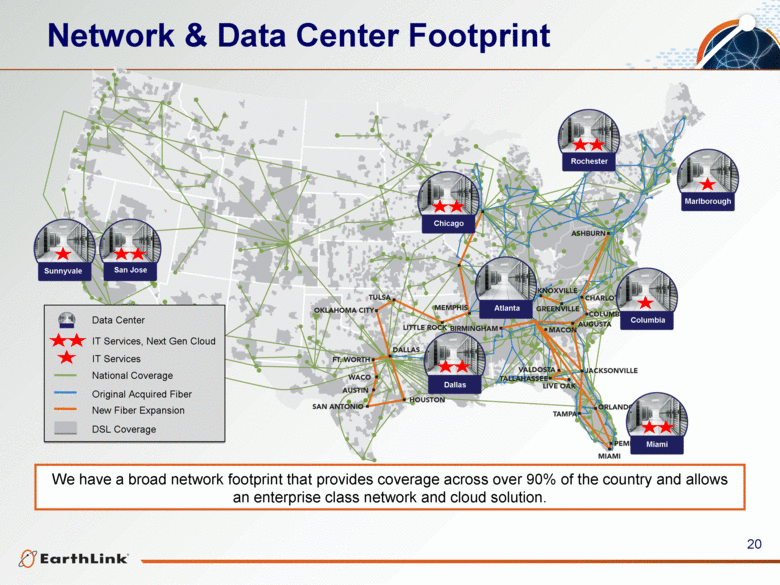
We have a broad network footprint that provides coverage across over 90% of the country and allows an enterprise class network and cloud solution. Chicago Rochester Columbia Marlborough Network & Data Center Footprint Data Center IT Services, Next Gen Cloud IT Services Original Acquired Fiber National Coverage New Fiber Expansion DSL Coverage Atlanta Columbia Sunnyvale |
|
|
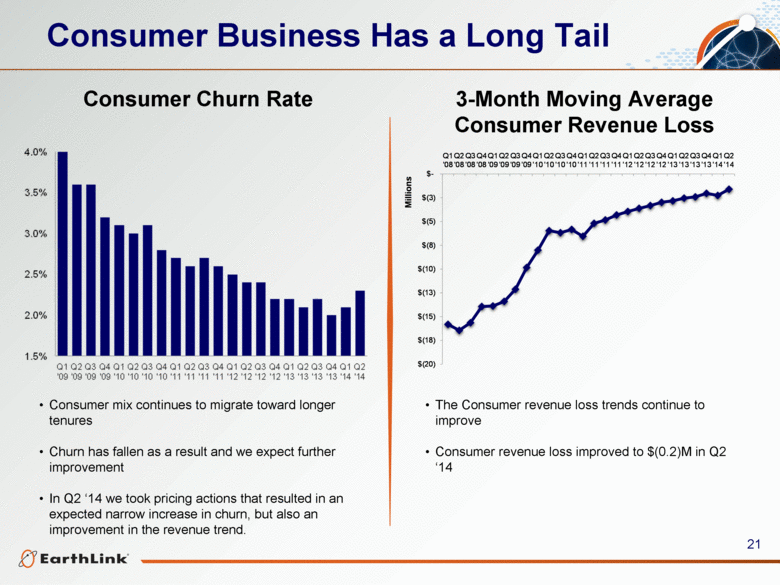
Consumer Business Has a Long Tail Consumer Churn Rate 3-Month Moving Average Consumer Revenue Loss Consumer mix continues to migrate toward longer tenures Churn has fallen as a result and we expect further improvement In Q2 ‘14 we took pricing actions that resulted in an expected narrow increase in churn, but also an improvement in the revenue trend. The Consumer revenue loss trends continue to improve Consumer revenue loss improved to $(0.2)M in Q2 ‘14 $(20) $(18) $(15) $(13) $(10) $(8) $(5) $(3) $- Q1 '08 Q2 '08 Q3 '08 Q4 '08 Q1 '09 Q2 '09 Q3 '09 Q4 '09 Q1 '10 Q2 '10 Q3 '10 Q4 '10 Q1 '11 Q2 '11 Q3 '11 Q4 '11 Q1 '12 Q2 '12 Q3 '12 Q4 '12 Q1 '13 Q2 '13 Q3 '13 Q4 '13 Q1 '14 Q2 '14 Millions |
|
|
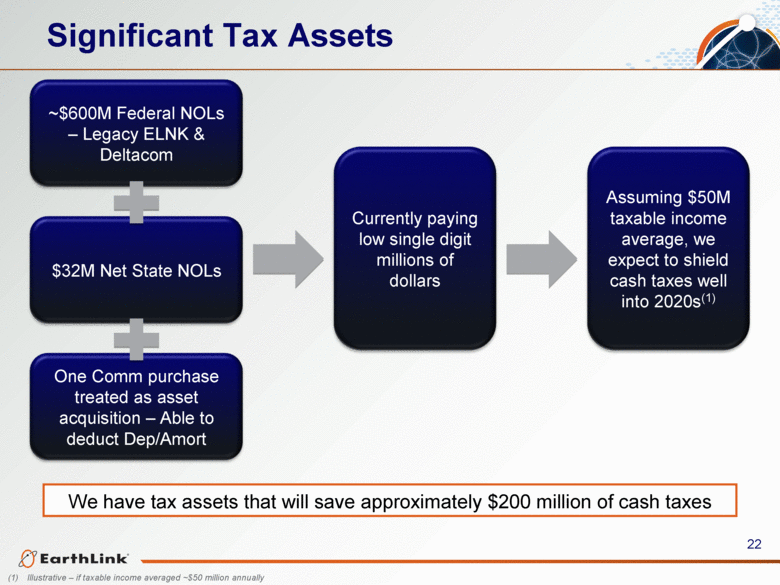
Significant Tax Assets We have tax assets that will save approximately $200 million of cash taxes ~$600M Federal NOLs – Legacy ELNK & Deltacom $32M Net State NOLs One Comm purchase treated as asset acquisition – Able to deduct Dep/Amort Currently paying low single digit millions of dollars Assuming $50M taxable income average, we expect to shield cash taxes well into 2020s(1) Illustrative – if taxable income averaged ~$50 million annually |
|
|
Non GAAP Information EarthLink Non-GAAP Measures Adjusted EBITDA is defined as net income (loss) before interest expense and other, net, income taxes, depreciation and amortization, stock-based compensation expense, impairment of goodwill and long-lived assets, restructuring, acquisition and integration-related costs, and gain (loss) from discontinued operations, net of tax. Unlevered Free Cash Flow is defined as net income (loss) before interest expense and other, net, income taxes, depreciation and amortization, stock based compensation expense, impairment of goodwill and long-lived, restructuring, acquisition and integration-related costs, and gain (loss) from discontinued operations, net of tax, less cash used for purchases of property and equipment. Adjusted Net Loss is defined as net loss excluding the non-cash charge to record a valuation allowance against deferred tax assets, the non-cash impairment of goodwill and estimated tax impact and the non-cash impairment of long-lived assets. Adjusted EBITDA, Unlevered Free Cash Flow and Adjusted Net Loss are non-GAAP measures and are not determined in accordance with U.S. generally accepted accounting principles. These non-GAAP financial measures are commonly used in the industry and are presented because management believes they provide relevant and useful information to investors. Management uses these non-GAAP financial measures to evaluate the performance of its business and determine bonuses. Management believes that excluding the effects of certain non-cash and non-operating items enables investors to better understand and analyze the current period’s results and provides a better measure of comparability. There are limitations to using these non-GAAP financial measures. Adjusted EBITDA, Unlevered Free Cash Flow and Adjusted Net Loss are not indicative of cash provided or used by operating activities and may differ from comparable information provided by other companies. Adjusted EBITDA, Unlevered Free Cash Flow and Adjusted Net Loss should not be considered in isolation, as an alternative to, or more meaningful than measures of financial performance determined in accordance with U.S. GAAP. |

|
|
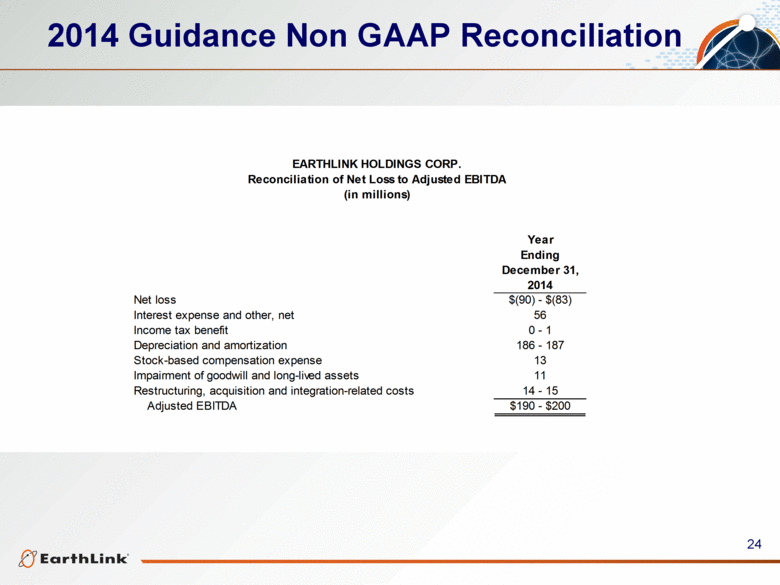
2014 Guidance Non GAAP Reconciliation Year Ending December 31, 2014 Net loss $(90) - $(83) Interest expense and other, net 56 Income tax benefit 0 - 1 Depreciation and amortization 186 - 187 Stock-based compensation expense 13 Impairment of goodwill and long-lived assets 11 Restructuring, acquisition and integration-related costs 14 - 15 Adjusted EBITDA $190 - $200 EARTHLINK HOLDINGS CORP. Reconciliation of Net Loss to Adjusted EBITDA (in millions) |
|
|
Cautionary Information Regarding Forward Looking Statements This presentation includes “forward-looking” statements (rather than historical facts) that are subject to risks and uncertainties that could cause actual results to differ materially from those described. Although we believe that the expectations expressed in these forward-looking statements are reasonable, we cannot promise that our expectations will turn out to be correct. Our actual results could be materially different from and worse than our expectations. With respect to such forward-looking statements, we seek the protections afforded by the Private Securities Litigation Reform Act of 1995. These risks include, without limitation: (1) we may not be able to execute our strategy to be a leading IT services and communications provider, which could adversely affect our results of operations and cash flows; (2) we may not be able to grow revenues from our growth products and services to offset declining revenues from our traditional products and services, which could adversely affect our results of operations and cash flows; (3) our failure to achieve operating efficiencies will adversely affect our results of operations; (4) as a result of our continuing review of our business, we may determine to undertake further restructuring plans that would require additional charges, including incurring facility exit and restructuring charges; (5) we may be unsuccessful integrating acquisitions into our business, which could result in operating difficulties, losses and other adverse consequences; (6) if we are unable to adapt to changes in technology and customer demands, we may not remain competitive, and our revenues and operating results could suffer; (7) unfavorable general economic conditions could harm our business; (8) we may be unable to successfully identify, manage and assimilate future acquisitions, which could adversely affect our results of operations; (9) we face significant competition in the communications and IT services industry that could reduce our profitability; (10) failure to retain existing customers could adversely affect our results of operations and cash flows; (11) decisions by legislative or regulatory authorities, including the Federal Communications Commission relieving incumbent carriers of certain regulatory requirements, and possible further deregulation in the future, may restrict our ability to provide services and may increase the costs we incur to provide these services; (12) if we are unable to interconnect with AT&T, Verizon and other incumbent carriers on acceptable terms, our ability to offer competitively priced local telephone services will be adversely affected; (13) our operating performance will suffer if we are not offered competitive rates for the access services we need to provide our long distance services; (14) we may experience reductions in switched access and reciprocal compensation revenue; (15) that failure to obtain and maintain necessary permits and rights-of-way could interfere with our network infrastructure and operations; (16) we have substantial business relationships with several large telecommunications carriers, and some of our customer agreements may not continue due to financial difficulty, acquisitions, non-renewal or other factors, which could adversely affect our wholesale revenue and results of operations; (17) we obtain a majority of our network equipment and software from a limited number of third-party suppliers; (18) work stoppages experienced by other communications companies on whom we rely for service could adversely impact our ability to provision and service our customers; (19) our commercial and alliance arrangements may not be renewed or may not generate expected benefits, which could adversely affect our results of operations; (20) our consumer business is dependent on the availability of third-party network service providers; (21) we face significant competition in the Internet access industry that could reduce our profitability; (22) the continued decline of our consumer access subscribers will adversely affect our results of operations; (23) potential regulation of Internet service providers could adversely affect our operations; (24) cyber security breaches could harm our business; (25) privacy concerns relating to our business could damage our reputation and deter current and potential users from using our services; (26) interruption or failure of our network, information systems or other technologies could impair our ability to provide our services, which could damage our reputation and harm our operating results; (27) our business depends on effective business support systems and processes; (28) if we, or other industry participants, are unable to successfully defend against disputes or legal actions, we could face substantial liabilities or suffer harm to our financial and operational prospects; (29) we may be accused of infringing upon the intellectual property rights of third parties, which is costly to defend and could limit our ability to use certain technologies in the future; (30) we may not be able to protect our intellectual property; (31) we may be unable to hire and retain sufficient qualified personnel, and the loss of any of our key executive officers could adversely affect us; (32) government regulations could adversely affect our business or force us to change our business practices; (33) our business may suffer if third parties are unable to provide services or terminate their relationships with us; (34) we may be required to recognize impairment charges on our goodwill and intangible assets, which would adversely affect our results of operations and financial position; (35) we may not realize our deferred tax assets, we may have exposure to greater than anticipated tax liabilities and we may be limited in the use of our net operating losses and certain other tax attributes in the future; (36) our indebtedness could adversely affect our financial health and limit our ability to react to changes in our industry; (37) we may require substantial capital to support business growth, and this capital may not be available to us on acceptable terms, or at all; (38) our debt agreements include restrictive covenants, and failure to comply with these covenants could trigger acceleration of payment of outstanding indebtedness or limit our ability to draw on our revolving credit facility; (39) we may reduce, or cease payment of, quarterly cash dividends; (40) our stock price may be volatile; (41) provisions of our certificate of incorporation, bylaws and other elements of our capital structure could limit our share price and delay a change of control of the company; and (42) our bylaws designate the Court of Chancery of the State of Delaware as the sole and exclusive forum for certain types of actions and proceedings that may be initiated by our stockholders, which could limit our stockholders’ flexibility in obtaining a judicial forum for disputes with us or our directors, officers or employees. These risks and uncertainties, as well as other risks and uncertainties that could cause our actual results to differ significantly from management’s expectations, are not intended to represent a complete list of all risks and uncertainties inherent in our business, and should be read in conjunction with the more detailed cautionary statements and risk factors included in our Annual Report on Form 10-K for the year ended December 31, 2013. |