Attached files
| file | filename |
|---|---|
| 8-K - 8-K - ENCORE CAPITAL GROUP INC | form8-kxslidepresentation2.htm |

Encore Capital Group, Inc. Q2 2014 EARNINGS CALL Exhibit 99.1

PROPRIETARY 2 CAUTIONARY NOTE ABOUT FORWARD-LOOKING STATEMENTS The statements in this presentation that are not historical facts, including, most importantly, those statements preceded by, or that include, the words “will,” “may,” “believe,” “projects,” “expects,” “anticipates” or the negation thereof, or similar expressions, constitute “forward-looking statements” within the meaning of the Private Securities Litigation Reform Act of 1995 (the “Reform Act”). These statements may include, but are not limited to, statements regarding our future operating results, earnings per share, and growth. For all “forward-looking statements,” the Company claims the protection of the safe harbor for forward-looking statements contained in the Reform Act. Such forward-looking statements involve risks, uncertainties and other factors which may cause actual results, performance or achievements of the Company and its subsidiaries to be materially different from any future results, performance or achievements expressed or implied by such forward-looking statements. These risks, uncertainties and other factors are discussed in the reports filed by the Company with the Securities and Exchange Commission, including its most recent report on Form 10-K, and its subsequent reports on Form 10-Q, each as it may be amended from time to time. The Company disclaims any intent or obligation to update these forward-looking statements.
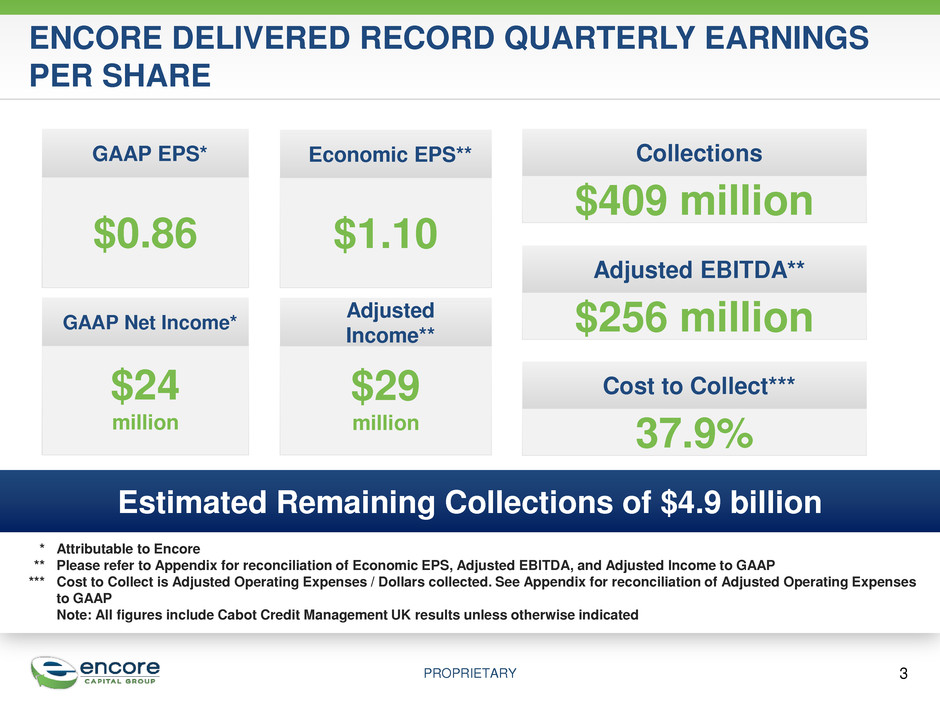
PROPRIETARY 3 ENCORE DELIVERED RECORD QUARTERLY EARNINGS PER SHARE Economic EPS** $1.10 GAAP EPS* $0.86 GAAP Net Income* $24 million Adjusted Income** $29 million Estimated Remaining Collections of $4.9 billion * Attributable to Encore ** Please refer to Appendix for reconciliation of Economic EPS, Adjusted EBITDA, and Adjusted Income to GAAP *** Cost to Collect is Adjusted Operating Expenses / Dollars collected. See Appendix for reconciliation of Adjusted Operating Expenses to GAAP Note: All figures include Cabot Credit Management UK results unless otherwise indicated Adjusted EBITDA** $256 million Collections $409 million Cost to Collect*** 37.9%

PROPRIETARY 4 Q2 DEPLOYMENTS WERE DRIVEN BY CORE PURCHASING IN THE U.S. AND PROPEL Q2-2014 Deployments $M Refinancia $4 Propel $102 Core US Purchasing $162 Cabot $59 Total $328

PROPRIETARY Lower Volume & Regulatory Pressure Attractive Opportunities Overconfidence & Irrational Pricing An Emerging Market 5 HISTORICALLY WE HAVE ANTICIPATED AND ADAPTED TO MARKET CHANGES WITH STRATEGIC DECISIONS – THIS TIME IS NO DIFFERENT • Established our center in India • Activity-level cost database • First known ability- to-pay (capability) model 2005 2007 • Created first generation consumer-level underwriting models Demand Supply 2001 2003 2009 2011 • Increased capital deployment • Expanded collections capacity 2013 2015 est. • Strategic acquisitions • Enhanced innovation • Focus on compliance • Industry consolidation • International & adjacent expansion

PROPRIETARY OUR CURRENT GROWTH STRATEGY IS TAILORED TO ADDRESS OUR MARKET'S EVOLVING DYNAMICS 6 Current Growth Strategy • International – India – Europe – Latin America – Australia – Others • New debt verticals – Government – Medical – Others Invest In Attractive Adjacencies: International and Other Asset Classes 2 • M&A opportunities in related spaces – Tax Liens – Debt Servicing – Others • Monetization of existing data and capabilities • Funding & incubation of new businesses Explore Business Model Expansions 3 • Core – Core cards direct – Resale – Bankruptcy • Subsidiaries – Cabot/Marlin – Propel – Grove – Refinancia Maintain the Core and Grow Our Subsidiaries 1
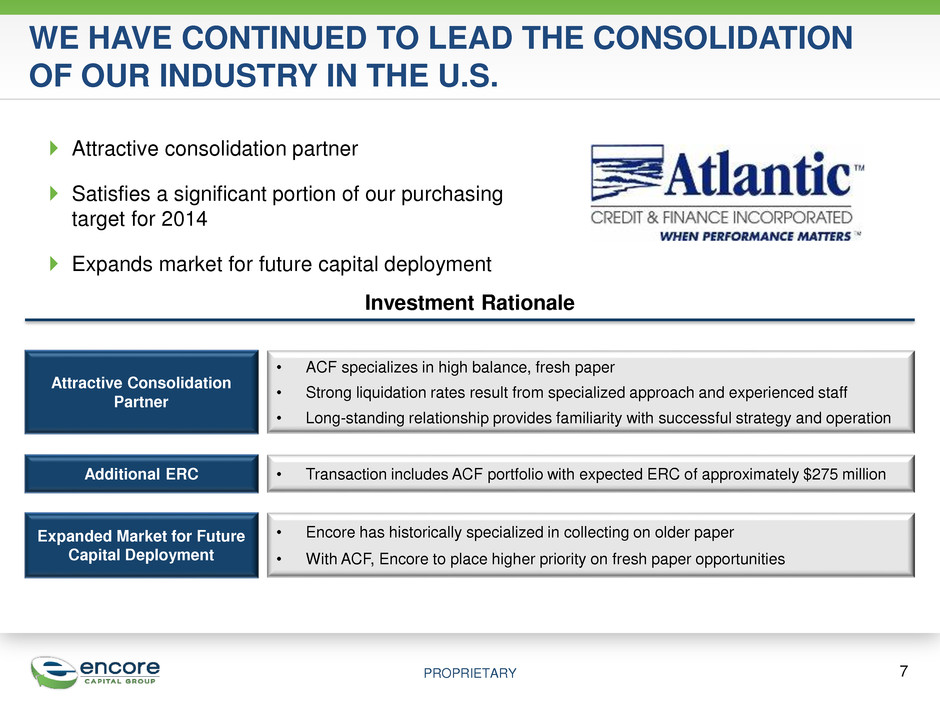
PROPRIETARY Investment Rationale Attractive Consolidation Partner Additional ERC Expanded Market for Future Capital Deployment • ACF specializes in high balance, fresh paper • Strong liquidation rates result from specialized approach and experienced staff • Long-standing relationship provides familiarity with successful strategy and operation • Encore has historically specialized in collecting on older paper • With ACF, Encore to place higher priority on fresh paper opportunities • Transaction includes ACF portfolio with expected ERC of approximately $275 million WE HAVE CONTINUED TO LEAD THE CONSOLIDATION OF OUR INDUSTRY IN THE U.S. 7 Attractive consolidation partner Satisfies a significant portion of our purchasing target for 2014 Expands market for future capital deployment

PROPRIETARY Cabot’s Economic EPS Impact CABOT REMAINS A SOLID CONTRIBUTOR TO OVERALL EARNINGS - MARLIN INTEGRATION REMAINS ON TRACK 8 Cabot Update 0.17 0.18 0.21 0.19 0.00 0.05 0.10 0.15 0.20 0.25 Q3 2013 Q4 2013 Q1 2014 Q2 2014 $ Cabot deployed $410 million in new portfolio purchases in the first half of 2014 Cabot successfully aligned key terms across Cabot and Marlin bonds Cabot collections in India have exceeded expectations Expect Cabot to return to Q1 EPS contribution level in Q3
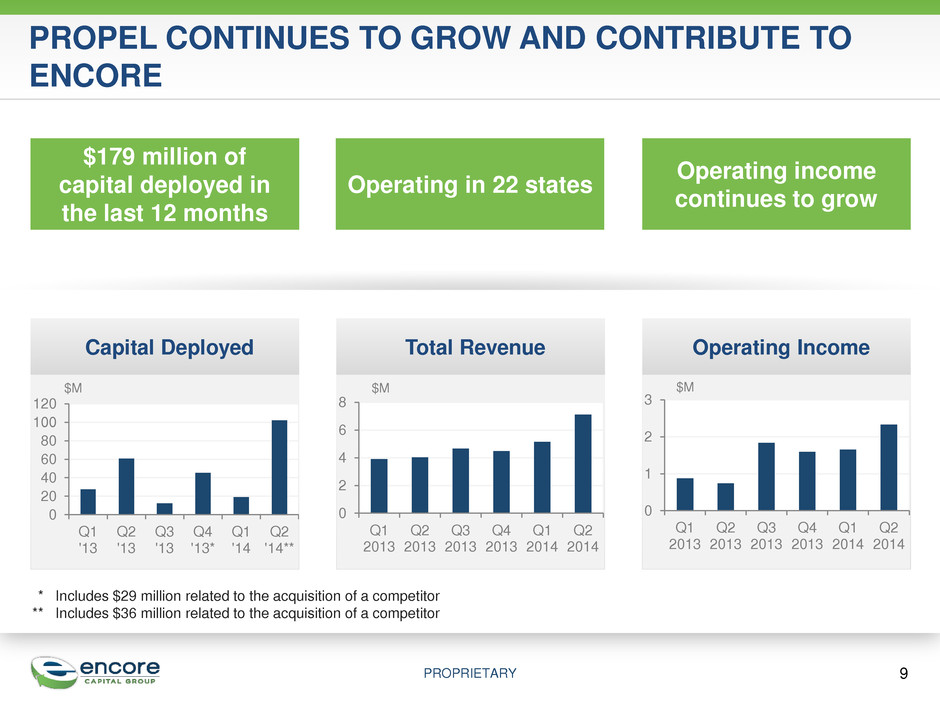
PROPRIETARY PROPEL CONTINUES TO GROW AND CONTRIBUTE TO ENCORE Capital Deployed Total Revenue 0 2 4 6 8 Q1 2013 Q2 2013 Q3 2013 Q4 2013 Q1 2014 Q2 2014 Operating Income 0 1 2 3 Q1 2013 Q2 2013 Q3 2013 Q4 2013 Q1 2014 Q2 2014 9 $179 million of capital deployed in the last 12 months Operating in 22 states Operating income continues to grow $M $M $M * Includes $29 million related to the acquisition of a competitor ** Includes $36 million related to the acquisition of a competitor 0 20 40 60 80 100 120 Q1 '13 Q2 '13 Q3 '13 Q4 '13* Q1 '14 Q2 '14** T h o u s a n d s
10 Detailed Financial Discussion

PROPRIETARY 11 Q2 COLLECTIONS REFLECT STEADY EXECUTION AND GROWTH OF CABOT Collections Summary 117 104 127 117 157 140 188 192 111 113 122 134 154 155 159 168 18 14 21 28 69 56 50 49 0 100 200 300 400 500 Q3 2012 Q4 2012 Q1 2013 Q2 2013 Q3 2013 Q4 2013 Q1 2014 Q2 2014 Collection Sites Legal Collections Collection Agencies$M 0 100 200 300 400 500 Q3 2012 Q4 2012 Q1 2013 Q2 2013 Q3 2013 Q4 2013 Q1 2014 Q2 2014 USA UK Latin America 246 230 270 278 380 351 397 409 $M

PROPRIETARY STRONG COLLECTIONS LED TO SOLID REVENUE GROWTH Revenue From Business Lines 12 $- $50 $100 $150 $200 $250 $300 Q3 2012 Q4 2012 Q1 2013 Q2 2013 Q3 2013 Q4 2013 Q1 2014 Q2 2014 Core US Cabot Propel Refinancia Grove $M 145 144 145 156 236 237 254 269 Channel Q2 2014 Rev Rec Q2 2013 Rev Rec Cabot 68.3% - United States 57.2% 53.3% Encore 59.8% 53.3% Revenue Recognition* * Revenue as a percentage of collections excludes the effects of net portfolio allowances or net portfolio allowance reversals

PROPRIETARY COST TO COLLECT REMAINS STABLE, EVEN AS WE CONTINUE TO INVEST IN COMPLIANCE 13 Overall Cost to Collect* 40% 43% 36% 38% 40% 42% 38% 38% 30% 35% 40% 45% Q3 2012 Q4 2012 Q1 2013 Q2 2013 Q3 2013 Q4 2013 Q1 2014 Q2 2014 ⃰ Cost to Collect is Adjusted Operating Expenses / Dollar collected. See Appendix for reconciliation of Adjusted Operating Expenses to GAAP. Channel Q2 2014 CTC Q2 2013 CTC Cabot 30.3% - US Legal 35.8% 36.8% Core sites 6.4% 6.1%

PROPRIETARY OUR COST TO COLLECT IN LEGAL OUTSOURCING AND INTERNAL LEGAL REMAINS WELL-CONTROLLED Legal Outsourcing Cost to Collect 0% 10% 20% 30% 40% 50% Q3 2012 Q4 2012 Q1 2013 Q2 2013 Q3 2013 Q4 2013 Q1 2014 Q2 2014 Legal Outsourcing Collections 80 100 120 140 Q3 2012 Q4 2012 Q1 2013 Q2 2013 Q3 2013 Q4 2013 Q1 2014 Q2 2014 $M Internal Legal Collections 0 15 30 45 Q3 2012 Q4 2012 Q1 2013 Q2 2013 Q3 2013 Q4 2013 Q1 2014 Q2 2014 $M Internal Legal Cost to Collect 0% 50% 100% Q3 2012 Q4 2012 Q1 2013 Q2 2013 Q3 2013 Q4 2013 Q1 2014 Q2 2014 14

PROPRIETARY COLLECTIONS GROWTH LED TO IMPROVED CASH FLOWS 15 151 135 174 172 231 206 250 256 0 50 100 150 200 250 300 Q3 2012 Q4 2012 Q1 2013 Q2 2013 Q3 2013 Q4 2013 Q1 2014 Q2 2014 * Please refer to Appendix for reconciliation of Adjusted EBITDA to GAAP Adjusted EBITDA* $M
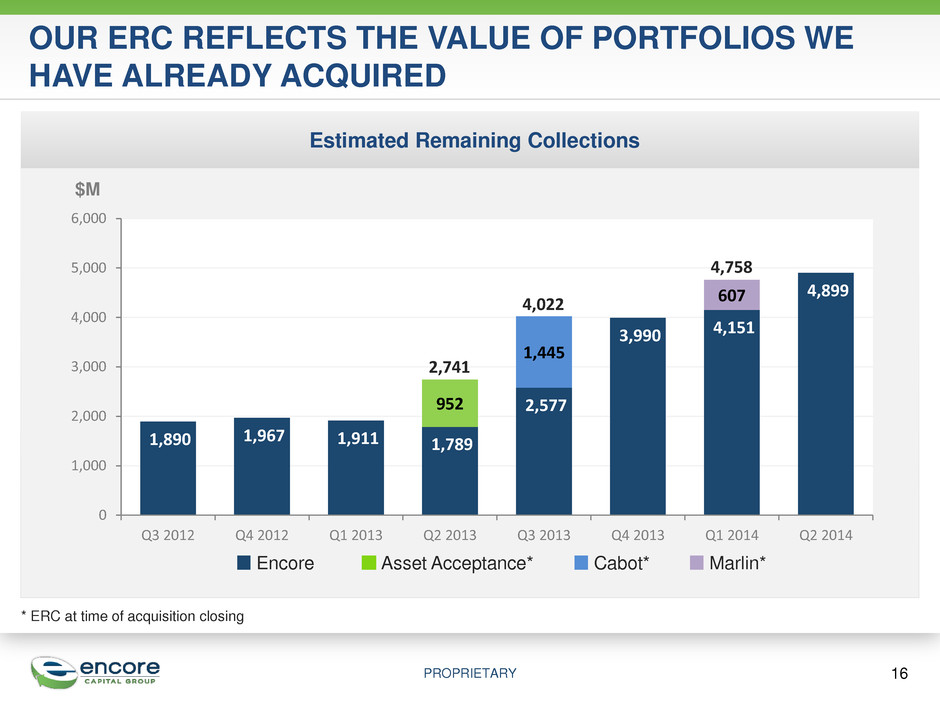
PROPRIETARY Estimated Remaining Collections $M 1,890 1,967 1,911 1,789 2,577 3,990 4,151 4,899 952 1,445 607 0 1,000 2,000 3,000 4,000 5,000 6,000 Q3 2012 Q4 2012 Q1 2013 Q2 2013 Q3 2013 Q4 2013 Q1 2014 Q2 2014 16 OUR ERC REFLECTS THE VALUE OF PORTFOLIOS WE HAVE ALREADY ACQUIRED Encore Asset Acceptance* 2,741 4,758 Cabot* 4,022 Marlin* * ERC at time of acquisition closing

PROPRIETARY ENCORE DELIVERED RECORD ECONOMIC EPS IN Q2 OF $1.10 $0.86 $1.06 $1.10 $0.06 $0.14 Net income per diluted share attributable to Encore Net non-cash interest and issuance cost amortization, net of tax Acquisition and integration related fees, net of tax Adjusted income per diluted share attributable to Encore - (Accounting)* Adjusted Income Attributable to Encore - (Economic)* 17 * Please refer to Appendix for reconciliation of Adjusted EPS / Economic EPS measurements to GAAP Less ~1.0M shares which are reflected in GAAP EPS, but will not be issued
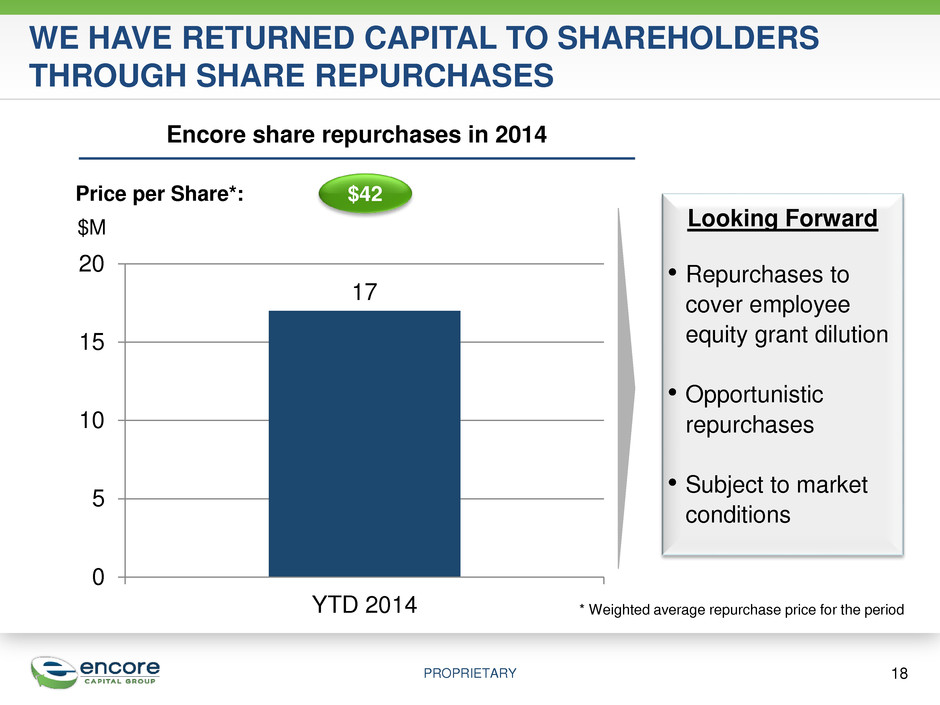
PROPRIETARY WE HAVE RETURNED CAPITAL TO SHAREHOLDERS THROUGH SHARE REPURCHASES Encore share repurchases in 2014 Price per Share*: $42 * Weighted average repurchase price for the period Looking Forward • Repurchases to cover employee equity grant dilution • Opportunistic repurchases • Subject to market conditions 18 17 0 5 10 15 20 YTD 2014 $M

PROPRIETARY 19 ENCORE’S LONG-TERM PROSPECTS REMAIN FAVORABLE Operating Results & Deployment A culture of constant improvement drives improved results Liquidity & Capital Access Strong liquidity and access to capital enhance our ability to take advantage of consolidating markets and new opportunities Solid Cash Flows Additional asset classes and geographies continue to enhance ERC and collections Geographic & Asset Class Diversification We are an international company in several asset classes, positioned for strong earnings growth going forward

20 Appendix

PROPRIETARY 21 NON-GAAP FINANCIAL MEASURES This presentation includes certain financial measures that exclude the impact of certain items and therefore have not been calculated in accordance with U.S. generally accepted accounting principles (“GAAP”). The Company has included information concerning Adjusted EBITDA because management utilizes this information, which is materially similar to a financial measure contained in covenants used in the Company's revolving credit facility, in the evaluation of its operations and believes that this measure is a useful indicator of the Company’s ability to generate cash collections in excess of operating expenses through the liquidation of its receivable portfolios. The Company has included information concerning Adjusted Operating Expenses in order to facilitate a comparison of approximate cash costs to cash collections for the portfolio purchasing and recovery business in the periods presented. The Company has included Adjusted Income Attributable to Encore and Adjusted Income Attributable to Encore per Share (also referred to as Economic EPS when adjusted for certain shares associated with our convertible notes that will not be issued but are reflected in the fully diluted share count for accounting purposes) because management uses these measures to assess operating performance, in order highlight trends in the Company’s business that may not otherwise be apparent when relying on financial measures calculated in accordance with GAAP. Adjusted EBITDA, Adjusted Operating Expenses, Adjusted Income Attributable to Encore and Adjusted Income Attributable to Encore per Share/Economic EPS have not been prepared in accordance with GAAP. These non-GAAP financial measures should not be considered as alternatives to, or more meaningful than, net income, net income per share, and total operating expenses as indicators of the Company’s operating performance. Further, these non-GAAP financial measures, as presented by the Company, may not be comparable to similarly titled measures reported by other companies. The Company has attached to this presentation a reconciliation of these non-GAAP financial measures to their most directly comparable GAAP financial measures.

PROPRIETARY 22 RECONCILIATION OF ADJUSTED INCOME AND ECONOMIC / ADJUSTED EPS Reconciliation of Adjusted Income and Economic / Adjusted EPS to GAAP EPS (Unaudited, In Thousands, except per share amounts), Three Months Ended June 30, 2014 2013 $ Per Diluted Share – Accounting Per Diluted Share – Economic* $ Per Diluted Share – Accounting Per Diluted Share – Economic GAAP net income attributable to Encore, as reported $ 23,561 $ 0.86 $ 0.89 $ 11,012 $ 0.44 $ 0.44 Adjustments: Convertible notes non-cash interest and issuance cost amortization, net of tax 1,694 0.06 0.06 529 0.02 0.02 Acquisition and integration related expenses, net of tax 3,836 0.14 0.15 9,707 0.39 0.39 Adjusted Income Attributable to Encore $ 29,091 $ 1.06 $ 1.10 $ 21,248 $ 0.85 $ 0.85 * Excludes approximately 1.0 million shares issuable upon the conversion of the company’s convertible senior notes that are included for accounting purposes but will not be issued due to certain hedge and warrant transactions

PROPRIETARY Reconciliation of Adjusted EBITDA to GAAP Net Income (Unaudited, In $ Thousands) Three Months Ended 6/30/12 9/30/12 12/31/12 3/31/13 6/30/13 9/30/13 12/31/13 3/31/14 6/30/14 GAAP net income, as reported 16,596 21,308 20,167 19,448 11,012 21,064 22,216 18,830 21,353 (Gain) loss from discontinued operations, net of tax 2,392 - - - - 308 1,432 - - Interest expense 6,497 7,012 6,540 6,854 7,482 29,186 29,747 37,962 43,218 Provision for income taxes 12,846 13,887 13,361 12,571 7,267 10,272 15,278 11,742 14,010 Depreciation and amortization 1,420 1,533 1,647 1,846 2,158 4,523 5,020 6,117 6,829 Amount applied to principal on receivable portfolios 101,813 105,283 90,895 129,487 126,364 154,283 124,520 159,106 161,048 Stock-based compensation expense 2,539 1,905 2,084 3,001 2,179 3,983 3,486 4,836 4,715 Acquisition and integration related expenses 3,774 - - 1,276 16,033 7,752 4,260 11,081 4,645 Adjusted EBITDA 147,877 150,928 134,694 174,483 172,495 231,371 205,959 249,674 255,818 RECONCILIATION OF ADJUSTED EBITDA 23

PROPRIETARY Reconciliation of Adjusted Operating Expenses to GAAP Operating Expenses (Unaudited, In $ Thousands) Three Months Ended RECONCILIATION OF ADJUSTED OPERATING EXPENSES 9/30/12 12/31/12 3/31/13 6/30/13 9/30/13 12/31/13 3/31/14 6/30/14 GAAP total operating expenses, as reported 103,621 103,872 105,872 126,238 174,429 168,466 185,472 190,689 Adjustments: Stock-based compensation expense (1,905) (2,084) (3,001) (2,179) (3,983) (3,486) (4,836) (4,715) Operating expense related to other operating segments (3,053) (3,092) (5,274) (6,367) (12,115) (12,755) (19,833) (26,409) Acquisition and integration related expenses - - (1,276) (12,403) (7,752) (4,260) (11,081) (4,645) Adjusted Operating Expenses 98,663 98,696 96,321 105,289 150,579 147,965 149,722 154,920 24

Encore Capital Group, Inc. Q2 2014 EARNINGS CALL
