Attached files
| file | filename |
|---|---|
| 8-K - CURRENT REPORT - XO GROUP INC. | v385713_8k.htm |
| EX-99.1 - PRESS RELEASE - XO GROUP INC. | v385713_ex99-1.htm |
| EX-99.2 - PRESS RELEASE - XO GROUP INC. | v385713_ex99-2.htm |
Exhibit 99.3

Investor Presentation - August 2014 1 1

Safe Harbor This presentation may contain projections or other forward - looking statements regarding future events or our future financial performance or estimates regarding third parties. These statements are only estimates or predictions and reflect our current beliefs and expectations. Actual events or results may differ materially from those contained in the estimates, projections or forward - looking statements. It is routine for internal projections and expectations to change as the quarter progresses, and therefore it should be clearly understood that the internal projections and beliefs upon which we base our expectations may change prior to the end of the quarter. Although these expectations may change, we will not necessarily inform you if they do. Our policy is to provide expectations not more than once per quarter, and not to update that information until the next quarter. Some of the factors that could cause actual results to differ materially from the forward - looking statements contained herein include, without limitation, ( i ) our online wedding - related and other websites may fail to generate sufficient revenue to survive over the long term, (ii) we incurred losses for many years following our inception and may incur losses in the future, (iii) we may be unable to adjust spending quickly enough to offset any unexpected revenue shortfall, (iv) sales to sponsors or advertisers may be delayed or cancelled, (v) efforts to launch new technology and features may not generate significant new revenue or may reduce revenue from existing services, (vi) we may be unable to develop solutions that generate revenue from advertising delivered to mobile phones and wireless devices, (vii) the significant fluctuation to which our quarterly revenue and operating results are subject, (viii) the seasonality of the wedding industry, (ix) our e - commerce operations are dependent on Internet search engine rankings, and our ability to influence those rankings is limited, (x) the dependence of our registry services business on third parties, and (xi) other factors detailed in documents we file from time to time with the Securities and Exchange Commission. Forward - looking statements in this release are made pursuant to the safe harbor provisions contained in the Private Securities Litigation Reform Act of 1995. This presentation includes certain "Non - GAAP financial information." A reconciliation of such information to the most directly comparable GAAP data can be found on slide 26 and 27 of this presentation. 2

Investment Opportunity Leader in Attractive Market • #1 o nline wedding property; growing baby property • Replenishing audience in an attractive demographic • Strong multi - platform brand built over 18 years Solid Financial Foundation • Diversified revenue streams • Healthy margin capability • Balanced approach to capital allocation 3 Strategic Transformation Underway • Evolving into a digital marketplace • Reinvesting in business and reinvigorating our product roadmap • Rigorous examination of underperforming/non - core businesses • Experienced management team focused on execution
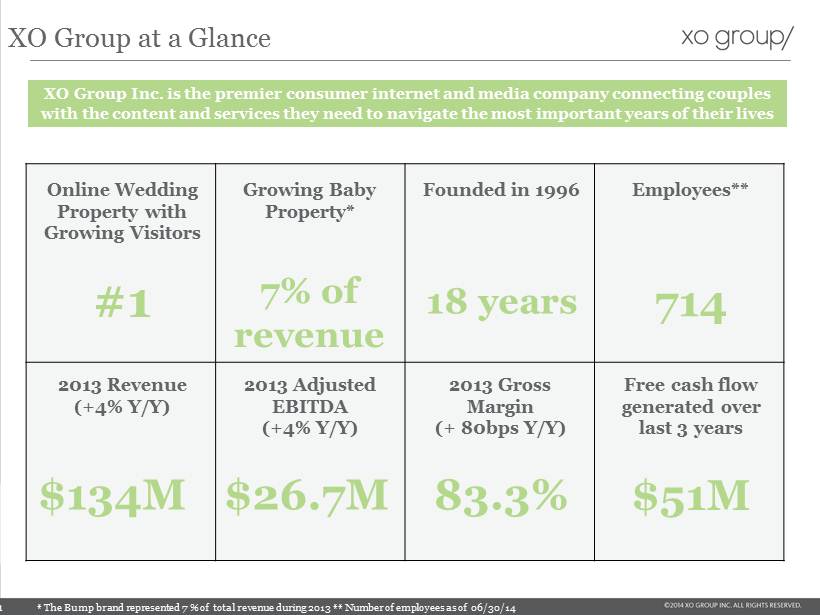
XO Group at a Glance $134M $26.7M 714 #1 $ 51M 83.3% XO Group Inc. is the premier consumer internet and media company connecting couples with the content and services they need to navigate the most important years of their lives 18 years * The Bump brand represented 7 % of total revenue during 2013 ** Number of employees as of 12/31/13 7% of revenue 2013 Revenue (+4% Y/Y) 2013 Adjusted EBITDA (+4% Y/Y) Employees** Online Wedding Property with Growing Visitors Free cash flow generated over last 3 years 2013 Gross Margin (+ 80bps Y/Y) Growing Baby Property* Founded in 1996 4

Business Overview Local Online 41% National Online 20% Publishing/ Other 19% E - Commerce 14% Registry 6% 2013 Revenue by Business Line 92% 7 % 1% 2013 Revenue by Brand* * Ijie revenue included as part of the knot Local Online Delivering qualified leads to local vendors; foundation for our digital marketplace strategy • ~23,000 vendors, ~$2,500 avg. revenue/vendor, ~73% retention Publishing / Other Delivering award winning content and ads in local and national markets • National magazine, regional magazines & The Bump magazine; books Registry Service Affiliate partnership with top registry brands to deliver traffic • Revenue growth +27% 2013 vs. 2012; 100% gross margin Offering personalized gift and wedding items; business under strategic review • Revenue declines over the last 3 years (2011 - 2013) E - Commerce National Online Brand advertising to endemic and non - endemic advertisers • The Bump online revenue up 42% year - over - year 2013 2013 Revenue $134M +4% Y/Y 5

5.8 2.5 1.3 1.1 0.8 0.7 Does not meet minimum reporting requirements 6 Month (January – June 2014) Unique Visitors Monthly Average (in millions) with Year - Over - Year % Growth 57% - 25% - 11% - 36% - 5% 6 % 6 Source: XO Group market research; Pew Research Center/ American Community Survey (ACS) by U.S. Consensus Bureau; The Knot: # 1 in Weddings Unique Visitor Source: comScore Multi Platform Does not meet minimum reporting requirements * Includes engagement ring but does not include honeymoon

Average Monthly Unique Visitors ( in millions) Unique Visitor Source : comScore Desktop Only for 2010 – 2012 monthly average as no mobile data was available, comScore multiplatform (desktop & mobile) available for 2013 . The Bump: Growing Baby Platform 7 0.5 1.0 1.2 1.7 1.5 3.1 FY 2010 FY 2011 FY 2012 FY 2013 1/2H 2014 Desktop +Mobile Web Mobile Web Desktop Source: XO Group market research; United States Census Bureau; National Vital Health Statistics reports (NCHS) Growing mobile user - base dramatically expands editorial and advertisers reach Desktop Desktop Desktop Desktop Mobile Web Desktop + Mobile Web

Strategic Transformation to Accelerate Growth 8

9 Marketplace dynamics include* Big verticals being disrupted by digital marketplaces Travel Transit Restaurants Digital Marketplaces Home Design * Highlights from Bill Gurley “All markets are not created equal: 10 Factors to consider when evaluating digital marketplaces ” – abovethecrowd.com • New Experience vs. the Status Quo : Great marketplaces do not simply aggregate a market, they enhance it. • Opportunity for Technology to Add Value: The technology offering greatly enhances the user experience. • High Fragmentation: High buyer and supplier fragmentation is a positive for an online marketplace. • Friction of Supplier Sign - Up: Supplier sign up and new city launches should be relatively quick after a model has been established. • Size of Market Opportunity: Large market with high percentage of the market likely to use the online alternative. • Network Effects: Offering a better experience as the marketplace adds more participants.
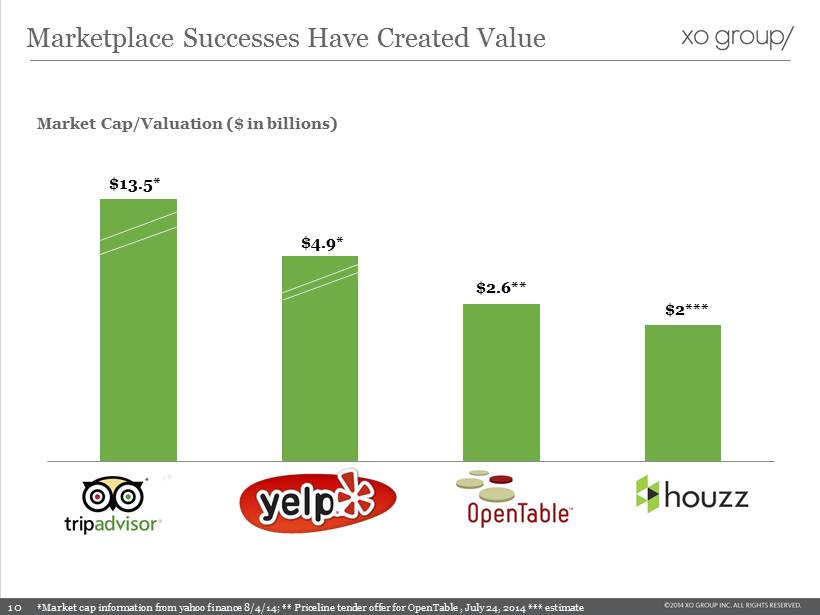
Tripadvisor* Yelp* Houzz (E) Opentable* Market Cap/Valuation ($ in billions) $13.5* $4.9* $ 2 *** $2.6** *Market cap information from yahoo finance 8/4/14; ** Priceline tender offer for OpenTable , July 24, 2014 *** estimate Marketplace Successes Have Created Value 10

Brides MARKETPLACE LIQUIDITY Local Vendors The Knot Marketplace Opportunity Strategic Investments/Roadmap x Robust bride data enables personalization efforts x 5M Real Wedding photos tagged to 90,000 local vendors x Add hundreds of thousands of reviews to TheKnot.com ( Q2’14 and growing beyond ) □ Improve vendor discovery & personalized results (2014 & 2015) □ Enhance actions to connect brides and vendors, e.g. request price, book tour, etc. (2015) Strategic investments will enable true marketplace liquidity, unleashing new vendor leads, higher vendor spend, and new revenue models Assets x TheKnot Pro app closes loop between vendors and interested brides (Q3’14) □ Grow to 200,000+ vendors by adding unpaid listings ( Q4’14) □ Expand unpaid listings information x ~23,700 paying vendors with robust profiles x Detailed analytics to show value of listing on The Knot x Award winning digital & print editorial… millions of organic visitors x Leading brand in weddings x Real Wedding photos (Two Bright Lights acquisition) x New Apps: generating 5x higher bride/vendor engagement actions vs. current website □ Full integration of Two Bright Lights (Q4’14) □ Relaunch of TheKnot.com desktop & mobile site to replicate success of apps Local vendor count as of 6/30/14
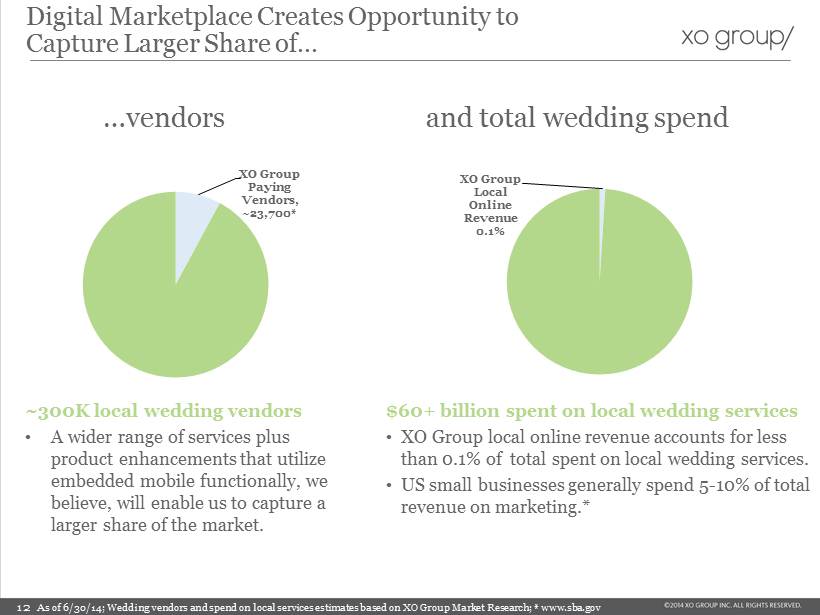
…vendors As of 6/30/14; Wedding vendors and spend on local services estimates based on XO Group Market Research; * www.sba.gov XO Group Paying Vendors, ~23,700* a nd total wedding spend XO Group Local Online Revenue 0.1% ~300K local wedding vendors • A wider range of services plus product enhancements that utilize embedded mobile functionally, we believe, will enable us to capture a larger share of the market. $60+ billion spent on local wedding services • XO Group local online revenue accounts for less than 0.1% of total spent on local wedding services. • US small businesses generally spend 5 - 10% of total revenue on marketing.* Digital Marketplace Creates Opportunity to Capture Larger Share of … 12

• Local online - transition to digital marketplace • The Bump online • Registry Invest in Growth • National online • Publishing Sustain Positive Momentum • Ijie • E - Commerce Under Review Focus on assets with high performance and potential; Rigorous review of under - performing/non - core assets Asset Assessment 13

Q4 2013 Wedding Lookbook by The Knot Integrates inspiration (browsing wedding photos) with local vendor information & connection Redesigned experience – shifting from a “portal” experience to a personalized feed of relevant text, images & commercial content Enables faster, more intimate communication channel between brides and local vendors. Key features include: Trends; Customer Intelligence; Messaging ; Bride Lookup Largest wedding fashion catalog on the web; seamlessly connects brides to local vendors Delivered 1.6 MM views in 1 day B rides spent 2.9 MM* minutes inside the app during July 2014 Q1 2014 The Knot Wedding Planner Q2 2014 The Bump Pregnancy Q3 2014 The Knot Pro for Wedding Professionals First - ever iOS app exclusively for wedding professionals 2 nd Half of 2014 Q4’14 & 1 st Half of 2015 Rebuild of TheKnot.com and TheBump.com to fully responsive design. Continued development of cutting edge data system & personalization capabilities Continued improvements & mobile app deployments for both iOS & Android • Featured as one of the Best New Apps on the front page of the Apple Store Reinvigorated Product Roadmap 14 Wedding Website & Gift Registry * Source Google Analytics – July 2014

Investment in Our Business 2014 Operating Expense Spend of roughly $15 million above historical run rate • Organic operating expense run rate of roughly 5% at single digit revenue growth • Additional spend above historical average: • Product & Content: increase talent in engineering and product • Sales & Marketing: scale sales team • General and Administrative: transition costs, new executive team members S pend to continue into first half of 2015 * Q4’13 opex includes severance of $0.35 million, representing the severance for a former executive of the Company and foreign VAT, interest and penalties of $0.9 million. Q1’14 opex includes severance of approximately $1.4 million, representing (i) severance charges for certain executives and (ii) severance charges fo r the employees in the Los Angeles office ($70k in product and content development, $506k in sales and marketing, and $778k in gene ral and administrative) 15 ($ MM US GAAP) 2012 FY Q1 2013 Q2 2013 Q3 2013 Q4 2013* 2013 FY Q1 2014* Q2 2014 Product and Content $26.2 $6.9 $7.1 $7.1 $8.8 $29.9 $ 8.9 $8.8 y/y 8.0% 4.2% 3.8% 5.0% 46.1% 13.9% 29.1% 23.8% Sales and Marketing 40.2 10.0 10.1 9.5 10.1 39.7 11.1 10.7 y/y 3.9% ( 10.6%) ( 1.8%) 4.7% 4.2% - 1.3% 11.4% 5.8% General and Administrative 21.0 4.8 5.3 5.7 7.2 23.1 7.1 6.3 y/y 1.5% ( 14.5%) ( 2.5%) 5.2% 61.5% 10.0% 46.6% 20.1% Depreciation and Amortization 3.9 1.1 1.1 1.1 1.5 4.8 1.7 1.8 y/y (17.6%) 16.6% 23.6% 24.0% 30.9% 24.1% 52.0% 61.3% Long - Lived Impairment Charges 1.0 - - - 1.4 1.4 - - y/y 33.8% - - (100%) 100% 49.3% - - Total $92.3 $ 22.8 $23.6 $ 23.5 $ 29.1 $98.9 $ 28.7 $27.7 y/y 3.6% (6.4%) 0.7% 1.3% 36.1% 7.2% 26.2% 17.1% Investment Mode Steady State
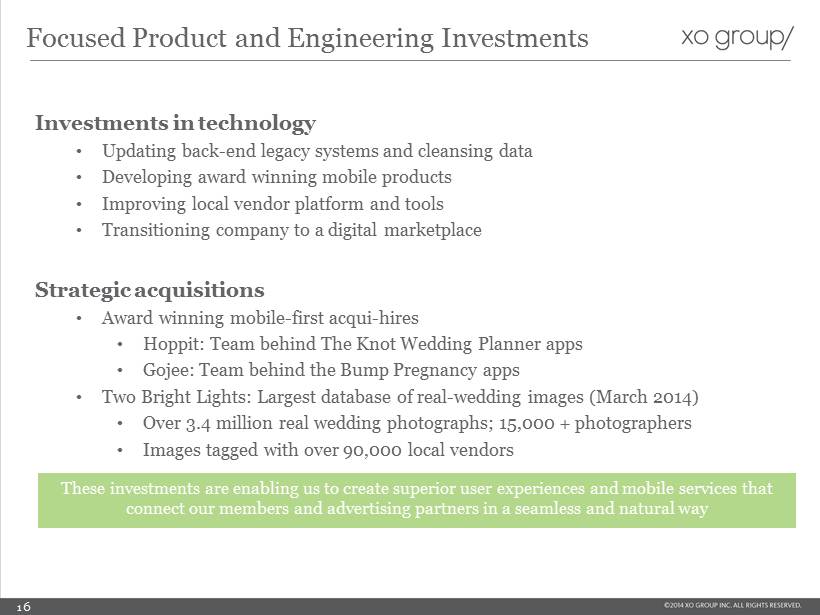
Investments in technology • Updating back - end legacy systems and cleansing data • Developing award winning mobile products • Improving local vendor platform and tools • Transitioning company to a digital marketplace Strategic acquisitions • Award winning mobile - first acqui - hires • Hoppit : Team behind The Knot Wedding Planner apps • Gojee : Team behind the Bump Pregnancy apps • Two Bright Lights: Largest database of real - wedding images (March 2014) • Over 3.4 million real wedding photographs; 15,000 + photographers • Images tagged with over 90,000 local vendors These investments are enabling us to create superior user experiences and mobile services that connect our members and advertising partners in a seamless and natural way Focused Product and Engineering Investments 16

Leadership Team 17 Mike Steib Chief Executive Officer • Appointed CEO of XO Group March 2014; joined July 2013 • CEO at Vente - Privee USA (2011 - 2013) • MD Emerging Platforms ; Google Inc. (2007 - 2011) • General Manager at NBC Universal • Joined XO Group in Nov. 2013 • MD at Allen & Co (2007 - 2013) • VP Business Development at Symbol Technologies ( 2003 – 2007) • Executive Director and Senior Equity Analyst at Morgan Stanley Gillian Munson Chief Financial Officer Kristin Savilia EVP Local Enterprise • Joined XO Group in July 2005 (EVP of Local Enterprise since 2010 ) • Executive Director of Bridal and Gift Registry at Linens ’n Things (1999 - 2005) • Cofounder; Returned to XO 2012 • Systems & operations consultant to the iCC division of Group Commerce (2012) • VP, General Manager of Interactive at United Media ( 2007 - 2011) Rob Fassino Chief Product Officer & Co - Founder • Chief Technology Officer since February 2010 • Cofounder and CEO of City24/7 LLC from ( 2006 – 2008), where he remains a member of the Advisory Board • Chief Technology Officer of the Interpublic Group of Companies (IPG) Nic Di Iorio Chief Technology Officer • Joined XO Group in February 2014 • Spent 12 years at Viacom Inc., in senior sales roles at Nickelodeon and MTV Networks International Jennifer Garrett EVP National Enterprise • Joined XO Group in March 2014 • CEO of Vente - Privee USA , where sales doubled in 2013 under her management • Held senior - level positions at AOL in strategy and operations, and at NBC Universal Katherine Wu Brady EVP Registry & e - Commerce • Joined XO Group in August 2014 • CMO, AOL Brand Group (June 2013 - July 2014) • VP, Marketing of Bloomberg Mobile (Feb. 2011 – June 2013) • Director, Affiliate & Advanced Product Marketing of HBO including HBO GO (June 2004 - Feb 2011) Dhanusha Sivajee EVP Marketing • XO Co - founder and Chief Content Officer • In 2008, Roney was named one of Crain’s New York “ 40 Under 40” Carly Roney Chief Content Officer & Co - Founder

□ Increased user & vendor engagement □ Forming partnerships with registry & e - commerce □ Revenue & adjusted EBITDA growth Road Signs of Success 18

Financials 19

$43.4 $49.9 $54.4 $26.6 $26.6 $27.2 $6.4 $6.2 $7.9 $25.4 $21.4 $18.4 $22.4 $25.1 $25.8 2011 Revenue 2012 Revenue 2013 Revenue Local Online National Online Registry eCommerce Publishing/Other $ 124.3 $ 129.1 $ 133.8 Solid Financial Foundation $21.4 $25.5 $ 26.7* 2011 2012 2013 $12.4 $22.5 $16.3 2011 2012 2013 *excludes incremental expenses please see non - GAAPF reconciliation slide for more details 2013 FCF y/y decrease driven by an increase in capital expenditures and a lower cash flow from operations Adj. EBITDA ($MM ) Free Cash Flow (FCF) ($MM) $MM 20
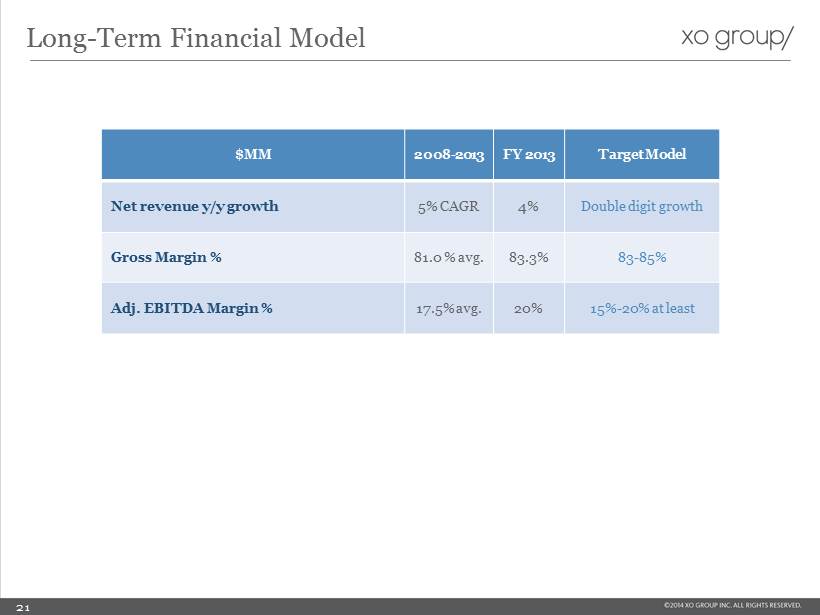
Long - Term Financial Model $MM 2008 - 2013 FY 2013 Target Model Net revenue y/y growth 5% CAGR 4% Double digit growth Gross Margin % 81.0 % avg. 83.3% 83 - 85% Adj. EBITDA Margin % 17.5% avg. 20% 15% - 20% at least 21

Summary Income Statement ($M) 3 months ended 06/30/14 3 months ended 06/30/13 Revenue $38.3 $37.0 Gross Profit $32.3 $30.0 Margin 84.2% 81.1% Operating Income $4.5 $6.4 Net Income $3.0 $4.1 Wgt. Avg. FD Shares 25.2 25.5 Earnings per Share (FD) $0.12 $0.16 Q2 2014 Financial Performance 22

Balance Sheet and Capital Allocation Priorities Summary Balance Sheet ( $M) 06/30/2014 Cash & ST equivalents $79.4 Other assets 116.9 Total assets $196.3 Total debt $0 Other liabilities 38.0 Total stockholders‘ equity 158.3 Total liabilities & stockholders’ equity $196.3 23 • Internal investments (operating expense) - 12 - 18 month investment time frame (started Q4’13) • Strategic acquisitions and investments - Assets that accelerate marketplace transformation • Opportunistic stock buybacks - $20 million authorization; used ~$600k during first half of 2014

Investment Opportunity Leader in Attractive Market • #1 o nline wedding property; growing baby property • Replenishing audience in an attractive demographic • Strong multi - platform brand built over 18 years Solid Financial Foundation • Diversified revenue streams • Healthy margin capability • Balanced approach to capital allocation 24 Strategic Transformation Underway • Evolving into a digital marketplace • Reinvesting in business and reinvigorating our product roadmap • Rigorous examination of underperforming/non - core businesses • Experienced management team focused on execution

Questions? Contact ir@xogrp.com 25

Non - GAAP Reconciliations 2011 - 2013 26
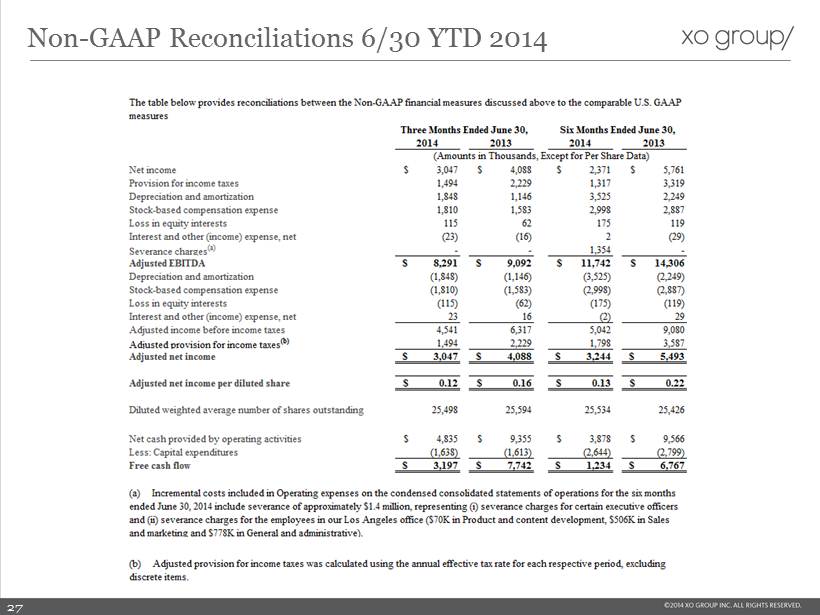
Non - GAAP Reconciliations 6/30 YTD 2014 27