Attached files
| file | filename |
|---|---|
| 8-K - FORM 8-K - WCI Communities, Inc. | d765566d8k.htm |
| EX-99.1 - EARNINGS PRESS RELEASE ISSUED BY THE COMPANY ON AUGUST 5, 2014. - WCI Communities, Inc. | d765566dex991.htm |
 WCI
Communities Second
Quarter
2014
-
Earnings
Conference
Call
August 5, 2014
Exhibit 99.2 |
 2
2
Disclosure Statement
This presentation contains forward-looking statements. All statements that are
not statements of historical fact, including statements about the
Company’s beliefs and expectations, are forward-looking statements within the meaning of the federal securities laws, and
should be evaluated as such. Forward-looking statements include information
concerning the Company’s future goals, expected growth, market
conditions and outlook (including the estimates, forecasts, statements and projections relating to Florida or national
markets
prepared
by
John
Burns
Real
Estate
Consulting),
expected
liquidity
and
possible
or
assumed
future
results
of
operations,
including descriptions of its business plan and strategies. These
forward-looking statements may be identified by the use of such
forward-looking
terminology,
including
the
terms
“believe,”
“estimate,”
“project,”
“anticipate,”
“expect,”
“seek,”
“predict,”
“contemplate,”
“continue,”
“possible,”
“intend,”
“may,”
“might,”
“will,”
“could,”
“would,”
“should,”
“forecast,”
or “assume”
or, in each case, their negative,
or other variations or comparable terminology.
For more information concerning factors that could cause actual results to differ
materially from those contained in the forward-looking statements,
please
refer
to
“Risk
Factors”
in
Item
1A
of
Part
I
of
our
Annual
Report
on
Form
10-K
filed
by
the
Company
with
the
Securities and Exchange Commission on February 27, 2014 and subsequent filings by
the Company. The Company bases these forward-looking statements or
projections on its current expectations, plans and assumptions that it has made in light of its experience
in the industry, as well as its perceptions of historical trends, current
conditions, expected future developments and other factors it believes are
appropriate under the circumstances and at such time. As you read and consider this presentation, you should
understand that these statements are not guarantees of performance or results. The
forward-looking statements and projections are subject to and involve
risks, uncertainties and assumptions and you should not place undue reliance on these forward-looking
statements or projections. Although the Company believes that these
forward-looking statements and projections are based on reasonable
assumptions at the time they are made, you should be aware that many factors could affect the Company’s actual financial
results or results of operations and could cause actual results to differ
materially from those expressed in the forward-looking statements
and
projections.
The
Company
undertakes
no
obligation
to
update
or
revise
any
forward-looking
statements,
whether
as
a
result of new information, future events or otherwise. If the Company does update
one or more forward-looking statements, there should
be
no
inference
that
it
will
make
additional
updates
with
respect
to
those
or
other
forward-looking
statements.
In addition to the financial measures prepared in accordance with U.S. generally
accepted accounting principles (“GAAP”), this presentation
contains the non-GAAP financial measures EBITDA, Adjusted EBITDA and Adjusted gross margin from homes
delivered.
The reasons for the use of these measures, a reconciliation of these measures to
the most directly comparable GAAP measures and other information relating to
these measures are included below in the appendix to this presentation. |
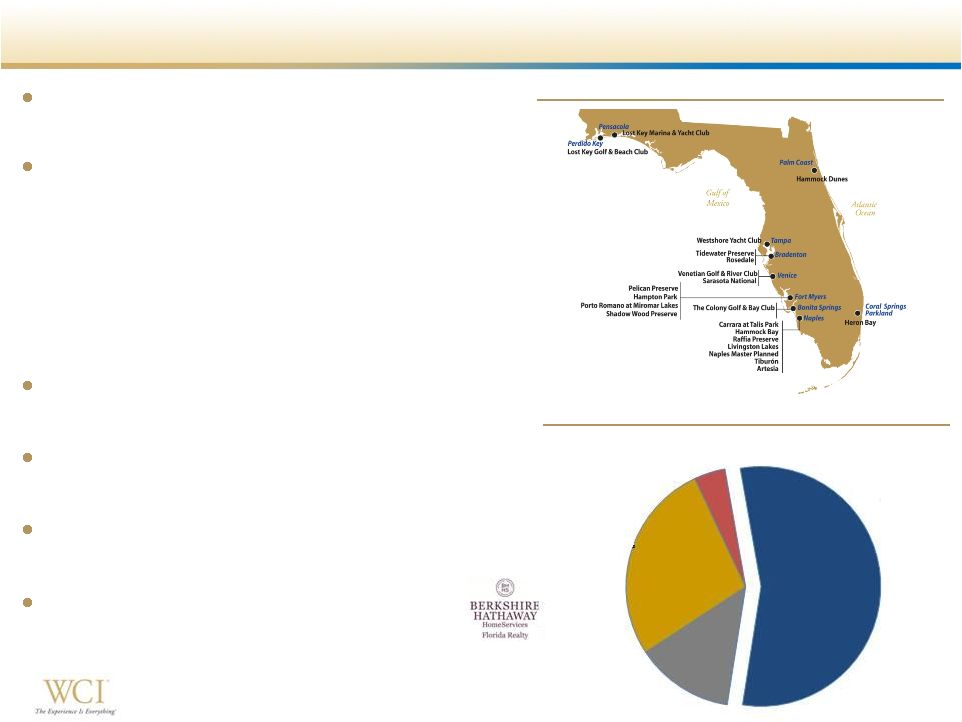 WCI
Communities at a Glance Lifestyle community developer and luxury
homebuilder throughout Florida
Target move-up, second-home and active
adult customers
–
High
average
selling
prices
-
$426k
on
2Q14
deliveries
–
High proportion of cash buyers -
55% in
2Q14; 59% year to date
•
Only 4% of buyers financed more than 80%
–
Low cancellation rate –
3.0% in 2Q14
Approximately 10,300 home sites owned
and controlled as of June 30, 2014
Conservative balance sheet -
$202 million
cash
Significant year-over-year Homebuilding
growth
Complementary and value-add Real
Estate Services & Amenities businesses
Geographic Footprint
Loan
to
Value
Percentage
–
2Q14
Deliveries
Buyer Profile with Low Reliance on Financing
Cash
55.2%
LTV 1
-64%
13.3%
LTV 65-80%
27.3%
LTV >80%
4.2%
3 |
 Note:
Florida
as
referenced
to
John
Burns
Real
Estate
Consulting
and
in
the
charts
represents
a
compilation
of the major FL markets
(1)
US Census Bureau
(2)
John Burns Real Estate Consulting, July 2014
(3)
National
Association
of
Realtors
&
Florida
Realtors’
®
Florida
Housing
Market
statewide
data
reports
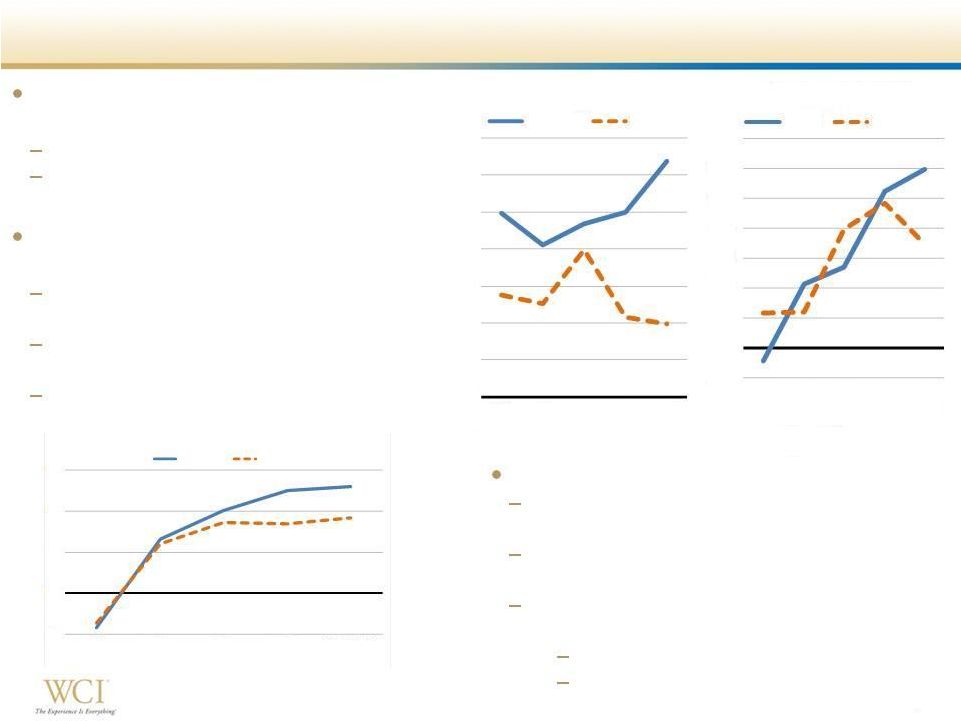
Compelling Florida Real Estate Market Opportunity
Florida building permits YTD 2014 -
2
nd
highest in the nation
(1)
2013 permits still ~70% off peak
LTM single family permit growth of
11.8%, compared to -0.8% nationally
(2)
Florida population growth -
3rd
highest growth state
(1)
Household growth rate three times the
national rate
(2)
Job growth rate 40% higher than the
national rate
(2)
Median new home price increase nearly
double the national rate
(2)
Florida resale market remains strong
(3)
2Q14 traditional single family and condo
transactions up 8.1% from 2Q13
National existing home sales down 4.6%
in 2Q14 vs. 2Q13
June 2014 median prices up compared to
June 2013
Single family median price up 5.2%
Condo median price up 8.5%
0.0%
0.2%
0.4%
0.6%
0.8%
1.0%
1.2%
1.4%
2010
2011
2012
2013
May 2014
TTM
Household Growth -
YOY %
Change
Florida
National
-2.0%
0.0%
2.0%
4.0%
6.0%
8.0%
10.0%
12.0%
14.0%
2010
2011
2012
2013
May
2014
TTM
Change
Florida
National
-1%
0%
1%
2%
3%
2010
2011
2012
2013
May 2014 TTM
Job Growth -
YOY % Change
Florida
National
Source: DataQuick(Metro, Attached & Detached Homes, Weighted
Averages), Census (National, SF only,*2014-05 is SA) , John Burns
R.E.
Consulting,
Pub:
Jul
-14.
Source: Moody's Analytics, John Burns R.E. Consulting, Pub: Jul-14
4
Source: BLS, John Burns R.E. Consulting - forecasts, *2014 - 05 for national is SA Median New Home Price -
YOY % |
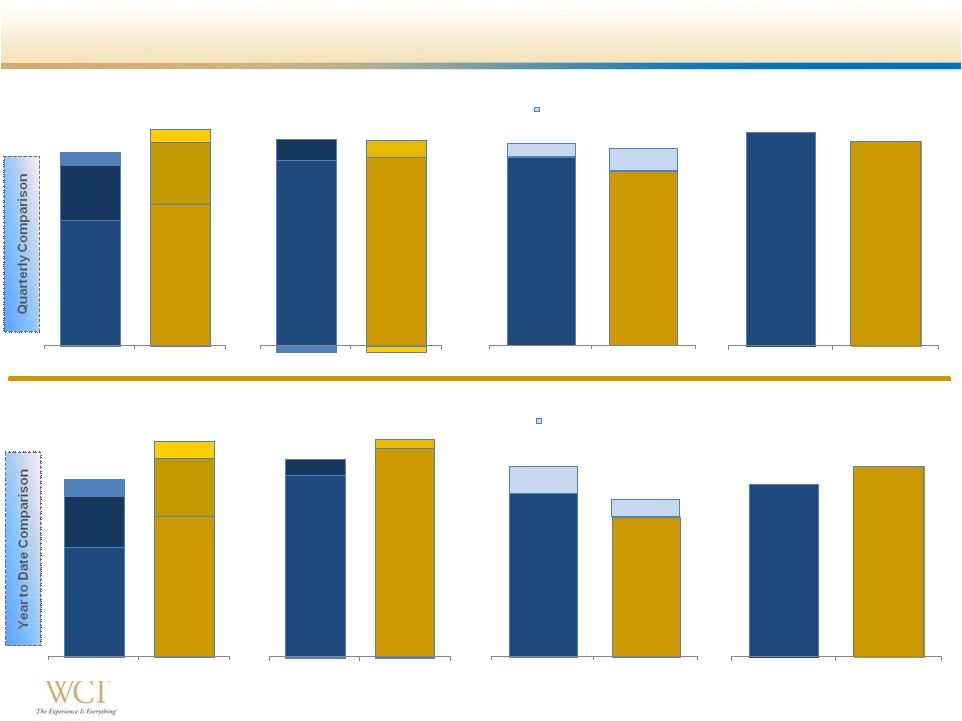
 5
5
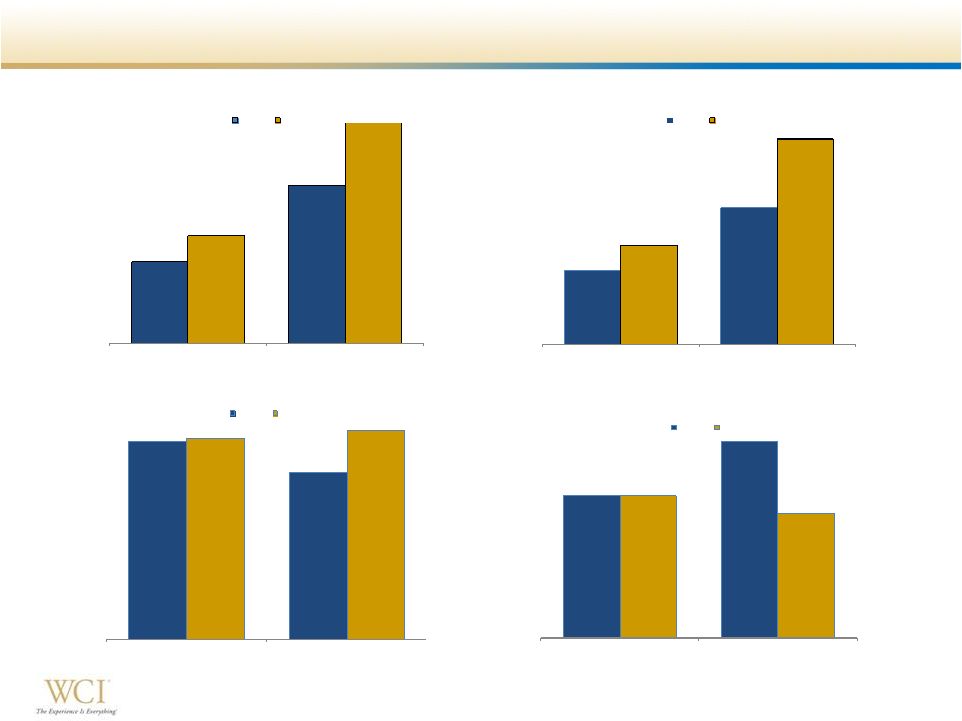
Continued New Order Growth ($ in thousands)
147
287
195
400
2Q
YTD
New Orders
2013
2014
+33%
+39%
3.1%
3.7%
3.1%
2.9%
2Q
YTD
New Orders
Incentives % of Base Price
2013
2014
-80 bps
$70,072
$128,936
$93,606
$194,749
2Q
YTD
Contract Value of New Orders
2013
2014
+34%
+51%
$477
$449
$480
$487
2Q
YTD
New Orders ASP
2013
2014
+1%
+9% |
 6
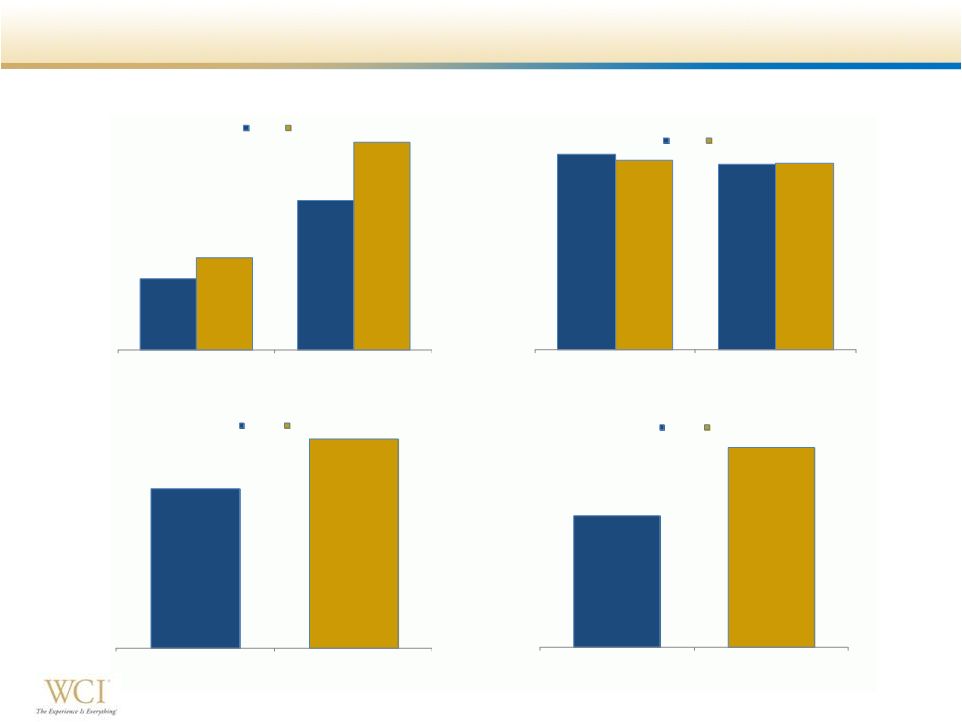
Continued Deliveries and Backlog Growth ($ in
thousands) 122
201
143
260
2Q
YTD
Deliveries
2013
2014
+17%
+29%
$441
$418
$426
$419
2Q
YTD
Average Selling Price per Delivered
Home
2013
2014
-3%
341
433
2Q13
2Q14
Backlog Units
2Q13
2Q14
+27%
$159,837
$229,983
2Q13
2Q14
Contract Value of Backlog
2Q13
2Q14
+44%
ASP -
$469
ASP -
$531
6 |
 7
7
HB
$16.8
HB
$17.0
RES
$1.9
RES
$1.5
AM
$(0.6)
AM
$(0.5)
$18.1
$18.0
2Q13
2Q14
Gross Margin
($ in millions)
Executing on the Long Term Growth Strategy
(1)
Measured as a percentage of total homebuilding revenues
(2)
Measured as a percentage of total revenues
HB
$84.3
HB
$108.9
RES
$40.4
RES
$45.0
AM
$12.4
AM
$12.9
$137.1
$166.7
YTD 2013
YTD 2014
Revenues
($ in millions)
$14.4
$15.9
YTD 2013
YTD 2014
Adjusted EBITDA
(2)
($ in
millions)
10.5%
9.5%
$10.7
$10.2
2Q13
2Q14
Adjusted EBITDA
(2)
($ in
millions)
12.8%
11.0%
HB
$53.8
HB
$60.9
RES
$24.0
RES
$26.5
AM
$5.6
AM
$5.5
$83.3
$93.0
2Q13
2Q14
Revenues
($ in millions)
19.8%
17.7%
2.4%
1.5%
22.2%
19.3%
YTD 2013
YTD 2014
SG&A %
(1)
Non-Cash Incentive Comp
17.0%
16.1%
0.8%
1.4%
17.8%
17.5%
2Q13
2Q14
SG&A %
(1)
Non-Cash Incentive Comp
HB
$26.6
HB
$30.5
RES
$2.3
RES
$1.4
AM
$(0.2)
AM
$(0.0)
$28.7
$31.8
YTD 2013
YTD 2014
Gross Margin
($ in millions)
Note: Some totals may not foot due to rounding |
 8
8
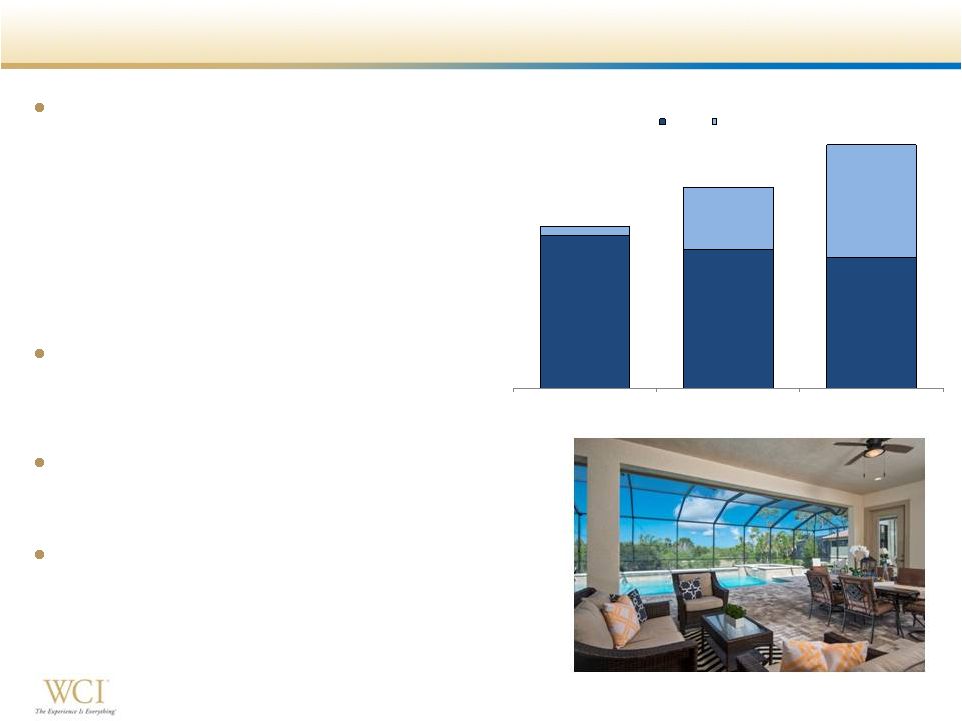
Land Acquisition -
Positioning for Future Growth
Closed on approximately 1,300 home
sites in the quarter for approximately $70
million
–
Master planned communities in Naples,
Fort Myers and Bradenton
–
Includes approximately 200 finished lots
and another 230 substantially developed
–
Represents eight potential incremental
neighborhoods
Contracted for property with a potential
additional 1,400 home sites
–
Inclusive of new master planned
communities in Fort Myers and Jacksonville
Actively pursuing additional land
acquisition opportunities throughout
Florida
Land portfolio now totals approximately
10,300 owned and controlled home sites
–
26% increase from the approximately 8,200
owned and controlled home sites in June
2013
6,483
5,872
5,564
379
2,635
4,770
6,862
8,507
10,334
4Q12
4Q13
2Q14
Owned and Controlled Home Sites
Legacy
New Acquisitions |
 9
9
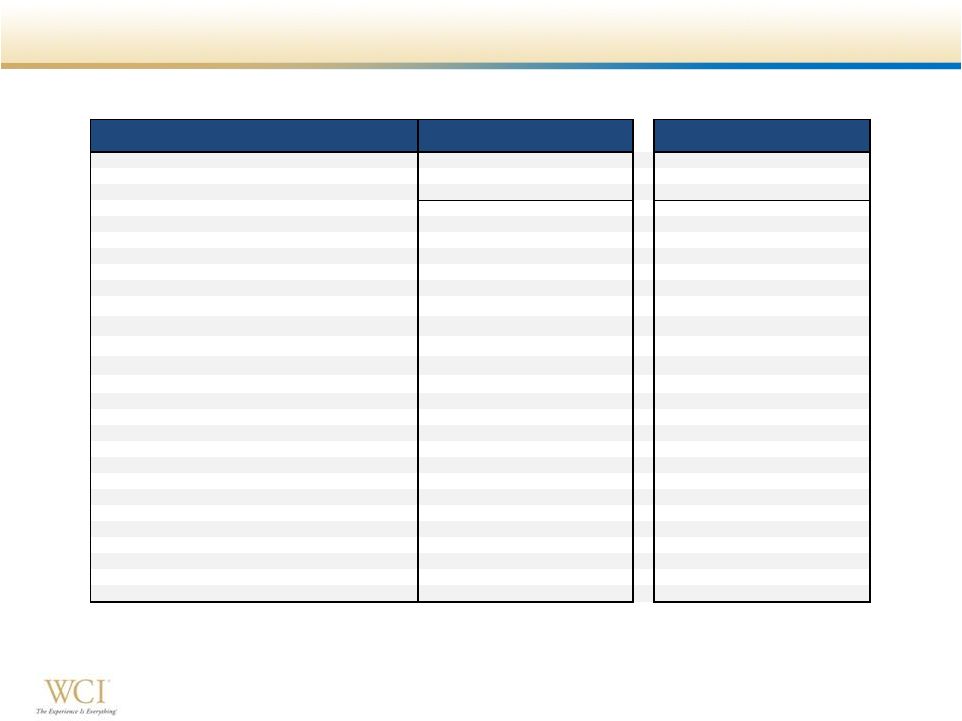
Selected Second Quarter & YTD Operating Results
(1)
Some variance percentage’s have been rounded to tie to second quarter 2014
Form 10-Q. $ in thousands, except per share amounts
2014
2013
Variance %
2014
2013
Variance %
Homebuilding revenues
60,918
$
53,761
$
13.2%
108,913
$
84,252
$
29.2%
Real estate services revenues
26,499
23,962
10.4%
44,962
40,391
11.4%
Amenities revenues
5,542
5,614
-1.8%
12,864
12,428
4.0%
Total revenues
92,959
83,337
11.6%
166,739
137,071
21.6%
Total gross margin
18,007
18,094
-0.5%
31,841
28,706
10.9%
Income tax (expense) benefit
(2,974)
-
NM
(4,634)
85
NM
Net income attributable to common shareholders
4,338
$
8,206
$
-47.1%
5,818
$
8,792
$
-33.8%
Earnings per share - diluted
0.17
$
0.45
$
-63.6%
0.22
$
0.49
$
-54.4%
Weighted average number of shares outstanding - diluted
26,278
18,084
45.3%
26,255
18,074
45.3%
SG&A expenses as a percent of Homebuilding revenues
17.5%
17.8%
-30 bps
19.3%
22.2%
-290 bps
Non-cash stock based compensation included in SG&A
1.4%
0.8%
+60 bps
1.5%
2.4%
-90 bps
Adjusted gross margin percentage
30.1%
33.3%
-320 bps
30.1%
33.5%
-340 bps
Adjusted EBITDA
10,235
$
10,687
$
-4.2%
15,893
$
14,404
$
10.3%
Homes delivered
143
122
17.2%
260
201
29.4%
Average selling price per home delivered
426
$
441
$
-3.4%
419
$
418
$
0.2%
New orders
195
147
32.7%
400
287
39.4%
Average selling price per new order
480
$
477
$
0.6%
487
$
449
$
8.5%
Backlog units
433
341
27.0%
Average selling price per backlog unit
531
$
469
$
13.2%
Three Months Ended June 30,
Six Months Ended June 30, |
 10
10
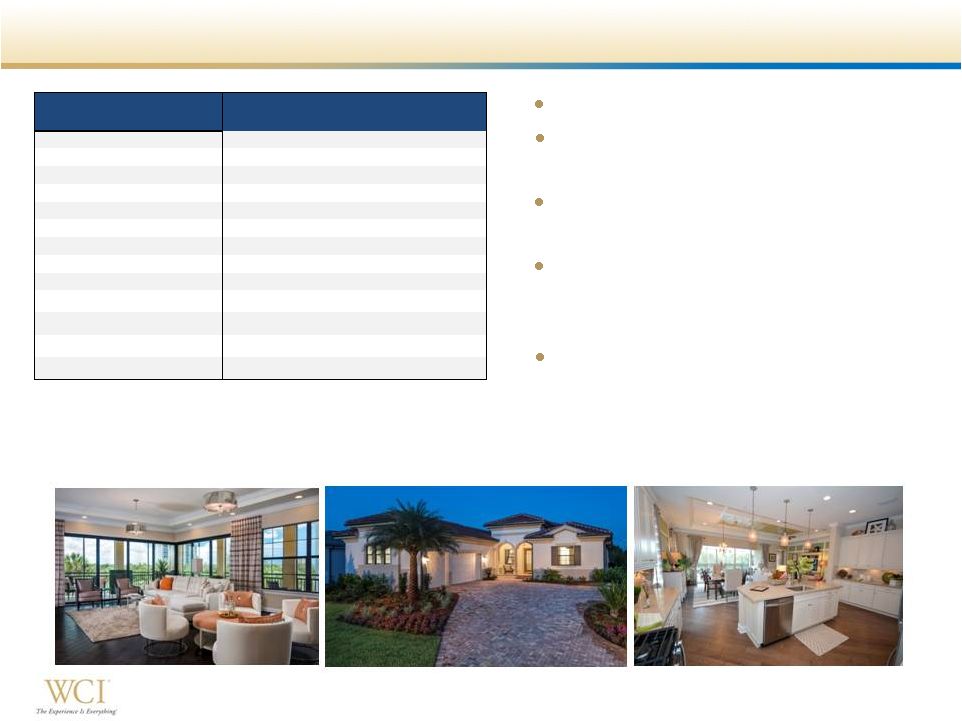
Strong Balance Sheet with Ample Liquidity
Conservative balance sheet
Undrawn $75 million revolving
credit facility
Majority of land basis written down
in 2009
Issued additional $50 million of
principal amount Senior Notes due
2021
Sold CDD Bonds in April 2014
–
Proceeds of $22.7 million
–
Acquired from Sarasota National
community purchase in April 2013
(1)
Available liquidity includes the $75 million of borrowing capacity under a
four-year revolving credit facility and $8 million of borrowing capacity
available under a revolving credit facility with Stonegate Bank.
(2)
Net Debt represents total debt excluding premium less cash and cash equivalents;
capital represents net debt plus total equity.
$ in thousands
Cash & cash equivalents
201,542
$
213,352
$
Real estate inventories
384,662
280,293
Senior notes due 2021
250,000
200,000
Total equity
417,289
409,864
Total capitalization
667,289
609,864
Availabile liquidity
(1)
284,542
296,352
Debt to capitalization
37.5%
32.8%
Net debt to capital
(2)
10.4%
NM
(Cash + inventory) / debt
2.34
2.47
June 30, 2014
December 31, 2013 |
 Key
Takeaways Fully integrated luxury homebuilder and
community developer
Complementary and strategic Amenities and
Real Estate Services businesses
Florida real estate market remains strong
Continued growth
–
Orders & deliveries
–
Revenues & Adjusted EBITDA
–
Neighborhood counts
Actively pursuing land acquisition opportunities
Leverage the scalable operating platform
Experienced and talented team
11
Focus on move-up, second-home and active
adult buyers |
 12
Appendix
12 |
 13
13
Reconciliation of Non-GAAP Financial Measures
Adjusted Gross Margin from Homes Delivered
Reconciliation of Non-GAAP Financial Measures
In addition to the results reported in accordance with U.S. generally accepted
accounting principles (“GAAP”), we have provided information in this
presentation relating to adjusted gross margin from homes delivered, EBITDA and
Adjusted EBITDA (as defined below). Adjusted Gross Margin from Homes
Delivered We calculate adjusted gross margin from homes delivered by
subtracting the gross margin from land and home sites, if any, from Homebuilding
gross
margin
to
arrive
at
gross
margin
from
homes
delivered.
Adjusted
gross
margin
from
homes
delivered
is
calculated
by
adding
asset
impairments, if any, and capitalized interest in cost of sales to gross margin from
homes delivered. Management uses adjusted gross margin from homes
delivered to evaluate operating performance in our Homebuilding segment and in making strategic decisions regarding sales price,
construction and development pace, product mix and other operating decisions.
We believe that adjusted gross margin from homes delivered is relevant and
useful to investors and other interested parties for evaluating our comparative operating performance from period to period and among
companies
within
the
homebuilding
industry
as
it
is
reflective
of
overall
profitability
during
any
given
reporting
period.
This
measure
is
considered
a
non-GAAP financial measure and should be considered in addition to, rather than
as a substitute for, the comparable GAAP financial measures when evaluating
our operating performance. Although other companies in the homebuilding industry report similar information, the methods used by such
companies
may
differ
from
our
methodology
and,
therefore,
may
not
be
comparable.
We
urge
investors
and
other
interested
parties
to
understand
the
methods
used
by
other
companies
in
the
homebuilding
industry
to
calculate
gross
margins
and
any
adjustments
to
such
amounts
before
comparing our measures to those of such other companies.
The table below reconciles adjusted gross margin from homes delivered to the most
directly comparable GAAP financial measure, Homebuilding gross margin, for
the periods presented herein. 2014
2013
2014
2013
($ in thousands)
Homebuilding gross margin
17,049
$
16,788
$
30,496
$
26,623
$
Less: gross margin (loss) from land and home sites
-
(34)
-
35
Gross
margin from homes delivered 17,049
16,822
30,496
26,588
Add: capitalized interest in cost of
sales 1,282
1,070
2,267
1,563
Adjusted gross margin from homes
delivered 18,331
$
17,892
$
32,763
$
28,151
$
Gross margin from homes delivered as a percentage
of revenues from homes delivered
28.0%
31.3%
28.0%
31.6%
Adjusted gross margin from homes delivered as a
percentage of revenues from homes delivered
30.1%
33.3%
30.1%
33.5%
Three Months Ended June 30,
Six Months Ended June 30, |
 14
14
Reconciliation of Non-GAAP Financial Measures
EBITDA and Adjusted EBITDA (continued)
Adjusted
EBITDA
measures
performance
by
adjusting
net
income
(loss)
attributable
to
common
shareholders
of
WCI
Communities,
Inc.
to
exclude, if any, interest expense, capitalized interest in cost of sales, income
taxes, depreciation (‘‘EBITDA’’), preferred stock dividends, income
from discontinued operations, other income, stock-based and other non-cash
long-term incentive compensation expense, asset impairments and
expenses
related
to
early
repayment
of
debt.
We
believe
that
the
presentation
of
Adjusted
EBITDA
provides
useful
information
to
investors
and
other interested parties regarding our results of operations because it assists
those parties and us when analyzing and benchmarking the performance and
value of our business. We also believe that Adjusted EBITDA is useful as a measure of comparative operating performance
from
period
to
period
and
among
companies
in
the
homebuilding
industry
as
it
is
reflective
of
changes
in
pricing
decisions,
cost
controls
and
other
factors
that
affect
operating
performance,
and
it
removes
the
effect
of
our
capital
structure
(such
as
preferred
stock
dividends
and
interest
expense),
asset
base
(primarily
depreciation),
items
outside
of
our
control
(primarily
income
taxes)
and
the
volatility
related
to
the
timing
and
extent of non-operating activities (such as discontinued operations and asset
impairments). Accordingly, we believe that this measure is useful for
comparing
general
operating
performance
from
period
to
period.
Other
companies
may
define
Adjusted
EBITDA
differently
and,
as
a
result,
our
measure of Adjusted EBITDA may not be directly comparable to Adjusted EBITDA of
other companies. Although we use Adjusted EBITDA as a financial
measure
to
assess
the
performance
of
our
business,
the
use
of
Adjusted
EBITDA
is
limited
because
it
does
not
include
certain
material
costs,
such
as
interest
and
income
taxes,
necessary
to
operate
our
business.
Adjusted
EBITDA
and
EBITDA
should
be
considered
in
addition
to,
and
not
as
substitutes
for,
net
income
(loss)
in
accordance
with
GAAP
as
a
measure
of
performance.
Our
presentation
of
EBITDA
and
Adjusted
EBITDA should not be construed as an indication that our future results will be
unaffected by unusual or nonrecurring items. Our EBITDA-based
measures
have
limitations
as
analytical
tools
and,
therefore,
investors
and
other
interested
parties
should
not
consider
them
in
isolation
or
as
substitutes
for
analyses
of
our
results
as
reported
under
GAAP.
Some
such
limitations
are:
they do not reflect the impact of earnings or charges resulting from matters that
we consider not to be indicative of our ongoing operations; they are not
adjusted for all non-cash income or expense items that are reflected in our consolidated statements of cash flows;
they do not reflect the interest expense necessary to service our debt; and
Because
of
these
limitations,
our
EBITDA-based
measures
are
not
intended
to
be
alternatives
to
net
income
(loss),
indicators
of
our
operating
performance,
alternatives
to
any
other
measure
of
performance
in
conformity
with
GAAP
or
alternatives
to
cash
flow
provided
by
operating
activities as measures of liquidity. Investors and other interested parties
should therefore not place undue reliance on our EBITDA-based measures
or ratios calculated using those measures. Our GAAP-based measures can be found in our unaudited consolidated financial
statements in Item 1 of the Quarterly Report on Form 10-Q that we plan to file
with the Securities and Exchange Commission on or before August 8,
2014. other
companies
in
our
industry
may
calculate
these
measures
differently
than
we
do,
thereby
limiting
their
usefulness
as
comparative
measures. |
 15
15
Reconciliation of Non-GAAP Financial Measures
EBITDA and Adjusted EBITDA
The table below reconciles EBITDA and Adjusted EBITDA to the most directly
comparable GAAP financial measure, net income attributable to
common
shareholders
of
WCI
Communities,
Inc.,
for
the
periods
presented
herein.
2014
2013
2014
2013
($ in thousands)
Net income attributable to common
shareholders of WCI Communities, Inc.
4,338
$
8,206
$
5,818
$
8,792
$
Interest expense
187
729
685
1,614
Capitalized interest in cost of
sales (1) 1,282
1,070
2,267
1,563
Income taxes (2)
2,974
-
4,634
(85)
Depreciation
644
545
1,232
1,008
EBITDA
9,425
10,550
14,636
12,892
Preferred stock dividend (3)
-
700
-
700
Other income,
net (4) (63)
(1,011)
(428)
(1,220)
Stock-based and other non-cash
long-term incentive compensation expense (5)
873
448
1,685
2,032
Adjusted EBITDA
10,235
$
10,687
$
15,893
$
14,404
$
Adjusted EBITDA margin
11.0%
12.8%
9.5%
10.5%
Three Months Ended June 30,
Six Months Ended June 30,
1)
Represents capitalized interest expensed in cost of sales on home deliveries and land and home site
sales. 2)
Represents the Company’s income taxes as reported in its unaudited consolidated
statements of operations.
3)
Represents a reduction in income available to common shareholders of WCI Communities, Inc. during the
three and six months ended June 30, 2013 pertaining to a payment of $0.7 million that we made
in April 2013 to purchase the one outstanding share of our Series B preferred stock. In accordance with Accounting Standards
Codification 260, Earnings Per Share, paragraph 10-S99-2, the difference between the
consideration transferred to our preferred stock shareholder and the corresponding book value
has been characterized as a preferred stock dividend in the Company’s unaudited consolidated statements of operations and deducted from
net income to arrive at net income attributable to common shareholders of WCI Communities, Inc. 4)
Represents the Company’s other income, net as reported in its unaudited consolidated statements
of operations.
5)
Represents expenses recorded in the Company’s unaudited consolidated statements of operations
related to its stock-based and other non-cash long-term incentive compensation
plans. |