Attached files
| file | filename |
|---|---|
| 8-K - 8-K - CAPITAL SENIOR LIVING CORP | d767461d8k.htm |
| EX-99.1 - EX-99.1 - CAPITAL SENIOR LIVING CORP | d767461dex991.htm |
 Capital Senior Living
Company Presentation
Exhibit 99.2 |
 2
Forward-Looking Statements
•
The forward-looking statements in this presentation are subject to certain risks
and uncertainties that could cause results to differ materially, including,
but not without limitation to, the Company’s ability to complete the
refinancing of certain of our wholly owned communities, realize the anticipated savings
related to such financing, find suitable acquisition properties at favorable terms,
financing, licensing, business conditions, risks of downturns in economic
conditions generally, satisfaction of closing conditions such as those
pertaining to licensures, availability of insurance at commercially reasonable
rates and changes in accounting principles and interpretations among others, and
other risks and factors identified from time to time in our reports filed
with the Securities and Exchange Commission •
The Company assumes no obligation to update or supplement forward-looking
statements in this presentation that become untrue because of new
information, subsequent events or otherwise. |
 3
Non-GAAP Financial Measures
•
Adjusted EBITDAR, Adjusted EBITDAR Margin, Adjusted Net Income and Adjusted CFFO are
financial measures of operating performance that are not calculated in
accordance with U.S. generally accepted accounting principles
(“GAAP”). Non-GAAP financial measures may have material limitations in that they
do
not
reflect
all
of
the
amounts
associated
with
our
results
of
operations
as
determined
in
accordance
with GAAP. As a result, these non-GAAP financial measures should not be
considered a substitute for, nor superior to, financial results and measures
determined or calculated in accordance with GAAP. The Company believes
that these non-GAAP measures are useful in identifying trends in day-to-day
performance because they exclude items that are of little or no significance to
operations and provide indicators to management of progress in achieving
optimal operating performance. In addition, these measures are used by many
research analysts and investors to evaluate the performance and the value of
companies in the senior living industry. The Company strongly urges you to
review the reconciliation of net income from operations to Adjusted EBITDAR
and Adjusted EBITDAR Margin and the reconciliation of net
loss
to
Adjusted
Net
Income
and
Adjusted
CFFO,
each
of
which
is
included
at
the
end
of
the
Company’s earnings releases, along with the Company’s consolidated balance
sheets, statements of operations, and statements of cash flows.
|
 4
Investment Highlights
•
Value leader in providing quality seniors housing and care at
reasonable prices
•
Well positioned to make meaningful gains in shareholder value
•
Substantially all private pay with strong cash flow generation
•
Industry benefits from need-driven demand, limited new supply and
improving housing market and economy
•
Achieving solid growth in revenue, occupancy, EBITDAR and CFFO
•
Executing on disciplined accretive growth initiatives through
acquisitions and conversions to higher levels of care
•
Solid balance sheet |
 5
Company Overview
•
Capital Senior Living operates 115 communities in geographically
concentrated regions with the capacity to serve 15,000 residents
Resident Capacity By State
Property Ownership Structure
Number of residents by State
Greater than 2,000
500 -
2,000
Less than 500
Leased
43%
Owned
57% |
 6
Resident Demographics at CSU Communities
•
Average age of resident: 85 years
•
Average age of resident moving in: 82 years
•
Average
stay
period:
2-3
years
•
Percent of female residents: 80%
•
Resident turnover is primarily attributed to death or need for
higher care |
 7
The Capital Advantage: Senior Living Options
•
Average 113 units per IL community with large common areas and
amenities
•
Supportive services, wellness programs, social, recreational and
educational events
•
Average monthly rate of $2,454
•
100% private pay
•
Average length of resident stay is 31 months
Independent
Living
–
51%
of
Resident
Capacity |
 8
The Capital Advantage: Senior Living Options
Assisted Living-
49% of Resident Capacity
•
Average length of resident stay is 24 months
•
Substantially all private pay
•
Average monthly rate of $3,940
•
Assistance with activities of daily living including medication
reminders, bathing, dressing and grooming
•
75% of communities offer AL
•
Average 65 units per community |
 9
The Capital Advantage: Need Driven Demand
Source: 2010 Census Summary File 1 and U.S. Census Bureau, Population Division
U.S.
Seniors
Population
Trends
(75+
years
old)
15,000
17,500
20,000
22,500
25,000
27,500
30,000
32,500
35,000
2010
2015
2020
2025
2030
•
Current 6.9% penetration rate implies demand growth of 40,000 units per year
•
Only 1.3 million units serving a population of 18.9 million seniors
U.S. population 75+ years old is estimated to be 12% of the population by
2030 compared to 6% in 2012 |
 10
The Capital Advantage: Limited New Supply
Source: NIC MAP Trends All Markets Q2 14 |
 11
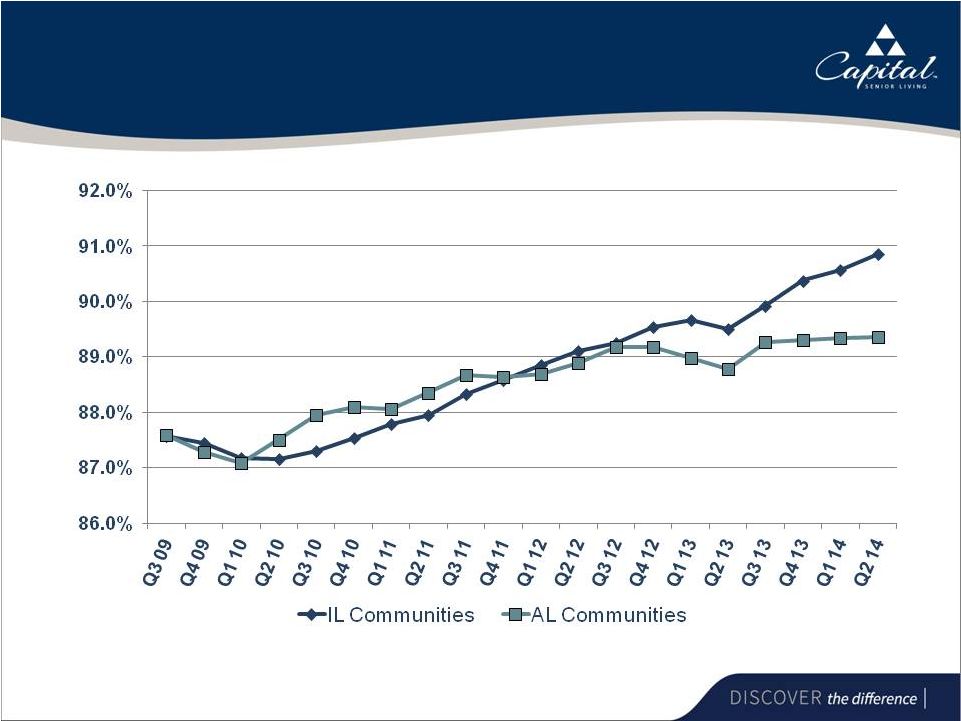
The Capital Advantage: Senior Housing Occupancy Trends
Source: NIC MAP Trends All Markets Q2 14 |
 12
The Capital Advantage: Competitive Strengths
•
Value leader in geographically concentrated regions
•
Experienced on-site, regional and corporate management
•
Larger company economies of scale and proprietary systems
that yield operating efficiencies in highly fragmented industry
•
Solid reputation in industry and 95% resident satisfaction
•
Employer of choice
•
Solid balance sheet
•
Strong Board of Directors |
 13
The Capital Advantage: Strategy
•
Focus on our core strengths
•
Capitalize on competitive strengths within each of our regions
to maximize the cash flow generated by our communities and
our operations
•
Capitalize on the fragmented nature of the senior living
industry to strategically aggregate local and regional operators
in geographically concentrated regions
•
Increase levels of care through conversions to Assisted Living
or Memory Care units
•
Attract and retain the best talent in the senior living industry
|
 2014
Business Plan •
Focused on Operations, marketing and growth to enhance
shareholder value through:
•
Organic growth
•
Proactive expense Management
•
Accretive acquisitions, unit conversions and community
refurbishment projects
•
Utilization of technology
14 |
 15
2014 Business Plan: Organic Growth
•
Increase average rents
•
Each 3% increase generates $10.8M of revenue
•
Improve occupancies
•
Each 1% generates $4.0M of revenue, $2.8M of EBITDAR and $0.06 per
share of CFFO
•
Convert units to higher levels of care
•
Cash flow enhancing renovations and refurbishments
•
New branding strategy, eMarketing and website enhancements
•
Implement software programs to optimize care plans and level of
care charges |
 16
Solving to Achieve 90% Occupancy
Q2 2014
(1)
IL
AL
Total
Total Units
5,898
5,231
11,129
Occupied Units
5,036
4,689
9,725
Occupancy %
85.4%
89.6%
87.4%
Planned IL to AL Conversions
IL
AL
Units
(360)
360
At 90% Stabilized
Occupancy
324
Note: Conversions are subject to customary approvals
Occupancy After Conversions
Stabilize
IL
AL
Total
Total Units
5,538
5,591
11,129
Occupied Units
5,036
5,013
10,049
Occupancy %
90.9%
89.7%
90.3%
(1)
Excludes CCRC’s and Autumn Glen |
 17
Canton Regency Remodel Concepts
Concept Atrium
Existing Atrium
Concept Bistro
Concept Internet Cafe |
 18
2014 Business Plan: External Growth
•
Strategic acquisitions of high quality senior living communities
to
enhance
geographic
concentrations
–
16.3%
cash
on
cash
returns
*Based on share count at time of
transaction (in millions except number of communities)
2011
2012
2013
Q2 14 YTD
Combined
Purchase Price
$83.4
$181.3
$150.4
$132.1
$547.2
Communities
7
17
11
6
41
Units
551
1,367
881
695
3,494
Debt
$59.3
$129.5
$112.3
$98.9
$400.0
Equity
$24.1
$51.8
$38.1
$33.2
$147.2
First Year Revenue
$21.3
$49.1
$35.1
$30.6
$136.1
First Year EBITDAR
$7.3
$19.1
$14.1
$11.8
(1)
$52.3
First Year Cash Flow
from Operations
(CFFO)
$3.4
$9.1
$5.8
$5.7
(1)
$24.0
First Year CFFO per
share*
$0.13
$0.34
$0.20
$0.19
(1)
$0.86
(1)
Net of $0.9 million of management fees related to communities previously managed under a JV
agreement |
 19
Operating Performance
•
Revenue and EBITDAR growth
•
EBITDAR increased 125.2% on an 95.0% increase in revenue
•
EBITDAR margin increased from 29.9% in Q1 2010 to 35.6% in Q2
2014
*
As adjusted in Q4 2013 earnings release |
 20
Comparative Operating Metrics
(1)
As adjusted in press releases
Q2 14
YTD
2013
2012
%
Increase
Total Revenues
$ 185.3
$ 350.4
$ 310.5
12.8%
Adjusted EBITDAR
(1)
$ 62.9
$ 119.6
$ 110.0
8.7%
% Margin
(1)
35.1%
34.9%
35.4%
Adjusted CFFO
(1)
$ 18.1
$ 42.6
$ 37.3
14.2%
Adjusted CFFO Per Share
(1)
$ 0.64
$1.53
$1.36 |
 21
Balance Sheet
•
As of June 30, 2014 (in millions)
ASSETS
Cash and Securities
$ 39.4
Other Current Assets
24.8
Total Current Assets
64.2
Fixed Assets
732.6
Other Assets
44.1
TOTAL ASSETS
$ 840.9
LIABILITIES & EQUITY
Current Liabilities
$ 52.8
Long-Term Debt
580.7
Other Liabilities
59.8
Total Liabilities
693.3
Stockholders’
Equity
147.6
TOTAL LIABILITIES &
EQUITY
$ 840.9 |
 22
Investment Highlights
•
Value leader
in geographically concentrated regions
•
Substantially
•
Need-driven
demand,
limited
new
supply
and
improving
housing
market
and
economy
•
Experienced
management
team
with
demonstrated
ability
to
operate, acquire and create shareholder value
•
Accretive
acquisitions
•
Conversions
to
higher
levels
of
care
with
significant
revenue
and
cash flow growth
•
Strong
cash
flow
generation
•
Solid balance sheet
in
highly
fragmented
industry
all
private
pay |
 Capital Senior Living
Company Presentation |