Attached files
| file | filename |
|---|---|
| 8-K - 8-K - FTI CONSULTING, INC | d769161d8k.htm |
| Exhibit 99.1
|

FTI Consulting, Inc.
Second Quarter 2014 Earnings Presentation
Exhibit 99.1
|
|
Cautionary Note About Forward-Looking Statements
This presentation includes “forward-looking statements” within the meaning of Section 27A of the Securities Act of 1933, as amended, and Section 21E of the Securities Exchange Act of 1934, as amended, which involve uncertainties and risks. Forward-looking statements include statements concerning our plans, objectives, goals, strategies, future events, future revenues, future results and performance, expectations, plans or intentions relating to acquisitions and other matters, business trends and other information that is not historical, including statements regarding estimates of our 2014 financial results, our medium-term growth targets or other future financial results. When used in this press release, words such as “anticipates,” “aspirational,” “estimates,” “expects,” “goals,” “intends,” “believes,” “forecasts,” “targets,” “objectives” and variations of such words or similar expressions are intended to identify forward-looking statements. All forward-looking statements, including, without limitation, estimates of our 2014 financial results, our medium-term growth targets or other future financial results, are based upon our expectations at the time we make them and various assumptions. Our medium term growth targets do not represent forecasted future results or financial guidance; rather, they reflect our medium-term growth objectives, developed on the basis of a comprehensive review of our businesses and reflecting our plans for the future. Our expectations, beliefs, projections and growth targets are expressed in good faith, and we believe there is a reasonable basis for them. However, there can be no assurance that management’s expectations, beliefs, estimates or growth targets will be achieved, and the Company’s actual results may differ materially from our expectations, beliefs, estimates and growth targets. The Company has experienced fluctuating revenues, operating income and cash flow in prior periods and expects that this will occur from time to time in the future. Other factors that could cause such differences include declines in demand for, or changes in, the mix of services and products that we offer, the mix of the geographic locations where our clients are located or where services are performed, adverse financial, real estate or other market and general economic conditions, which could impact each of our segments differently, the pace and timing of the consummation and integration of past and future acquisitions, the Company’s ability to realize cost savings and efficiencies, competitive and general economic conditions, retention of staff and clients and other risks described under the heading “Item 1A Risk Factors” in the Company’s most recent Form 10-K filed with the SEC and in the Company’s other filings with the SEC, including the risks set forth under “Risks Related to Our Reportable Segments” and “Risks Related to Our Operations”. We are under no duty to update any of the forward looking statements to conform such statements to actual results or events and do not intend to do so.
2
|
|

FTI Consulting Announces Election of Executive Officers: David M. Johnson, Holly Paul, Paul Linton and Adam S. Bendell
Effective August 25, 2014,
David M. Johnson will serve as the Company’s Chief Financial Officer and will be based out of the Company’s executive headquarters in Washington, D.C. Mr. Johnson will be responsible for all finance functions and work with the firm’s Executive Committee to develop and execute acquisition and other growth strategies.
Effective August 25, 2014, Holly Paul will become the Company’s Chief Human Resources Officer and will be based out of the Company’s executive headquarters in Washington, D.C. Ms. Paul will be responsible for attracting, engaging, hiring, developing and retaining leading professionals.
Effective August 25, 2014, Paul Linton will become the Company’s Chief Strategy and Transformation Officer and will be based out of the Company’s executive headquarters in Washington, D.C. Mr. Linton will focus on supporting FTI Consulting’s business segments as they develop and drive their near-term and medium-term agendas.
Effective August 25, 2014,
Adam S. Bendell who has been serving as the Company’s Senior Vice President of Strategic Development, will move into a new role as the Company’s first-ever Chief Innovation Officer and will be based out of the firm’s San Francisco office. Mr. Bendell will guide the commercialization of new products and services adjacent to FTI Consulting’s existing businesses.
3
|
|
Second Quarter 2014 Key Messages
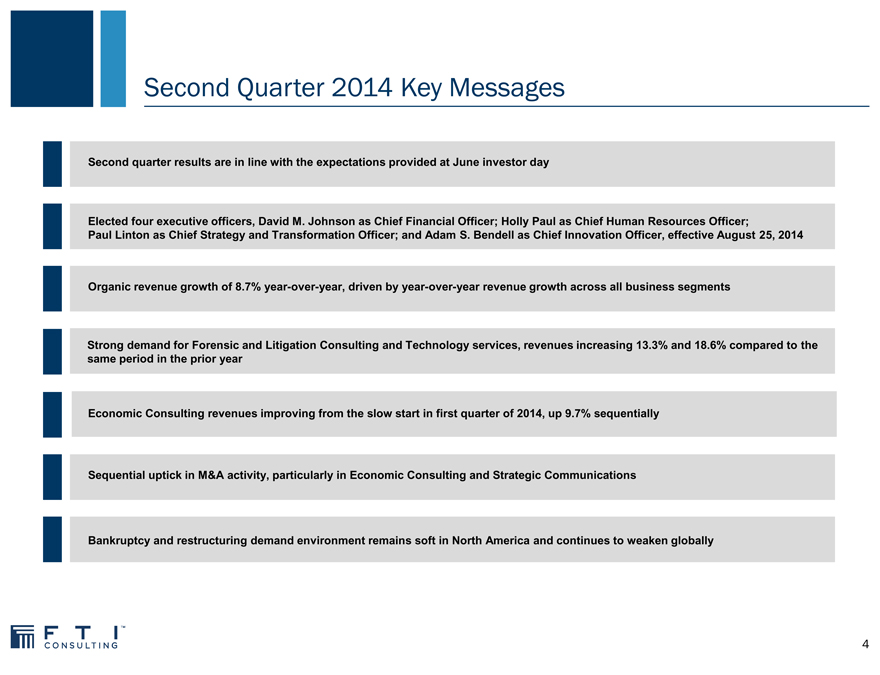
Second quarter results are in line with the expectations provided at June investor day
Elected four executive officers, David M. Johnson as Chief Financial Officer; Holly Paul as Chief Human Resources Officer;
Paul Linton as Chief Strategy and Transformation Officer; and Adam S. Bendell as Chief Innovation Officer, effective August 25, 2014
Organic revenue growth of 8.7% year-over-year, driven by year-over-year revenue growth across all business segments
Strong demand for Forensic and Litigation Consulting and Technology services, revenues increasing 13.3% and 18.6% compared to the same period in the prior year
Economic Consulting revenues improving from the slow start in first quarter of 2014, up 9.7% sequentially
Sequential uptick in M&A activity, particularly in Economic Consulting and Strategic Communications
Bankruptcy and restructuring demand environment remains soft in North America and continues to weaken globally
4
|
|
Second Quarter 2014 Financial Review
Revenues
$600.0
$414.6 $454.3
Millions $400.0
$200.0
$
$0.0
Revenues
2Q13 2Q14
Adjusted Earnings Per Share
$ 0.60 $ 0.55
$ 0.38
$ 0.40
$ 0.20
$ 0.00
Adjusted Earnings Per Share
2Q13 2Q14
Adjusted EBITDA
$100.0
$66.0 $59.9
Millions $50.0
$ $0.0
Adjusted EBITDA
2Q13 2Q14
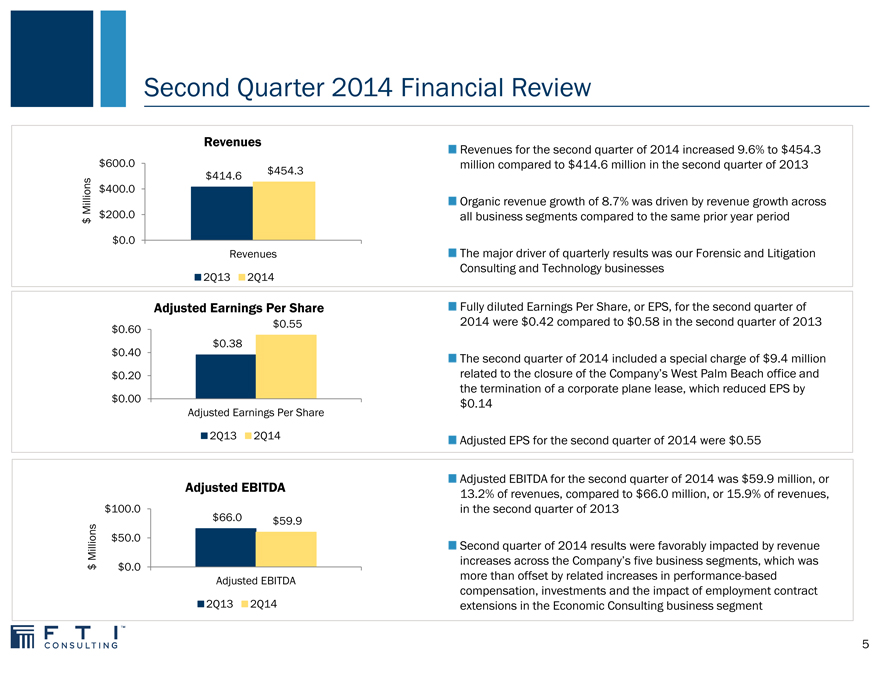
Revenues for the second quarter of 2014 increased 9.6% to $454.3 million compared to $414.6 million in the second quarter of 2013
Organic revenue growth of 8.7% was driven by revenue growth across all business segments compared to the same prior year period
The major driver of quarterly results was our Forensic and Litigation Consulting and Technology businesses
Fully diluted Earnings Per Share, or EPS, for the second quarter of 2014 were $0.42 compared to $0.58 in the second quarter of 2013
The second quarter of 2014 included a special charge of $9.4 million related to the closure of the Company’s West Palm Beach office and the termination of a corporate plane lease, which reduced EPS by
$0.14
Adjusted EPS for the second quarter of 2014 were $0.55
Adjusted EBITDA for the second quarter of 2014 was $59.9 million, or
13.2% of revenues, compared to $66.0 million, or 15.9% of revenues, in the second quarter of 2013
Second quarter of 2014 results were favorably impacted by revenue increases across the Company’s five business segments, which was more than offset by related increases in performance-based compensation, investments and the impact of employment contract extensions in the Economic Consulting business segment
5
|
|

Second Quarter 2014 Segment Results
|
|
Balanced and Diversified Portfolio
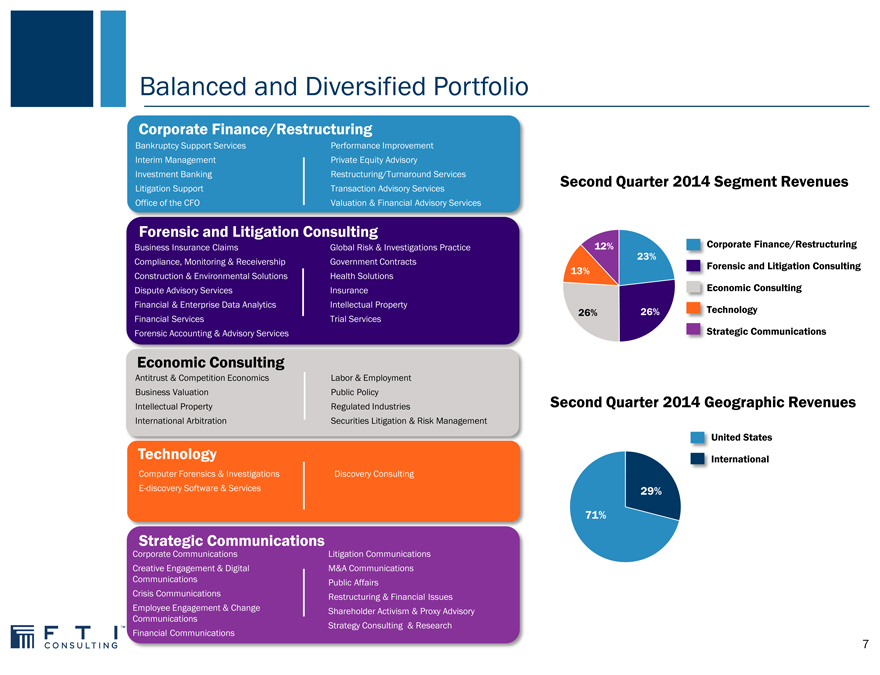
Corporate Finance/Restructuring
Bankruptcy Support Services Performance Improvement Interim Management Private Equity Advisory
Investment Banking Restructuring/Turnaround Services Litigation Support Transaction Advisory Services Office of the CFO Valuation & Financial Advisory Services
Forensic and Litigation Consulting
Business Insurance Claims Global Risk & Investigations Practice Compliance, Monitoring & Receivership Government Contracts Construction & Environmental Solutions Health Solutions Dispute Advisory Services Insurance Financial & Enterprise Data Analytics Intellectual Property Financial Services Trial Services Forensic Accounting & Advisory Services
Economic Consulting
Antitrust & Competition Economics Labor & Employment Business Valuation Public Policy Intellectual Property Regulated Industries
International Arbitration Securities Litigation & Risk Management
Technology
Computer Forensics & Investigations Discovery Consulting E-discovery Software & Services
Strategic Communications
Corporate Communications Litigation Communications Creative Engagement & Digital M&A Communications Communications Public Affairs Crisis Communications Restructuring & Financial Issues Employee Engagement & Change Shareholder Activism & Proxy Advisory Communications Strategy Consulting & Research Financial Communications
Second Quarter 2014 Segment Revenues
12% Corporate Finance/Restructuring
23%
13% Forensic and Litigation Consulting
Economic Consulting
26% 26% Technology
Strategic Communications
Second Quarter 2014 Geographic Revenues
United States
International
29%
71%
7
|
|
Corporate Finance/Restructuring
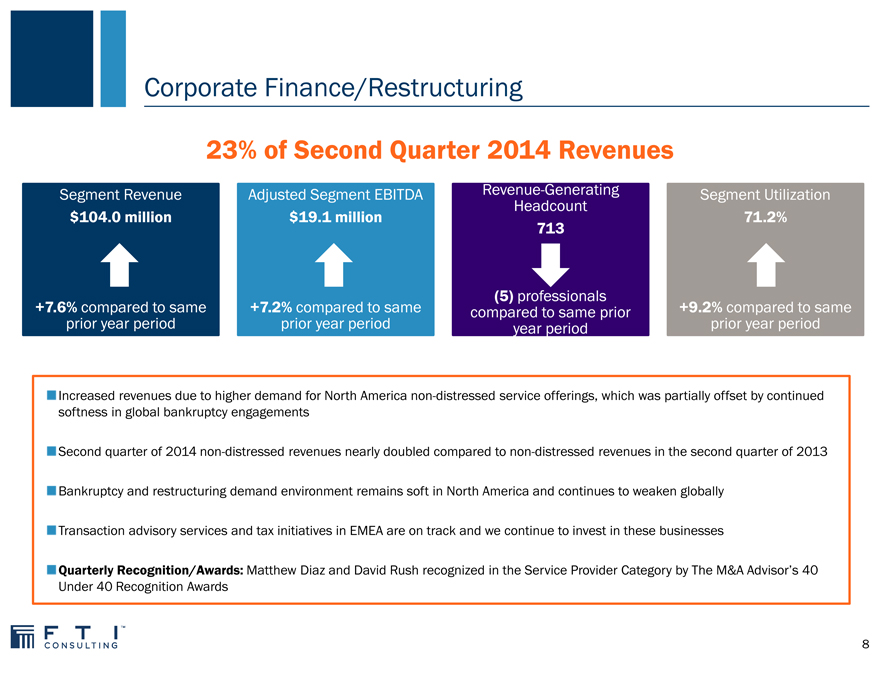
23% of Second Quarter 2014 Revenues
Segment Revenue Adjusted Segment EBITDA Revenue-Generating Segment Utilization Headcount $104.0 million $19.1 million 71.2% 713
(5) professionals
+7.6% compared to same +7.2% compared to same compared to same prior +9.2% compared to same prior year period prior year period year period prior year period
Increased revenues due to higher demand for North America non-distressed service offerings, which was partially offset by continued softness in global bankruptcy engagements
Second quarter of 2014 non-distressed revenues nearly doubled compared to non-distressed revenues in the second quarter of 2013 Bankruptcy and restructuring demand environment remains soft in North America and continues to weaken globally Transaction advisory services and tax initiatives in EMEA are on track and we continue to invest in these businesses
Quarterly Recognition/Awards: Matthew Diaz and David Rush recognized in the Service Provider Category by The M&A Advisor’s 40 Under 40 Recognition Awards
8
|
|
Forensic and Litigation Consulting
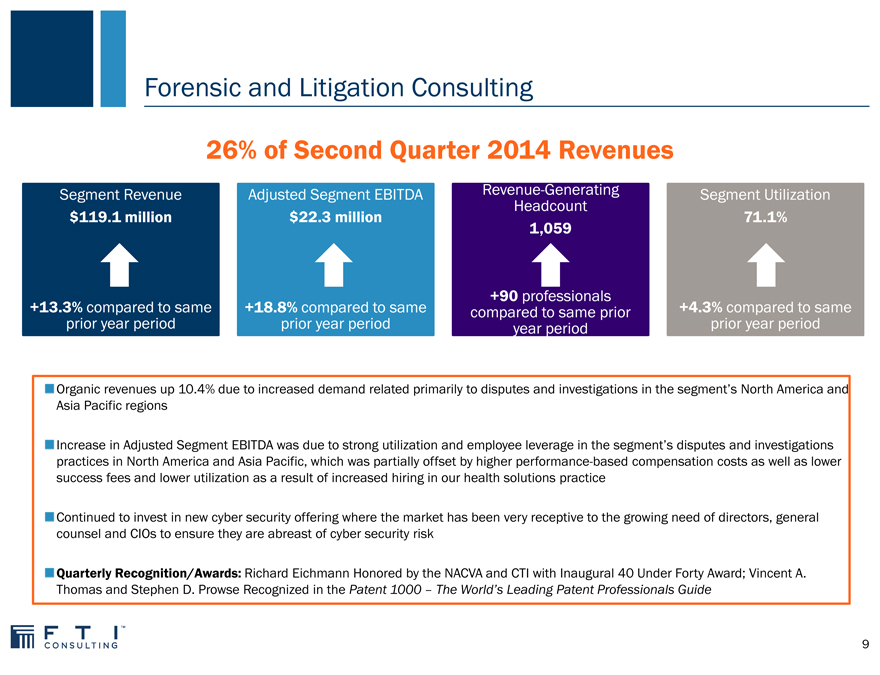
26% of Second Quarter 2014 Revenues
Segment Revenue Adjusted Segment EBITDA Revenue-Generating Segment Utilization Headcount $119.1 million $22.3 million 71.1% 1,059
+90 professionals
+13.3% compared to same +18.8% compared to same compared to same prior +4.3% compared to same prior year period prior year period year period prior year period
Organic revenues up 10.4% due to increased demand related primarily to disputes and investigations in the segment’s North America and Asia Pacific regions
Increase in Adjusted Segment EBITDA was due to strong utilization and employee leverage in the segment’s disputes and investigations practices in North America and Asia Pacific, which was partially offset by higher performance-based compensation costs as well as lower success fees and lower utilization as a result of increased hiring in our health solutions practice
Continued to invest in new cyber security offering where the market has been very receptive to the growing need of directors, general counsel and CIOs to ensure they are abreast of cyber security risk
Quarterly Recognition/Awards: Richard Eichmann Honored by the NACVA and CTI with Inaugural 40 Under Forty Award; Vincent A.
Thomas and Stephen D. Prowse Recognized in the Patent 1000 – The World’s Leading Patent Professionals Guide
9
|
|

Economic Consulting
26% of Second Quarter 2014 Revenues
Segment Revenue Adjusted Segment EBITDA Revenue-Generating Segment Utilization
Headcount
$117.2 $18.0 78.3%
525
+26 professionals
+5.6% compared to same (13.3%) compared to same compared to same prior (3.9%) compared to same
prior year period prior year period year period prior year period
Improvement from the slow start in the first quarter of 2014 with revenues increasing 9.7% sequentially, largely due to higher demand in EMEA-based antitrust litigation practice and higher demand and realized pricing in EMEA international arbitration, regulatory and valuation practices
Decline in Adjusted Segment EBITDA was due largely to increased compensation expense related to extensions of previously disclosed employment contracts entered into late last year with key senior client-service professionals and lower utilization in the financial economics practice in North America
Second quarter of 2014 antitrust litigation and international arbitration, valuation and advisory services reported double-digit revenue increases compared to the first quarter of 2014
Continue to invest in the international arbitration practice in EMEA and the energy, power & products team in North America
10
|
|
Technology
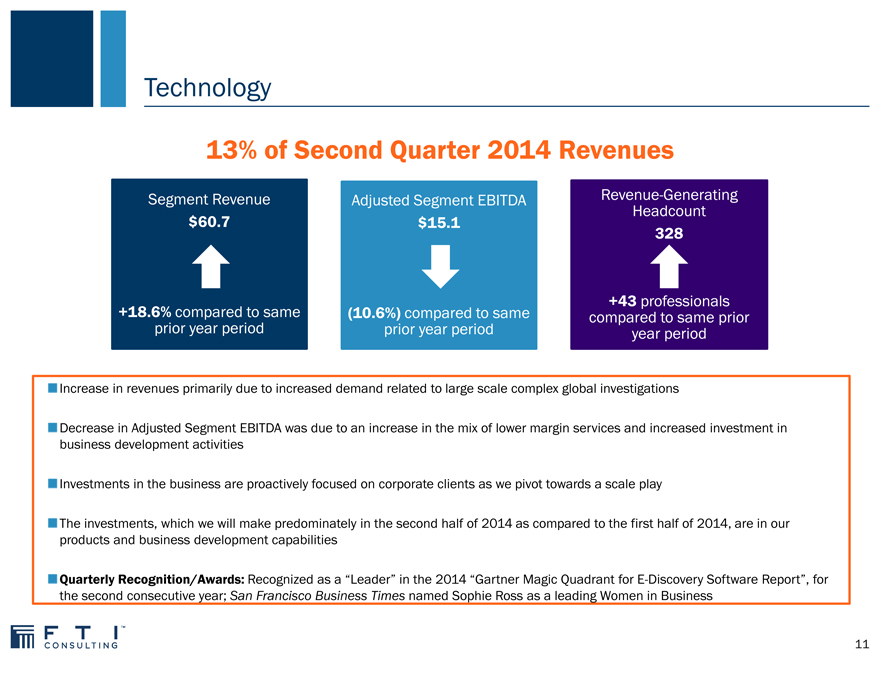
13% of Second Quarter 2014 Revenues
Segment Revenue Adjusted Segment EBITDA Revenue-Generating Headcount
$60.7 $15.1
328
+43 professionals +18.6% compared to same (10.6%) compared to same compared to same prior prior year period prior year period year period
Increase in revenues primarily due to increased demand related to large scale complex global investigations
Decrease in Adjusted Segment EBITDA was due to an increase in the mix of lower margin services and increased investment in business development activities
Investments in the business are proactively focused on corporate clients as we pivot towards a scale play
The investments, which we will make predominately in the second half of 2014 as compared to the first half of 2014, are in our products and business development capabilities
Quarterly Recognition/Awards: Recognized as a “Leader” in the 2014 “Gartner Magic Quadrant for E-Discovery Software Report”, for the second consecutive year; San Francisco Business Times named Sophie Ross as a leading Women in Business
11
|
|
Strategic Communications
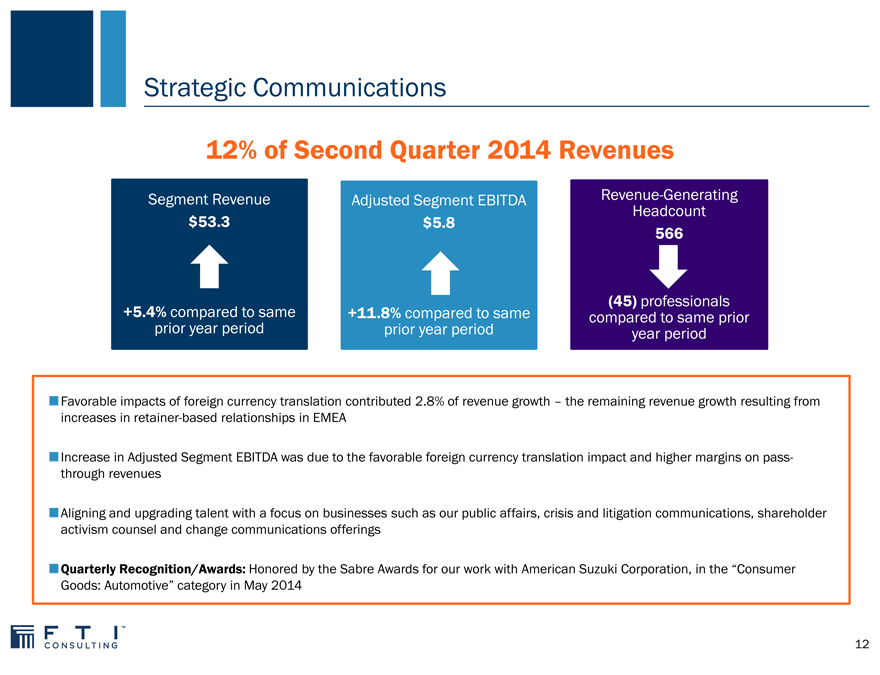
12% of Second Quarter 2014 Revenues
Segment Revenue Adjusted Segment EBITDA Revenue-Generating Headcount $53.3 $5.8 566
(45) professionals +5.4% compared to same +11.8% compared to same compared to same prior prior year period prior year period year period
Favorable impacts of foreign currency translation contributed 2.8% of revenue growth – the remaining revenue growth resulting from increases in retainer-based relationships in EMEA
Increase in Adjusted Segment EBITDA was due to the favorable foreign currency translation impact and higher margins on pass-through revenues
Aligning and upgrading talent with a focus on businesses such as our public affairs, crisis and litigation communications, shareholder activism counsel and change communications offerings
Quarterly Recognition/Awards: Honored by the Sabre Awards for our work with American Suzuki Corporation, in the “Consumer Goods: Automotive” category in May 2014
12
|
|

Second Quarter 2014 Key Messages
Second quarter results are in line with the expectations provided at June investor day
Elected four executive officers, David M. Johnson as Chief Financial Officer; Holly Paul as Chief Human Resources Officer;
Paul Linton as Chief Strategy and Transformation Officer; and Adam S. Bendell as Chief Innovation Officer, effective August 25, 2014
Organic revenue growth of 8.7% year-over-year, driven by year-over-year revenue growth across all business segments
Strong demand for Forensic and Litigation Consulting and Technology services, revenues increasing 13.3% and 18.6% compared to the same period in the prior year
Economic Consulting revenues improving from the slow start in first quarter of 2014, up 9.7% sequentially
Sequential uptick in M&A activity, particularly in Economic Consulting and Strategic Communications
Bankruptcy and restructuring demand environment remains soft in North America and continues to weaken globally
13
|
|

Second Quarter 2014 Financial Tables
|
|
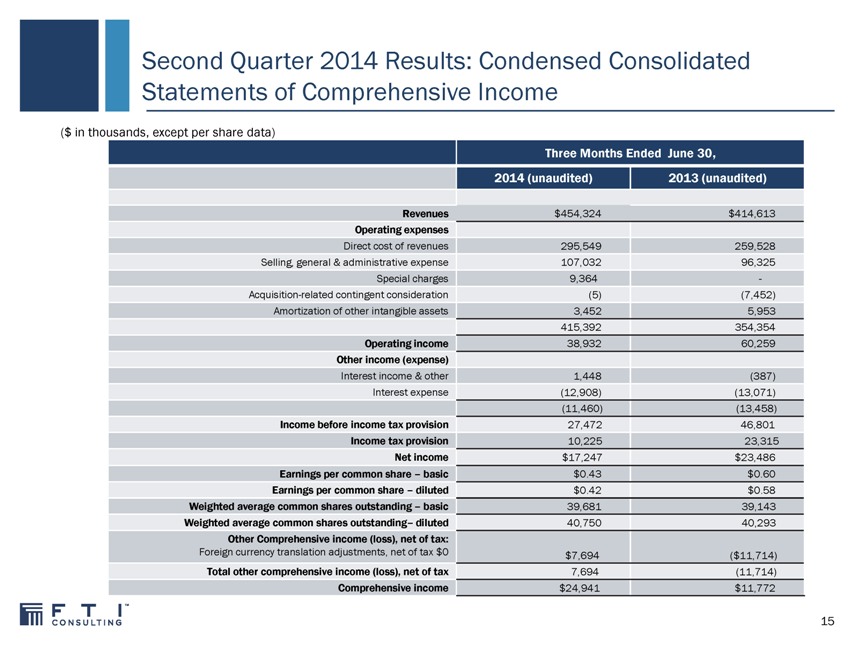
Second Quarter 2014 Results: Condensed Consolidated Statements of Comprehensive Income
($ in thousands, except per share data)
Three Months Ended June 30,
2014 (unaudited) 2013 (unaudited)
Revenues $454,324 $414,613
Operating expenses
Direct cost of revenues 295,549 259,528
Selling, general & administrative expense 107,032 96,325
Special charges 9,364 -
Acquisition-related contingent consideration (5) (7,452)
Amortization of other intangible assets 3,452 5,953
415,392 354,354
Operating income 38,932 60,259
Other income (expense)
Interest income & other 1,448 (387)
Interest expense (12,908) (13,071)
(11,460) (13,458)
Income before income tax provision 27,472 46,801
Income tax provision 10,225 23,315
Net income $17,247 $23,486
Earnings per common share – basic $0.43 $0.60
Earnings per common share – diluted $0.42 $0.58
Weighted average common shares outstanding – basic 39,143
39,681
Weighted average common shares outstanding– diluted 40,293
40,750
Other Comprehensive income (loss), net of tax:
Foreign currency translation adjustments, net of tax $0 $7,694 ($11,714)
Total other comprehensive income (loss), net of tax 7,694 (11,714)
Comprehensive income $24,941 $11,772
15
|
|
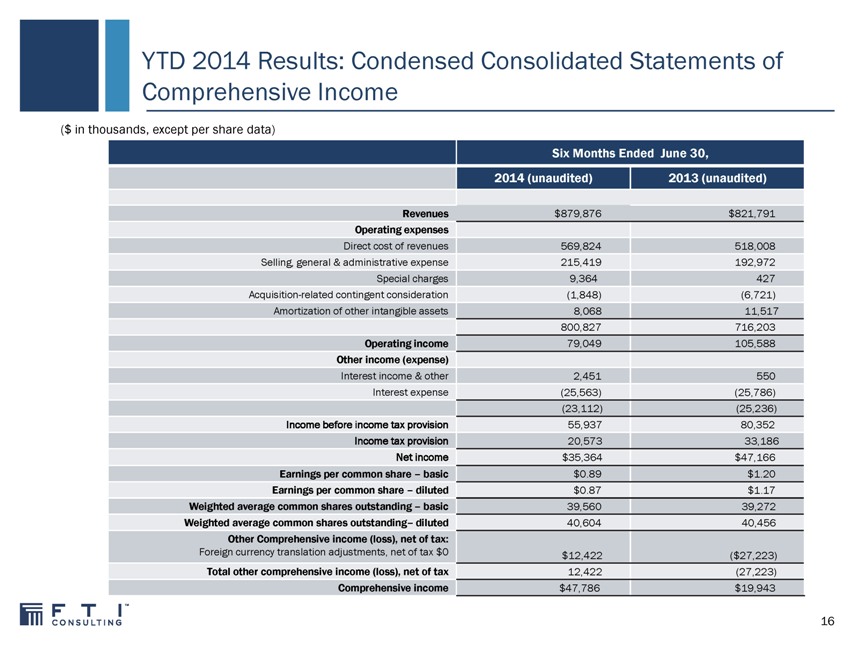
YTD 2014 Results: Condensed Consolidated Statements of Comprehensive Income
($ in thousands, except per share data)
Six Months Ended June 30,
2014 (unaudited) 2013 (unaudited)
Revenues $879,876 $821,791
Operating expenses
Direct cost of revenues 569,824 518,008
Selling, general & administrative expense 215,419 192,972
Special charges 9,364 427
Acquisition-related contingent consideration (1,848) (6,721)
Amortization of other intangible assets 8,068 11,517
800,827 716,203
Operating income 79,049 105,588
Other income (expense)
Interest income & other 2,451 550
Interest expense (25,563) (25,786)
(23,112) (25,236)
Income before income tax provision 55,937 80,352
Income tax provision 20,573 33,186
Net income $35,364 $47,166
Earnings per common share – basic $0.89 $1.20
Earnings per common share – diluted $0.87 $1.17
Weighted average common shares outstanding – basic 39,272
39,560
Weighted average common shares outstanding– diluted 40,456
40,604
Other Comprehensive income (loss), net of tax:
Foreign currency translation adjustments, net of tax $0 $12,422 ($27,223)
Total other comprehensive income (loss), net of tax 12,422 (27,223)
Comprehensive income $47,786 $19,943
16
|
|
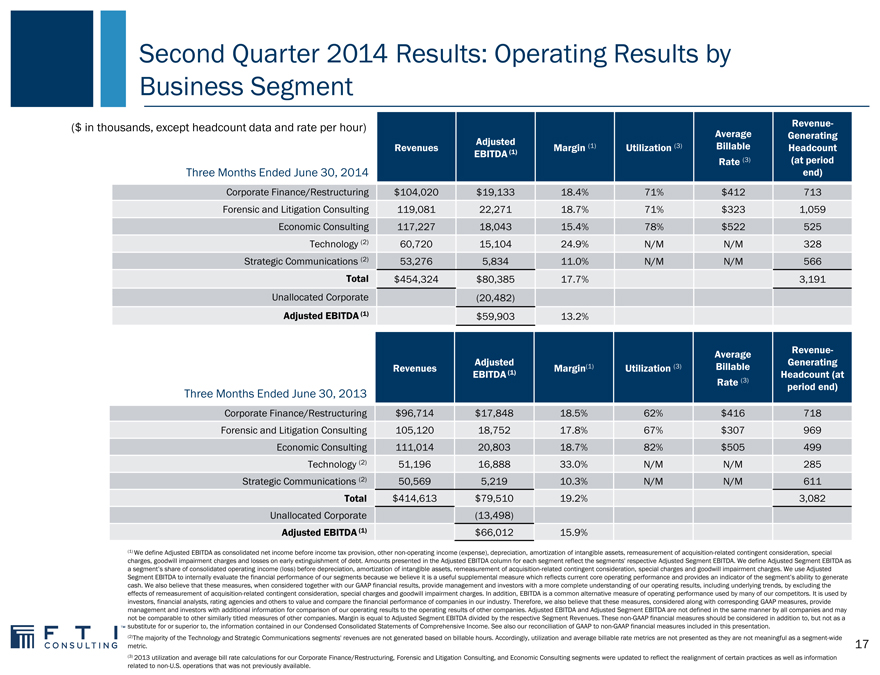
Second Quarter 2014 Results: Operating Results by Business Segment
($ in thousands, except headcount data and rate per hour) Revenue-
Adjusted Average Generating
Revenues Margin (1) Utilization (3) Billable Headcount
EBITDA (1) Rate (3) (at period
Three Months Ended June 30, 2014 end)
Corporate Finance/Restructuring $104,020 $19,133 18.4% 71% $412 713
Forensic and Litigation Consulting 119,081 22,271 18.7% 71% $323 1,059
Economic Consulting 117,227 18,043 15.4% 78% $522 525
Technology (2) 60,720 15,104 24.9% N/M N/M 328
Strategic Communications (2) 53,276 5,834 11.0% N/M N/M 566
Total $454,324 $80,385 17.7% 3,191
Unallocated Corporate (20,482)
Adjusted EBITDA (1) $59,903 13.2%
Average Revenue-
Revenues Adjusted Margin(1) Utilization (3) Billable Generating
EBITDA (1) Headcount (at
Rate (3) period end)
Three Months Ended June 30, 2013
Corporate Finance/Restructuring $96,714 $17,848 18.5% 62% $416 718
Forensic and Litigation Consulting 105,120 18,752 17.8% 67% $307 969
Economic Consulting 111,014 20,803 18.7% 82% $505 499
Technology (2) 51,196 16,888 33.0% N/M N/M 285
Strategic Communications (2) 50,569 5,219 10.3% N/M N/M 611
Total $414,613 $79,510 19.2% 3,082
Unallocated Corporate (13,498)
Adjusted EBITDA (1) $66,012 15.9%
(1) We define Adjusted EBITDA as consolidated net income before income tax provision, other non-operating income (expense), depreciation, amortization of intangible assets, remeasurement of acquisition-related contingent consideration, special
charges, goodwill impairment charges and losses on early extinguishment of debt. Amounts presented in the Adjusted EBITDA column for each segment reflect the segments’ respective Adjusted Segment EBITDA. We define Adjusted Segment EBITDA as
a segment’s share of consolidated operating income (loss) before depreciation, amortization of intangible assets, remeasurement of acquisition-related contingent consideration, special charges and goodwill impairment charges. We use Adjusted
Segment EBITDA to internally evaluate the financial performance of our segments because we believe it is a useful supplemental measure which reflects current core operating performance and provides an indicator of the segment’s ability to generate
cash. We also believe that these measures, when considered together with our GAAP financial results, provide management and investors with a more complete understanding of our operating results, including underlying trends, by excluding the
effects of remeasurement of acquisition-related contingent consideration, special charges and goodwill impairment charges. In addition, EBITDA is a common alternative measure of operating performance used by many of our competitors. It is used by
investors, financial analysts, rating agencies and others to value and compare the financial performance of companies in our industry. Therefore, we also believe that these measures, considered along with corresponding GAAP measures, provide
management and investors with additional information for comparison of our operating results to the operating results of other companies. Adjusted EBITDA and Adjusted Segment EBITDA are not defined in the same manner by all companies and may
not be comparable to other similarly titled measures of other companies. Margin is equal to Adjusted Segment EBITDA divided by the respective Segment Revenues. These non-GAAP financial measures should be considered in addition to, but not as a
substitute for or superior to, the information contained in our Condensed Consolidated Statements of Comprehensive Income. See also our reconciliation of GAAP to non-GAAP financial measures included in this presentation.
(2)The majority of the Technology and Strategic Communications segments’ revenues are not generated based on billable hours. Accordingly, utilization and average billable rate metrics are not presented as they are not meaningful as a segment-wide
metric.
(3) 2013 utilization and average bill rate calculations for our Corporate Finance/Restructuring, Forensic and Litigation Consulting, and Economic Consulting segments were updated to reflect the realignment of certain practices as well as information
related to non-U.S. operations that was not previously available.
17
|
|

YTD 2014 Results: Operating Results by Business Segment
($ in thousands, except headcount data and rate per hour)
Revenue-
Adjusted
Average
Generating
Revenues
Margin(1)
Utilization (3)
Billable
Headcount
EBITDA (1)
Rate (3)
(at period
Six Months Ended June 30, 2014
end)
Corporate Finance/Restructuring
$198,002
$30,084
15.2%
71%
$396
713
Forensic and Litigation Consulting
240,510
48,765
20.3%
73%
$319
1,059
Economic Consulting
224,078
31,073
13.9%
75%
$519
525
Technology (2)
120,783
32,452
26.9%
N/M
N/M
328
Strategic Communications (2)
96,503
8,563
8.9%
N/M
N/M
566
Total
$879,876
$150,937
17.2%
3,191
Unallocated Corporate
(39,838)
Adjusted EBITDA (1)
$111,099
12.6%
Average
Revenue-
Revenues
Adjusted
Margin(1)
Utilization (3)
Billable
Generating
EBITDA (1)
Headcount (at
Rate (3)
period end)
Six Months Ended June 30, 2013
Corporate Finance/Restructuring
$195,794
$36,933
18.9%
66%
$412
718
Forensic and Litigation Consulting
205,844
31,563
15.3%
65%
$314
969
Economic Consulting
226,208
46,997
20.8%
86%
$501
499
Technology (2)
97,900
30,604
31.3%
N/M
N/M
285
Strategic Communications (2)
96,045
8,773
9.1%
N/M
N/M
611
Total
$821,791
$154,870
18.8%
3,082
Unallocated Corporate
(29,532)
Adjusted EBITDA (1)
$125,338
15.3%
(1) We define Adjusted EBITDA as consolidated net income before income tax provision, other non-operating income (expense), depreciation, amortization of intangible assets, remeasurement of acquisition-related contingent consideration, special
charges, goodwill impairment charges and losses on early extinguishment of debt. Amounts presented in the Adjusted EBITDA column for each segment reflect the segments’ respective Adjusted Segment EBITDA. We define Adjusted Segment EBITDA as
a segment’s share of consolidated operating income (loss) before depreciation, amortization of intangible assets, remeasurement of acquisition-related contingent consideration, special charges and goodwill impairment charges. We use Adjusted
Segment EBITDA to internally evaluate the financial performance of our segments because we believe it is a useful supplemental measure which reflects current core operating performance and provides an indicator of the segment’s ability to generate
cash. We also believe that these measures, when considered together with our GAAP financial results, provide management and investors with a more complete understanding of our operating results, including underlying trends, by excluding the
effects of remeasurement of acquisition-related contingent consideration, special charges and goodwill impairment charges. In addition, EBITDA is a common alternative measure of operating performance used by many of our competitors. It is used by
investors, financial analysts, rating agencies and others to value and compare the financial performance of companies in our industry. Therefore, we also believe that these measures, considered along with corresponding GAAP measures, provide
management and investors with additional information for comparison of our operating results to the operating results of other companies. Adjusted EBITDA and Adjusted Segment EBITDA are not defined in the same manner by all companies and may
not be comparable to other similarly titled measures of other companies. Margin is equal to Adjusted Segment EBITDA divided by the respective Segment Revenues. These non-GAAP financial measures should be considered in addition to, but not as a
substitute for or superior to, the information contained in our Condensed Consolidated Statements of Comprehensive Income. See also our reconciliation of GAAP to non-GAAP financial measures included in this presentation.
((2)The majority of the Technology and Strategic Communications segments’ revenues are not generated based on billable hours. Accordingly, utilization and average billable rate metrics are not presented as they are not meaningful as a segment-wide
metric.
(3) 2013 utilization and average bill rate calculations for our Corporate Finance/Restructuring, Forensic and Litigation Consulting, and Economic Consulting segments were updated to reflect the realignment of certain practices as well as information
related to non-U.S. operations that was not previously available.
18
|
|
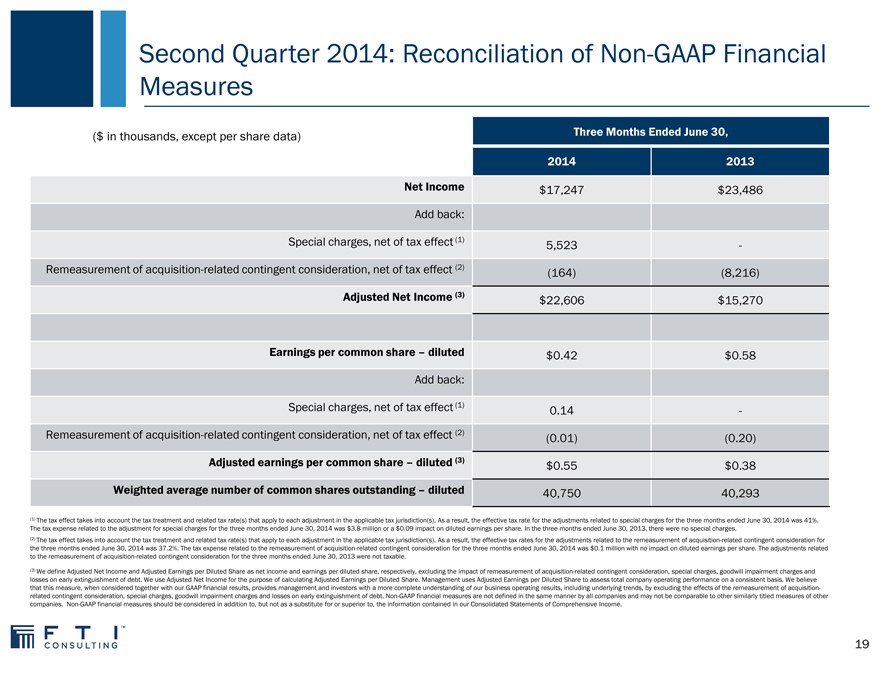
Second Quarter 2014: Reconciliation of Non-GAAP Financial Measures
($ in thousands, except per share data)
Three Months Ended June 30,
2014
2013
Net Income
$17,247
$23,486
Add back:
Special charges, net of tax effect (1)
5,523
-
Remeasurement of acquisition-related contingent consideration, net of tax effect (2)
(164)
(8,216)
Adjusted Net Income (3)
$22,606
$15,270
Earnings per common share – diluted
$0.42
$0.58
Add back:
Special charges, net of tax effect (1)
0.14
-
Remeasurement of acquisition-related contingent consideration, net of tax effect (2)
(0.01)
(0.20)
Adjusted earnings per common share – diluted (3)
$0.55
$0.38
Weighted average number of common shares outstanding – diluted
40,750
40,293
(1) The tax effect takes into account the tax treatment and related tax rate(s) that apply to each adjustment in the applicable tax jurisdiction(s). As a result, the effective tax rate for the adjustments related to special charges for the three months ended June 30, 2014 was 41%.
The tax expense related to the adjustment for special charges for the three months ended June 30, 2014 was $3.8 million or a $0.09 impact on diluted earnings per share. In the three months ended June 30, 2013, there were no special charges.
(2) The tax effect takes into account the tax treatment and related tax rate(s) that apply to each adjustment in the applicable tax jurisdiction(s). As a result, the effective tax rates for the adjustments related to the remeasurement of acquisition-related contingent consideration for
the three months ended June 30, 2014 was 37.2%. The tax expense related to the remeasurement of acquisition-related contingent consideration for the three months ended June 30, 2014 was $0.1 million with no impact on diluted earnings per share. The adjustments related
to the remeasurement of acquisition-related contingent consideration for the three months ended June 30, 2013 were not taxable.
(3) We define Adjusted Net Income and Adjusted Earnings per Diluted Share as net income and earnings per diluted share, respectively, excluding the impact of remeasurement of acquisition-related contingent consideration, special charges, goodwill impairment charges and
losses on early extinguishment of debt. We use Adjusted Net Income for the purpose of calculating Adjusted Earnings per Diluted Share. Management uses Adjusted Earnings per Diluted Share to assess total company operating performance on a consistent basis. We believe
that this measure, when considered together with our GAAP financial results, provides management and investors with a more complete understanding of our business operating results, including underlying trends, by excluding the effects of the remeasurement of acquisition-
related contingent consideration, special charges, goodwill impairment charges and losses on early extinguishment of debt. Non-GAAP financial measures are not defined in the same manner by all companies and may not be comparable to other similarly titled measures of other
companies. Non-GAAP financial measures should be considered in addition to, but not as a substitute for or superior to, the information contained in our Consolidated Statements of Comprehensive Income.
19
|
|
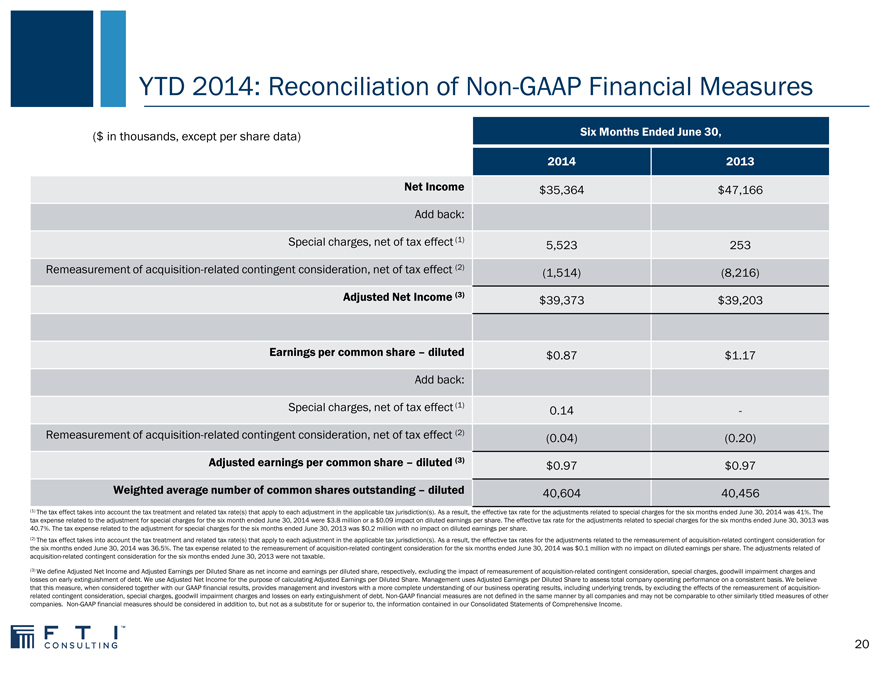
YTD 2014: Reconciliation of Non-GAAP Financial Measures
($ in thousands, except per share data)
Six Months Ended June 30,
2014
2013
Net Income
$35,364
$47,166
Add back:
Special charges, net of tax effect (1)
5,523
253
Remeasurement of acquisition-related contingent consideration, net of tax effect (2)
(1,514)
(8,216)
Adjusted Net Income (3)
$39,373
$39,203
Earnings per common share – diluted
$0.87
$1.17
Add back:
Special charges, net of tax effect (1)
0.14
-
Remeasurement of acquisition-related contingent consideration, net of tax effect (2)
(0.04)
(0.20)
Adjusted earnings per common share – diluted (3)
$0.97
$0.97
Weighted average number of common shares outstanding – diluted
40,604
40,456
(1) The tax effect takes into account the tax treatment and related tax rate(s) that apply to each adjustment in the applicable tax jurisdiction(s). As a result, the effective tax rate for the adjustments related to special charges for the six months ended June 30, 2014 was 41%. The
tax expense related to the adjustment for special charges for the six month ended June 30, 2014 were $3.8 million or a $0.09 impact on diluted earnings per share. The effective tax rate for the adjustments related to special charges for the six months ended June 30, 3013 was
40.7%. The tax expense related to the adjustment for special charges for the six months ended June 30, 2013 was $0.2 million with no impact on diluted earnings per share.
(2) The tax effect takes into account the tax treatment and related tax rate(s) that apply to each adjustment in the applicable tax jurisdiction(s). As a result, the effective tax rates for the adjustments related to the remeasurement of acquisition-related contingent consideration for
the six months ended June 30, 2014 was 36.5%. The tax expense related to the remeasurement of acquisition-related contingent consideration for the six months ended June 30, 2014 was $0.1 million with no impact on diluted earnings per share. The adjustments related of
acquisition-related contingent consideration for the six months ended June 30, 2013 were not taxable.
(3) We define Adjusted Net Income and Adjusted Earnings per Diluted Share as net income and earnings per diluted share, respectively, excluding the impact of remeasurement of acquisition-related contingent consideration, special charges, goodwill impairment charges and
losses on early extinguishment of debt. We use Adjusted Net Income for the purpose of calculating Adjusted Earnings per Diluted Share. Management uses Adjusted Earnings per Diluted Share to assess total company operating performance on a consistent basis. We believe
that this measure, when considered together with our GAAP financial results, provides management and investors with a more complete understanding of our business operating results, including underlying trends, by excluding the effects of the remeasurement of acquisition-
related contingent consideration, special charges, goodwill impairment charges and losses on early extinguishment of debt. Non-GAAP financial measures are not defined in the same manner by all companies and may not be comparable to other similarly titled measures of other
companies. Non-GAAP financial measures should be considered in addition to, but not as a substitute for or superior to, the information contained in our Consolidated Statements of Comprehensive Income.
20
|
|
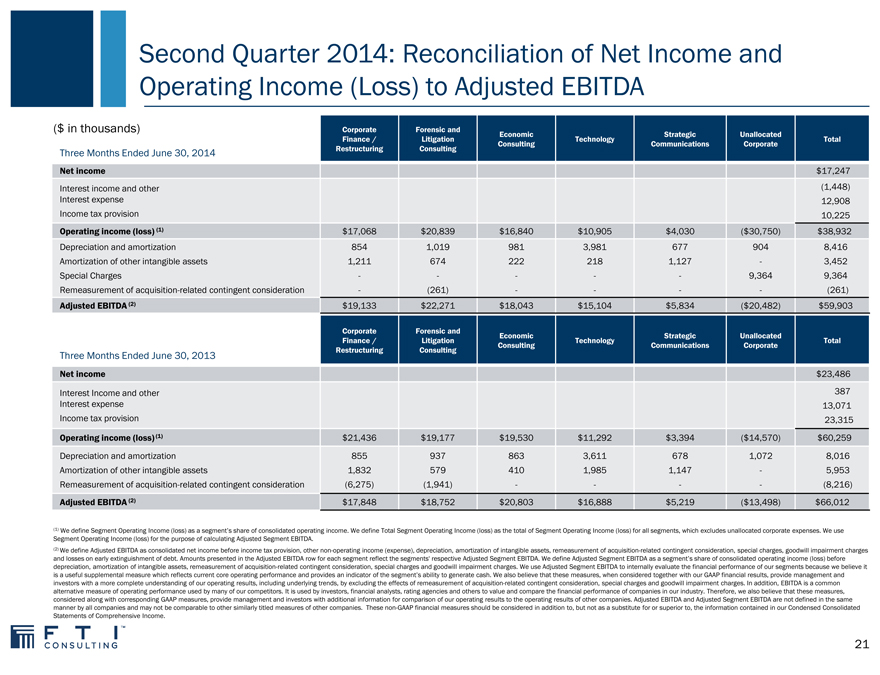
Second Quarter 2014: Reconciliation of Net Income and Operating Income (Loss) to Adjusted EBITDA
($ in thousands) Corporate Forensic and Economic Strategic Unallocated
Finance / Litigation Technology Total
Consulting Communications Corporate
Three Months Ended June 30, 2014 Restructuring Consulting
Net income $17,247
Interest income and other (1,448)
Interest expense 12,908
Income tax provision 10,225
Operating income (loss) (1) $17,068 $20,839 $16,840 $10,905 $4,030 ($30,750) $38,932
Depreciation and amortization 854 1,019 981 3,981 677 904 8,416
Amortization of other intangible assets 1,211 674 222 218 1,127 — 3,452
Special Charges ----- 9,364 9,364
Remeasurement of acquisition-related contingent consideration - (261) ---- (261)
Adjusted EBITDA (2) $19,133 $22,271 $18,043 $15,104 $5,834 ($20,482) $59,903
Corporate Forensic and Economic Strategic Unallocated
Finance / Litigation Technology Total
Consulting Communications Corporate
Three Months Ended June 30, 2013 Restructuring Consulting
Net income $23,486
Interest Income and other 387
Interest expense 13,071
Income tax provision 23,315
Operating income (loss) (1) $21,436 $19,177 $19,530 $11,292 $3,394 ($14,570) $60,259
Depreciation and amortization 855 937 863 3,611 678 1,072 8,016
Amortization of other intangible assets 1,832 579 410 1,985 1,147 - 5,953
Remeasurement of acquisition-related contingent consideration (6,275) (1,941) ---- (8,216)
Adjusted EBITDA (2) $17,848 $18,752 $20,803 $16,888 $5,219 ($13,498) $66,012
(1) We define Segment Operating Income (loss) as a segment’s share of consolidated operating income. We define Total Segment Operating Income (loss) as the total of Segment Operating Income (loss) for all segments, which excludes unallocated corporate expenses. We use
Segment Operating Income (loss) for the purpose of calculating Adjusted Segment EBITDA.
(2) We define Adjusted EBITDA as consolidated net income before income tax provision, other non-operating income (expense), depreciation, amortization of intangible assets, remeasurement of acquisition-related contingent consideration, special charges, goodwill impairment charges
and losses on early extinguishment of debt. Amounts presented in the Adjusted EBITDA row for each segment reflect the segments’ respective Adjusted Segment EBITDA. We define Adjusted Segment EBITDA as a segment’s share of consolidated operating income (loss) before
depreciation, amortization of intangible assets, remeasurement of acquisition-related contingent consideration, special charges and goodwill impairment charges. We use Adjusted Segment EBITDA to internally evaluate the financial performance of our segments because we believe it
is a useful supplemental measure which reflects current core operating performance and provides an indicator of the segment’s ability to generate cash. We also believe that these measures, when considered together with our GAAP financial results, provide management and
investors with a more complete understanding of our operating results, including underlying trends, by excluding the effects of remeasurement of acquisition-related contingent consideration, special charges and goodwill impairment charges. In addition, EBITDA is a common
alternative measure of operating performance used by many of our competitors. It is used by investors, financial analysts, rating agencies and others to value and compare the financial performance of companies in our industry. Therefore, we also believe that these measures,
considered along with corresponding GAAP measures, provide management and investors with additional information for comparison of our operating results to the operating results of other companies. Adjusted EBITDA and Adjusted Segment EBITDA are not defined in the same
manner by all companies and may not be comparable to other similarly titled measures of other companies. These non-GAAP financial measures should be considered in addition to, but not as a substitute for or superior to, the information contained in our Condensed Consolidated
Statements of Comprehensive Income.
21
|
|
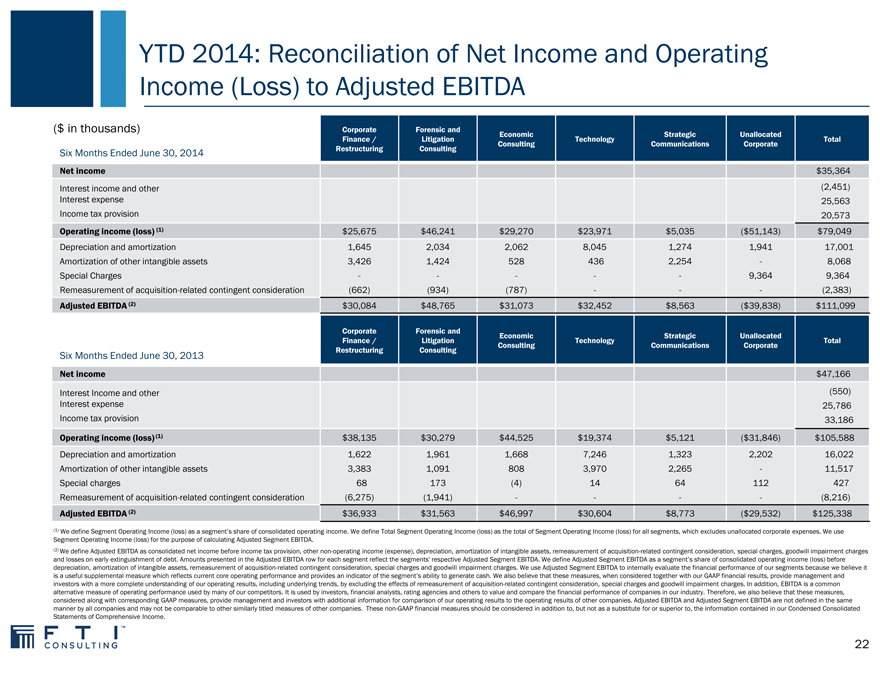
YTD 2014: Reconciliation of Net Income and Operating Income (Loss) to Adjusted EBITDA
($ in thousands) Corporate Forensic and Economic Strategic Unallocated
Finance / Litigation Technology Total
Consulting Communications Corporate
Six Months Ended June 30, 2014 Restructuring Consulting
Net income $35,364
Interest income and other (2,451)
Interest expense 25,563
Income tax provision 20,573
Operating income (loss) (1) $25,675 $46,241 $29,270 $23,971 $5,035 ($51,143) $79,049
Depreciation and amortization 1,645 2,034 2,062 8,045 1,274 1,941 17,001
Amortization of other intangible assets 3,426 1,424 528 436 2,254 - 8,068
Special Charges ----- 9,364 9,364
Remeasurement of acquisition-related contingent consideration (662) (934) (787) --- (2,383)
Adjusted EBITDA (2) $30,084 $48,765 $31,073 $32,452 $8,563 ($39,838) $111,099
Corporate Forensic and Economic Strategic Unallocated
Finance / Litigation Technology Total
Consulting Communications Corporate
Six Months Ended June 30, 2013 Restructuring Consulting
Net income $47,166
Interest Income and other (550)
Interest expense 25,786
Income tax provision 33,186
Operating income (loss) (1) $38,135 $30,279 $44,525 $19,374 $5,121 ($31,846) $105,588
Depreciation and amortization 1,622 1,961 1,668 7,246 1,323 2,202 16,022
Amortization of other intangible assets 3,383 1,091 808 3,970 2,265 - 11,517
Special charges 68 173 (4) 14 64 112 427
Remeasurement of acquisition-related contingent consideration (6,275) (1,941) ---- (8,216)
Adjusted EBITDA (2) $36,933 $31,563 $46,997 $30,604 $8,773 ($29,532) $125,338
(1) We define Segment Operating Income (loss) as a segment’s share of consolidated operating income. We define Total Segment Operating Income (loss) as the total of Segment Operating Income (loss) for all segments, which excludes unallocated corporate expenses. We use
Segment Operating Income (loss) for the purpose of calculating Adjusted Segment EBITDA.
(2) We define Adjusted EBITDA as consolidated net income before income tax provision, other non-operating income (expense), depreciation, amortization of intangible assets, remeasurement of acquisition-related contingent consideration, special charges, goodwill impairment charges
and losses on early extinguishment of debt. Amounts presented in the Adjusted EBITDA row for each segment reflect the segments’ respective Adjusted Segment EBITDA. We define Adjusted Segment EBITDA as a segment’s share of consolidated operating income (loss) before
depreciation, amortization of intangible assets, remeasurement of acquisition-related contingent consideration, special charges and goodwill impairment charges. We use Adjusted Segment EBITDA to internally evaluate the financial performance of our segments because we believe it
is a useful supplemental measure which reflects current core operating performance and provides an indicator of the segment’s ability to generate cash. We also believe that these measures, when considered together with our GAAP financial results, provide management and
investors with a more complete understanding of our operating results, including underlying trends, by excluding the effects of remeasurement of acquisition-related contingent consideration, special charges and goodwill impairment charges. In addition, EBITDA is a common
alternative measure of operating performance used by many of our competitors. It is used by investors, financial analysts, rating agencies and others to value and compare the financial performance of companies in our industry. Therefore, we also believe that these measures,
considered along with corresponding GAAP measures, provide management and investors with additional information for comparison of our operating results to the operating results of other companies. Adjusted EBITDA and Adjusted Segment EBITDA are not defined in the same
manner by all companies and may not be comparable to other similarly titled measures of other companies. These non-GAAP financial measures should be considered in addition to, but not as a substitute for or superior to, the information contained in our Condensed Consolidated
Statements of Comprehensive Income.
22
|
|

Critical Thinking at the Critical Time ™