Attached files
| file | filename |
|---|---|
| 8-K - 8-K - TELEFLEX INC | d764805d8k.htm |
 TELEFLEX INCORPORATED
SECOND QUARTER 2014
EARNINGS CONFERENCE CALL
1
Exhibit 99.1 |
 Conference Call Logistics
The release, accompanying slides, and replay webcast are available online at
www.teleflex.com (click on “Investors”)
Telephone replay available by dialing 888-286-8010 or for international
calls, 617- 801-6888, pass code number 18970797
2 |
 Introductions
Benson Smith
Chairman, President and CEO
Thomas Powell
Executive Vice President and CFO
Jake Elguicze
Treasurer and Vice President of Investor Relations
3 |
 Forward-Looking Statements/Non-GAAP Financial Measures
This presentation and our discussion contain forward-looking information and
statements including, but not limited to, forecasted
2014
constant
currency
revenue
growth,
adjusted
gross
margins,
adjusted
operating
margins
excluding
intangible
amortization expense and adjusted earnings per share; and other matters which
inherently involve risks and uncertainties which could cause actual results to
differ from those projected or implied in the forward–looking statements. These risks and
uncertainties are addressed in our SEC filings, including our most recent Form
10-K. This presentation includes the following non-GAAP financial
measures: Reconciliation of these non-GAAP financial measures to the most
comparable GAAP measures is contained within this presentation.
Unless otherwise noted, the following slides reflect continuing operations.
4
•
Adjusted diluted earnings per share. This measure excludes, depending on the
period presented (i) the effect of charges associated with our restructuring
programs, as well as goodwill and other asset impairment charges; (ii) losses and other
charges related to acquisition and integration costs, the reversal of liabilities
related to certain contingent consideration arrangements, the establishment
of a litigation reserve and a litigation verdict against the Company with respect to a non-
operating
joint
venture;
(iii)
amortization
of
the
debt
discount
on
the
Company’s
convertible
notes;
(iv)
intangible
amortization expense; and (v) tax benefits resulting from the resolution of, or
expiration of the statute of limitations with respect
to,
prior
years’
tax
matters.
In
addition,
the
calculation
of
diluted
shares
within
adjusted
earnings
per
share
gives
effect to the anti-dilutive impact of the Company’s convertible note hedge
agreements, which reduce the potential economic dilution that otherwise would
occur upon conversion of the Company’s senior subordinated convertible notes
(under GAAP, the anti-dilutive impact of the convertible note hedge agreements
is not reflected in diluted shares). •
Constant currency revenue growth. This measure excludes the impact of
translating the results of international subsidiaries
at
different
currency
exchange
rates
from
period
to
period.
•
Adjusted gross margin. This measure excludes the impact of certain losses and
other charges, primarily related to acquisition and integration costs.
•
Adjusted operating margin excluding intangible amortization expense. This
measure excludes (i) the impact of restructuring and other impairment
charges, (ii) losses and other charges primarily related to the reversal of contingent
consideration liabilities and acquisition and integration costs and (iii) the impact
of intangible amortization expense. •
Adjusted tax rate. This measure is the percentage of the Company’s
adjusted taxes on income from continuing operations to
its
adjusted
income
from
continuing
operations
before
taxes.
Adjusted
taxes
on
income
from
continuing
operations
excludes, depending on the period presented, the impact of tax benefits or costs
associated with (i) restructuring and impairment charges, (ii) amortization
of the debt discount on the Company’s convertible notes, (iii) intangible amortization
expense,
(iv)
the
resolution
of,
or
expiration
of
statutes
of
limitations
with
respect
to,
various
prior
years’
tax
matters
and
(v) losses and other charges related to related to acquisition and integration costs
and the reversal of liabilities related to certain contingent consideration
arrangements. |
 SECOND
QUARTER
2014
HIGHLIGHTS
5 |
 Second
Quarter Highlights Second quarter constant currency revenue growth and adjusted
earnings per share achievement exceeded our expectations
Revenue of $468.1 million, up 11.4% vs. prior year period on an as-
reported basis; up 10.1% vs. prior year period on a constant currency
basis
Adjusted EPS of $1.51, up 18.9% vs. prior year
6 |
 Second
Quarter Highlights Improvement in the average selling prices of products
contributes 193 bps of top-line growth in Q2’14 compared to
Q2’13 102 bps improvement in sales of existing products in Q2’14
compared to Q2’13 resulting from modest improvement in end-market
utilization New product introductions contribute 73 bps of top-line
growth in Q2’14 compared to Q2’13
Continue to expand GPO & IDN relationships
•
14 renewed agreements (9 GPO; 5 IDN)
7 |
 Second
Quarter Highlights Vidacare contributes 5.1% to Teleflex’s constant
currency revenue growth •
Q2’14 revenue of $21.3 million, ahead of initial internal expectations
•
Q2’14 revenue up ~ 30% versus Q2’13 on an as-reported basis
•
Integration activities on schedule
•
Continue to invest in additional clinical training and cadaver lab
workshops to drive future sustainable revenue growth
8 |
 ARROW-Clark™
VectorFlow™
Chronic Hemodialysis Catheter
Second Quarter Highlights
9
Received FDA 510(k) clearance to market the
ARROW-Clark ™
VectorFlow ™
Chronic
Hemodialysis Catheter.
PRODUCT UPDATE
ARROW-Clark ™
VectorFlow ™
Chronic
Hemodialysis Catheter features a
symmetrical tip design that allows ease of
placement and sustained high flows with
minimal recirculation. The ARROW-Clark ™
VectorFlow ™
Catheter is the only catheter
with an innovative tip designed to produce a
helical, three-dimensional transition of blood
entering and leaving the catheter.
PRODUCT DESCRIPTION |
 LMA
SureSeal™ PreCurved
LMA SureSeal™
PreCurved was developed
from the assets acquired from Ultimate
Medical and benefits the LMA™
portfolio by
giving customers the option of a first
generation, fixed curve device for ease of
insertion, with a silicone cuff for improved
patient comfort.
PRODUCT DESCRIPTION
Second Quarter Highlights
PRODUCT UPDATE
10
Announced the European launch of the CE
Marked LMA SureSeal™
PreCurved. |
 ARROW®
GPSCath®
Balloon Dilatation Catheters
Second Quarter Highlights
11
Received FDA 510(k) clearance to market the
ARROW®
GPSCath®
Balloon Dilatation
Catheters designed for use with .014”
guide
wires and in 150 cm length.
PRODUCT UPDATE
ARROW®
GPSCath®
Balloon Dilatation
Catheters combine angioplasty and targeted
injection in one device for use in below the
knee peripheral angioplasty procedures.
Enables clinicians to inject selected fluids,
such as contrast media, while maintaining
guide wire position.
PRODUCT DESCRIPTION |
 Mayo
Healthcare Pty Ltd. •
Contributed 2.24% to Teleflex’s constant currency revenue growth in Q2;
mixture of additional volume and improved pricing
•
Integration activities on schedule
Second Quarter Highlights
12 |
 SECOND QUARTER 2014 FINANCIAL REVIEW
13 |
 Financial Results
Revenue of $468.1 million
•
Up 11.4% vs. prior year period on an as-reported basis
•
Up 10.1% vs. prior year period on a constant currency basis
Adjusted gross margin of 52.3%
•
Up 254 bps vs. prior year period
Adjusted operating margin excluding intangible amortization expense of 21.0%,
up 109 bps vs. prior year period
Adjusted tax rate of 22.3%, down 370 bps versus prior year period
Adjusted EPS of $1.51, up 18.9% vs. prior year period
14 |
 Financial Results
15
•
Up 114% vs. prior year period
•
Repatriated $230 million of foreign cash; used repatriated cash to partially fund a
$235 million repayment of borrowings under revolving credit facility
•
Issued
$250
million
of
5.25%
senior
unsecured
notes
due
in
2024;
used
proceeds
to partially fund a $245 million repayment of borrowings under revolving credit
facility
Cash flow from operations for the first six months of 2014 of $120.2 million
Improved Balance Sheet
Announced manufacturing footprint rationalization plan to improve the
Company’s cost structure |
 SECOND QUARTER 2014 SEGMENT REVENUE REVIEW
16 |
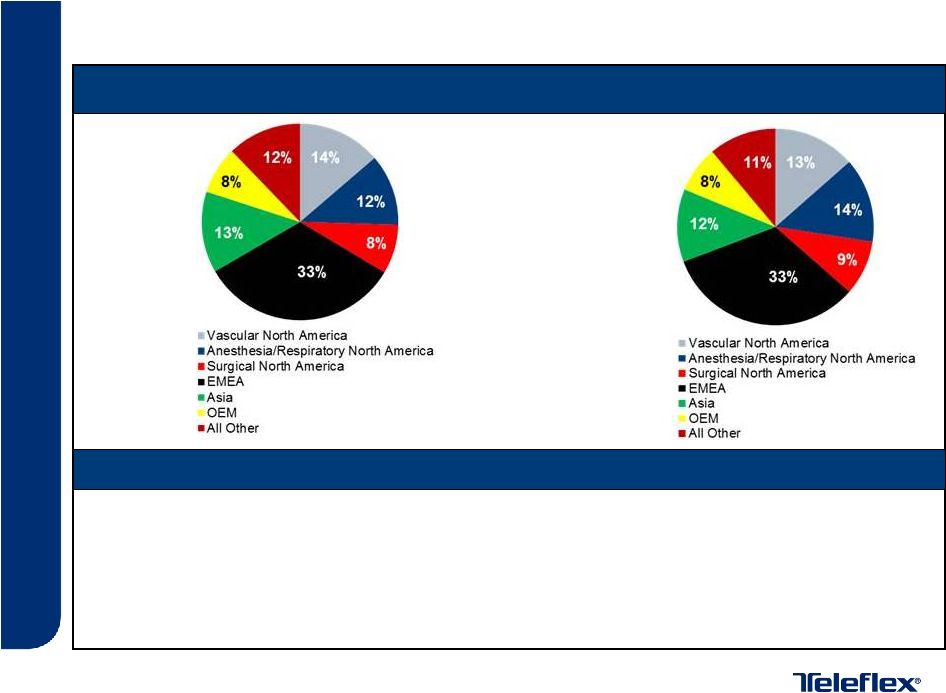 Segment Revenue Review
Q2’14
Q2’13
Vascular N.A: $64.2 million, up 13.5%
Anesthesia/Respiratory N.A: $55.0 million, down 5.7%
Surgical N.A: $38.0 million, up 1.3%
EMEA: $154.7 million, up 7.3%
Asia: $62.5 million, up 25.2%
OEM: $36.6 million, up 13.1%
All Other: $57.1 million, up 23.0%
Note:
Increases and decreases in revenue referred to above are as compared to results
for the second quarter of 2013. 17
Constant Currency Revenue Commentary |
 2014 FINANCIAL OUTLOOK
18 |
 2014
Financial Outlook 19
2014 guidance ranges reaffirmed:
2014 adjusted earnings per share guidance range increased:
•
Constant currency revenue growth of 7% to 9%
•
Adjusted gross margin of 52.0% to 52.5%
•
Adjusted operating margin excluding intangible amortization
expense of 20% to 21%
•
2014 guidance range for adjusted diluted earnings per share
increased from $5.35 to $5.55 to $5.45 to $5.60 |
 QUESTION & ANSWER
20 |
 APPENDICES
21 |
 Appendix A –
Reconciliation of Segment Constant Currency Revenue Growth
Dollars in Millions
22
June 29, 2014
June 30, 2013
Constant Currency
Currency
Total
Vascular
North
America
64.2
$
56.8
$
13.5%
(0.4%)
13.1%
Anesthesia/Respiratory
North
America
55.0
58.5
(5.7%)
(0.2%)
(5.9%)
Surgical
North
America
38.0
37.8
1.3%
(0.7%)
0.6%
EMEA
154.7
137.8
7.3%
4.9%
12.2%
Asia
62.5
50.4
25.2%
(1.1%)
24.1%
OEM
36.6
32.1
13.1%
0.9%
14.0%
All Other
57.1
46.7
23.0%
(0.7%)
22.3%
Net
Revenues
468.1
$
420.1
$
10.1%
1.3%
11.4%
Three Months Ended
% Increase / (Decrease) |
 Appendix B –
Reconciliation of Revenue Growth
Dollars in Millions
23
Year-over-
year growth
Three Months Ended June 30, 2013 Revenue As-Reported
$420.1
Foreign Currency
5.5
1.32%
Vidacare
21.3
5.07%
Mayo
9.4
2.24%
All other
11.8
2.80%
Three Months Ended June 29, 2014 Revenue As-Reported
$468.1
11.4% |
 24
Appendix C –
Reconciliation of Teleflex Gross Profit and Margin
June 29, 2014
June 30, 2013
Teleflex gross profit as-reported
244,088
$
209,490
$
Teleflex gross margin
as-reported 52.1%
49.9%
Losses and other charges (A)
880
(319)
Adjusted Teleflex gross profit
244,968
$
209,171
$
Adjusted Teleflex gross
margin 52.3%
49.8%
Teleflex revenue as-reported
468,105
$
420,059
$
$ thousands
Three Months Ended
A:
In
2014
losses
and
other
charges
primarily
relate
to
facility
consolidation
costs.
In
2013,
losses
and
other
charges
primarily
relate
to
acquisition
and
integration
costs. |
 25
Appendix D –
Reconciliation of Teleflex Operating Profit and Margin
June 29, 2014
June 30, 2013
Teleflex income from continuing operations before interest and taxes
74,752
$
63,751
$
Teleflex income from continuing operations before interest and taxes margin
16.0%
15.2%
Restructuring and other impairment charges
7,623
12,962
Losses and other charges (A)
(178)
(5,195)
Adjusted Teleflex income from continuing operations before interest and taxes
82,197
$
71,518
$
Adjusted Teleflex income from continuing operations before interest and taxes
margin
17.6%
17.0%
Intangible amortization expense
16,083
12,113
Adjusted Teleflex income from continuing operations before interest, taxes and
intangible amortization expense
98,280
$
83,631
$
Adjusted Teleflex income from continuing operations before interest, taxes and
intangible amortization expense margin
21.0%
19.9%
Teleflex revenue as-reported
468,105
$
420,059
$
$ thousands
Three Months Ended
A:
In 2014, losses and other charges primarily relate to the reversal of contingent
consideration liabilities; acquisition and integration costs; and charges
related to facility consolidations. In 2013, losses and other charges primarily relate to the reversal of contingent
consideration liabilities; and acquisition and integration costs.
|
 Appendix E –
EPS Reconciliation from Continuing Operations
Quarter Ended –
June 29, 2014
Dollars in millions, except per share data
26
Cost of
goods
sold
Research and
development
expenses
Restructuring
and other
impairment
charges
Interest
expense,
net
Income
taxes
Net income (loss)
attributable to common
shareholders from
continuing operations
GAAP Basis
$224.0
$14.9
$7.6
$15.9
$10.0
$48.4
$1.04
46,392
Adjustments
Restructuring and
other impairment
charges
Losses and other
charges (A)
Amortization of
debt discount on
convertible notes
Intangible
amortization
expense
—
—
—
—
4.4
11.7
$0.25
—
Tax adjustment (B)
—
—
—
—
—
—
$0.00
—
Shares due to
Teleflex under
note hedge (C)
Adjusted basis
$223.1
$14.8
—
$12.9
$19.0
$65.9
$1.51
43,678
(A) In 2014, losses and other charges include approximately ($4.4) million, net of tax, or
($0.09) per share, related to the reversal of contingent consideration liabilities; and
approximately $4.2 million, net of tax, or $0.09 per share, related to acquisition and integration costs, and charges related to facility consolidation.
(B) The tax adjustment represents a net benefit resulting from the resolution of, or the
expiration of statute of limitations with respect to various prior years’ U.S. federal,
state and foreign tax matters. (C) Adjusted diluted shares are calculated by giving effect
to the anti-dilutive impact of the Company’s convertible note hedge agreements, which reduce the
potential economic dilution that otherwise would occur upon conversion of our senior subordinated
convertible notes. Under GAAP, the anti-dilutive impact of the convertible note hedge
agreements is not reflected in diluted shares. $0.09
(2,714)
$131.9
—
16.1
—
—
—
—
—
—
—
—
$0.00
—
—
—
—
—
3.0
1.1
1.9
$0.04
4.2
$0.09
—
0.9
(1.1)
0.1
—
—
—
(0.2)
—
—
—
7.6
—
3.5
Diluted
earnings per
share available
to common
shareholders
Shares used
in calculation
of GAAP and
adjusted
earnings per
share
$146.8
Selling, general and
administrative
expenses |
 Appendix F –
EPS Reconciliation from Continuing Operations
Quarter Ended –
June 30, 2013
Dollars in millions, except per share data
27
Selling, general and
administrative
expenses
Research and
development
expenses
Restructuring
and other
impairment
charges
Interest
expense,
net
Income
taxes
Net income (loss)
attributable to common
shareholders from
continuing operations
GAAP Basis
$116.3
$16.5
$13.0
$14.3
$6.1
$43.2
$0.99
43,429
Adjustments
Restructuring and
other impairment
charges
Losses and other
charges (A)
(4.9)
—
—
—
0.8
(6.0)
($0.13)
—
Amortization of
debt discount on
convertible notes
Intangible
amortization
expense
12.1
—
—
—
4.2
7.9
$0.18
—
Tax adjustment (B)
Shares due to
Teleflex under note
hedge (C)
Adjusted basis
$109.0
$16.5
—
$11.5
$18.7
$53.2
$1.27
41,915
$0.04
(1,514)
$210.9
4.7
(4.7)
($0.11)
—
—
—
—
—
—
—
1.0
1.8
—
—
—
—
—
—
—
—
—
—
—
—
2.8
$0.04
—
2.0
11.0
$0.25
—
(0.3)
$210.6
—
—
—
13.0
(A) In 2013, losses and other charges include approximately ($7.1) million, net of tax, or ($0.16) per
share, related to the reversal of contingent consideration liabilities; approximately $1.5
million, net of tax, or $0.04 per share, related to acquisition and integration costs; and approximately ($0.4) million, net of tax, or
($0.01) per share, related to a reserve reversal associated with a previously announced stock keeping
unit (“SKU”) rationalization charge. (B) The tax adjustment represents a net
benefit resulting from the resolution of, or the expiration of statute of limitations with respect to various prior years’ U.S.
federal, state and foreign tax matters.
(C) Adjusted diluted shares are calculated by giving effect to the anti-dilutive impact of
the Company’s convertible note hedge agreements, which reduce the potential economic
dilution that otherwise would occur upon conversion of our senior subordinated convertible notes. Under GAAP, the anti-dilutive impact of the
convertible note hedge agreements is not reflected in diluted shares.
Cost of
goods
sold
Diluted
earnings per
share available
to common
shareholders
Shares used
in calculation
of GAAP and
adjusted
earnings per
share |
 28
Appendix G –
Reconciliation of Teleflex Tax Rate
Dollars in Thousands
Three Months Ended June 29, 2014
Income from
continuing
operations
before taxes
Taxes on
income from
continuing
operations
Tax rate
GAAP basis
$58,836
$10,006
17.0%
Restructuring and impairment charges
7,623
3,467
Losses and other charges (A)
(178)
5
Amortization of debt discount on convertible notes
3,012
1,100
Intangible amortization expense
16,083
4,410
Tax adjustment (B)
0
46
Adjusted basis
$85,376
$19,034
22.3%
Three Months Ended June 30, 2013
GAAP basis
$49,483
$6,082
12.3%
Restructuring and impairment charges
12,962
1,990
Losses and other charges (A)
(5,195)
810
Amortization of debt discount on convertible notes
2,790
1,019
Intangible amortization expense
12,113
4,186
Tax adjustment (B)
0
4,660
Adjusted basis
$72,153
$18,747
26.0%
(A) In 2014, losses and other charges primarily relate to the reversal of contingent
consideration liabilities, acquisition and integration costs, and charges related to facility
consolidations. In 2013, losses and other charges primarily relate to the reversal of
contingent consideration liabilities and acquisition and integration costs. (B) The tax
adjustment represents a net benefit resulting from the resolution of, or the expiration of statute of limitations
with respect to various prior years’ U.S. federal, state and foreign tax matters.
|
 Appendix H –
Reconciliation of 2014 Constant Currency Revenue Growth Guidance
29
Low
High
Forecasted GAAP Revenue Growth
7.0%
9.0%
Estimated impact of foreign currency fluctuations
Forecasted Constant Currency Revenue Growth
7.0%
9.0% |
 Appendix I –
Reconciliation of 2014 Gross Margin Guidance
30
Note:
In
2014,
losses
and
other
charges
relate
to
expenses
associated
with
the
Restructuring
Plan
approved
by
the
Board
of
Directors
on
April
28,
2014.
Low
High
GAAP Gross Margin
51.35%
51.80%
Losses and other charges
0.65%
0.70%
Adjusted Gross Margin
52.00%
52.50% |
 Appendix J –
Reconciliation of 2014 Operating Margin Guidance
31
Note:
In 2014, losses and other charges include expenses associated with the Restructuring
Plan approved by the Board of Directors on April 28, 2014, acquisition costs
and the reversal of contingent consideration liabilities. Low
High
GAAP Operating Margin
15.8%
16.7%
Losses and other charges
0.7%
0.8%
Adjusted Operating Margin
16.5%
17.5%
Intangible amortization expense
3.5%
3.5%
Adjusted Operating Margin Excluding Intangible Amortization Expense
20.0%
21.0% |
 Appendix K –
Reconciliation of 2014 Adjusted Earnings per Share Guidance
32
Low
High
Forecasted diluted earnings per share attributable to
common shareholders
$3.50
$3.60
Restructuring, impairment charges, and special items,
net of tax
$0.85
$0.90
Intangible amortization expense, net of tax
$0.93
$0.93
Amortization of debt discount on convertible notes,
net of tax
$0.17
$0.17
Forecasted adjusted diluted earnings per share
$5.45
$5.60 |