Attached files
| file | filename |
|---|---|
| 8-K - FORM 8-K - PUBLIC SERVICE ENTERPRISE GROUP INC | d765207d8k.htm |
| EX-99.1 - EX-99.1 - PUBLIC SERVICE ENTERPRISE GROUP INC | d765207dex991.htm |
EXHIBIT 99

|
Investor News
|
NYSE: PEG
|
For further information, contact:
| Ø | Kathleen A. Lally, Vice President – Investor Relations | Phone: 973-430-6565 | ||||
| Ø | Carlotta Chan, Manager – Investor Relations | Phone: 973-430-6596 |
PSEG ANNOUNCES 2014 SECOND QUARTER RESULTS
Net Income of $0.42 Per Share; Operating Earnings of $0.49 Per Share
Operating Earnings Expected to be at Upper End of Full Year Guidance of $2.55 - $2.75 Per Share
July 30, 2014 (Newark, NJ) (NYSE- PEG) Public Service Enterprise Group (PSEG) reported today Second Quarter 2014 Net Income of $212 million or $0.42 per share as compared to Net Income of $333 million or $0.66 per share reported for the Second Quarter of 2013. Operating Earnings for the Second Quarter of 2014 were $245 million or $0.49 per share compared to the Second Quarter of 2013 Operating Earnings of $243 million or $0.48 per share.
“Our results in the second quarter reflect the benefit of our diversified business model, the growth in our regulated utility company capital program and our long-term focus on operating in a safe, reliable manner as we meet the needs of our customers and shareholders,” said Ralph Izzo, chairman, president and chief executive officer. “The primary driver of growth – increased investment in transmission in our utility, PSE&G – remained strong in the second quarter offsetting the impact from mixed operating conditions. We are delivering on the growth potential of our multi-billion dollar capital program while at the same time our favorable natural gas supply position continues to yield benefits for customers and shareholders. PSE&G remains on course to provide greater than 50% of our forecast operating earnings for the year as Power is well positioned to generate solid earnings and free cash flow. Based on our performance thus far in the year, and assuming normal weather and operations over the remainder of the year, we expect operating earnings for the full year to be at the upper end of our guidance of $2.55 – $2.75 per share.”
PSEG believes that the non-GAAP financial measure of “Operating Earnings” provides a consistent and comparable measure of performance of its businesses to help shareholders understand performance trends. Operating Earnings exclude the impact of returns/(losses) associated with Nuclear Decommissioning Trust (NDT), Mark-to-Market (MTM) accounting and other material one-time items. The table below provides a reconciliation of PSEG’s Net Income to Operating Earnings for the second quarter. See Attachment 12 for a complete list of items excluded from Net Income in the determination of Operating Earnings.
Izzo continued, “The recent approval of PSE&G’s $1.22 billion Energy Strong program is expected to further support PSE&G’s double-digit growth in rate base. We have confidence in our ability to deliver on the promise for growth offered by our 5-year, $11.3 billion dollar capital program. Even so, we continue to enjoy a strong balance sheet that positions the company well for long-term growth.”
PSEG CONSOLIDATED EARNINGS (unaudited)
Second Quarter Comparative Results
2014 and 2013
| Income | Diluted Earnings | |||||||||||||||
| ($millions) | Per Share | |||||||||||||||
| 2014 | 2013 | 2014 | 2013 | |||||||||||||
| Operating Earnings |
$ | 245 | $ 243 | $ | 0.49 | $ | 0.48 | |||||||||
| Reconciling Items |
(33 | ) | 90 | (0.07 | ) | 0.18 | ||||||||||
|
|
|
|
|
|
|
|
|
|||||||||
| Net Income |
$ | 212 | $ 333 | $ | 0.42 | $ | 0.66 | |||||||||
|
|
|
|
|
|
|
|
|
|||||||||
| Avg. Shares | 508M | 507M | ||||||||||||||
Operating Earnings guidance by company for the full year is as follows:
| Operating Earnings | ||
| ($ millions, except EPS) | ||
| 2014E | ||
| PSE&G |
$705 - $745 | |
| PSEG Power |
$550 - $610 | |
| PSEG Enterprise/Other |
$35 - $40 | |
|
| ||
| Total |
$1,290 - $1,395 | |
|
| ||
| Earnings Per Share |
$2.55 - $2.75 | |
|
| ||
We anticipate results for the full year, assuming normal weather and operations over the remainder of the year, to be at the upper end of the company guidance range, driven by year-to-date performance and expectations for Power.
Operating Earnings Review and Outlook by Operating Subsidiary
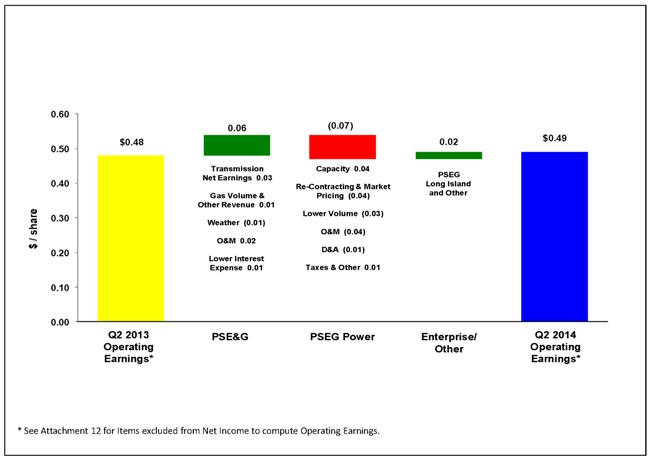
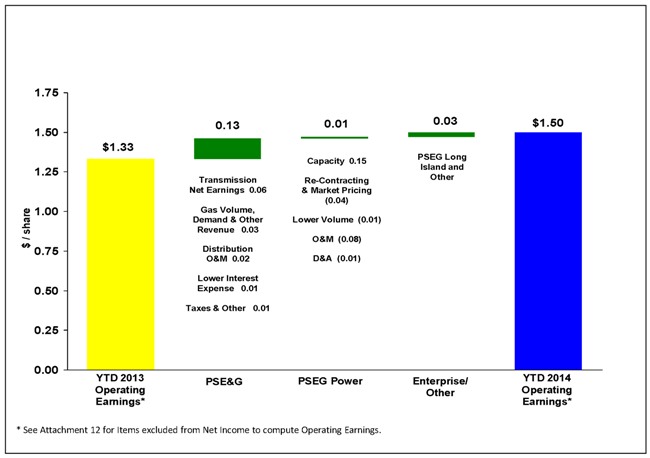
See Attachment 6 for detail regarding the quarter-over-quarter reconciliations for each of PSEG’s businesses.
PSE&G
PSE&G reported operating earnings of $151 million ($0.30 per share) for the second quarter of 2014 compared with operating earnings of $121 million ($0.24 per share) for the second quarter of 2013.
PSE&G’s operating results have been influenced by an increase in revenue associated with an expansion in its capital program and a decline in operating and financial costs.
PSE&G’s second quarter results reflect the contribution to earnings from higher transmission revenues associated with an increase in capital investment. A Federal Energy Regulatory Commission (FERC) approved increase in PSE&G’s transmission revenue under the company’s formula rate, effective on January 1, 2014, supported a quarter-over-quarter increase in the net earnings contribution from transmission of $0.03 per share.
Sales and margin from increased demand for gas improved quarter-over-quarter earnings comparisons by $0.01 per share. This improvement in earnings, however, was offset by weather conditions during the second quarter which were unfavorable relative to normal and in comparison to conditions experienced in the year-ago quarter. A focus on controlling the growth in operating expenses, including a decline in pension expense, led to an improvement in quarter-over-quarter earnings of $0.02 per share. Although the level of debt on the balance sheet has increased with an expansion in the capital program, the overall cost of financing has declined as the result of re-financing activity and a decline in interest rates. The reduction in financing costs improved earnings comparisons quarter-over-quarter by $0.01 per share.
Economic conditions in the service area continue to exhibit signs of slow improvement. During the quarter, weather normalized electric sales grew by 1.9%. The favorable quarter-over-quarter sales comparisons, however, were heavily influenced by weakness in the industrial sector in the year ago quarter. Weather-normalized growth in residential electric sales of 0.5% during the quarter is consistent with customer growth. And growth in weather-normalized electric sales to the commercial sector of 1.3% is more reflective of the local economy. On a weather-normalized basis, sales of gas in the first half improved by 4.4% which reflects a fundamental improvement in market conditions given declining prices and economic conditions.
The NJ Board of Public Utilities (BPU) approved the capital expenditure of $1.22 billion under the settlement of PSE&G’s Energy Strong Proposal most of which will be spent over a 3-year period. The spending on Energy Strong brings PSE&G’s five-year capital program to approximately $11.3 billion versus its previous forecast of $10.1 billion in capital spending over the 2014 – 2018 time period.
PSE&G, as part of its Annual BGSS filing with the BPU, requested a 9% reduction in annual gas rates for residential customers effective October 1, 2014. The reduction reflects the continued benefits associated with the company’s long-term supply arrangements, and would be the latest in a series of reductions in gas rates which have lowered customer bills 44% in the past five years.
The forecast of PSE&G’s operating earnings for 2014 remains $705 - $745 million. Results for the remainder of the year will continue to reflect an increase in transmission revenue and a reduction in operating and maintenance costs including pension expense.
PSEG Power
PSEG Power reported operating earnings of $87 million ($0.17 per share) for the second quarter of 2014 compared with operating earnings of $120 million ($0.24 per share) for the second quarter of 2013.
Power’s operating results for the second quarter reflect primarily the impact on production and O&M expenses associated with an extended outage at the Salem 2 nuclear facility and the installation of equipment at the Linden gas-fired combined cycle facility to increase the unit’s capacity. The fleet’s net long position allowed Power to meet its hedged obligations from its own generation.
Earnings in the quarter benefited from higher capacity revenue. Power received capacity prices of $242/MW-day during the first two months of the quarter versus $153/MW-day in the year-ago period before capacity prices reset to $166/MW-day effective June 1, 2014. The $0.04 per share increase in capacity revenue was offset by a decline in average hedge prices. Power’s access to low-cost gas under its firm transportation contracts supported off-system sales of gas and reduced the cost of gas for its fleet. These benefits offset the negative impact from lower market prices in the east resulting from transmission and generation outages outside the region. The extended outage at Salem 2 and the outage to complete the capacity uprate work at the gas-fired Linden station were partially offset by incremental production at the coal-fired and peaking units and combined to lower quarter-over-quarter earnings by $0.03 per share.
Operation and maintenance expense (O&M) was higher than the level experienced in the year ago quarter. The completion of initiatives that increased the capacity at the Linden generating station and the cost of the repair work at Salem 2 more than offset the benefit from lower pension expense and reduced quarter-over-quarter earnings by $0.04 per share. An increase in depreciation was offset by a reduction in the tax rate and other miscellaneous items.
Output from Power’s fleet was 5% lower in the second quarter compared to year-ago levels. Power determined in mid-May it was necessary to extend Salem 2’s refueling outage to inspect and repair the reactor’s coolant pumps. The unit returned to service on July 14, 2014. The extended outage reduced the nuclear fleet’s output in the quarter by 9% to 6.5 TWh, 54% of generation, and lowered the nuclear fleet’s average capacity factor in the quarter to 80.5%. Production from the gas-fired combined cycle fleet declined 11% in the quarter to 3.6 TWh, 30% of production, as work related to an expansion of capacity at Linden kept the unit out of service early in the quarter. The retrofit work at Linden is expected to increase the unit’s capacity by approximately 63 MW. Production from the coal-fired and peaking units increased 27% to 1.9 TWh, 16% of generation, with improved market economics.
Power has reduced the upper end of its forecast of output for the full year to 56 – 57 TWh from 56 – 58 TWh to take into account the results for the second quarter. The forecast, which represents an increase of 4% - 6% in output for the year, continues to reflect normal operations and weather. Approximately 70% - 75% of generation for the second half of the year is hedged at an average price of $50 per MWh. Power has slightly increased its forecast of economic generation for 2015 and 2016 to 55 – 57 TWh per year from 54 – 56 TWh. For 2015, Power has hedged 65% - 70% of its forecast generation at an average price of $50 per MWh; for 2016, Power has hedged approximately 30% - 35% of its generation at an average price of $51 per MWh. Power increased the percent of generation hedged in 2015 and 2016 to the upper end of limits it would normally take at this time to take advantage of market strength in the quarter. The hedge data for 2015 also assumes BGS volumes represent 11 TWh of demand – more in line with forecast volumes for 2014 – than the prior forecast which assumed BGS volumes of 10 TWh.
The forecast range of Power’s operating earnings for 2014 remains unchanged at $550 - $610 million with full year operating earnings expected to be at the upper end of the range. Results for the remainder of the year will be influenced by a reset in the average price received on PJM capacity to $166/MW-day from $242/MW-day and a decline in the average price of energy hedges. O&M expense is expected to compare favorably in the second half of the year given a reduction in pension expense and the absence of major outage-related work.
PSEG Enterprise/Other
PSEG Enterprise/Other reported operating earnings of $7 million ($0.02 per share) for the second quarter of 2014 versus operating earnings of $2 million ($0.00 per share) during the second quarter of 2013. The results reflect the inclusion of earnings from PSEG-Long Island’s operating contract and the absence of charges in the year-ago quarter.
PSEG-Long Island, on July 1, 2014, filed its Utility 2.0 proposal which calls for investing $200 million in energy efficiency, demand resources, distributed generation and related programs over a 4-year period beginning in 2015. A decision on the proposal is expected in December 2014.
The forecast of PSEG Enterprise/Other full year operating earnings for 2014 is unchanged at $35 - $40 million.
Other Items
PSEG Power notified the FERC, PJM and the PJM Independent Market Monitor (IMM) in the first quarter that it found certain errors in the cost-based component of its bids for its fossil generation units. In the first quarter, Power recorded a charge to income of $25 million based on the information available at that time. Upon discovery of the errors, PSEG commenced an investigation and has since notified the FERC, PJM and the IMM that additional pricing errors in the cost-based bids were identified and it was further determined that the quantity of energy that Power offered into the energy market for its fossil peaking units differed from the amounts for which Power was compensated in the capacity market for those units. PSEG informed the FERC, PJM and the IMM of these additional issues, and has corrected these errors. PSEG does not have access to PJM’s proprietary data to determine if the differences in quantity had any impact, and if so the level of that impact. FERC has the authority to investigate the matter, which could result in FERC seeking disgorgement of any over-collected amounts, civil penalties and non-financial remedies. Power has corrected processes to ensure that the pricing errors identified in the calculations of the bids and differences in quantities offered into the energy market from those in the capacity market have been corrected. Power is also in the process of implementing procedures to help mitigate the risk of similar issues occurring in the future. It is not possible at this time to reasonably estimate the ultimate impact or predict any resulting penalties, other costs associated with this matter, or the applicability of mitigating factors.
######
FORWARD-LOOKING STATEMENT
Certain of the matters discussed in this report about our and our subsidiaries’ future performance, including, without limitation, future revenues, earnings, strategies, prospects, consequences and all other statements that are not purely historical constitute “forward-looking statements” within the meaning of the Private Securities Litigation Reform Act of 1995. Such forward-looking statements are subject to risks and uncertainties, which could cause actual results to differ materially from those anticipated. Such statements are based on management’s beliefs as well as assumptions made by and information currently available to management. When used herein, the words “anticipate,” “intend,” “estimate,” “believe,” “expect,” “plan,” “should,” “hypothetical,” “potential,” “forecast,” “project,” variations of such words and similar expressions are intended to identify forward-looking statements. Factors that may cause actual results to differ are often presented with the forward-looking statements themselves. Other factors that could cause actual results to differ materially from those contemplated in any forward-looking statements made by us herein are discussed in filings we make with the United States Securities and Exchange Commission (SEC), including our Annual Report on Form 10-K and subsequent reports on Form 10-Q and Form 8-K and available on our website: http://www.pseg.com. These factors include, but are not limited to:
| • | adverse changes in the demand for or the price of the capacity and energy that we sell into wholesale electricity markets, |
| • | adverse changes in energy industry law, policies and regulation, including market structures and a potential shift away from competitive markets toward subsidized market mechanisms, transmission planning and cost allocation rules, including rules regarding how transmission is planned and who is permitted to build transmission in the future, and reliability standards, |
| • | any inability of our transmission and distribution businesses to obtain adequate and timely rate relief and regulatory approvals from federal and state regulators, |
| • | changes in federal and state environmental regulations and enforcement that could increase our costs or limit our operations, |
| • | changes in nuclear regulation and/or general developments in the nuclear power industry, including various impacts from any accidents or incidents experienced at our facilities or by others in the industry, that could limit operations of our nuclear generating units, |
| • | actions or activities at one of our nuclear units located on a multi-unit site that might adversely affect our ability to continue to operate that unit or other units located at the same site, |
| • | any inability to manage our energy obligations, available supply and risks, |
| • | adverse outcomes of any legal, regulatory or other proceeding, settlement, investigation or claim applicable to us and/or the energy industry, |
| • | any deterioration in our credit quality or the credit quality of our counterparties, |
| • | availability of capital and credit at commercially reasonable terms and conditions and our ability to meet cash needs, |
| • | changes in the cost of, or interruption in the supply of, fuel and other commodities necessary to the operation of our generating units, |
| • | delays in receipt of necessary permits and approvals for our construction and development activities, |
| • | delays or unforeseen cost escalations in our construction and development activities, |
| • | any inability to achieve, or continue to sustain, our expected levels of operating performance, |
| • | any equipment failures, accidents, severe weather events or other incidents that impact our ability to provide safe and reliable service to our customers, and any inability to obtain sufficient insurance coverage or recover proceeds of insurance with respect to such events, |
| • | acts of terrorism, cybersecurity attacks or intrusions that could adversely impact our businesses, |
| • | increases in competition in energy supply markets as well as competition for certain transmission projects, |
| • | any inability to realize anticipated tax benefits or retain tax credits, |
| • | challenges associated with recruitment and/or retention of a qualified workforce, |
| • | adverse performance of our decommissioning and defined benefit plan trust fund investments and changes in funding requirements, |
| • | changes in technology, such as distributed generation and micro grids, and greater reliance on these technologies, and |
| • | changes in customer behaviors, including increases in energy efficiency, net-metering and demand response. |
All of the forward-looking statements made in this report are qualified by these cautionary statements and we cannot assure you that the results or developments anticipated by management will be realized or even if realized, will have the expected consequences to, or effects on, us or our business prospects, financial condition or results of operations. Readers are cautioned not to place undue reliance on these forward-looking statements in making any investment decision. Forward-looking statements made in this report apply only as of the date of this report. While we may elect to update forward-looking statements from time to time, we specifically disclaim any obligation to do so, even if internal estimates change, unless otherwise required by applicable securities laws.
The forward-looking statements contained in this report are intended to qualify for the safe harbor provisions of Section 27A of the Securities Act of 1933, as amended, and Section 21E of the Securities Exchange Act of 1934, as amended.
Attachment 1
PUBLIC SERVICE ENTERPRISE GROUP INCORPORATED
Operating Earnings and Per Share Results by Subsidiary
(Unaudited)
| Three Months Ended June 30, |
Six Months Ended June 30, |
|||||||||||||||
| 2014 | 2013 | 2014 | 2013 | |||||||||||||
| Earnings Results ($ Millions) |
||||||||||||||||
| PSE&G |
$ | 151 | $ | 121 | $ | 365 | $ | 300 | ||||||||
| PSEG Power |
87 | 120 | 380 | 374 | ||||||||||||
| PSEG Enterprise/Other |
7 | 2 | 15 | 2 | ||||||||||||
|
|
|
|
|
|
|
|
|
|||||||||
| Operating Earnings |
$ | 245 | $ | 243 | $ | 760 | $ | 676 | ||||||||
|
|
|
|
|
|
|
|
|
|||||||||
| Reconciling Items(a) |
(33 | ) | 90 | (162 | ) | (23 | ) | |||||||||
|
|
|
|
|
|
|
|
|
|||||||||
| Net Income |
$ | 212 | $ | 333 | $ | 598 | $ | 653 | ||||||||
|
|
|
|
|
|
|
|
|
|||||||||
|
|
|
|
|
|
|
|
|
|||||||||
| Fully Diluted Average Shares Outstanding (in Millions) |
508 | 507 | 508 | 507 | ||||||||||||
|
|
|
|
|
|
|
|
|
|||||||||
| Per Share Results (Diluted) |
||||||||||||||||
| PSE&G |
$ | 0.30 | $ | 0.24 | $ | 0.72 | $ | 0.59 | ||||||||
| PSEG Power |
0.17 | 0.24 | 0.75 | 0.74 | ||||||||||||
| PSEG Enterprise/Other |
0.02 | — | 0.03 | — | ||||||||||||
|
|
|
|
|
|
|
|
|
|||||||||
| Operating Earnings |
$ | 0.49 | $ | 0.48 | $ | 1.50 | $ | 1.33 | ||||||||
|
|
|
|
|
|
|
|
|
|||||||||
| Reconciling Items(a) |
(0.07 | ) | 0.18 | (0.32 | ) | (0.04 | ) | |||||||||
|
|
|
|
|
|
|
|
|
|||||||||
| Net Income |
$ | 0.42 | $ | 0.66 | $ | 1.18 | $ | 1.29 | ||||||||
|
|
|
|
|
|
|
|
|
|||||||||
| (a) | See Attachment 12 for details of items excluded from Net Income to compute Operating Earnings. |
Attachment 2
PUBLIC SERVICE ENTERPRISE GROUP INCORPORATED
Consolidating Statements of Operations
(Unaudited, $ Millions)
| Three Months Ended June 30, 2014 | ||||||||||||||||
| PSEG | PSEG Enterprise/ Other(a) |
PSEG Power |
PSE&G | |||||||||||||
| OPERATING REVENUES |
$ | 2,249 | $ | (172 | ) | $ | 986 | $ | 1,435 | |||||||
| OPERATING EXPENSES |
||||||||||||||||
| Energy Costs |
789 | (296 | ) | 520 | 565 | |||||||||||
| Operation and Maintenance |
800 | 111 | 327 | 362 | ||||||||||||
| Depreciation and Amortization |
295 | 6 | 72 | 217 | ||||||||||||
|
|
|
|
|
|
|
|
|
|||||||||
| Total Operating Expenses |
1,884 | (179 | ) | 919 | 1,144 | |||||||||||
|
|
|
|
|
|
|
|
|
|||||||||
| OPERATING INCOME |
365 | 7 | 67 | 291 | ||||||||||||
| Income from Equity Method Investments |
3 | — | 3 | — | ||||||||||||
| Other Income and (Deductions) |
52 | 2 | 37 | 13 | ||||||||||||
| Other Than Temporary Impairments |
(2 | ) | — | (2 | ) | — | ||||||||||
| Interest Expense |
(94 | ) | 2 | (29 | ) | (67 | ) | |||||||||
|
|
|
|
|
|
|
|
|
|||||||||
| INCOME BEFORE INCOME TAXES |
324 | 11 | 76 | 237 | ||||||||||||
| Income Tax Benefit (Expense) |
(112 | ) | (4 | ) | (22 | ) | (86 | ) | ||||||||
|
|
|
|
|
|
|
|
|
|||||||||
| NET INCOME |
$ | 212 | $ | 7 | $ | 54 | $ | 151 | ||||||||
|
|
|
|
|
|
|
|
|
|||||||||
| OPERATING EARNINGS |
$ | 245 | $ | 7 | $ | 87 | $ | 151 | ||||||||
| Reconciling Items Excluded from Net Income(b) |
(33 | ) | — | (33 | ) | — | ||||||||||
|
|
|
|
|
|
|
|
|
|||||||||
| NET INCOME |
$ | 212 | $ | 7 | $ | 54 | $ | 151 | ||||||||
|
|
|
|
|
|
|
|
|
|||||||||
| Three Months Ended June 30, 2013 | ||||||||||||||||
| PSEG | PSEG Enterprise/ Other(a) |
PSEG Power |
PSE&G | |||||||||||||
| OPERATING REVENUES |
$ | 2,310 | $ | (306 | ) | $ | 1,193 | $ | 1,423 | |||||||
| OPERATING EXPENSES |
||||||||||||||||
| Energy Costs |
755 | (320 | ) | 495 | 580 | |||||||||||
| Operation and Maintenance |
646 | (3 | ) | 280 | 369 | |||||||||||
| Depreciation and Amortization |
283 | 9 | 67 | 207 | ||||||||||||
| Taxes Other Than Income Taxes |
14 | — | — | 14 | ||||||||||||
|
|
|
|
|
|
|
|
|
|||||||||
| Total Operating Expenses |
1,698 | (314 | ) | 842 | 1,170 | |||||||||||
|
|
|
|
|
|
|
|
|
|||||||||
| OPERATING INCOME |
612 | 8 | 351 | 253 | ||||||||||||
| Income from Equity Method Investments |
3 | (2 | ) | 5 | — | |||||||||||
| Other Income and (Deductions) |
39 | — | 25 | 14 | ||||||||||||
| Other Than Temporary Impairments |
(2 | ) | — | (2 | ) | — | ||||||||||
| Interest Expense |
(101 | ) | 3 | (29 | ) | (75 | ) | |||||||||
|
|
|
|
|
|
|
|
|
|||||||||
| INCOME BEFORE INCOME TAXES |
551 | 9 | 350 | 192 | ||||||||||||
| Income Tax Benefit (Expense) |
(218 | ) | (7 | ) | (140 | ) | (71 | ) | ||||||||
|
|
|
|
|
|
|
|
|
|||||||||
| NET INCOME |
$ | 333 | $ | 2 | $ | 210 | $ | 121 | ||||||||
|
|
|
|
|
|
|
|
|
|||||||||
| OPERATING EARNINGS |
$ | 243 | $ | 2 | $ | 120 | $ | 121 | ||||||||
| Reconciling Items Excluded from Net Income(b) |
90 | — | 90 | — | ||||||||||||
|
|
|
|
|
|
|
|
|
|||||||||
| NET INCOME |
$ | 333 | $ | 2 | $ | 210 | $ | 121 | ||||||||
|
|
|
|
|
|
|
|
|
|||||||||
| (a) | Includes activities at Energy Holdings, PSEG Long Island and the Parent as well as intercompany eliminations. |
| (b) | See Attachment 12 for details of items excluded from Net Income to compute Operating Earnings. |
Attachment 3
PUBLIC SERVICE ENTERPRISE GROUP INCORPORATED
Consolidating Statements of Operations
(Unaudited, $ Millions)
| Six Months Ended June 30, 2014 | ||||||||||||||||
| PSEG | PSEG Enterprise/ Other(a) |
PSEG Power |
PSE&G | |||||||||||||
| OPERATING REVENUES |
$ | 5,472 | $ | (794 | ) | $ | 2,686 | $ | 3,580 | |||||||
| OPERATING EXPENSES |
||||||||||||||||
| Energy Costs |
2,145 | (1,029 | ) | 1,564 | 1,610 | |||||||||||
| Operation and Maintenance |
1,656 | 203 | 629 | 824 | ||||||||||||
| Depreciation and Amortization |
601 | 13 | 144 | 444 | ||||||||||||
|
|
|
|
|
|
|
|
|
|||||||||
| Total Operating Expenses |
4,402 | (813 | ) | 2,337 | 2,878 | |||||||||||
|
|
|
|
|
|
|
|
|
|||||||||
| OPERATING INCOME |
1,070 | 19 | 349 | 702 | ||||||||||||
| Income from Equity Method Investments |
7 | — | 7 | — | ||||||||||||
| Other Income and (Deductions) |
88 | 1 | 60 | 27 | ||||||||||||
| Other Than Temporary Impairments |
(4 | ) | — | (4 | ) | — | ||||||||||
| Interest Expense |
(191 | ) | 5 | (61 | ) | (135 | ) | |||||||||
|
|
|
|
|
|
|
|
|
|||||||||
| INCOME BEFORE INCOME TAXES |
970 | 25 | 351 | 594 | ||||||||||||
| Income Tax Benefit (Expense) |
(372 | ) | (10 | ) | (133 | ) | (229 | ) | ||||||||
|
|
|
|
|
|
|
|
|
|||||||||
| NET INCOME |
$ | 598 | $ | 15 | $ | 218 | $ | 365 | ||||||||
|
|
|
|
|
|
|
|
|
|||||||||
| OPERATING EARNINGS |
$ | 760 | $ | 15 | $ | 380 | $ | 365 | ||||||||
| Reconciling Items Excluded from Net Income(b) |
(162 | ) | — | (162 | ) | — | ||||||||||
|
|
|
|
|
|
|
|
|
|||||||||
| NET INCOME |
$ | 598 | $ | 15 | $ | 218 | $ | 365 | ||||||||
|
|
|
|
|
|
|
|
|
|||||||||
| Six Months Ended June 30, 2013 | ||||||||||||||||
| PSEG | PSEG Enterprise/ Other(a) |
PSEG Power |
PSE&G | |||||||||||||
| OPERATING REVENUES |
$ | 5,096 | $ | (966 | ) | $ | 2,644 | $ | 3,418 | |||||||
| OPERATING EXPENSES |
||||||||||||||||
| Energy Costs |
1,910 | (992 | ) | 1,355 | 1,547 | |||||||||||
| Operation and Maintenance |
1,356 | (3 | ) | 563 | 796 | |||||||||||
| Depreciation and Amortization |
573 | 18 | 133 | 422 | ||||||||||||
| Taxes Other Than Income Taxes |
35 | — | — | 35 | ||||||||||||
|
|
|
|
|
|
|
|
|
|||||||||
| Total Operating Expenses |
3,874 | (977 | ) | 2,051 | 2,800 | |||||||||||
|
|
|
|
|
|
|
|
|
|||||||||
| OPERATING INCOME |
1,222 | 11 | 593 | 618 | ||||||||||||
| Income from Equity Method Investments |
5 | (3 | ) | 8 | — | |||||||||||
| Other Income and (Deductions) |
71 | 1 | 44 | 26 | ||||||||||||
| Other Than Temporary Impairments |
(4 | ) | — | (4 | ) | — | ||||||||||
| Interest Expense |
(203 | ) | 4 | (59 | ) | (148 | ) | |||||||||
|
|
|
|
|
|
|
|
|
|||||||||
| INCOME BEFORE INCOME TAXES |
1,091 | 13 | 582 | 496 | ||||||||||||
| Income Tax Benefit (Expense) |
(438 | ) | (11 | ) | (231 | ) | (196 | ) | ||||||||
|
|
|
|
|
|
|
|
|
|||||||||
| NET INCOME |
$ | 653 | $ | 2 | $ | 351 | $ | 300 | ||||||||
|
|
|
|
|
|
|
|
|
|||||||||
| OPERATING EARNINGS |
$ | 676 | $ | 2 | $ | 374 | $ | 300 | ||||||||
| Reconciling Items Excluded from Net Income(b) |
(23 | ) | — | (23 | ) | — | ||||||||||
|
|
|
|
|
|
|
|
|
|||||||||
| NET INCOME |
$ | 653 | $ | 2 | $ | 351 | $ | 300 | ||||||||
|
|
|
|
|
|
|
|
|
|||||||||
| (a) | Includes activities at Energy Holdings, PSEG Long Island and the Parent as well as intercompany eliminations. |
| (b) | See Attachment 12 for details of items excluded from Net Income to compute Operating Earnings. |
Attachment 4
PUBLIC SERVICE ENTERPRISE GROUP INCORPORATED
Capitalization Schedule
(Unaudited, $ Millions)
| June 30, 2014 |
December 31, 2013 |
|||||||
| DEBT |
||||||||
| Long-Term Debt |
$ | 8,626 | $ | 8,131 | ||||
| Securitization Debt |
385 | 496 | ||||||
| Project Level, Non-Recourse Debt |
16 | 16 | ||||||
|
|
|
|
|
|||||
| Total Debt |
9,027 | 8,643 | ||||||
| STOCKHOLDERS’ EQUITY |
||||||||
| Common Stock |
4,865 | 4,861 | ||||||
| Treasury Stock |
(630 | ) | (615 | ) | ||||
| Retained Earnings |
7,681 | 7,457 | ||||||
| Accumulated Other Comprehensive Loss |
(73 | ) | (95 | ) | ||||
|
|
|
|
|
|||||
| Total Common Stockholders’ Equity |
11,843 | 11,608 | ||||||
| Noncontrolling Interests - Equity Investments |
1 | 1 | ||||||
|
|
|
|
|
|||||
| Total Equity |
11,844 | 11,609 | ||||||
|
|
|
|
|
|||||
| Total Capitalization |
$ | 20,871 | $ | 20,252 | ||||
|
|
|
|
|
|||||
Attachment 5
PUBLIC SERVICE ENTERPRISE GROUP INCORPORATED
CONDENSED CONSOLIDATED STATEMENTS OF CASH FLOWS
(Unaudited, $ Millions)
| Six Months Ended June 30, | ||||||||
| 2014 | 2013 | |||||||
| CASH FLOWS FROM OPERATING ACTIVITIES |
||||||||
| Net Income |
$ | 598 | $ | 653 | ||||
| Adjustments to Reconcile Net Income to Net Cash Flows From Operating Activities |
850 | 690 | ||||||
|
|
|
|
|
|||||
| NET CASH PROVIDED BY OPERATING ACTIVITIES |
1,448 | 1,343 | ||||||
|
|
|
|
|
|||||
| NET CASH USED IN INVESTING ACTIVITIES |
(1,282 | ) | (1,379 | ) | ||||
|
|
|
|
|
|||||
| NET CASH USED IN FINANCING ACTIVITIES |
(89 | ) | (179 | ) | ||||
|
|
|
|
|
|||||
| Net Change in Cash and Cash Equivalents |
77 | (215 | ) | |||||
| Cash and Cash Equivalents at Beginning of Period |
493 | 379 | ||||||
|
|
|
|
|
|||||
| Cash and Cash Equivalents at End of Period |
$ | 570 | $ | 164 | ||||
|
|
|
|
|
|||||
Attachment 6
PUBLIC SERVICE ENTERPRISE GROUP INCORPORATED
Quarter-over-Quarter EPS Reconciliation
June 30, 2014 vs. June 30, 2013
(Unaudited)
Attachment 7
PUBLIC SERVICE ENTERPRISE GROUP INCORPORATED
Year-over-Year EPS Reconciliation
June 30, 2014 vs. June 30, 2013
(Unaudited)
Attachment 8
PSEG POWER LLC
Generation Measures*
(Unaudited)
| GWhr Breakdown | GWhr Breakdown | |||||||||||||||
| Three Months Ended | Six Months Ended | |||||||||||||||
| June 30, | June 30, | |||||||||||||||
| 2014 | 2013 | 2014 | 2013 | |||||||||||||
| Nuclear - NJ |
4,013 | 4,638 | 9,540 | 10,227 | ||||||||||||
| Nuclear - PA |
2,525 | 2,509 | 5,048 | 5,057 | ||||||||||||
|
|
|
|
|
|
|
|
|
|||||||||
| Total Nuclear |
6,538 | 7,147 | 14,588 | 15,284 | ||||||||||||
| Fossil - Coal/Natural Gas - NJ** |
345 | 187 | 878 | 666 | ||||||||||||
| Fossil - Coal - PA |
1,344 | 1,175 | 2,724 | 2,593 | ||||||||||||
| Fossil - Coal - CT |
35 | 22 | 664 | 331 | ||||||||||||
|
|
|
|
|
|
|
|
|
|||||||||
| Total Coal |
1,724 | 1,384 | 4,266 | 3,590 | ||||||||||||
| Fossil - Oil & Natural Gas - NJ |
2,483 | 3,000 | 5,652 | 5,889 | ||||||||||||
| Fossil - Oil & Natural Gas - NY |
1,308 | 1,190 | 1,874 | 2,068 | ||||||||||||
| Fossil - Oil & Natural Gas - CT |
(3 | ) | (3 | ) | 238 | 44 | ||||||||||
|
|
|
|
|
|
|
|
|
|||||||||
| Total Oil & Natural Gas |
3,788 | 4,187 | 7,764 | 8,001 | ||||||||||||
|
|
|
|
|
|
|
|
|
|||||||||
| 12,050 | 12,718 | 26,618 | 26,875 | |||||||||||||
| % Generation by Fuel Type | % Generation by Fuel Type | |||||||||||||||
| Three Months Ended | Six Months Ended | |||||||||||||||
| June 30, | June 30, | |||||||||||||||
| 2014 | 2013 | 2014 | 2013 | |||||||||||||
| Nuclear - NJ |
33 | % | 36 | % | 36 | % | 38 | % | ||||||||
| Nuclear - PA |
21 | % | 20 | % | 19 | % | 19 | % | ||||||||
|
|
|
|
|
|
|
|
|
|||||||||
| Total Nuclear |
54 | % | 56 | % | 55 | % | 57 | % | ||||||||
| Fossil - Coal/Natural Gas - NJ** |
3 | % | 1 | % | 3 | % | 2 | % | ||||||||
| Fossil - Coal - PA |
11 | % | 10 | % | 10 | % | 10 | % | ||||||||
| Fossil - Coal - CT |
1 | % | 0 | % | 3 | % | 1 | % | ||||||||
|
|
|
|
|
|
|
|
|
|||||||||
| Total Coal |
15 | % | 11 | % | 16 | % | 13 | % | ||||||||
| Fossil - Oil & Natural Gas - NJ |
20 | % | 24 | % | 21 | % | 22 | % | ||||||||
| Fossil - Oil & Natural Gas - NY |
11 | % | 9 | % | 7 | % | 8 | % | ||||||||
| Fossil - Oil & Natural Gas - CT |
0 | % | 0 | % | 1 | % | 0 | % | ||||||||
|
|
|
|
|
|
|
|
|
|||||||||
| Total Oil & Natural Gas |
31 | % | 33 | % | 29 | % | 30 | % | ||||||||
|
|
|
|
|
|
|
|
|
|||||||||
| 100 | % | 100 | % | 100 | % | 100 | % | |||||||||
| * | Excludes Solar and Kalaeloa |
| ** | Includes Pumped Storage. Pumped Storage accounted for <1% of total generation for the three months and six ended June 30, 2014 and 2013. Also includes natural gas fuel switching intervals. |
Attachment 9
PUBLIC SERVICE ELECTRIC & GAS COMPANY
Retail Sales and Revenues
(Unaudited)
June 30, 2014
Electric Sales and Revenues
| Sales (millions kWh) |
Three Months Ended |
Change vs. 2013 |
Six Months Ended |
Change vs. 2013 |
||||||||||||
| Residential |
2,887 | -6.2 | % | 6,198 | -0.1 | % | ||||||||||
| Commercial & Industrial |
6,669 | 1.4 | % | 13,545 | 2.0 | % | ||||||||||
| Street Lighting |
70 | 4.1 | % | 161 | 1.5 | % | ||||||||||
| Interdepartmental |
2 | 4.1 | % | 5 | 8.2 | % | ||||||||||
|
|
|
|
|
|||||||||||||
| Total |
9,628 | -1.0 | % | 19,909 | 1.3 | % | ||||||||||
|
|
|
|
|
|||||||||||||
| Revenue (in millions) |
||||||||||||||||
| Residential |
$ | 450 | -6.1 | % | $ | 961 | 1.2 | % | ||||||||
| Commercial & Industrial |
519 | 1.8 | % | 1,004 | 6.2 | % | ||||||||||
| Street Lighting |
17 | 1.2 | % | 34 | -0.8 | % | ||||||||||
| Other Operating Revenues* |
123 | 15.4 | % | 248 | 17.2 | % | ||||||||||
|
|
|
|
|
|||||||||||||
| Total |
$ | 1,109 | -0.3 | % | $ | 2,247 | 5.0 | % | ||||||||
|
|
|
|
|
|||||||||||||
| Weather Data |
Three Months Ended |
Change vs. 2013 |
Six Months Ended |
Change vs. 2013 |
||||||||||||
| THI Hours - Actual |
3,434 | -26.2 | % | 3,434 | -26.2 | % | ||||||||||
| THI Hours - Normal |
4,018 | 4,047 | ||||||||||||||
| * | Primarily sales of Non-Utility Generator energy to PJM and Transmission related revenues. |
Attachment 10
PUBLIC SERVICE ELECTRIC & GAS COMPANY
Retail Sales and Revenues
(Unaudited)
June 30, 2014
Gas Sold and Transported
| Three Months | Change vs. | Six Months | Change vs. | |||||||||||||
| Sales (millions terms)* |
Ended | 2013 | Ended | 2013 | ||||||||||||
| Firm Sales |
||||||||||||||||
| Residential Sales |
198 | 6.8 | % | 1,026 | 15.9 | % | ||||||||||
| Commercial & Industrial |
156 | 6.5 | % | 673 | 14.7 | % | ||||||||||
|
|
|
|
|
|||||||||||||
| Total Firm Sales |
354 | 6.7 | % | 1,699 | 15.4 | % | ||||||||||
|
|
|
|
|
|||||||||||||
| Non-Firm Sales |
||||||||||||||||
| Commercial & Industrial |
566 | 90.3 | % | 1,117 | 109.9 | % | ||||||||||
|
|
|
|
|
|||||||||||||
| Total Non-Firm Sales |
566 | 1,117 | ||||||||||||||
|
|
|
|
|
|||||||||||||
|
|
|
|
|
|||||||||||||
| Total Sales |
920 | 46.2 | % | 2,816 | 40.5 | % | ||||||||||
|
|
|
|
|
|||||||||||||
| Revenue ($ millions) |
||||||||||||||||
| Residential Sales - Firm |
$ | 95 | 12.3 | % | $ | 360 | -9.0 | % | ||||||||
| Commercial & Industrial - Firm Sales |
41 | 12.2 | % | 215 | 38.7 | % | ||||||||||
| Non-Firm Sales |
9 | 7.1 | % | 25 | 12.1 | % | ||||||||||
| Other Operating Revenues** |
43 | 3.7 | % | 87 | 4.5 | % | ||||||||||
|
|
|
|
|
|||||||||||||
| Total |
$ | 188 | 9.9 | % | $ | 687 | 4.7 | % | ||||||||
|
|
|
|
|
|||||||||||||
| Gas Transported |
$ | 138 | -0.8 | % | $ | 646 | 4.0 | % | ||||||||
| Weather Data |
Three Months Ended |
Change vs. 2013 |
Six Months Ended |
Change vs. 2013 |
||||||||||||
| Degree Days - Actual |
482 | -7.0 | % | 3,450 | 12.4 | % | ||||||||||
| Degree Days - Normal |
495 | 3,006 | ||||||||||||||
| * CSG rate included in non-firm sales |
** Primarily Appliance Service. |
Attachment 11
PUBLIC SERVICE ENTERPRISE GROUP INCORPORATED
Statistical Measures
(Unaudited)
| Three Months Ended June 30, |
Six Months Ended June 30, |
|||||||||||||||
| 2014 | 2013 | 2014 | 2013 | |||||||||||||
| Weighted Average Common Shares Outstanding (000’s) |
||||||||||||||||
| Basic |
505,875 | 505,900 | 505,976 | 505,921 | ||||||||||||
| Diluted |
508,056 | 507,381 | 507,949 | 507,301 | ||||||||||||
| Stock Price at End of Period |
$ | 40.79 | $ | 32.66 | ||||||||||||
| Dividends Paid per Share of Common Stock |
$ | 0.37 | $ | 0.36 | $ | 0.74 | $ | 0.72 | ||||||||
| Dividend Payout Ratio* |
53.8 | % | 57.8 | % | ||||||||||||
| Dividend Yield |
3.6 | % | 4.4 | % | ||||||||||||
| Price/Earnings Ratio* |
14.8 | 13.1 | ||||||||||||||
| Rate of Return on Average Common Equity* |
12.1 | % | 11.7 | % | ||||||||||||
| Book Value per Common Share |
$ | 23.41 | $ | 21.94 | ||||||||||||
| Market Price as a Percent of Book Value |
174 | % | 149 | % | ||||||||||||
| Total Shareholder Return |
8.0 | % | -3.8 | % | 29.9 | % | 9.1 | % | ||||||||
| * | Calculation based on Operating Earnings for the 12 month period ended. |
Attachment 12
PUBLIC SERVICE ENTERPRISE GROUP INCORPORATED
| Three Months Ended June 30, |
Six Months Ended June 30, |
Year Ended December 31, |
||||||||||||||||||||||
| Reconciling Items, net of tax |
2014 | 2013 | 2014 | 2013 | 2013 | 2012 | ||||||||||||||||||
| (Unaudited) | ||||||||||||||||||||||||
| Earnings Impact ($ Millions) | ||||||||||||||||||||||||
| Operating Earnings |
$ | 245 | $ | 243 | $ | 760 | $ | 676 | $ | 1,309 | $ | 1,236 | ||||||||||||
| Gain (Loss) on Nuclear Decommissioning Trust (NDT) Fund Related Activity (PSEG Power) |
14 | 8 | 23 | 17 | 40 | 52 | ||||||||||||||||||
| Gain (Loss) on Mark-to-Market (MTM)(a) (PSEG Power) |
(42 | ) | 80 | (174 | ) | (25 | ) | (74 | ) | (10 | ) | |||||||||||||
| Lease Related Activity (PSEG Enterprise/Other) |
— | — | — | — | — | 36 | ||||||||||||||||||
| Storm O&M, net of insurance recoveries (PSEG Power) |
(5 | ) | 2 | (11 | ) | (15 | ) | (32 | ) | (39 | ) | |||||||||||||
|
|
|
|
|
|
|
|
|
|
|
|
|
|||||||||||||
| Net Income |
$ | 212 | $ | 333 | $ | 598 | $ | 653 | $ | 1,243 | $ | 1,275 | ||||||||||||
|
|
|
|
|
|
|
|
|
|
|
|
|
|||||||||||||
|
|
|
|
|
|
|
|
|
|
|
|
|
|||||||||||||
| Fully Diluted Average Shares Outstanding (in Millions) |
508 | 507 | 508 | 507 | 508 | 507 | ||||||||||||||||||
|
|
|
|
|
|
|
|
|
|
|
|
|
|||||||||||||
| Per Share Impact (Diluted) | ||||||||||||||||||||||||
| Operating Earnings |
$ | 0.49 | $ | 0.48 | $ | 1.50 | $ | 1.33 | $ | 2.58 | $ | 2.44 | ||||||||||||
| Gain (Loss) on NDT Fund Related Activity (PSEG Power) |
0.02 | 0.02 | 0.04 | 0.04 | 0.08 | 0.10 | ||||||||||||||||||
| Gain (Loss) on MTM(a) (PSEG Power) |
(0.08 | ) | 0.16 | (0.34 | ) | (0.05 | ) | (0.14 | ) | (0.02 | ) | |||||||||||||
| Lease Related Activity (PSEG Enterprise/Other) |
— | — | — | — | — | 0.07 | ||||||||||||||||||
| Storm O&M, net of insurance recoveries (PSEG Power) |
(0.01 | ) | — | (0.02 | ) | (0.03 | ) | (0.07 | ) | (0.08 | ) | |||||||||||||
|
|
|
|
|
|
|
|
|
|
|
|
|
|||||||||||||
| Net Income |
$ | 0.42 | $ | 0.66 | $ | 1.18 | $ | 1.29 | $ | 2.45 | $ | 2.51 | ||||||||||||
|
|
|
|
|
|
|
|
|
|
|
|
|
|||||||||||||
| (a) | Includes the financial impact from positions with forward delivery months. |