Attached files
| file | filename |
|---|---|
| 8-K - 8-K - Empire State Realty Trust, Inc. | d766852d8k.htm |
| EX-99.1 - EX-99.1 - Empire State Realty Trust, Inc. | d766852dex991.htm |
Exhibit 99.2

EMPIRE STATE REALTY TRUST
Supplemental Operating and Financial Data
For the Quarter Ended June 30, 2014

Second Quarter 2014
| Table of Contents |
Page | |||
| Summary |
||||
| Company Profile |
3 | |||
| Financial Highlights |
4 | |||
| Selected Property Data |
||||
| Property Summary |
5 | |||
| Property Detail |
7 | |||
| Tenant Lease Expirations |
8 | |||
| Largest Tenants and Portfolio Tenant Diversification by Industry |
11 | |||
| Observatory Metrics |
12 | |||
| Financial information |
||||
| Condensed Consolidated Balance Sheets |
13 | |||
| Condensed Consolidated Statements of Income |
14 | |||
| Core FFO, FFO, FAD and EBITDA |
15 | |||
| Net Operating Income |
16 | |||
| Consolidated Debt Analysis |
||||
| Debt Summary |
17 | |||
| Debt Detail |
18 | |||
| Debt Maturities |
19 | |||
| Supplemental Definitions |
20 | |||
Forward-looking Statements
This supplemental package includes “forward looking statements”. Forward-looking statements may be identified by the use of words such as “believes,” “expects,” “may,” “will,” “should,” “seeks,” “approximately,” “intends,” “plans,” “pro forma,” “estimates,” “contemplates,” “aims,” “continues,” “would” or “anticipates” or the negative of these words and phrases or similar words or phrases. The following factors, among others, could cause actual results and future events to differ materially from those set forth or contemplated in the forward-looking statements: the factors included in (i) the Company’s Annual Report on Form 10-K for the year ended December 31, 2013, including those set forth under the headings “Risk Factors,” “Management’s Discussion and Analysis of Financial Condition and Results of Operations,” “Business,” and “Properties” and (ii) in future periodic reports filed by the Company under the Securities and Exchange Act of 1934, as amended. While forward-looking statements reflect the Company’s good faith beliefs, they are not guarantees of future performance. The Company disclaims any obligation to publicly update or revise any forward-looking statement to reflect changes in underlying assumptions or factors, of new information, data or methods, future events or other changes after the date of this press release, except as required by applicable law. For a further discussion of these and other factors that could impact the Company’s future results, performance or transactions, see the section entitled “Risk Factors” in the Annual Report on Form 10-K for the year ended December 31, 2013, and other risks described in documents subsequently filed by the Company from time to time with the Securities and Exchange Commission. Prospective investors should not place undue reliance on any forward-looking statements, which are based only on information currently available to the Company (or to third parties making the forward-looking statements).
Page 2
Second Quarter 2014
COMPANY PROFILE
Empire State Realty Trust, Inc. is a leading real estate investment trust (REIT) that owns, manages, operates, acquires and repositions office and retail properties in Manhattan and the greater New York metropolitan area, including the Empire State Building, the world’s most famous office building.
| BOARD OF DIRECTORS | ||||
| Anthony E. Malkin |
William H. Berkman | Alice M. Connell | ||
| Chairman, Chief Executive Officer and President |
Director, Chair of Compensation Committee |
Director | ||
| Thomas J. DeRosa |
Steven J. Gilbert | S. Michael Giliberto | ||
| Director, Chair of Audit Committee | Director, Lead Director | Director | ||
| Lawrence E. Golub |
||||
| Director, Chair of Nominating/Corporate | ||||
| Governance Committee | ||||
| EXECUTIVE MANAGEMENT | ||||
| Anthony E. Malkin |
Thomas P. Durels | David A. Karp | ||
| Chairman, Chief Executive Officer and President |
Executive Vice President and Chief of Property Operations and Leasing | Executive Vice President, Chief Financial Officer and Treasurer | ||
| Thomas N. Keltner, Jr. |
||||
| Executive Vice President, | ||||
| General Counsel and Secretary | ||||
| COMPANY INFORMATION | ||||
| Corporate Headquarters |
Investor Relations | New York Stock Exchange | ||
| One Grand Central Place 60 East 42nd Street New York, NY 10165 www.empirestaterealtytrust.com (212) 687-8700 |
David A. Karp IR@empirestaterealtytrust.com | Trading Symbol: ESRT | ||
Page 3
Second Quarter 2014
Financial Highlights
(unaudited and dollars in thousands, except per share amounts)
| Three Months Ended | Period from October 7, 2013 through December 31, 2013 |
|||||||||||
| June 30, 2014 | March 31, 2014 | |||||||||||
| Selected Items: |
||||||||||||
| Revenue |
$ | 155,168 | $ | 140,306 | $ | 127,583 | ||||||
| EBITDA (1) |
$ | 72,031 | $ | 53,514 | $ | 48,405 | ||||||
| Cash net operating income (1) |
$ | 66,994 | $ | 49,029 | $ | 54,000 | ||||||
| Net income |
$ | 25,281 | $ | 11,231 | $ | 193,431 | ||||||
| Core funds from operations (“Core FFO”) (1) |
$ | 54,982 | $ | 41,283 | $ | 41,395 | ||||||
| Core funds available for distribution (“Core FAD”) (1) |
$ | 39,236 | $ | 25,839 | $ | 21,819 | ||||||
| Core FFO per share—diluted |
$ | 0.22 | $ | 0.17 | $ | 0.17 | ||||||
| Core FAD per share—diluted |
$ | 0.16 | $ | 0.11 | $ | 0.09 | ||||||
| Dividends declared and paid per share |
$ | 0.085 | $ | 0.085 | $ | 0.0795 | ||||||
| Portfolio statistics: |
||||||||||||
| Number of properties |
18 | 18 | 18 | |||||||||
| Total rentable square footage |
8,371,044 | 8,362,786 | 8,350,871 | |||||||||
| Percent occupied (2) |
88.6 | % | 87.2 | % | 86.1 | % | ||||||
| Observatory metrics: |
||||||||||||
| Number of visitors |
1,222,000 | 664,000 | 980,000 | |||||||||
| Change in visitors year over year |
3.8 | % | -6.3 | % | 8.5 | % | ||||||
| Observatory revenues |
$ | 30,389 | $ | 17,301 | $ | 25,389 | ||||||
| Change in revenues year over year |
11.4 | % | 3.6 | % | 10.4 | % | ||||||
| Ratios: |
||||||||||||
| Consolidated Debt to Total Market Capitalization (3) |
23 | % | 24 | % | 24 | % | ||||||
| Consolidated Debt to EBITDA (annualized) |
4.3x | 5.6x | 5.9x | |||||||||
| Interest Coverage Ratio |
4.9x | 3.9x | 3.9x | |||||||||
| Core FFO Payout Ratio (4) |
38 | % | 51 | % | 47 | % | ||||||
| Core FAD Payout Ratio (5) |
53 | % | 78 | % | 89 | % | ||||||
| Class A Common Stock Price and Dividends: |
||||||||||||
| Class A common stock price at quarter end |
$ | 16.50 | $ | 15.11 | $ | 15.30 | ||||||
| Average closing price |
$ | 16.07 | $ | 14.88 | $ | 14.64 | ||||||
| Dividends per share—annualized |
$ | 0.34 | $ | 0.34 | $ | 0.34 | ||||||
| Dividend yield (6) |
2.1 | % | 2.3 | % | 2.2 | % | ||||||
| Common stock and operating partnership units outstanding |
245,964,043 | 245,894,321 | 245,477,006 | |||||||||
Notes:
| (1) | Represents non-GAAP financial measures. For a discussion on what these metrics represent and why the Company presents them, see page 20 and for a reconciliation of these metrics to net income, see pages 15 and 16. |
| (2) | Based on leases signed and commenced as of end of period. |
| (3) | Market capitalization represents the sum of (i) Company’s common stock per share price as of June 30, 2014 multiplied by the total outstanding number of shares of common stock and operating partnership units as of June 30, 2014 and (ii) our outstanding indebtedness as of June 30, 2014. |
| (4) | Represents the amount of Core FFO paid out in distributions. |
| (5) | Represents the amount of Core FAD paid out in distributions. |
| (6) | Based on the closing price per share of Class A common stock on June 30, 2014. |
Page 4
Second Quarter 2014
Property Summary
(unaudited and dollars in thousands, except per square foot amounts)
| June 30, 2014 | ||||||||||||||||||||
| Total Portfolio |
Manhattan Office Portfolio (1) |
Greater New York Office Portfolio |
Standalone Retail Portfolio |
Observatory | ||||||||||||||||
| Number of properties |
18 | 7 | 5 | 6 | ||||||||||||||||
| Square feet |
8,371,044 | 6,323,271 | 1,843,598 | 204,175 | ||||||||||||||||
| Occupancy (2) |
88.6 | % | 87.8 | % | 90.2 | % | 100.0 | % | ||||||||||||
| Revenue |
$ | 140,477 | $ | 86,693 | $ | 18,991 | $ | 4,404 | $ | 30,389 | ||||||||||
| Operating expenses |
(60,902 | ) | (44,527 | ) | (7,902 | ) | (1,353 | ) | (7,120 | ) | ||||||||||
|
|
|
|
|
|
|
|
|
|
|
|||||||||||
| Net operating income |
79,575 | 42,166 | 11,089 | 3,051 | 23,269 | |||||||||||||||
| Straight-line rent |
(10,979 | ) | (10,540 | ) | (192 | ) | (247 | ) | — | |||||||||||
| Above/below-market lease amortization |
(2,028 | ) | (2,028 | ) | — | — | — | |||||||||||||
| Acquired ground lease amortization |
426 | 426 | — | — | — | |||||||||||||||
|
|
|
|
|
|
|
|
|
|
|
|||||||||||
| Cash net operating income |
$ | 66,994 | $ | 30,024 | $ | 10,897 | $ | 2,804 | $ | 23,269 | ||||||||||
|
|
|
|
|
|
|
|
|
|
|
|||||||||||
| Leasing activity |
||||||||||||||||||||
| Total leases executed |
69 | 58 | 11 | — | ||||||||||||||||
| Total square footage executed |
211,259 | 172,212 | 39,047 | — | ||||||||||||||||
| Average rent psf—leases executed |
$ | 49.05 | $ | 51.54 | $ | 37.53 | $ | — | ||||||||||||
| Previously escalated rents psf |
$ | 41.15 | $ | 41.03 | $ | 41.30 | $ | — | ||||||||||||
| Percentage of new rent over previously escalated rents |
19.2 | % | 25.6 | % | -9.1 | % | — | |||||||||||||
| Leasing commission costs per square foot |
$ | 15.20 | $ | 16.52 | $ | 9.41 | $ | — | ||||||||||||
| Tenant improvement costs per square foot |
45.65 | 51.29 | 20.78 | — | ||||||||||||||||
|
|
|
|
|
|
|
|
|
|||||||||||||
| Total LC and TI per square foot (3) |
$ | 60.85 | $ | 67.81 | $ | 30.19 | $ | — | ||||||||||||
|
|
|
|
|
|
|
|
|
|||||||||||||
| March 31, 2014 | ||||||||||||||||||||
| Total Portfolio |
Manhattan Office Portfolio (1) |
Greater New York Office Portfolio |
Standalone Retail Portfolio |
Observatory | ||||||||||||||||
| Number of properties |
18 | 7 | 5 | 6 | ||||||||||||||||
| Square feet |
8,362,786 | 6,318,516 | 1,840,095 | 204,175 | ||||||||||||||||
| Occupancy (2) |
87.2 | % | 86.2 | % | 89.5 | % | 98.9 | % | ||||||||||||
| Revenue |
$ | 124,732 | $ | 84,946 | $ | 17,985 | $ | 4,500 | $ | 17,301 | ||||||||||
| Operating expenses |
(61,665 | ) | (44,438 | ) | (8,854 | ) | (1,392 | ) | (6,981 | ) | ||||||||||
|
|
|
|
|
|
|
|
|
|
|
|||||||||||
| Net operating income |
63,067 | 40,508 | 9,131 | 3,108 | 10,320 | |||||||||||||||
| Straight-line rent |
(12,580 | ) | (12,748 | ) | 250 | (82 | ) | — | ||||||||||||
| Above/below-market lease amortization |
(1,884 | ) | (1,884 | ) | — | — | — | |||||||||||||
| Acquired ground lease amortization |
426 | 426 | — | — | — | |||||||||||||||
|
|
|
|
|
|
|
|
|
|
|
|||||||||||
| Cash net operating income |
$ | 49,029 | $ | 26,302 | $ | 9,381 | $ | 3,026 | $ | 10,320 | ||||||||||
|
|
|
|
|
|
|
|
|
|
|
|||||||||||
| Leasing activity |
||||||||||||||||||||
| Total leases executed |
50 | 46 | 4 | — | ||||||||||||||||
| Total square footage executed |
191,319 | 172,716 | 18,603 | — | ||||||||||||||||
| Average rent psf—leases executed |
$ | 48.03 | $ | 49.42 | $ | 35.11 | $ | — | ||||||||||||
| Previously escalated rents psf |
$ | 41.47 | $ | 40.43 | $ | 51.14 | $ | — | ||||||||||||
| Percentage of new rent over previously escalated rents |
15.8 | % | 22.3 | % | -31.3 | % | — | |||||||||||||
| Leasing commission costs per square foot |
$ | 14.75 | $ | 15.07 | $ | 11.71 | $ | — | ||||||||||||
| Tenant improvement costs per square foot |
53.36 | 54.25 | 46.11 | — | ||||||||||||||||
|
|
|
|
|
|
|
|
|
|||||||||||||
| Total LC and TI per square foot (3) |
$ | 68.11 | $ | 69.32 | $ | 57.82 | $ | — | ||||||||||||
|
|
|
|
|
|
|
|
|
|||||||||||||
Page 5
Second Quarter 2014
Property Summary
(unaudited and dollars in thousands, except per square foot amounts)
| Period from October 7, 2013 through December 31, 2013 | ||||||||||||||||||||
| Total Portfolio |
Manhattan Office Portfolio (1) |
Greater New York Office Portfolio |
Standalone Retail Portfolio |
Observatory | ||||||||||||||||
| Number of properties |
18 | 7 | 5 | 6 | ||||||||||||||||
| Square feet |
8,350,871 | 6,306,601 | 1,840,095 | 204,175 | ||||||||||||||||
| Occupancy (2) |
86.1 | % | 84.7 | % | 89.7 | % | 97.7 | % | ||||||||||||
| Revenue |
$ | 121,768 | $ | 77,584 | $ | 16,731 | $ | 3,718 | $ | 23,735 | ||||||||||
| Operating expenses |
(57,331 | ) | (42,628 | ) | (7,838 | ) | (1,178 | ) | (5,687 | ) | ||||||||||
|
|
|
|
|
|
|
|
|
|
|
|||||||||||
| Net operating income |
64,437 | 34,956 | 8,893 | 2,540 | 18,048 | |||||||||||||||
| Straight-line rent |
(8,932 | ) | (8,807 | ) | (94 | ) | (31 | ) | — | |||||||||||
| Above/below-market lease amortization |
(1,903 | ) | (1,903 | ) | — | — | — | |||||||||||||
| Acquired ground lease amortization |
398 | 398 | — | — | — | |||||||||||||||
|
|
|
|
|
|
|
|
|
|
|
|||||||||||
| Cash net operating income |
$ | 54,000 | $ | 24,644 | $ | 8,799 | $ | 2,509 | $ | 18,048 | ||||||||||
|
|
|
|
|
|
|
|
|
|
|
|||||||||||
| Leasing activity |
||||||||||||||||||||
| Total leases executed |
55 | 47 | 6 | 2 | ||||||||||||||||
| Total square footage executed |
414,806 | 362,844 | 45,705 | 6,257 | ||||||||||||||||
| Average rent psf—leases executed |
$ | 43.82 | $ | 42.92 | $ | 35.57 | $ | 156.15 | ||||||||||||
| Previously escalated rents psf |
$ | 41.29 | $ | 39.70 | $ | 41.06 | $ | 135.18 | ||||||||||||
| Percentage of new rent over previously escalated rents |
6.1 | % | 8.1 | % | -13.4 | % | 15.5 | % | ||||||||||||
| Leasing commission costs per square foot |
$ | 19.29 | $ | 19.64 | $ | 9.26 | $ | 72.15 | ||||||||||||
| Tenant improvement costs per square foot |
38.26 | 39.12 | 36.68 | — | ||||||||||||||||
|
|
|
|
|
|
|
|
|
|||||||||||||
| Total LC and TI per square foot (3) |
$ | 57.55 | $ | 58.76 | $ | 45.94 | $ | 72.15 | ||||||||||||
|
|
|
|
|
|
|
|
|
|||||||||||||
| Capital Expenditures | June 30, 2014 | March 31, 2014 | ||||||
| Tenant improvements—first generation |
$ | 16,827 | $ | 5,095 | ||||
| Tenant improvements—second generation |
3,250 | 1,038 | ||||||
| Leasing commissions—first generation |
1,207 | 1,045 | ||||||
| Leasing commissions—second generation |
1,229 | 880 | ||||||
| Building improvements—first generation (4) |
11,721 | 11,241 | ||||||
| Building improvements—second generation |
344 | 195 | ||||||
|
|
|
|
|
|||||
| Total |
$ | 34,578 | $ | 19,494 | ||||
|
|
|
|
|
|||||
Notes:
| (1) | Includes 415,339 rentable square feet of retail space in the Company’s seven Manhattan office properties. |
| (2) | Based on leases signed and commenced as of period end. |
| (3) | Presents all tenant improvement and leasing commission costs as if they were incurred in the period in which the lease was signed, which may be different than the period in which they were actually paid. |
| (4) | The Company estimates that between $80 million and $120 million of capital is needed beyond June 30, 2014 to complete substantially the renovation and repositioning program of its Manhattan office properties. |
Page 6
Second Quarter 2014
Property Detail
(unaudited)
| Property Name |
Location or Sub-Market |
Rentable Square Feet (1) |
Percent Occupied (2) |
Annualized Rent (3) |
Annualized Rent per Occupied Square Foot (4) |
Number of Leases (5) |
||||||||||||||||
| Manhattan Office Properties—Office |
||||||||||||||||||||||
| The Empire State Building (6) |
Penn Station -Times Sq. South | 2,692,099 | 85.2 | % | $ | 103,762,372 | $ | 45.21 | 192 | |||||||||||||
| One Grand Central Place |
Grand Central | 1,182,806 | 85.1 | % | 49,356,752 | 49.01 | 281 | |||||||||||||||
| 250 West 57th Street |
Columbus Circle -West Side | 474,240 | 85.4 | % | 18,666,112 | 46.07 | 152 | |||||||||||||||
| 501 Seventh Avenue |
Penn Station -Times Sq. South | 454,909 | 95.1 | % | 17,272,977 | 39.92 | 34 | |||||||||||||||
| 1359 Broadway |
Penn Station -Times Sq. South | 443,689 | 96.1 | % | 18,611,237 | 43.64 | 33 | |||||||||||||||
| 1350 Broadway (8) |
Penn Station -Times Sq. South | 368,035 | 88.9 | % | 15,154,156 | 46.32 | 70 | |||||||||||||||
| 1333 Broadway |
Penn Station -Times Sq. South | 292,154 | 98.7 | % | 12,466,090 | 43.24 | 9 | |||||||||||||||
|
|
|
|
|
|
|
|
|
|
|
|||||||||||||
| Manhattan Office Properties—Office |
5,907,932 | 87.7 | % | 235,289,696 | 45.41 | 771 | ||||||||||||||||
| Manhattan Office Properties—Retail |
||||||||||||||||||||||
| The Empire State Building (7) |
Penn Station -Times Sq. South | 142,586 | 93.1 | % | 15,277,157 | 115.06 | 17 | |||||||||||||||
| One Grand Central Place |
Grand Central | 68,332 | 85.4 | % | 6,434,624 | 110.22 | 16 | |||||||||||||||
| 250 West 57th Street |
Columbus Circle -West Side | 49,534 | 84.7 | % | 5,106,246 | 121.74 | 7 | |||||||||||||||
| 501 Seventh Avenue |
Penn Station -Times Sq. South | 35,502 | 100.0 | % | 1,877,812 | 52.89 | 10 | |||||||||||||||
| 1359 Broadway |
Penn Station -Times Sq. South | 25,264 | 35.8 | % | 1,196,101 | 132.31 | 5 | |||||||||||||||
| 1350 Broadway (8) |
Penn Station -Times Sq. South | 31,455 | 100.0 | % | 6,066,660 | 192.87 | 6 | |||||||||||||||
| 1333 Broadway |
Penn Station -Times Sq. South | 62,666 | 95.6 | % | 7,078,993 | 118.12 | 4 | |||||||||||||||
|
|
|
|
|
|
|
|
|
|
|
|||||||||||||
| Manhattan Office Properties—Retail |
415,339 | 88.9 | % | 43,037,593 | 116.62 | 65 | ||||||||||||||||
|
|
|
|
|
|
|
|
|
|
|
|||||||||||||
| Sub-Total/Weighted Average |
||||||||||||||||||||||
| Manhattan Office Properties—Office and Retail |
6,323,271 | 87.8 | % | 278,327,289 | 50.14 | 836 | ||||||||||||||||
|
|
|
|
|
|
|
|
|
|
|
|||||||||||||
| Greater New York Metropolitan Area Office Properties |
||||||||||||||||||||||
| First Stamford Place (9) |
Stamford, CT | 784,896 | 90.7 | % | 29,937,193 | 42.05 | 52 | |||||||||||||||
| Metro Center |
Stamford, CT | 279,384 | 94.0 | % | 14,568,649 | 55.46 | 28 | |||||||||||||||
| 383 Main Street |
Norwalk, CT | 260,249 | 81.8 | % | 6,839,711 | 32.13 | 19 | |||||||||||||||
| 500 Mamaroneck Avenue |
Harrison, NY | 289,772 | 94.8 | % | 7,980,449 | 29.05 | 34 | |||||||||||||||
| 10 Bank Street |
White Plains, NY | 229,297 | 87.8 | % | 7,100,849 | 35.28 | 28 | |||||||||||||||
|
|
|
|
|
|
|
|
|
|
|
|||||||||||||
| Sub-Total/Weighted Average Greater New York |
||||||||||||||||||||||
| Metropolitan Area Office Properties |
1,843,598 | 90.2 | % | 66,426,851 | 39.93 | 161 | ||||||||||||||||
|
|
|
|
|
|
|
|
|
|
|
|||||||||||||
| Standalone Retail Properties |
||||||||||||||||||||||
| 10 Union Square |
Union Square | 58,005 | 100.0 | % | 5,901,160 | 101.74 | 14 | |||||||||||||||
| 1542 Third Avenue |
Upper East Side | 56,250 | 100.0 | % | 3,190,851 | 56.73 | 4 | |||||||||||||||
| 1010 Third Avenue |
Upper East Side | 44,662 | 100.0 | % | 3,227,743 | 72.27 | 2 | |||||||||||||||
| 77 West 55th Street |
Midtown | 24,102 | 100.0 | % | 2,789,728 | 115.75 | 3 | |||||||||||||||
| 69-97 Main Street |
Westport, CT | 16,826 | 100.0 | % | 2,076,024 | 123.38 | 5 | |||||||||||||||
| 103-107 Main Street |
Westport, CT | 4,330 | 100.0 | % | 581,040 | 134.19 | 1 | |||||||||||||||
|
|
|
|
|
|
|
|
|
|
|
|||||||||||||
| Sub-Total/Weighted Average Standalone |
||||||||||||||||||||||
| Retail Properties |
204,175 | 100.0 | % | 17,766,546 | 87.02 | 29 | ||||||||||||||||
|
|
|
|
|
|
|
|
|
|
|
|||||||||||||
| Portfolio Total |
8,371,044 | 88.6 | % | $ | 362,520,686 | $ | 48.87 | 1,026 | ||||||||||||||
|
|
|
|
|
|
|
|
|
|
|
|||||||||||||
| Total/Weighted Average Office Properties |
7,751,530 | 88.3 | % | $ | 301,716,547 | $ | 44.08 | 932 | ||||||||||||||
| Total/Weighted Average Retail Properties |
619,514 | 92.5 | % | 60,804,139 | 106.08 | 94 | ||||||||||||||||
|
|
|
|
|
|
|
|
|
|
|
|||||||||||||
| Portfolio Total |
8,371,044 | 88.6 | % | $ | 362,520,686 | $ | 48.87 | 1,026 | ||||||||||||||
|
|
|
|
|
|
|
|
|
|
|
|||||||||||||
| Option Properties—Office (10) |
||||||||||||||||||||||
| 112 West 34th Street |
Penn Station -Times Sq. South | 650,769 | 74.7 | % | $ | 21,422,322 | $ | 44.07 | 37 | |||||||||||||
| 1400 Broadway |
Penn Station -Times Sq. South | 880,131 | 93.1 | % | 32,795,023 | 40.02 | 67 | |||||||||||||||
|
|
|
|
|
|
|
|
|
|
|
|||||||||||||
| Option Properties—Office |
1,530,900 | 85.3 | % | $ | 54,217,345 | $ | 41.53 | 104 | ||||||||||||||
|
|
|
|
|
|
|
|
|
|
|
|||||||||||||
| Option Properties—Retail (10) |
||||||||||||||||||||||
| 112 West 34th Street |
Penn Station -Times Sq. South | 92,455 | 97.5 | % | $ | 3,606,261 | $ | 40.03 | 2 | |||||||||||||
| 1400 Broadway |
Penn Station -Times Sq. South | 19,815 | 70.8 | % | 1,601,152 | 114.20 | 9 | |||||||||||||||
|
|
|
|
|
|
|
|
|
|
|
|||||||||||||
| Option Properties—Retail |
112,270 | 92.8 | % | $ | 5,207,413 | $ | 49.99 | 11 | ||||||||||||||
|
|
|
|
|
|
|
|
|
|
|
|||||||||||||
Notes:
| (1) | Excludes (i) 164,630 square feet of space across the Company’s portfolio attributable to building management use and tenant amenities and (ii) 69,757 square feet of space attributable to the Company’s observatory. |
| (2) | Based on leases signed and commenced as of June 30, 2014. |
| (3) | Represents annualized base rent and current reimbursement for operating expenses and real estate taxes. |
| (4) | Represents annualized rent under leases commenced as of June 30, 2014 divided by occupied square feet. |
| (5) | Represents the number of leases at each property or on a portfolio basis. If a tenant has more than one lease, whether or not at the same property, but with different expirations, the number of leases is calculated equal to the number of leases with different expirations. |
| (6) | Includes 86,902 rentable square feet of space leased by the Company’s broadcasting tenants. |
| (7) | Includes 5,300 rentable square feet of space leased by Host Services of New York, a licensee of the Company’s observatory. |
| (8) | Denotes a ground leasehold interest in the property with a remaining term, including unilateral extension rights available to the Company, of approximately 36 years (expiring July 31, 2050). |
| (9) | First Stamford Place consists of three buildings. |
| (10) | The option properties were acquired by the Company on July 15, 2014. |
Page 7
Second Quarter 2014
Tenant Lease Expirations
(unaudited)
| Total Lease Expirations |
Number of Leases Expiring (1) |
Rentable Square Feet Expiring (2) |
Percent of Portfolio Rentable Square Feet Expiring |
Annualized Rent (3) |
Percent of Portfolio Annualized Rent (4) |
Annualized Rent Per Rentable Square Foot |
||||||||||||||||||
| Available |
— | 866,582 | 10.4 | % | $ | — | 0.0 | % | $ | — | ||||||||||||||
| Signed leases not commenced |
17 | 85,834 | 1.0 | % | — | 0.0 | % | — | ||||||||||||||||
| 2014 |
118 | 285,927 | 3.4 | % | 13,626,247 | 3.8 | % | 47.66 | ||||||||||||||||
| 2015 |
238 | 709,851 | 8.5 | % | 33,465,664 | 9.2 | % | 47.14 | ||||||||||||||||
| 2016 |
125 | 430,163 | 5.1 | % | 18,854,573 | 5.2 | % | 43.83 | ||||||||||||||||
| 2017 |
119 | 459,551 | 5.5 | % | 23,034,393 | 6.4 | % | 50.12 | ||||||||||||||||
| 2018 |
122 | 668,836 | 8.0 | % | 32,704,952 | 9.0 | % | 48.90 | ||||||||||||||||
| 2019 |
65 | 532,657 | 6.4 | % | 23,417,166 | 6.5 | % | 43.96 | ||||||||||||||||
| 2020 |
75 | 662,100 | 7.9 | % | 35,584,570 | 9.8 | % | 53.75 | ||||||||||||||||
| 2021 |
44 | 478,086 | 5.7 | % | 24,420,137 | 6.7 | % | 51.08 | ||||||||||||||||
| 2022 |
33 | 382,308 | 4.6 | % | 20,883,465 | 5.8 | % | 54.62 | ||||||||||||||||
| 2023 |
30 | 468,759 | 5.6 | % | 22,508,991 | 6.2 | % | 48.02 | ||||||||||||||||
| 2024 |
23 | 377,160 | 4.5 | % | 20,967,448 | 5.8 | % | 55.59 | ||||||||||||||||
| Thereafter |
34 | 1,963,230 | 23.5 | % | 93,053,079 | 25.7 | % | 47.40 | ||||||||||||||||
|
|
|
|
|
|
|
|
|
|
|
|
|
|||||||||||||
| Total |
1,043 | 8,371,044 | 100.0 | % | $ | 362,520,686 | 100.0 | % | $ | 48.87 | ||||||||||||||
|
|
|
|
|
|
|
|
|
|
|
|
|
|||||||||||||
Notes:
| (1) | If a lease has two different expiration dates, it is considered to be two leases (for the purpose of lease count and square footage). |
| (2) | Excludes (i) 164,630 rentable square feet of space across the Company portfolio attributable to building management use and tenant amenities and (ii) 69,757 square feet of space attributable to the Company’s observatory. |
| (3) | Represents annualized base rent and current reimbursement for operating expenses and real estate taxes. |
| (4) | Represents the percentage of annualized rent of the Company’s office and retail portfolio in the aggregate. |
Page 8
Second Quarter 2014
Tenant Lease Expirations
(unaudited)
| Manhattan Office Properties (1) | Number of Leases Expiring (2) |
Rentable Square Feet Expiring (3) |
Percent of Portfolio Rentable Square Feet Expiring |
Annualized Rent (4) |
Percent of Portfolio Annualized Rent (5) |
Annualized Rent Per Rentable Square Foot |
||||||||||||||||||
| Available |
— | 673,120 | 11.4 | % | $ | — | 0.0 | % | $ | — | ||||||||||||||
| Signed leases not commenced |
12 | 52,935 | 0.9 | % | — | 0.0 | % | — | ||||||||||||||||
| 2014 |
103 | 248,741 | 4.2 | % | 11,916,451 | 5.1 | % | 47.91 | ||||||||||||||||
| 2015 |
205 | 594,347 | 10.1 | % | 26,717,578 | 11.4 | % | 44.95 | ||||||||||||||||
| 2016 |
97 | 259,439 | 4.4 | % | 11,362,001 | 4.8 | % | 43.79 | ||||||||||||||||
| 2017 |
89 | 269,873 | 4.6 | % | 13,271,776 | 5.6 | % | 49.18 | ||||||||||||||||
| 2018 |
86 | 342,806 | 5.8 | % | 17,319,813 | 7.4 | % | 50.52 | ||||||||||||||||
| 2019 |
44 | 266,480 | 4.5 | % | 11,772,352 | 5.0 | % | 44.18 | ||||||||||||||||
| 2020 |
45 | 432,318 | 7.3 | % | 19,323,362 | 8.2 | % | 44.70 | ||||||||||||||||
| 2021 |
31 | 329,709 | 5.6 | % | 14,753,292 | 6.3 | % | 44.75 | ||||||||||||||||
| 2022 |
20 | 155,845 | 2.6 | % | 7,874,831 | 3.3 | % | 50.53 | ||||||||||||||||
| 2023 |
21 | 309,515 | 5.2 | % | 13,971,756 | 5.9 | % | 45.14 | ||||||||||||||||
| 2024 |
9 | 173,125 | 2.9 | % | 8,467,702 | 3.6 | % | 48.91 | ||||||||||||||||
| Thereafter |
21 | 1,799,679 | 30.5 | % | 78,538,782 | 33.4 | % | 43.64 | ||||||||||||||||
|
|
|
|
|
|
|
|
|
|
|
|
|
|||||||||||||
| Total Manhattan office properties |
783 | 5,907,932 | 100.0 | % | 235,289,696 | 100.0 | % | 45.41 | ||||||||||||||||
|
|
|
|
|
|
|
|
|
|
|
|
|
|||||||||||||
| Greater New York Metropolitan Area Office Properties |
||||||||||||||||||||||||
| Available |
— | 147,153 | 8.0 | % | — | 0.0 | % | — | ||||||||||||||||
| Signed leases not commenced |
5 | 32,899 | 1.8 | % | — | 0.0 | % | — | ||||||||||||||||
| 2014 |
14 | 36,175 | 2.0 | % | 1,620,028 | 2.4 | % | 44.78 | ||||||||||||||||
| 2015 |
19 | 82,525 | 4.5 | % | 3,310,609 | 5.0 | % | 40.12 | ||||||||||||||||
| 2016 |
17 | 85,258 | 4.6 | % | 3,314,943 | 5.0 | % | 38.88 | ||||||||||||||||
| 2017 |
23 | 142,858 | 7.7 | % | 5,728,941 | 8.6 | % | 40.10 | ||||||||||||||||
| 2018 |
29 | 298,627 | 16.2 | % | 12,660,395 | 19.1 | % | 42.40 | ||||||||||||||||
| 2019 |
15 | 239,230 | 13.0 | % | 8,761,111 | 13.2 | % | 36.62 | ||||||||||||||||
| 2020 |
18 | 166,005 | 9.0 | % | 6,126,810 | 9.2 | % | 36.91 | ||||||||||||||||
| 2021 |
7 | 118,495 | 6.4 | % | 5,094,343 | 7.7 | % | 42.99 | ||||||||||||||||
| 2022 |
6 | 168,044 | 9.1 | % | 6,568,248 | 9.9 | % | 39.09 | ||||||||||||||||
| 2023 |
5 | 114,106 | 6.2 | % | 4,875,104 | 7.3 | % | 42.72 | ||||||||||||||||
| 2024 |
2 | 174,448 | 9.5 | % | 7,064,413 | 10.6 | % | 40.50 | ||||||||||||||||
| Thereafter |
6 | 37,775 | 2.0 | % | 1,301,906 | 2.0 | % | 34.46 | ||||||||||||||||
|
|
|
|
|
|
|
|
|
|
|
|
|
|||||||||||||
| Total greater New York metropolitan area office properties |
166 | 1,843,598 | 100.0 | % | 66,426,851 | 100.0 | % | 39.93 | ||||||||||||||||
|
|
|
|
|
|
|
|
|
|
|
|
|
|||||||||||||
| Retail Properties |
||||||||||||||||||||||||
| Available |
— | 46,309 | 7.5 | % | — | 0.0 | % | — | ||||||||||||||||
| Signed leases not commenced |
— | — | 0.0 | % | — | 0.0 | % | — | ||||||||||||||||
| 2014 |
1 | 1,011 | 0.2 | % | 89,768 | 0.1 | % | 88.79 | ||||||||||||||||
| 2015 |
14 | 32,979 | 5.3 | % | 3,437,477 | 5.7 | % | 104.23 | ||||||||||||||||
| 2016 |
11 | 85,466 | 13.8 | % | 4,177,629 | 6.9 | % | 48.88 | ||||||||||||||||
| 2017 |
7 | 46,820 | 7.6 | % | 4,033,676 | 6.6 | % | 86.15 | ||||||||||||||||
| 2018 |
7 | 27,403 | 4.4 | % | 2,724,744 | 4.5 | % | 99.43 | ||||||||||||||||
| 2019 |
6 | 26,947 | 4.3 | % | 2,883,703 | 4.7 | % | 107.01 | ||||||||||||||||
| 2020 |
12 | 63,777 | 10.3 | % | 10,134,398 | 16.7 | % | 158.90 | ||||||||||||||||
| 2021 |
6 | 29,882 | 4.8 | % | 4,572,502 | 7.5 | % | 153.02 | ||||||||||||||||
| 2022 |
7 | 58,419 | 9.4 | % | 6,440,386 | 10.6 | % | 110.24 | ||||||||||||||||
| 2023 |
4 | 45,138 | 7.3 | % | 3,662,131 | 6.0 | % | 81.13 | ||||||||||||||||
| 2024 |
12 | 29,587 | 4.8 | % | 5,435,333 | 8.9 | % | 183.71 | ||||||||||||||||
| Thereafter |
7 | 125,776 | 20.3 | % | 13,212,392 | 21.7 | % | 105.05 | ||||||||||||||||
|
|
|
|
|
|
|
|
|
|
|
|
|
|||||||||||||
| Total retail properties |
94 | 619,514 | 100.0 | % | 60,804,139 | 100.0 | % | 106.08 | ||||||||||||||||
|
|
|
|
|
|
|
|
|
|
|
|
|
|||||||||||||
| Total portfolio lease expirations |
1,043 | 8,371,044 | 100.0 | % | $ | 362,520,686 | 100.0 | % | $ | 48.87 | ||||||||||||||
|
|
|
|
|
|
|
|
|
|
|
|
|
|||||||||||||
Notes:
| (1) | Excludes (i) retail space in the Company’s Manhattan office properties and (ii) the Empire State Building broadcasting licenses and observatory operations. |
| (2) | If a lease has two different expiration dates, it is considered to be two leases (for the purpose of lease count and square footage). |
| (3) | Excludes (i) 164,630 rentable square feet of space across the Company portfolio attributable to building management use and tenant amenities and (ii) 69,757 square feet of space attributable to the Company’s observatory. |
| (4) | Represents annualized base rent and current reimbursement for operating expenses and real estate taxes. |
| (5) | Represents the percentage of annualized rent of the Company’s office and retail portfolio in the aggregate. |
Page 9
Second Quarter 2014
Tenant Lease Expirations
(unaudited)
| Empire State Building Office (1) | Number of Leases Expiring (2) |
Rentable Square Feet Expiring |
Percent of Portfolio Rentable Square Feet Expiring |
Annualized Rent (3) |
Percent of Portfolio Annualized Rent (4) |
Annualized Rent Per Rentable Square Foot |
||||||||||||||||||
| Available |
— | 387,938 | 14.4 | % | $ | — | 0.0 | % | $ | — | ||||||||||||||
| Signed leases not commenced |
3 | 9,251 | 0.3 | % | — | 0.0 | % | — | ||||||||||||||||
| 2014 |
26 | 99,742 | 3.7 | % | 4,556,975 | 4.4 | % | 45.69 | ||||||||||||||||
| 2015 |
34 | 179,184 | 6.7 | % | 7,661,081 | 7.4 | % | 42.76 | ||||||||||||||||
| 2016 |
15 | 74,723 | 2.8 | % | 3,366,085 | 3.2 | % | 45.05 | ||||||||||||||||
| 2017 |
23 | 74,183 | 2.8 | % | 3,914,401 | 3.8 | % | 52.77 | ||||||||||||||||
| 2018 |
23 | 70,229 | 2.6 | % | 3,478,316 | 3.4 | % | 49.53 | ||||||||||||||||
| 2019 |
12 | 45,275 | 1.7 | % | 2,021,211 | 1.9 | % | 44.64 | ||||||||||||||||
| 2020 |
17 | 229,951 | 8.5 | % | 10,372,783 | 10.0 | % | 45.11 | ||||||||||||||||
| 2021 |
11 | 83,520 | 3.1 | % | 3,693,202 | 3.6 | % | 44.22 | ||||||||||||||||
| 2022 |
9 | 39,584 | 1.5 | % | 2,031,068 | 2.0 | % | 51.31 | ||||||||||||||||
| 2023 |
7 | 35,699 | 1.3 | % | 1,890,266 | 1.8 | % | 52.95 | ||||||||||||||||
| 2024 |
6 | 136,612 | 5.1 | % | 6,523,999 | 6.3 | % | 47.76 | ||||||||||||||||
| Thereafter |
9 | 1,226,208 | 45.5 | % | 54,252,985 | 52.3 | % | 44.24 | ||||||||||||||||
|
|
|
|
|
|
|
|
|
|
|
|
|
|||||||||||||
| Total Empire State Building office |
195 | 2,692,099 | 100.0 | % | $ | 103,762,372 | 100.0 | % | $ | 45.21 | ||||||||||||||
|
|
|
|
|
|
|
|
|
|
|
|
|
|||||||||||||
| Option Properties—Office |
||||||||||||||||||||||||
| Available |
— | 182,330 | 11.9 | % | $ | — | 0.0 | % | $ | — | ||||||||||||||
| Signed leases not commenced |
2 | 43,046 | 2.8 | % | — | 0.0 | % | — | ||||||||||||||||
| 2014 |
30 | 115,108 | 7.5 | % | 4,473,017 | 8.3 | % | 38.86 | ||||||||||||||||
| 2015 |
21 | 133,744 | 8.7 | % | 4,703,132 | 8.7 | % | 35.17 | ||||||||||||||||
| 2016 |
10 | 187,142 | 12.2 | % | 8,209,714 | 15.1 | % | 43.87 | ||||||||||||||||
| 2017 |
15 | 199,331 | 13.0 | % | 8,783,024 | 16.2 | % | 44.06 | ||||||||||||||||
| 2018 |
9 | 119,269 | 7.8 | % | 5,111,800 | 9.4 | % | 42.86 | ||||||||||||||||
| 2019 |
6 | 64,990 | 4.2 | % | 2,851,317 | 5.3 | % | 43.87 | ||||||||||||||||
| 2020 |
2 | 44,251 | 2.9 | % | 1,570,573 | 2.9 | % | 35.49 | ||||||||||||||||
| 2021 |
1 | 18,747 | 1.2 | % | 669,517 | 1.2 | % | 35.71 | ||||||||||||||||
| 2022 |
2 | 18,434 | 1.2 | % | 871,766 | 1.6 | % | 47.29 | ||||||||||||||||
| 2023 |
2 | 50,792 | 3.3 | % | 2,412,376 | 4.4 | % | 47.50 | ||||||||||||||||
| 2024 |
2 | 154,426 | 10.1 | % | 6,405,298 | 11.8 | % | 41.48 | ||||||||||||||||
| Thereafter |
4 | 199,290 | 13.0 | % | 8,155,811 | 15.0 | % | 40.92 | ||||||||||||||||
|
|
|
|
|
|
|
|
|
|
|
|
|
|||||||||||||
| Total Option Properties office |
106 | 1,530,900 | 100.0 | % | $ | 54,217,345 | 100.0 | % | $ | 41.53 | ||||||||||||||
|
|
|
|
|
|
|
|
|
|
|
|
|
|||||||||||||
| Option Properties—Retail |
||||||||||||||||||||||||
| Available |
— | 8,149 | 7.3 | % | $ | — | 0.0 | % | $ | — | ||||||||||||||
| Signed leases not commenced |
— | — | 0.0 | % | — | 0.0 | % | — | ||||||||||||||||
| 2014 |
1 | 1,420 | 1.3 | % | 266,706 | 5.1 | % | 187.82 | ||||||||||||||||
| 2016 |
4 | 91,986 | 81.9 | % | 2,639,197 | 50.7 | % | 28.69 | ||||||||||||||||
| 2021 |
1 | 1,060 | 0.9 | % | 82,620 | 1.6 | % | 77.94 | ||||||||||||||||
| 2022 |
1 | 2,246 | 2.0 | % | 310,998 | 6.0 | % | 138.47 | ||||||||||||||||
| 2023 |
3 | 6,278 | 5.6 | % | 1,776,041 | 34.1 | % | 282.90 | ||||||||||||||||
| 2024 |
1 | 1,131 | 1.0 | % | 131,851 | 2.5 | % | 116.58 | ||||||||||||||||
|
|
|
|
|
|
|
|
|
|
|
|
|
|||||||||||||
| Total Option Properties Retail |
11 | 112,270 | 100.0 | % | $ | 5,207,413 | 100.0 | % | $ | 49.99 | ||||||||||||||
|
|
|
|
|
|
|
|
|
|
|
|
|
|||||||||||||
Notes:
| (1) | Excludes retail space, broadcasting licenses and observatory operations. |
| (2) | If a lease has two different expiration dates, it is considered to be two leases (for the purpose of lease count and square footage). |
| (3) | Represents annualized base rent and current reimbursement for operating expenses and real estate taxes. |
| (4) | Represents the percentage of annualized rent of the Company’s office and retail portfolio in the aggregate. |
Page 10
Second Quarter 2014
20 Largest Tenants and Portfolio Tenant Diversification by Industry
(unaudited)
| 20 Largest Tenants |
Number of Leases |
Number of Properties |
Lease Expiration (1) |
Weighted Average Remaining Lease Term(2) |
Total Occupied Square Feet (3) |
Percent of Portfolio Rentable Square Feet (4) |
Annualized Rent (5) |
Percent of Portfolio Annualized Rent (6) |
||||||||||||||||||||||
| 1. Li & Fung |
6 | 3 | Oct. 2021-Oct. 2028 | 13.1 years | 886,995 | 10.6 | % | $ | 35,975,790 | 9.9 | % | |||||||||||||||||||
| 2. Coty, Inc. |
1 | 1 | Jan. 2030 | 15.6 years | 311,242 | 3.6 | % | 14,573,848 | 4.0 | % | ||||||||||||||||||||
| 3. PVH Corp. |
1 | 1 | Oct. 2028 | 14.3 years | 223,616 | 2.7 | % | 8,945,831 | 2.6 | % | ||||||||||||||||||||
| 4. Thomson Reuters |
4 | 2 | Apr. 2018-Apr. 2020 | 4.4 years | 147,208 | 1.8 | % | 7,568,448 | 2.1 | % | ||||||||||||||||||||
| 5. LinkedIn |
1 | 1 | Feb. 2026 | 11.7 years | 158,261 | 1.9 | % | 7,425,142 | 2.0 | % | ||||||||||||||||||||
| 6. Urban Outfitters |
1 | 1 | Sept. 2029 | 15.3 years | 56,730 | 0.7 | % | 6,200,000 | 1.7 | % | ||||||||||||||||||||
| 7. Legg Mason |
1 | 1 | Sept. 2024 | 10.3 years | 138,868 | 1.7 | % | 6,129,370 | 1.7 | % | ||||||||||||||||||||
| 8. Federal Deposit Insurance Corporation |
1 | 1 | Feb. 2020 | 5.6 years | 121,879 | 1.4 | % | 5,886,967 | 1.6 | % | ||||||||||||||||||||
| 9. Host Services of New York |
1 | 1 | May 2020 | 5.9 years | 5,300 | 0.1 | % | 5,064,790 | 1.4 | % | ||||||||||||||||||||
| 10. Duane Reade |
2 | 2 | Feb. 2021-May 2025 | 9.1 years | 23,134 | 0.3 | % | 3,966,378 | 1.1 | % | ||||||||||||||||||||
| 11. Odyssey Reinsurance |
1 | 1 | Sept. 2022 | 8.3 years | 101,619 | 1.2 | % | 3,826,242 | 1.1 | % | ||||||||||||||||||||
| 12. Shutterstock |
1 | 1 | Sept. 2024 | 10.3 years | 82,331 | 1.0 | % | 3,658,715 | 1.0 | % | ||||||||||||||||||||
| 13. Bank Of America |
3 | 3 | Apr. 2015-Feb. 2018 | 2.2 years | 29,671 | 0.4 | % | 3,325,052 | 0.9 | % | ||||||||||||||||||||
| 14. Reed Elsevier, Inc. |
1 | 1 | Nov. 2019 | 5.4 years | 96,727 | 1.2 | % | 3,166,338 | 0.9 | % | ||||||||||||||||||||
| 15. Human Rights Watch |
1 | 1 | Oct. 2026 | 12.3 years | 65,660 | 0.7 | % | 3,040,840 | 0.8 | % | ||||||||||||||||||||
| 16. Aetna Life Insurance Company |
1 | 1 | June 2018 | 3.9 years | 51,621 | 0.6 | % | 2,962,988 | 0.8 | % | ||||||||||||||||||||
| 17. Gerson Lehrman Group, Inc. |
1 | 1 | Oct. 2026 | 12.3 years | 64,361 | 0.8 | % | 2,960,606 | 0.8 | % | ||||||||||||||||||||
| 18. JPMorgan Chase Bank |
2 | 2 | Dec. 2021-Dec. 2027 | 13.0 years | 28,391 | 0.3 | % | 2,682,329 | 0.7 | % | ||||||||||||||||||||
| 19. Jefferies Group, Inc. |
2 | 1 | May 2021-Nov. 2022 | 7.6 years | 44,930 | 0.5 | % | 2,675,429 | 0.7 | % | ||||||||||||||||||||
| 20. Ethan Allen Retail, Inc. |
1 | 1 | July 2022 | 8.1 years | 34,670 | 0.4 | % | 2,591,773 | 0.7 | % | ||||||||||||||||||||
|
|
|
|
|
|
|
|
|
|
|
|||||||||||||||||||||
| Total |
33 | 2,673,214 | 31.9 | % | $ | 132,626,875 | 36.5 | % | ||||||||||||||||||||||
|
|
|
|
|
|
|
|
|
|
|
|||||||||||||||||||||
Notes:
| (1) | Expiration dates are per lease and do not assume exercise of renewal or extension options. Except for the Federal Deposit Insurance Corporation lease (February 1, 2015), none of these leases contain early termination options. For tenants with more than two leases, the lease expiration is shown as a range. |
| (2) | Represents the weighted average lease term, based on annualized rent. |
| (3) | Based on leases signed and commenced as of June 30, 2014. |
| (4) | Represents the percentage of rentable square feet of the Company’s office and retail portfolios in the aggregate. |
| (5) | Represents annualized base rent and current reimbursement for operating expenses and real estate taxes. |
| (6) | Represents the percentage of annualized rent of the Company’s office and retail portfolios in the aggregate. |
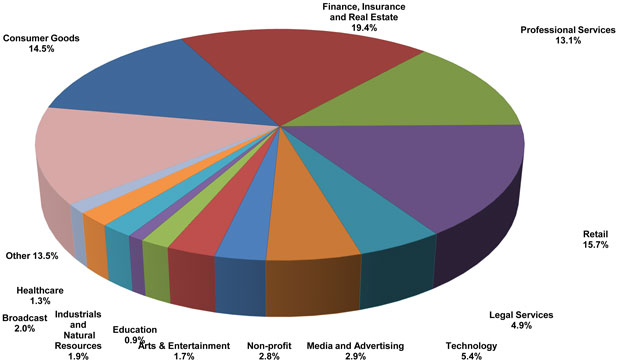
Portfolio Tenant Diversification by Industry (based on annualized rent)
Page 11
Second Quarter 2014
Observatory Metrics
(unaudited and in thousands)
| Three Months Ended | ||||||||||||||||||||
| Observatory NOI |
June 30, 2014 |
March 31, 2014 |
December 31, 2013 |
September 30, 2013 |
June 30, 2013 |
|||||||||||||||
| Observatory revenue |
$ | 30,389 | $ | 17,301 | $ | 25,389 | $ | 32,356 | $ | 27,304 | ||||||||||
| Observatory expenses |
7,120 | 6,981 | 6,193 | 6,482 | 6,109 | |||||||||||||||
|
|
|
|
|
|
|
|
|
|
|
|||||||||||
| NOI |
23,269 | 10,320 | 19,196 | 25,874 | 21,195 | |||||||||||||||
| Intercompany rent expense (1) |
16,283 | 15,200 | 20,276 | 24,260 | 13,550 | |||||||||||||||
|
|
|
|
|
|
|
|
|
|
|
|||||||||||
| NOI after intercompany rent |
$ | 6,986 | $ | (4,880 | ) | $ | (1,080 | ) | $ | 1,614 | $ | 7,645 | ||||||||
|
|
|
|
|
|
|
|
|
|
|
|||||||||||
Note:
| (1) | The observatory pays a market-based rent payment comprised of fixed and percentage rent to the Empire State Building. We recognize intercompany percentage rent expense in the interim periods as it is probable that percentage rent will be incurred based upon management’s estimates. Prior to the consolidation and formation transactions, Empire State Building Company, LLC recorded percentage rent when incurred, which resulted in rent expense being recognized primarily in the third and fourth quarters. Intercompany rent is eliminated upon consolidation. |
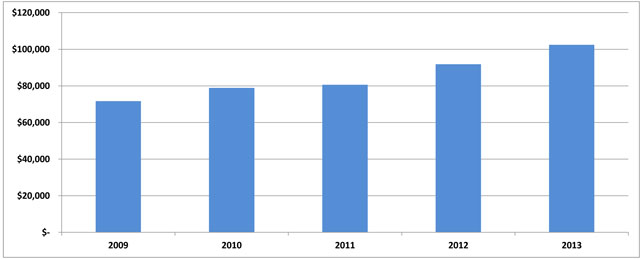
Annual Observatory Revenues 2009 to 2013
Page 12
Second Quarter 2014
Condensed Consolidated Balance Sheets
(unaudited and dollars in thousands)
| June 30, 2014 | March 31, 2014 | December 31, 2013 |
||||||||||
| Assets |
||||||||||||
| Commercial real estate properties, at cost: |
||||||||||||
| Land |
$ | 187,566 | $ | 187,566 | $ | 187,566 | ||||||
| Development costs |
6,861 | 6,459 | 6,459 | |||||||||
| Building and improvements |
1,508,309 | 1,473,665 | 1,455,398 | |||||||||
|
|
|
|
|
|
|
|||||||
| 1,702,736 | 1,667,690 | 1,649,423 | ||||||||||
| Less: accumulated depreciation |
(332,766 | ) | (315,256 | ) | (295,351 | ) | ||||||
|
|
|
|
|
|
|
|||||||
| Commercial real estate properties, net |
1,369,970 | 1,352,434 | 1,354,072 | |||||||||
| Cash and cash equivalents |
41,791 | 44,703 | 60,743 | |||||||||
| Restricted cash |
55,482 | 54,832 | 55,621 | |||||||||
| Tenant and other receivables, net |
26,185 | 29,644 | 24,817 | |||||||||
| Deferred rent receivables, net |
85,948 | 74,971 | 62,689 | |||||||||
| Prepaid expenses and other assets |
39,658 | 23,535 | 35,407 | |||||||||
| Deferred costs, net |
77,035 | 79,032 | 78,938 | |||||||||
| Acquired below-market ground lease, net |
61,460 | 61,886 | 62,312 | |||||||||
| Acquired lease intangibles, net |
227,617 | 237,900 | 249,983 | |||||||||
| Goodwill |
491,479 | 491,479 | 491,479 | |||||||||
|
|
|
|
|
|
|
|||||||
| Total assets |
$ | 2,476,625 | $ | 2,450,416 | $ | 2,476,061 | ||||||
|
|
|
|
|
|
|
|||||||
| Liabilities and Equity |
||||||||||||
| Mortgage notes payable |
$ | 873,863 | $ | 878,545 | $ | 883,112 | ||||||
| Term loan and credit facility |
355,000 | 325,000 | 325,000 | |||||||||
| Accounts payable and accrued expenses |
74,807 | 71,712 | 81,908 | |||||||||
| Acquired below-market leases, net |
120,219 | 125,106 | 129,882 | |||||||||
| Deferred revenue and other liabilities |
18,722 | 22,574 | 21,568 | |||||||||
| Tenants’ security deposits |
34,170 | 32,939 | 31,406 | |||||||||
|
|
|
|
|
|
|
|||||||
| Total liabilities |
1,476,781 | 1,455,876 | 1,472,876 | |||||||||
| Total equity |
999,844 | 994,540 | 1,003,185 | |||||||||
|
|
|
|
|
|
|
|||||||
| Total liabilities and equity |
$ | 2,476,625 | $ | 2,450,416 | $ | 2,476,061 | ||||||
|
|
|
|
|
|
|
|||||||
Page 13
Second Quarter 2014
Condensed Consolidated Statements of Income
(unaudited and in thousands, except per share amounts)
| Three Months Ended | Period from October 7, 2013 through December 31, 2013 |
|||||||||||
| June 30, 2014 | March 31, 2014 | |||||||||||
| Revenues |
||||||||||||
| Rental revenue |
$ | 92,210 | $ | 90,204 | $ | 79,987 | ||||||
| Tenant expense reimbursement |
14,304 | 15,153 | 15,836 | |||||||||
| Observatory revenue |
30,389 | 17,301 | 23,735 | |||||||||
| Construction revenue |
12,963 | 14,963 | 5,265 | |||||||||
| Third party management and other fees |
753 | 611 | 550 | |||||||||
| Other revenue and fees |
4,549 | 2,074 | 2,210 | |||||||||
|
|
|
|
|
|
|
|||||||
| Total revenues |
155,168 | 140,306 | 127,583 | |||||||||
| Operating expenses |
||||||||||||
| Property operating expenses |
35,596 | 36,311 | 34,453 | |||||||||
| Marketing, general, and administrative expenses |
12,189 | 8,675 | 15,254 | |||||||||
| Observatory expenses |
7,120 | 6,981 | 5,687 | |||||||||
| Construction expenses |
12,795 | 14,283 | 5,468 | |||||||||
| Real estate taxes |
18,186 | 18,373 | 17,191 | |||||||||
| Depreciation and amortization |
28,637 | 30,115 | 27,375 | |||||||||
|
|
|
|
|
|
|
|||||||
| Total operating expenses |
114,523 | 114,738 | 105,428 | |||||||||
|
|
|
|
|
|
|
|||||||
| Total operating income |
40,645 | 25,568 | 22,155 | |||||||||
| Other income (expense) |
||||||||||||
| Interest expense |
(14,629 | ) | (14,337 | ) | (13,147 | ) | ||||||
| Acquisition expenses |
(735 | ) | — | (138,140 | ) | |||||||
| Gain on consolidation of non-controlled entities |
— | — | 322,563 | |||||||||
|
|
|
|
|
|
|
|||||||
| Net income |
25,281 | 11,231 | 193,431 | |||||||||
| Net income attributable to non-controlling interests |
(15,447 | ) | (6,862 | ) | (118,186 | ) | ||||||
|
|
|
|
|
|
|
|||||||
| Net income attributable to Empire State Realty Trust, Inc. |
$ | 9,834 | $ | 4,369 | $ | 75,245 | ||||||
|
|
|
|
|
|
|
|||||||
| Weighted average common shares outstanding |
||||||||||||
| Basic |
95,573 | 95,575 | 95,574 | |||||||||
|
|
|
|
|
|
|
|||||||
| Diluted |
95,615 | 95,617 | 95,611 | |||||||||
|
|
|
|
|
|
|
|||||||
| Net income per share attributable to Empire State Realty Trust, Inc. |
||||||||||||
| Basic |
$ | 0.10 | $ | 0.05 | $ | 0.79 | ||||||
|
|
|
|
|
|
|
|||||||
| Diluted |
$ | 0.10 | $ | 0.05 | $ | 0.79 | ||||||
|
|
|
|
|
|
|
|||||||
| Dividends per share |
$ | 0.085 | $ | 0.085 | $ | 0.0795 | ||||||
|
|
|
|
|
|
|
|||||||
Page 14
Second Quarter 2014
Core Funds from Operations (“Core FFO”), Funds from Operations (“FFO”), Funds Available for
Distribution (“FAD”) and EBITDA
(unaudited and in thousands, except per share amounts)
| Three Months Ended | Period from October 7, 2013 through December 31, 2013 |
|||||||||||
| June 30, 2014 | March 31, 2014 | |||||||||||
| Reconciliation of Net Income to FFO and Core FFO |
||||||||||||
| Net Income |
$ | 25,281 | $ | 11,231 | $ | 193,431 | ||||||
| Real estate depreciation and amortization |
28,556 | 30,052 | 27,352 | |||||||||
|
|
|
|
|
|
|
|||||||
| FFO |
53,837 | 41,283 | 220,783 | |||||||||
| Gain on settlement of lawsuit related to the Observatory, net of income taxes |
(540 | ) | — | — | ||||||||
| Private perpetual preferred exchange offering expenses |
950 | — | — | |||||||||
| Acquisition expenses |
735 | — | 138,140 | |||||||||
| Gain on consolidation of non-controlled entities |
— | — | (322,563 | ) | ||||||||
| Severance expenses |
— | — | 2,738 | |||||||||
| Retirement equity compensation expenses |
— | — | 2,297 | |||||||||
|
|
|
|
|
|
|
|||||||
| Core FFO |
$ | 54,982 | $ | 41,283 | $ | 41,395 | ||||||
|
|
|
|
|
|
|
|||||||
| Total weighted average shares and Operating Partnership Units |
||||||||||||
| Basic |
245,899 | 245,779 | 245,445 | |||||||||
|
|
|
|
|
|
|
|||||||
| Diluted |
245,941 | 245,821 | 245,482 | |||||||||
|
|
|
|
|
|
|
|||||||
| FFO per share |
||||||||||||
| Basic |
$ | 0.22 | $ | 0.17 | $ | 0.90 | ||||||
|
|
|
|
|
|
|
|||||||
| Diluted |
$ | 0.22 | $ | 0.17 | $ | 0.90 | ||||||
|
|
|
|
|
|
|
|||||||
| Core FFO per share |
||||||||||||
| Basic |
$ | 0.22 | $ | 0.17 | $ | 0.17 | ||||||
|
|
|
|
|
|
|
|||||||
| Diluted |
$ | 0.22 | $ | 0.17 | $ | 0.17 | ||||||
|
|
|
|
|
|
|
|||||||
| Reconciliation of Core FFO to Core FAD |
||||||||||||
| Core FFO |
$ | 54,982 | $ | 41,283 | $ | 41,395 | ||||||
| Add: |
||||||||||||
| Amortization of deferred financing costs |
1,375 | 1,090 | 1,074 | |||||||||
| Amortization of below-market ground lease |
426 | 426 | 398 | |||||||||
| Non-real estate depreciation and amortization |
80 | 65 | 23 | |||||||||
| Amortization of non-cash compensation expense |
944 | 1,025 | 697 | |||||||||
| Deduct: |
||||||||||||
| Straight-line rental revenues |
(10,979 | ) | (12,580 | ) | (8,932 | ) | ||||||
| Amortization of debt premiums |
(738 | ) | (556 | ) | (922 | ) | ||||||
| Above/below-market rent revenue |
(2,028 | ) | (1,884 | ) | (1,903 | ) | ||||||
| FF&E purchases |
(3 | ) | (6 | ) | (853 | ) | ||||||
| Tenant improvements—second generation |
(3,250 | ) | (1,038 | ) | (1,219 | ) | ||||||
| Building improvements—second generation |
(344 | ) | (1,106 | ) | (1,030 | ) | ||||||
| Leasing commissions—second generation |
(1,229 | ) | (880 | ) | (6,909 | ) | ||||||
|
|
|
|
|
|
|
|||||||
| Core FAD |
$ | 39,236 | $ | 25,839 | $ | 21,819 | ||||||
|
|
|
|
|
|
|
|||||||
| Core FAD per share |
||||||||||||
| Basic |
$ | 0.16 | $ | 0.11 | $ | 0.09 | ||||||
|
|
|
|
|
|
|
|||||||
| Diluted |
$ | 0.16 | $ | 0.11 | $ | 0.09 | ||||||
|
|
|
|
|
|
|
|||||||
| Reconciliation of Net Income to EBITDA |
||||||||||||
| Net income |
$ | 25,281 | $ | 11,231 | $ | 193,431 | ||||||
| Interest expense |
14,629 | 14,337 | 13,147 | |||||||||
| Income tax expense (benefit) |
2,749 | (2,169 | ) | (1,125 | ) | |||||||
| Depreciation and amortization |
28,637 | 30,115 | 27,375 | |||||||||
| Acquisition expenses |
735 | — | 138,140 | |||||||||
| Gain on consolidation of non-controlled entities |
— | — | (322,563 | ) | ||||||||
|
|
|
|
|
|
|
|||||||
| EBITDA |
$ | 72,031 | $ | 53,514 | $ | 48,405 | ||||||
|
|
|
|
|
|
|
|||||||
Page 15
Second Quarter 2014
Net Operating Income (“NOI”)
(unaudited and dollars in thousands)
| Three Months Ended | Period from October 7, 2013 through December 31, 2013 |
|||||||||||
| June 30, 2014 | March 31, 2014 | |||||||||||
| Reconciliation of Net Income to NOI and Cash NOI |
||||||||||||
| Net income |
$ | 25,281 | $ | 11,231 | $ | 193,431 | ||||||
| Add: |
||||||||||||
| Marketing, general and administrative expenses |
12,189 | 8,675 | 15,254 | |||||||||
| Depreciation and amortization |
28,637 | 30,115 | 27,375 | |||||||||
| Interest expense |
14,629 | 14,337 | 13,147 | |||||||||
| Construction expenses |
12,795 | 14,283 | 5,468 | |||||||||
| Acquisition expenses |
735 | — | 138,140 | |||||||||
| Less: |
||||||||||||
| Construction revenue |
(12,963 | ) | (14,963 | ) | (5,265 | ) | ||||||
| Third-party management and other fees |
(753 | ) | (611 | ) | (550 | ) | ||||||
| Gain on settlement of lawsuit related to the Observatory |
(975 | ) | — | — | ||||||||
| Gain on consolidation of non-controlled entities |
— | — | (322,563 | ) | ||||||||
|
|
|
|
|
|
|
|||||||
| Net operating income |
79,575 | 63,067 | 64,437 | |||||||||
| Straight-line rent |
(10,979 | ) | (12,580 | ) | (8,932 | ) | ||||||
| Above/below-market lease amortization |
(2,028 | ) | (1,884 | ) | (1,903 | ) | ||||||
| Acquired ground lease amortization |
426 | 426 | 398 | |||||||||
|
|
|
|
|
|
|
|||||||
| Cash net operating income |
$ | 66,994 | $ | 49,029 | $ | 54,000 | ||||||
|
|
|
|
|
|
|
|||||||
Page 16
Second Quarter 2014
Debt Summary
(unaudited and dollars in thousands)
| Weighted Average | ||||||||||||
| Debt Summary |
Principal Balance |
Interest Rate |
Maturity (Years) |
|||||||||
| Fixed rate mortgage debt |
$ | 826,230 | 5.78 | % | 2.1 | |||||||
| Variable rate mortgage debt |
47,633 | 3.90 | % | 0.4 | ||||||||
| Term loan and credit facility |
355,000 | 1.49 | % | 4.1 | ||||||||
|
|
|
|
|
|
|
|||||||
| Total |
$ | 1,228,863 | 4.47 | % | 2.6 | |||||||
|
|
|
|
|
|
|
|||||||
| Available Borrowing |
Facility | Outstanding at June 30, 2014 |
Letters of Credit |
Empire Reserve (2) |
Remaining Capacity at June 30, 2014 |
|||||||||||||||
| Mortgages |
$ | — | $ | 873,863 | $ | — | $ | — | $ | 10,615 | ||||||||||
| Term loan and credit facility (1) |
800,000 | 355,000 | — | 27,338 | 417,662 | |||||||||||||||
|
|
|
|
|
|
|
|
|
|
|
|||||||||||
| Total |
$ | 800,000 | $ | 1,228,863 | $ | — | $ | 27,338 | $ | 428,277 | ||||||||||
|
|
|
|
|
|
|
|
|
|
|
|||||||||||
| Covenant Summary |
Required | Current Quarter |
In Compliance |
|||||||||
| Secured Credit Facility |
||||||||||||
| Maximum Total Leverage |
< 60 | % | 29.7 | % | Yes | |||||||
| Maximum Secured Debt |
< 40 | % | 21.1 | % | Yes | |||||||
| Minimum Fixed Charge Coverage |
> 1.5 | x | 3.0 | x | Yes | |||||||
| Maximum Variable Rate Indebtedness |
< 25 | % | 9.7 | % | Yes | |||||||
| Maximum Secured Recourse Indebtedness |
< 10 | % | 0 | % | Yes | |||||||
| Minimum Tangible Net Worth |
$ | 689,800 | $ | 822,855 | Yes | |||||||
Notes:
| (1) | The term loan and credit facility has an accordion feature allowing for an increase in maximum aggregate principal balance to $1,250,000 under certain circumstances. |
| (2) | Reflects a reserve for Empire State Building capital expenditures. |
Page 17
Second Quarter 2014
Debt Detail
(unaudited and dollars in thousands)
| Stated Interest Rate (%) |
Current Interest Rate (%) |
Principal Balance |
Maturity Date |
Amortization | ||||||||||||||||
| Fixed rate debt: |
||||||||||||||||||||
| 501 Seventh Avenue (first lien mortgage loan) |
5.80 | % | 5.80 | % | $ | 39,026 | 8/1/2014 | 25 years | ||||||||||||
| 1359 Broadway |
6.04 | % | 6.04 | % | 44,275 | 8/1/2014 | 25 years | |||||||||||||
| One Grand Central Place (first lien mortgage loan) |
5.34 | % | 5.34 | % | 70,578 | 11/5/2014 | 25 years | |||||||||||||
| One Grand Central Place (second lien mortgage loan) |
7.00 | % | 7.00 | % | 14,724 | 11/5/2014 | 25 years | |||||||||||||
| 500 Mamaroneck Avenue, Harrison, NY |
5.41 | % | 5.41 | % | 32,260 | 1/1/2015 | 30 years | |||||||||||||
| 250 West 57th Street (first lien mortgage loan) |
5.33 | % | 5.33 | % | 25,194 | 1/5/2015 | 25 years | |||||||||||||
| 250 West 57th Street (second lien mortgage loan) |
6.13 | % | 6.13 | % | 11,109 | 1/5/2015 | 25 years | |||||||||||||
| Metro Center |
5.89 | % | 5.89 | % | 95,062 | 1/1/2016 | 30 years | |||||||||||||
| 10 Union Square |
6.00 | % | 6.00 | % | 20,807 | 5/1/2017 | 30 years | |||||||||||||
| 10 Bank Street |
5.72 | % | 5.72 | % | 33,150 | 6/1/2017 | 30 years | |||||||||||||
| 1542 Third Avenue |
5.90 | % | 5.90 | % | 18,820 | 6/1/2017 | 30 years | |||||||||||||
| First Stamford Place |
5.65 | % | 5.65 | % | 243,966 | 7/5/2017 | 30 years | |||||||||||||
| 383 Main Avenue, Norwalk, CT |
5.59 | % | 5.59 | % | 30,131 | 7/5/2017 | 30 years | |||||||||||||
| 1010 Third Avenue and 77 West 55th Street |
5.69 | % | 5.69 | % | 27,849 | 7/5/2017 | 30 years | |||||||||||||
| 1333 Broadway |
6.32 | % | 6.32 | % | 76,734 | (1) | 1/5/2018 | 30 years | ||||||||||||
| 1350 Broadway (first lien mortgage loan) |
5.87 | % | 5.87 | % | 42,545 | (2) | 4/5/2018 | Interest only | ||||||||||||
|
|
|
|||||||||||||||||||
| Total fixed rate debt |
826,230 | |||||||||||||||||||
| Variable rate debt: |
||||||||||||||||||||
| 501 Seventh Avenue (second lien mortgage loan) |
LIBOR plus 2.0 | % | 2.16 | % | 6,540 | 8/1/2014 | Interest only | |||||||||||||
| 1350 Broadway (second lien mortgage loan) |
(4 | ) | 4.25 | % | 13,711 | (3) | 10/10/2014 | Interest only | ||||||||||||
| One Grand Central Place (third lien mortgage loan) |
(5 | ) | 3.75 | % | 6,382 | 11/5/2014 | Interest only | |||||||||||||
| 250 West 57th Street (third lien mortgage loan) |
(4 | ) | 4.25 | % | 21,000 | 1/5/2015 | Interest only | |||||||||||||
| Secured Revolving Credit Facility |
LIBOR plus 1.20 | % | 1.36 | % | 55,000 | 10/5/2017 | Interest only | |||||||||||||
| Secured Term Credit Facility |
LIBOR plus 1.35 | % | 1.51 | % | 300,000 | 10/5/2018 | Interest only | |||||||||||||
|
|
|
|||||||||||||||||||
| Total variable rate debt |
402,633 | |||||||||||||||||||
|
|
|
|
|
|||||||||||||||||
| Total / weighted average debt |
4.47 | % | $ | 1,228,863 | ||||||||||||||||
|
|
|
|
|
|||||||||||||||||
Notes:
| (1) | Includes unamortized premium of $6,715. |
| (2) | Includes unamortized premium of $3,381. |
| (3) | Includes unamortized premium of $34. |
| (4) | Greater of 4.25% and Prime plus 1.00%. |
| (5) | Greater of 3.75% and Prime plus 0.50%. |
Page 18
Second Quarter 2014
Debt Maturities
(unaudited and dollars in thousands)
| Year |
Amortization | Maturities (1) | Total | Percentage of Total Debt |
Weighted Average Interest Rate of Maturing Debt |
|||||||||||||||
| 2014 |
$ | 7,269 | $ | 193,626 | $ | 200,895 | 16.3 | % | 5.48 | % | ||||||||||
| 2015 |
10,036 | 88,445 | 98,481 | 8.0 | % | 5.20 | % | |||||||||||||
| 2016 |
7,918 | 91,572 | 99,490 | 8.1 | % | 5.89 | % | |||||||||||||
| 2017 |
5,393 | 410,761 | 416,154 | 33.9 | % | 5.13 | % | |||||||||||||
| 2018 |
306 | 413,537 | 413,843 | 33.7 | % | 2.83 | % | |||||||||||||
|
|
|
|
|
|
|
|
|
|
|
|||||||||||
| Total debt |
$ | 30,922 | $ | 1,197,941 | $ | 1,228,863 | 100.0 | % | 4.47 | % | ||||||||||
|
|
|
|
|
|
|
|
|
|
|
|||||||||||
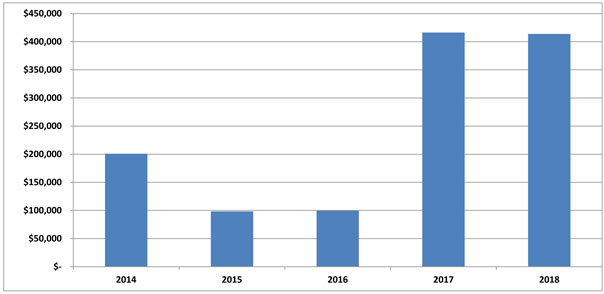
Debt Maturity Profile
Note:
| (1) | Assumes no extension options are exercised. |
Page 19
Second Quarter 2014
Supplemental Definitions
Funds From Operations (“FFO”)
The Company computes FFO in accordance with the “White Paper” on FFO published by the National Association of Real Estate Investment Trusts, or NAREIT, which defines FFO as net income (loss) (determined in accordance with GAAP), excluding impairment writedowns of investments in depreciable real estate and investments in in-substance real estate investments, gains or losses from debt restructurings and sales of depreciable operating properties, plus real estate-related depreciation and amortization (excluding amortization of deferred financing costs), less distributions to non-controlling interests and gains/losses from discontinued operations and after adjustments for unconsolidated partnerships and joint ventures. FFO is a widely recognized non-GAAP financial measure for REITs that the Company believes, when considered with financial statements determined in accordance with GAAP, is useful to investors in understanding financial performance and providing a relevant basis for comparison among REITS. In addition, FFO is useful to investors as it captures features particular to real estate performance by recognizing that real estate has generally appreciated over time or maintains residual value to a much greater extent than do other depreciable assets. Investors should review FFO, along with GAAP net income, when trying to understand an equity REIT’s operating performance. The Company presents FFO because it considers it an important supplemental measure of its operating performance and believes that it is frequently used by securities analysts, investors and other interested parties in the evaluation of REITs. However, because FFO excludes depreciation and amortization and captures neither the changes in the value of the Company’s properties that result from use or market conditions nor the level of capital expenditures and leasing commissions necessary to maintain the operating performance of its properties, all of which have real economic effect and could materially impact the Company’s results of operations, the utility of FFO as a measure of its performance is limited. There can be no assurance that FFO presented by the Company is comparable to similarly titled measures of other REITs. FFO does not represent cash generated from operating activities and should not be considered as an alternative to net income (loss) determined in accordance with GAAP or to cash flow from operating activities determined in accordance with GAAP. FFO is not indicative of cash available to fund ongoing cash needs, including the ability to make cash distributions. Although FFO is a measure used for comparability in assessing the performance of REITs, as the NAREIT White Paper only provides guidelines for computing FFO, the computation of FFO may vary from one company to another.
Core Funds From Operations (“Core FFO”)
Core FFO adds back to traditionally defined FFO the following items associated with the Company’s initial public offering, or IPO, and formation transactions: gain on consolidation of non-controlling entities, acquisition expenses, severance expenses and retirement equity compensation expenses. It also adds back private perpetual preferred exchange offering expenses, acquisition expenses, and gain on settlement of lawsuit related to the Observatory, net of income taxes. The Company presents Core FFO because it considers it an important supplemental measure of its operating performance in that it excludes items associated with its IPO and formation transactions. There can be no assurance that Core FFO presented by the Company is comparable to similarly titled measures of other REITs. Core FFO does not represent cash generated from operating activities and should not be considered as an alternative to net income (loss) determined in accordance with GAAP or to cash flow from operating activities determined in accordance with GAAP. Core FFO is not indicative of cash available to fund ongoing cash needs, including the ability to make cash distributions.
Core Funds Available for Distribution (“FAD”)
In addition to Core FFO, the Company presents Core FAD by (i) adding to Core FFO non-real estate depreciation and amortization, the amortization of deferred financing costs, amortization of debt discounts and amortization of below market ground lease and (ii) deducting straight line rent, recurring second generation leasing commissions, tenant improvements, prebuilts, capital expenditures, furniture, fixtures & equipment purchases and above/below market rent revenue. Core FAD is presented solely as a supplemental disclosure that management believes provides useful information regarding the Company’s ability to fund its dividends. Core FAD does not represent cash generated from operating activities and should not be considered as an alternative to net income (loss) determined in accordance with GAAP or to cash flow from operating activities determined in accordance with GAAP. Core FAD is not indicative of cash available to fund ongoing cash needs, including the ability to make cash distributions. There can be no assurance that Core FAD presented by the Company is comparable to similarly titled measures of other REITs.
Net Operating Income
Net Operating Income, or NOI is a non-GAAP financial measure of performance. NOI is used by investors and the Company’s management to evaluate and compare the performance of the Company’s properties and to determine trends in earnings and to compute the fair value of its properties as it is not affected by; (i) the cost of funds of the property owner, (ii) the impact of depreciation and amortization expenses as well as gains or losses from the sale of operating real estate assets that are included in net income computed in accordance with GAAP, (iii) acquisition expenses and formation transaction expenses; or (iv) general and administrative expenses and other gains and losses that are specific to the property owner. The cost of funds is eliminated from net operating income because it is specific to the particular financing capabilities and constraints of the owner. The cost of funds is also eliminated because it is dependent on historical interest rates and other costs of capital as well as past decisions made by the Company regarding the appropriate mix of capital which may have changed or may change in the future. Depreciation and amortization expenses as well as gains or losses from the sale of operating real estate assets are eliminated because they may not accurately represent the actual change in value in the Company’s office or retail properties that result from use of the properties or changes in market conditions. While certain aspects of real property do decline in value over time in a manner that is reasonably captured by depreciation and amortization, the value of the properties as a whole have historically increased or decreased as a result of changes in overall economic conditions instead of from actual use of the property or the passage of time. Gains and losses from the sale of real property vary from property to property and are affected by market conditions at the time of sale which will usually change from period to period. These gains and losses can create distortions when comparing one period to another or when comparing the Company’s operating results to the operating results of other real estate companies that have not made similarly timed, purchases or sales. The Company also excludes private perpetual exchange offering expenses and gain on settlement of lawsuit related to the Observatory, net of income taxes. The Company believes that eliminating these costs from net income is useful because the resulting measure captures the actual revenue, generated and actual expenses incurred in operating its properties as well as trends in occupancy rates, rental rates and operating costs. However, the usefulness of NOI is limited because it excludes general and administrative costs, interest expense, interest income and other expense, depreciation and amortization expense and gains or losses from the sale of properties, and other gains and losses as stipulated by GAAP, the level of capital expenditures and leasing costs necessary to maintain the operating performance of the Company’s properties, all of which are significant economic costs. NOI may fail to capture significant trends in these components of net income which further limits its usefulness. NOI is a measure of the operating performance of the Company’s properties but does not measure its performance as a whole. NOI is therefore not a substitute for net income as computed in accordance with GAAP. This measure should be analyzed in conjunction with net income computed in accordance with GAAP and discussions elsewhere in this Supplemental Package regarding the components of net income that are eliminated in the calculation of NOI. Other companies may use different methods for calculating NOI than the Company does.
EBITDA
The Company computes EBITDA as net income plus interest expense, income taxes, depreciation and amortization, acquisition expenses, and gain on consolidation of non-controlled entities. The Company presents EBITDA because it believes that EBITDA, along with cash flow from operating activities, investing activities and financing activities, provides investors with an additional indicator of its ability to incur and service debt. EBITDA should not be considered as an alternative to net income (determined in accordance with GAAP), as an indication of the Company’s financial performance, as an alternative to net cash flows from operating activities (determined in accordance with GAAP), or as a measure of its liquidity.
Page 20