Attached files
| file | filename |
|---|---|
| 8-K - 8-K - GALECTIN THERAPEUTICS INC | d761983d8k.htm |
 GT-020 Phase 1 Clinical Trial:
Results of Second Cohort
July 29, 2014
NASDAQ: GALT
www.galectintherapeutics.com
©
2014 Galectin Therapeutics inc.
Exhibit 99.1 |
 Forward-Looking Statement
This presentation contains, in addition to historical information,
forward-looking statements within the meaning
of
the
Private
Securities
Litigation
Reform
Act
of
1995.
These
statements
relate
to
future
events
or
future
financial
performance,
and
use
words
such
as
“may,”
“estimate,”
“could,”
“expect”
and
others.
They are based on our current expectations and are subject to factors and
uncertainties which could cause actual results to differ materially from
those described in the statements. These statements include those regarding
potential therapeutic benefits of GR-MD-02 and expectations regarding the clinical trial,
including the future enrollment of patients and the timing of results from the
third cohort. Factors that could cause our actual performance to differ
materially from those discussed in the forward-looking statements
include, among others, that results from the first and second cohorts of Phase 1 may differ
materially from future results, and there is no guarantee that the current clinical
trial will lead to positive outcomes or that GR-MD-02 will ever be
approved by the FDA. We may experience delays in the current
trial,
and
we
may
have
difficulty
enrolling
patients
and
processing
the
resulting
data.
Future
phases or future clinical studies may not begin or produce positive results in a
timely fashion, if at all, and could prove time consuming and costly. Plans
regarding development, approval and marketing of any of our drugs are
subject to change at any time based on the changing needs of our company as determined
by
management
and
regulatory
agencies.
Regardless
of
the
results
of
current
or
future
studies,
we
may
be unsuccessful in developing partnerships with other companies or obtaining
capital that would allow us to further develop and/or fund any studies or
trials. To date, we have incurred operating losses since our inception, and
our ability to successfully develop and market drugs may be impacted by our ability to
manage costs and finance our continuing operations. For a discussion of additional
factors impacting our business,
see
our
Annual
Report
on
Form
10-K
for
the
year
ended
December
31,
2013,
and
our
subsequent filings with the SEC. You should not place undue reliance on
forward-looking statements. Although subsequent events may cause our
views to change, we disclaim any obligation to update forward-looking
statements. 2
©
2014 Galectin Therapeutics | NASDAQ:GALT |
 Our
Pipeline Of Galectin-3 Inhibitors ©
2014 Galectin Therapeutics | NASDAQ:GALT
3
Clinical Focus
Stage of Development
Drug
Indication
Discovery
Pre-clinical
Phase 1
Phase 2
Phase 3
Fibrosis
GR-MD-02
Fatty liver disease with
advanced fibrosis
Lung fibrosis
Kidney fibrosis
Cardiac fibrosis
Cancer Immunotherapy
GR-MD-02
Melanoma
Galectin-3 Inhibitors
GR-MD-03
Subcutaneous
GR-MD-04
Oral
GS compound*
Oral
*Galectin Sciences, LLC |
 GR-MD-02 Is Being Developed For The Indication Of
NASH With Advanced Fibrosis (Stage 3 and 4)
4
©
2014 Galectin Therapeutics | NASDAQ:GALT
Obesity/Insulin Resistance/Diabetes
Steatosis (fatty liver)
NASH (inflammation, cell death)
Stage 1 2 3
Fibrosis
Stage 4
Cirrhosis
•
No certainty of progression from early to late disease in an individual
•
Late disease much closer to clinical outcomes
•
Surrogates of clinical outcomes are better developed for late disease
•
GR-MD-02 reduces inflammation, ballooning and fat in NASH and reduces
existing fibrosis and reverses cirrhosis in animal models
Early Disease
Late Disease
Clinical Outcomes:
Complications
Transplant
Death
Targeting Late Disease |
 Summary
of
Findings:
Primary Endpoints Were Met In Cohort 2
•
GR-MD-02 was safe and well tolerated at dose of 4 mg/kg (80/160 mg/m
2
),
similar to the findings of the 2 mg/kg dose in the first cohort.
•
The independent Data Safety Monitoring Board (DSMB) approved moving
forward with Cohort 3.
•
Pharmacokinetics revealed a proportional increase in total drug exposure with
doubling of the dose of GR-MD-02 with no accumulation after four
doses. •
A dose of 4 mg/kg provided drug exposure in humans that was roughly
equivalent to the lowest therapeutic dose used in NASH animal model.
•
The drug half-life in humans is approximately 4 times longer than in mouse at
similar doses providing a more extended exposure in humans.
GR-MD-02 was safe, well tolerated, and has predictable pharmacokinetics when
administered at 4 mg/kg, a dose that correlates with a therapeutic dose in
animal model of NASH.
5
©
2014 Galectin Therapeutics | NASDAQ:GALT |
 Summary of Findings:
Exploratory Secondary Endpoints
•
While the current gold standard for the evaluation of NASH with advanced
fibrosis is liver biopsy, it is not appropriate to subject individuals to serial
liver biopsies over a short Phase 1 clinical trial. Biopsy assessment of
liver fibrosis will be the primary endpoint in the Phase 2 clinical trial to
follow this trial. •
To potentially gain some understanding of drug effect and to aid
in planning of
a Phase 2 clinical trial, exploratory biomarkers were evaluated before and
after therapy.
•
While the overall impression of biomarker analysis suggests an effect of the
drug, there are differences in biomarker changes depending on the timing of
blood sampling with respect to drug dose.
•
Since biomarker results are not directly comparable between cohort 1 and
cohort 2, a comparison of the effect of timing on biomarkers will be evaluated
in cohort 3.
6
©
2014 Galectin Therapeutics | NASDAQ:GALT |
 Phase
1 Clinical Trial Of GR-MD-02 In NASH With Advanced Fibrosis
©
2014 Galectin Therapeutics | NASDAQ:GALT
7
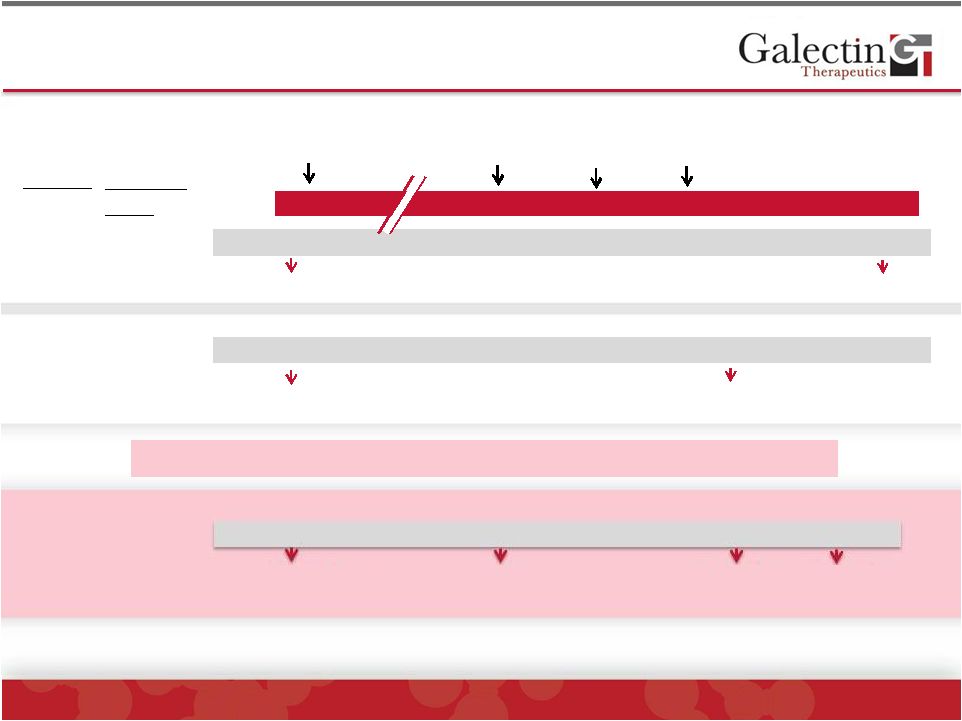
Changes in Cohort 2 Protocol:
•
Based on the pharmacokinetics of the drug determined from the first cohort, the
protocol was shortened by 18 days:
•
The second dose was given on day 21 instead of day 28
•
The
timing
of
serum
biomarker
evaluations
were
shortened
from
14
to
3
days
after
the
fourth and final infusion
•
FibroScan evaluation was added to obtain experience with the method
1
st
Infusion
Cohort
Patients
(A/P)
6/2
1
(2 mg/kg)
*BM=Serum Biomarkers
**FS=FibroScan
®
2
nd
Infusion
3
rd
Infusion
4
th
Infusion |
 Cohort
3 Plan For Phase 1 Clinical Trial Of GR-MD-02 In NASH With Advanced
Fibrosis ©
2014 Galectin Therapeutics | NASDAQ:GALT
8
12/8
BM*/FS**
BM*/FS**
BM*/FS**
BM*
*BM=Serum Biomarkers
**FS=FibroScan
®
3
(8 mg/kg)
0
28
35
42
56
Day
1
st
Infusion
-1
BM*/FS**
BM*/FS**
Cohort
Patients
(A/P)
6/2
7/2
21
28
35
0
-1
1
(2 mg/kg)
38
BM*
BM*
2
(4 mg/kg)
2
nd
Infusion
3
rd
Infusion
4
th
Infusion
Day
Cohort 3 incorporates four time points for comparative evaluation
21
28
35
49
0
-1
38
Day |
 9
©
2014 Galectin Therapeutics | NASDAQ:GALT
Cohort 1 (2 mg/kg)
Cohort 2 (4 mg/kg)
Patients Enrolled
8
10
Male/Female
2/6
6/4
Age Range (Mean)
40-64 (54)
34-69 (51.5)
BMI (Mean)
39
39.6
Diabetic Patients
6
4
Fibrosis Stage
Stage 3: 7 patients
Stage 4:1 patient
Stage 3: 6 patients
Stage 3/4: 4 patients
Patient Characteristics |
 10
©
2014 Galectin Therapeutics | NASDAQ:GALT
Cohort 1 (2 mg/kg)
Cohort 2 (4 mg/kg)
Completed Protocol
8
9
(One patient withdrawn because of
baseline (pre-drug) borderline QTc
interval prolongation)
Serious Adverse Events
0
0
Treatment Emergent AE’s
scored as probably related to
drug
0
0
Treatment Emergent AE’s
scored as possibly related to
drug
0
Patient 1:
transient yellow
toenails and left ankle edema
which were mild (grade 1) and of
<1 day duration. Intermittent PRI
prolongation unrelated to infusion
(grade 1).
Patient 2:
right swollen wrist and
painful right ankle which were
mild (grade 1) and of <1 day
duration.
Patient Safety: GR-MD-02 At Doses Of 2 And 4 mg/kg
Were Safe And Well Tolerated
Independent
Data
Safety
Monitoring
Board
Approved
Proceeding
to
Cohort
3 |
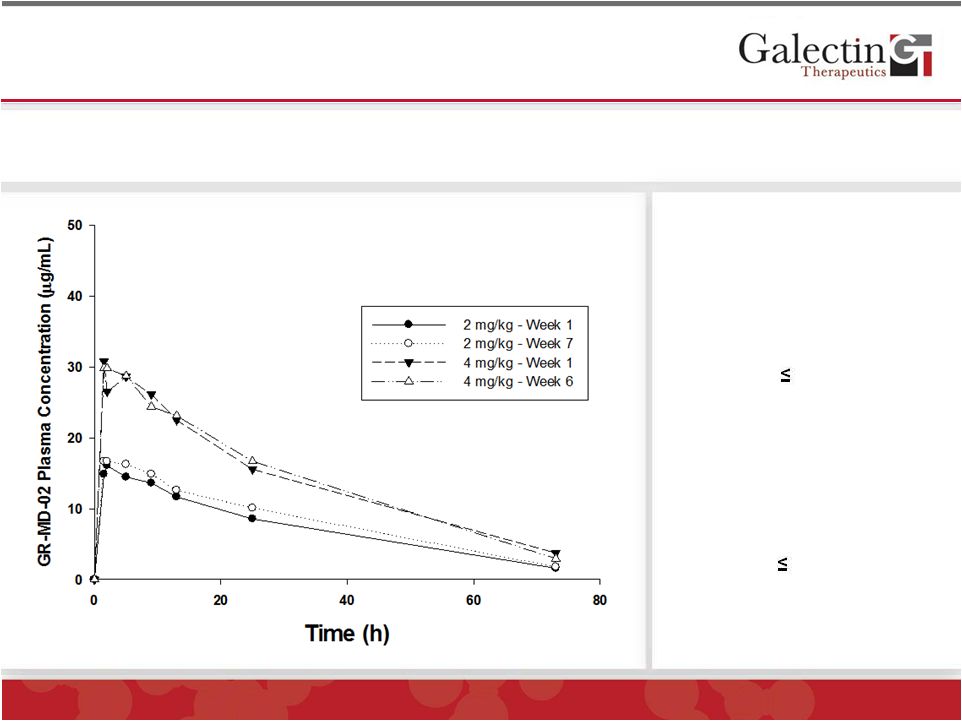 Mean
GR-MD-02 Plasma Concentration-Time Profiles After First And Fourth
Doses In Cohorts 1 And 2 ©
2014 Galectin Therapeutics | NASDAQ:GALT
11
There was a proportional increase in total drug exposure with doubling
of the dose of GR-MD-02 with no accumulation after four doses
2 mg/kg (1
st
/4
th
dose)
C
max
= 16.3/17.7 µg/mL
T
1/2
= 19.9/20.5 h
AUC = 573/645 h*µg/mL
V
ss
= 5.2/4.7 L
Variability
15/24%
4 mg/kg (1
st
/4
th
dose)
C
max
= 30/31 µg/mL
T
1/2
= 19.8/19.5 h
AUC = 1039/1075 h*µg/mL
V
ss
= 6.4/6.0 L
Variability
25/35% |
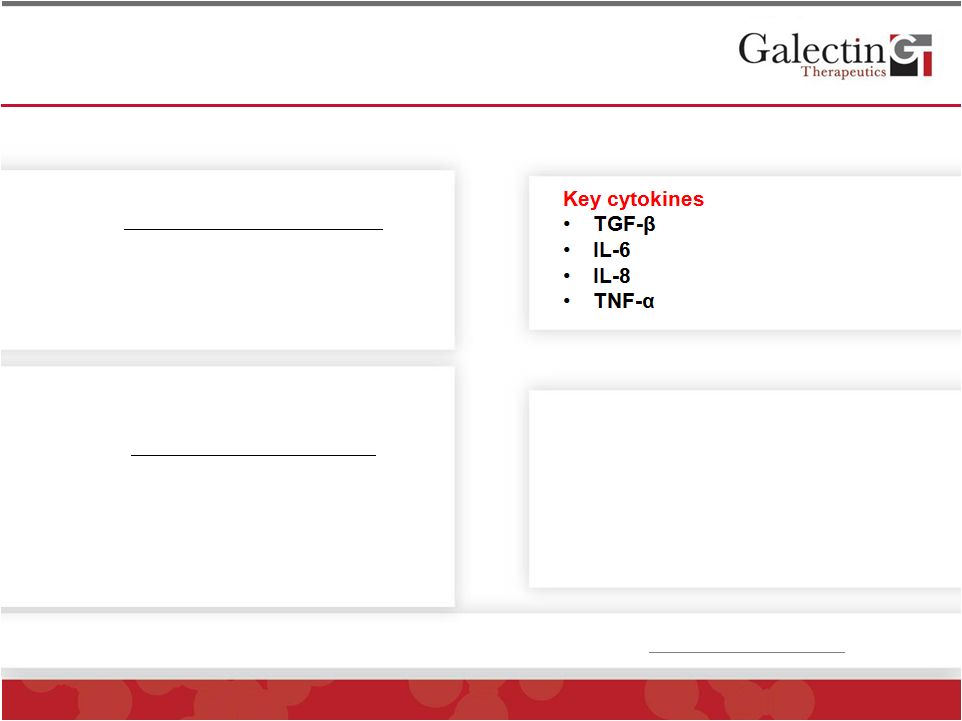 Exploratory Serum Biomarkers Of Fibrosis And
Inflammation In NASH
©
2014 Galectin Therapeutics | NASDAQ:GALT
12
Fibrosis Composite Scores
FibroTest™
(FibroSURE™)
•
Indirect biomarker of fibrosis
•
Age and gender, Alpha-2-
macroglobulin, Haptoglobin,
Apolipoprotein A1, GGTP, Total
bilirubin
ELF (Enhanced Liver Fibrosis)
Score
•
Direct biomarker of fibrosis
•
Hyaluronic acid
•
TIMP1 (tissue inhibitor of
metalloproteinase-1)
•
P3NP (amino terminal
propeptide of type III pro-collagen)
For
more
information
and
references
on
biomarkers:
http://bit.ly/1jzFK50
Inflammatory Cytokines
Cellular Injury
Serum Transaminases
•
ALT and AST
•
Enzymes released from liver cells
•
2/3 of NASH patients have normal
levels at any given time
•
Entire spectrum of disease can be
seen with normal levels |
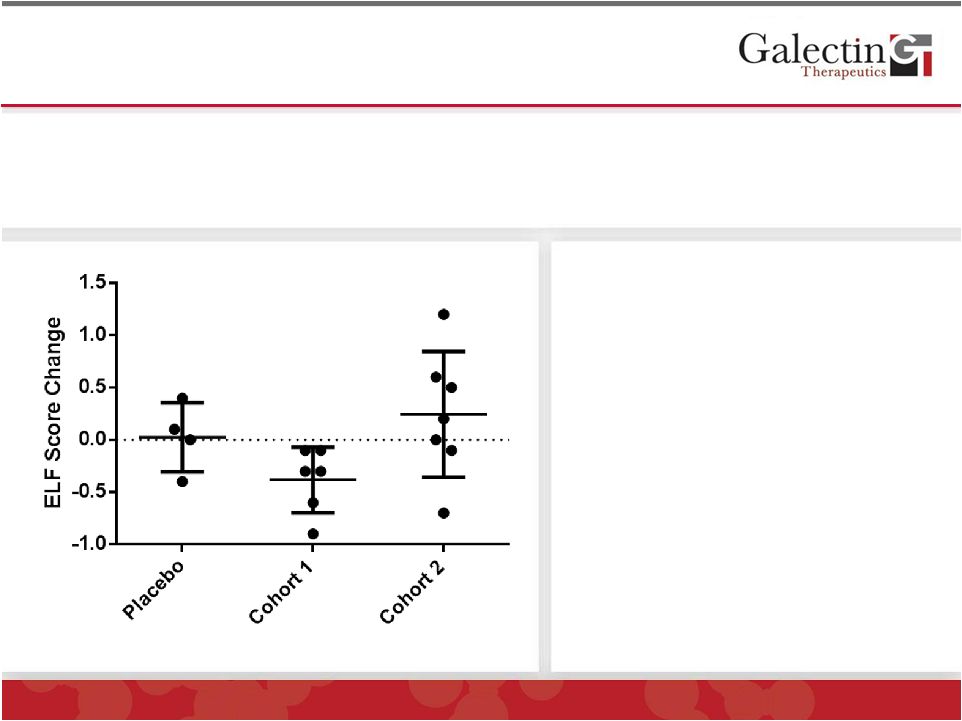 ELF
Scores In GR-MD-02 Treated Patients of Both Cohorts
©
2014 Galectin Therapeutics | NASDAQ:GALT
13
•
ELF scores tended to be reduced in the patients in the first cohort
•
ELF scores in the second cohort were more dispersed and tended to
increase over placebo
Interpretation:
•
There is an indication of an effect in
both cohorts, while not statistically
significant.
•
However, there are differences in the
biomarker data between the cohorts,
potentially due to sampling dates.
•
Cohort 1 last sample was taken 14
days after the last infusion, after the
drug has been eliminated.
•
Cohort 2 last sample was taken 3
days after last infusion, a time when
drug is still present.
•
Since ELF is a marker of fibrotic
tissue turnover, there may be
increased turnover at 3 days which
has reached a new lower state at 14
days after last infusion.
Note: Placebo patients from both cohorts were included in analysis
|
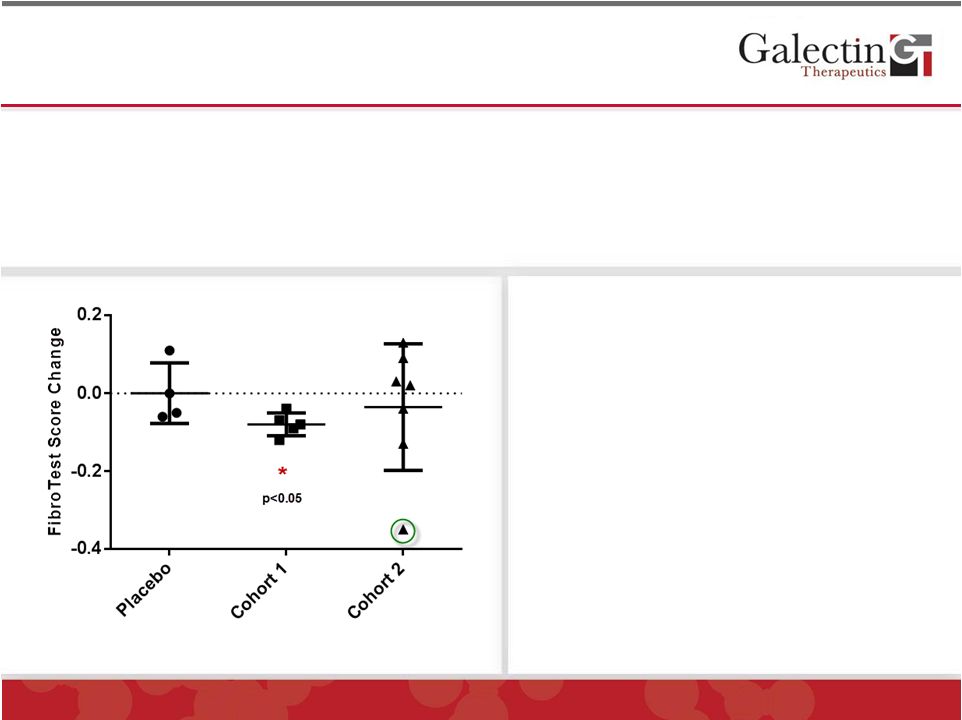 FibroTest
™
(FibroSURE
™
)
Scores
In
GR-MD-02 Treated
Patients of Both Cohorts
©
2014 Galectin Therapeutics | NASDAQ:GALT
14
•
FibroTest scores were significantly reduced in the patients in the first cohort
•
Scores were more variable in the second cohort and change did not reach
significance •
The patient with the greatest reduction in score (green circle) was also the patient
with the highest starting score (0.83; range of test is 0 to 1.0)
Note: Placebo patients from both cohorts were included in analysis
Interpretation:
•
Similar to ELF scores, the
differences in the biomarker data
between the cohorts is possibly due
to differences in sampling dates.
•
Cohort 1 last sample was taken 14
days after the last infusion, after the
drug has been eliminated.
•
Cohort 2 last sample was taken 3
days after last infusion, a time when
drug is still present.
•
The greater dispersion of scores in
cohort 2 may also indicate a
fluctuation in the changes in fibrous
tissue. |
 ©
2014 Galectin Therapeutics | NASDAQ:GALT
15
TGF-ß
Levels In GR-MD-02 Treated Patients In
Both Cohorts
•
TGF-ß
levels in the patients in the first cohort were unchanged from placebo
•
TGF-ß
levels increased in patients in the second cohort and the change was
significantly increased over placebo and first cohort patients
Note: Placebo patients from both cohorts were included in analysis
Interpretation:
•
These data provide another
indication that there are
differences in the biomarker data
between the cohorts, potentially due
to sampling dates.
•
Since it is not clear whether
circulating TGF-ß
levels are active, it
is difficult to assign a biological
meaning to these data.
•
However, the data do indicate that
there is some activity at 3 days
following the infusion that is not
identified at 14 days. |
 Interleukin-8 Levels In GR-MD-02 Treated Patients In
Both Cohorts
©
2014 Galectin Therapeutics | NASDAQ:GALT
16
Cohort 1*
Cohort 2*
NAFLD**
Obese
Controls**
IL-8
pg/mL
28.0 ±
8.6
22 ±
9.7
24.1 ±
38.5
7.8 ±
3.6
*Baseline levels
**Jarrar, et al. Aliment. Pharmacol. Ther. 2007
Note: Placebo patients from both cohorts were included in analysis
Interpretation:
•
Baseline IL-8 levels were elevated in
both cohorts.
•
IL-8 levels were significantly
reduced in cohort 1 but not changed
in cohort 2.
•
These data, along with the TGF-ß
data suggest that the cytokine milieu
is different when sampled at 3 days
versus 14 days following final infusion. |
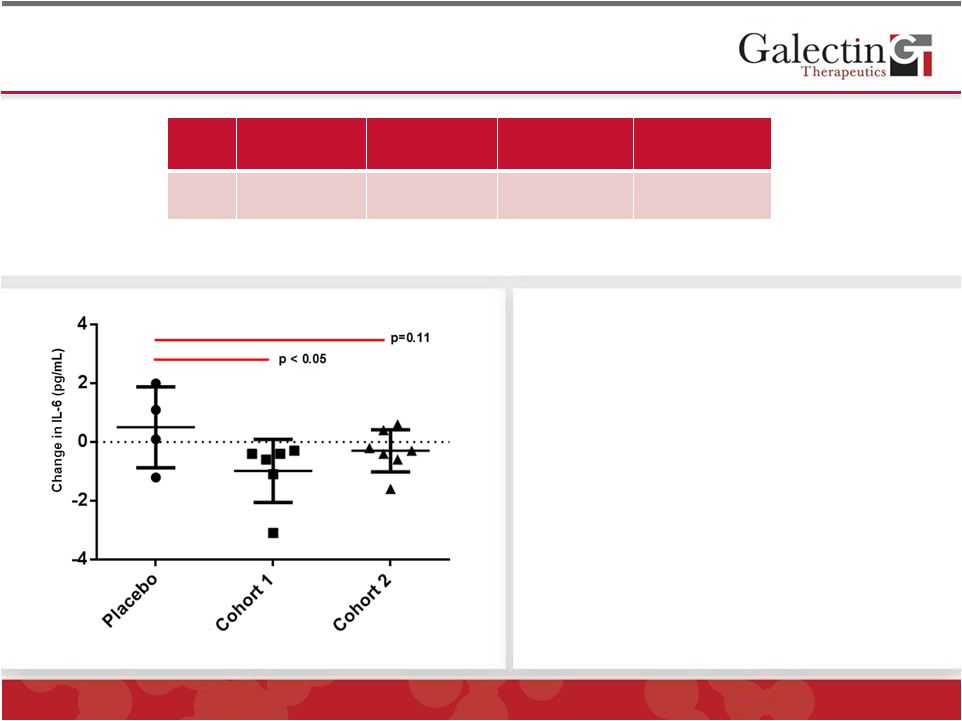 Interleukin-6 Levels In GR-MD-02 Treated Patients In
Both Cohorts
©
2014 Galectin Therapeutics | NASDAQ:GALT
17
Cohort 1*
Cohort 2*
NAFLD**
Obese
Controls**
IL-6
pg/mL
6.1 ±
2.5
5.3 ±
1.3
23.1±72.9
7.6±6.3
*Baseline levels
**Jarrar, et al. Aliment. Pharmacol. Ther. 2007
Note: Placebo patients from both cohorts were included in analysis
Interpretation:
•
Baseline IL-6 levels were not
elevated in either cohort.
•
IL-6 levels were significantly
reduced in cohort 1 but not changed
in cohort 2.
•
These data, along with the TGF-ß
data suggest that the cytokine milieu
is different when sampled at 3 days
versus 14 days following final infusion
•
Moreover, IL-6 may not be a good
marker since the levels are not
increased over obese controls. |
 ©
2014 Galectin Therapeutics | NASDAQ:GALT
18
TNF-
Levels In GR-MD-02 Treated Patients In
Both Cohorts
Note: Placebo patients from both cohorts were included in analysis
Interpretation:
•
Baseline TNF-
levels were elevated
in both cohorts.
•
TNF-
levels were previously
reported to be significantly reduced
in cohort 1, but this did not hold up
with the additional two placebo
patients included in the analysis.
•
While the variation in placebo values
is large, these data suggest that
there are not changes in TNF-
levels regardless of the timing of
samples after infusion.
*Baseline levels
**Jarrar, et al. Aliment. Pharmacol. Ther. 2007 |
 Alanine Aminotransferase (ALT) Levels In The Two
Cohorts
©
2014 Galectin Therapeutics | NASDAQ:GALT
19
Cohort 1 ALT Levels
•
Both
cohorts
had
a
broad
range
of
baseline
ALT
levels,
which
are
known
not
to
correlate with degree of fibrosis or activity of NASH.
•
The first cohort had two patients with ALT over 100 which improved with
therapy. •
There
were
no
patients
with
ALT
over
100
in
second
cohort
and
no
decreases
were seen with therapy. |
 Patients Had A Normal Range Of Blood Galectin-3
Levels At Baseline And No Change With Treatment
©
2014 Galectin Therapeutics | NASDAQ:GALT
20
•
Blood levels of Galectin-3 do not correlate with liver levels in animal models
of NASH •
Blood levels of Galectin-3 do not correlate with severity of disease in human
NASH |
 ©
2014 Galectin Therapeutics | NASDAQ:GALT
21
FibroScan
®
Analysis In Second Cohort
•
FibroScan
®
is an ultrasound-based measure of shear wave speed in the liver which
correlates with liver stiffness.
•
Approved
by
FDA
as
an
aid
to
clinical
management
of
patients
with
liver
disease.
Not
approved for following changes in liver fibrosis.
•
Test was done primarily to gain experience with the test prior to use in Phase 2
and was performed
at
sites
where
available
(6
patients
were
evaluated
at
days
-1
and
38.)
All patients had FibroScan
values above the values
predictive of advanced,
stage 3 fibrosis (7.9 kPa).
There were no consistent
changes with therapy.
The large difference in one
placebo patient suggests
more experience is required
with this method in
longitudinal studies. |
 Summary of Findings:
Primary Endpoints Were Met In Cohort 2
•
GR-MD-02 was safe and well tolerated at dose of 4 mg/kg (80/160 mg/m²), similar to the findings of the 2 mg/kg dose in
the first cohort. •
The independent Data Safety Monitoring Board (DSMB) approved moving
forward with Cohort 3.
•
Pharmacokinetics revealed a proportional increase in total drug exposure with
doubling of the dose of GR-MD-02 with no accumulation after four
doses. •
A dose of 4 mg/kg provided drug exposure in humans that was roughly
equivalent to the lowest therapeutic dose used in NASH animal models.
•
The drug half-life in humans is approximately 4 times longer than in mouse at
similar doses providing a more extended exposure in humans.
GR-MD-02
safe,
well
tolerated,
and
has
predictable
pharmacokinetics
when
administered
at
4
mg/kg,
a
dose
that
correlates
with
a
therapeutic
dose
in
animal
models
of
NASH.
22
©
2014 Galectin Therapeutics | NASDAQ:GALT |
 Summary of Findings:
Exploratory Secondary Endpoints
•
While the current gold standard for the evaluation of NASH with advanced
fibrosis is liver biopsy, it is not appropriate to subject individuals to serial
liver biopsies over a short Phase 1 clinical trial. Biopsy assessment of
liver fibrosis will be the primary endpoint in the Phase 2 clinical trial to
follow this trial. •
To potentially gain some understanding of drug effect and to aid
in planning of
a Phase 2 clinical trial, exploratory biomarkers were evaluated before and
after therapy.
•
While the overall impression of biomarker analysis suggests an effect of the
drug, there are differences in biomarker changes depending on the timing of
blood sampling with respect to drug dose.
•
Since biomarker results are not directly comparable between cohort 1 and
cohort 2, a comparison of the effect of timing on biomarkers will be evaluated
in cohort 3.
23
©
2014 Galectin Therapeutics | NASDAQ:GALT |
 Next
Steps: Completion of Phase 1 Trial ©
2014 Galectin Therapeutics | NASDAQ:GALT
24
•
The dose of GR-MD-02 will be increased to 8 mg/kg (320 mg/m
2
) in the third
and final cohort, a dose projected to be well within the therapeutic range as
predicted in pre-clinical studies.
•
The number of patients in the third cohort will be expanded to 20 total patients
(12 active drug and 8 placebo) which will allow comparison of 12
patients in
each group in analysis of the data (including 4 placebos from previous
cohorts).
•
Blood biomarker analysis will be conducted at four time points during the
study to account for potential sample timing differences following drug
infusion.
•
Patient screening and enrollment for cohort 3 has begun and results are
expected in November 2014.
•
Planning for phase 2 clinical trials is ongoing. The results of the first and
second cohort suggest that 2 and 4 mg/kg are safe and well-tolerated
doses, defining a dose range for phase 2 clinical trials.
|