Attached files
| file | filename |
|---|---|
| 8-K - FORM 8-K - BRINKS CO | form_8-k.htm |
| EX-99.1 - EXHIBIT 99-1 - BRINKS CO | exhibit_99-1.htm |

The Brink’s
Company
Company
Second Quarter 2014
Earnings Call
Earnings Call
NYSE: BCO
July 24, 2014
Exhibit 99.2

Forward-Looking Statements and Non-GAAP Results
These materials contain forward-looking statements. Actual results could differ materially
from projected or estimated results. Information regarding factors that could cause such
differences is available in today's release and in The Brink’s Company’s most recent SEC
filings.
from projected or estimated results. Information regarding factors that could cause such
differences is available in today's release and in The Brink’s Company’s most recent SEC
filings.
Information discussed today is representative as of today only and Brink's assumes no
obligation to update any forward-looking statements. These materials are copyrighted and
may not be used without written permission from Brink's.
obligation to update any forward-looking statements. These materials are copyrighted and
may not be used without written permission from Brink's.
Today’s presentation is focused primarily on non-GAAP results. Detailed reconciliations of
non-GAAP to GAAP results are provided on pages 13 - 18 of today’s release and in our SEC
filings.
non-GAAP to GAAP results are provided on pages 13 - 18 of today’s release and in our SEC
filings.
2

CEO Overview
3
Second Quarter Non-GAAP
• EPS $.27 vs $.47
• Segment profit down $18 million
– $9 million organic decline - primarily Mexico
and France
and France
– $9 million negative currency
Looking Ahead
• 2014 guidance unchanged
– Non-GAAP segment margin 6.5%,
revenue ~$3.7 billion
revenue ~$3.7 billion
• 2016 Non-GAAP Targets
– 8% segment margin
– $290 to $330 million segment operating profit
– $2.50 - $3.00 EPS
Note: See reconciliation to GAAP results and other information in appendix

4
2Q14 Non-GAAP Results
($ millions, except EPS)
Note: See reconciliation to GAAP results in appendix
Revenue
Segment Operating
Profit
EPS
5
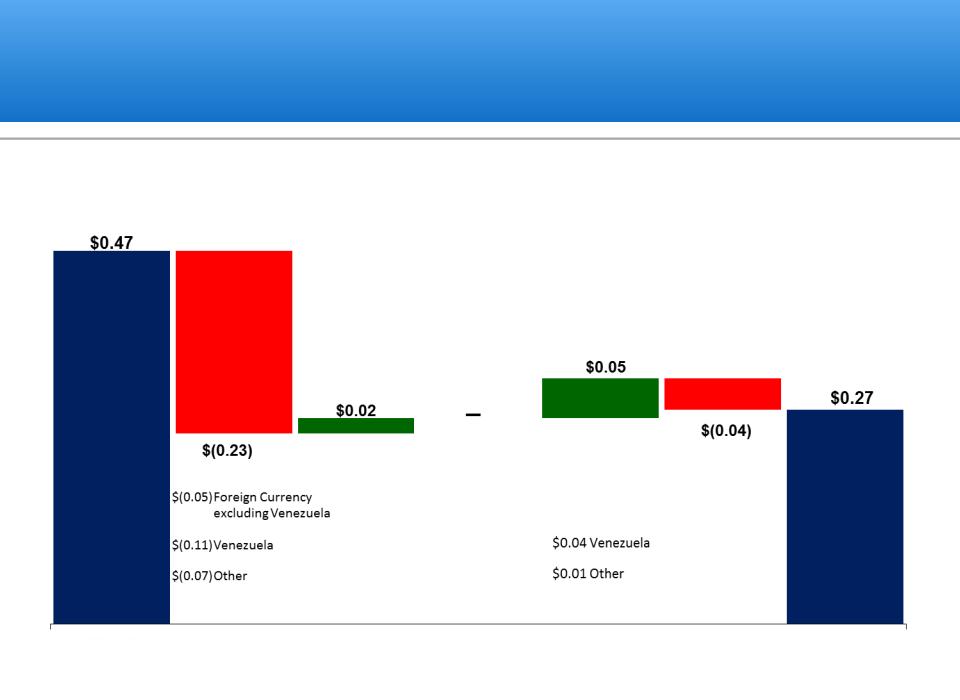
Non-GAAP EPS: 2Q13 Versus 2Q14
Segment
Operating
Profit
Operating
Profit
Non-Segment
Expense
Expense
Interest
Expense, Net
Expense, Net
Non-
Controlling
Interest
Controlling
Interest
Tax
Rate/Diluted
Shares
Rate/Diluted
Shares
2Q13
2Q14
Note: See reconciliation to GAAP results in appendix
$(0.04) Venezuela

6
Non-GAAP Cash Flow, Capital Investment and Net Debt
($ millions)
(a) See reconciliation to GAAP results in appendix
Capital
Expenditures and
Capital Leases
Expenditures and
Capital Leases
Net Debt (a)

7
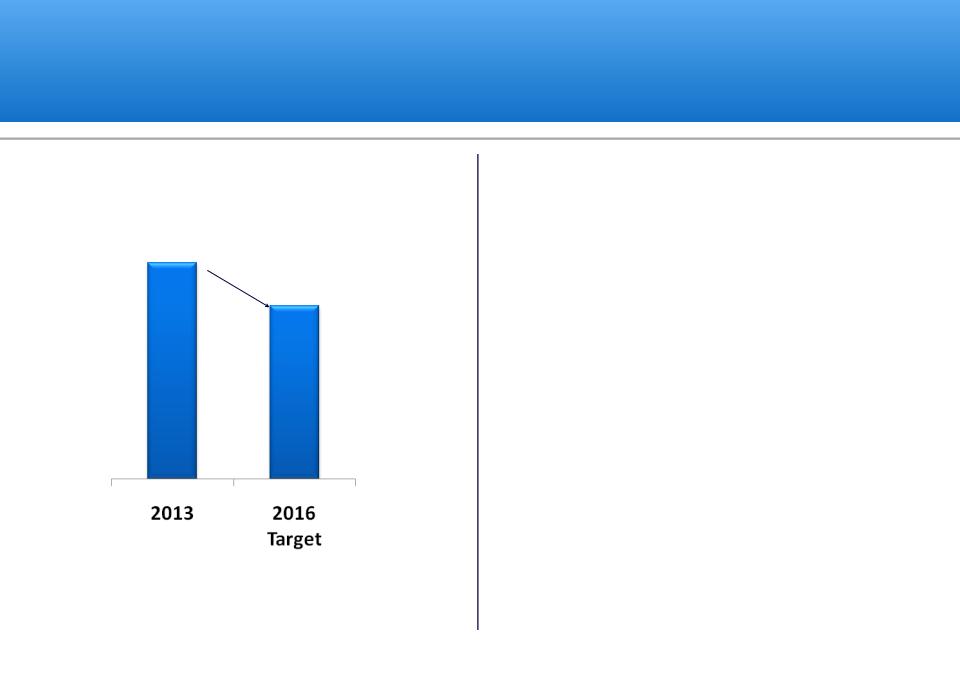
Estimated Cash Payments to Primary U.S. Pension & UMWA
• Accelerating required 2015 and 2016 payments ($61 million) into 2014
− Accelerate the de-risking of invested asset allocation
− Lower Pension Benefit Guaranty Corp (PBGC) premiums
(current borrowing costs are lower than PBGC premiums)
• Plan to fund future pension obligations with cash
• Cash payments to UMWA expected to resume in 2033
Payments to Primary U.S. Pension

2016 Targets
8
2016 Non-GAAP Targets (a)
• 8% segment margin
• $290 - $330 million segment profit
• $2.50 - $3.00 EPS
How We Get There
• Fix U.S. and Mexico
• Rest of world margin +1.0% point
• Organic revenue growth ~5%
• Operational excellence
– Global procurement
– Centralization
(a) See appendix for information regarding reconciling to GAAP

9
Non-GAAP 2016 Targets
(a) 2013 Non-GAAP results adjusted for Venezuelan results at 50 bolivars per U.S. dollar. See appendix for reconciliations to GAAP and other information.
(b) Includes all regional/corporate allocated costs
2016 Target Margin / Potential EPS Growth(a)
Segment
Op Profit
Op Profit
EPS
2013 Actual
$216
$1.64
U.S. at 6% Margin
$30
$0.34
Mexico at 10% Margin
$22
$0.26
Rest of World +1.0% Margin
$22
$0.26
2016 Target ~8% Margin
~$290
~$2.50
Add 5% annual organic
revenue growth ‘14 - ’16
revenue growth ‘14 - ’16
~$40
~$0.50
Potential 2016
$290 - $330
$2.50 - $3.00
$13 Op Profit
1.8% Margin
$23 Op Profit
5.0% Margin
$180 OpProfit
7.5% Margin
(b)
($ millions, except where noted)
2013 Adjusted Non-GAAP Results (a)
$3.6 Billion Revenue
$216 Op Profit
6.1% Margin
Revenue

10
North America Non-GAAP Segment Margin Outlook
(excluding Global Payments)
Note: See appendix for reconciliation to GAAP
11
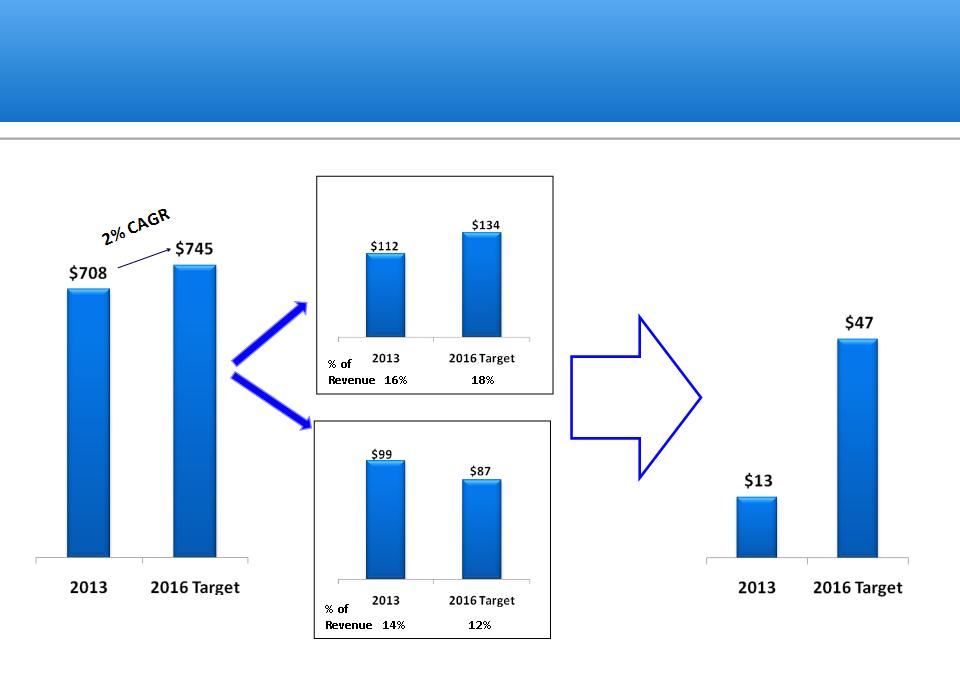
U.S. Profit Improvement 2013 à 2016
($ millions)
Revenue
Operating Profit (a)
SG&A (a)
Branch Margin (a)
Profit
Costs
% of
Revenue 2% 6%
Revenue 2% 6%
(a) On a Non-GAAP basis. See reconciliation to GAAP results in appendix.

12
U.S. - Performing Branches
Performing branch = Operating profit above breakeven on a fully
loaded cost basis
loaded cost basis
Productivity Projects
• Route logistics
• Field force automation
• Centralized billing
• CompuSafe® service focus
• Vehicle armoring and
maintenance
maintenance
• One-man crew on CIT
• Project management
organization support
organization support

13
North America Non-GAAP Segment Margin Outlook
(excluding Global Payments)
(excluding Global Payments)
Note: See appendix for reconciliation to GAAP and other information
14
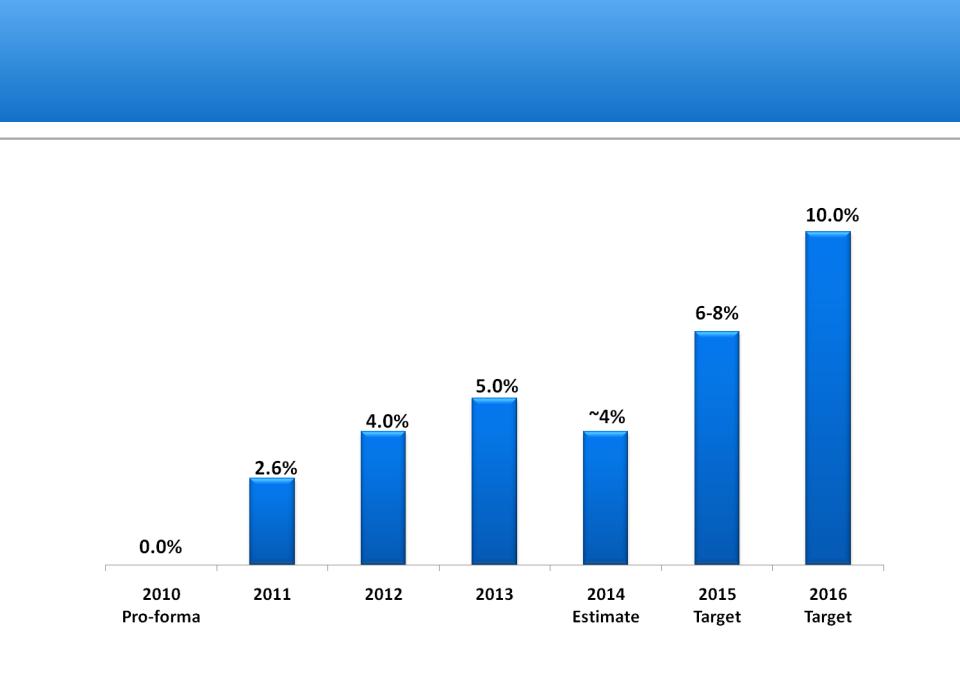
Mexico Non-GAAP Segment Margin Rate History and Outlook
Note: See reconciliation to GAAP in appendix

% of
Revenue 14% 18%
% of
Revenue 9% 8%
15
Mexico Profit Improvement 2013 à 2016
Revenue
Operating Profit(a)
Branch Margin(a)
Profit
% of
Revenue 5% 10%
Revenue 5% 10%
($ millions)
(a) See reconciliation to GAAP and other information in appendix
SG&A(a)
Costs

16
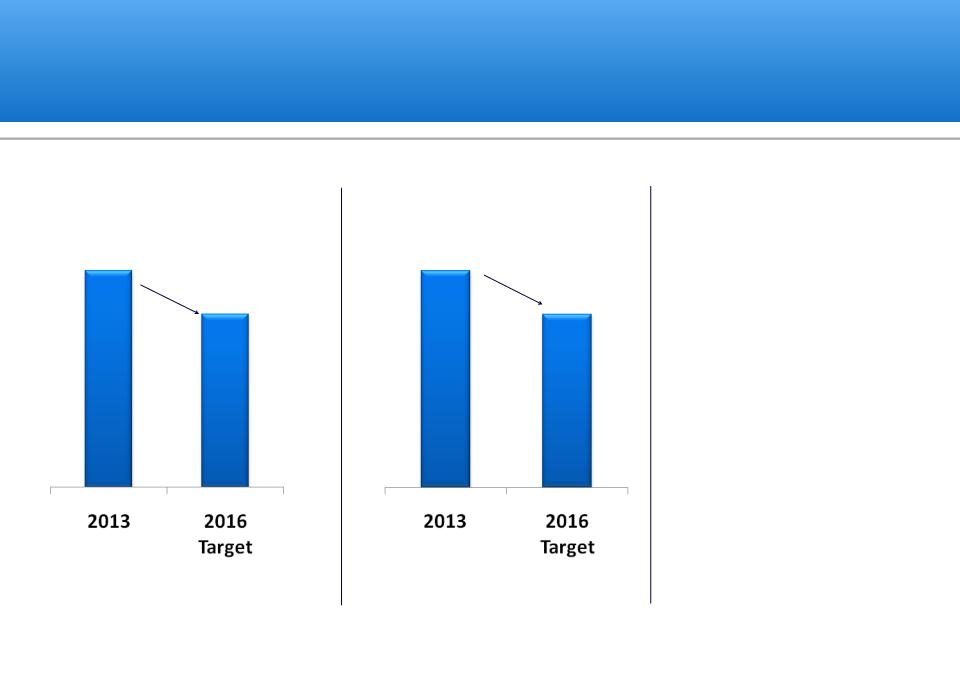
Mexico Branch Margin Improvement
4%
Reduction
Reduction
($ millions)
Operational Structure
(Branch Costs)
10%
Reduction
Reduction
Administrative Structure
(Support Functions)
(Support Functions)
Productivity Projects
• “Standard” branch structure
• Centralization
• Finance shared services
• Money processing
• Global procurement
(a)
(a) Excludes organic growth

17
Mexico Money Processing Improvements
Money Processing
Efficiency Metric
(notes per hour, per person)
Capex
Spend
(millions)
Spend
(millions)
Headcount

18
Note: See reconciliation to GAAP in appendix
Mexico Non-GAAP Segment Margin Rate History and Outlook

19
Operational Excellence
Global Procurement
IT Centralization
20
Global Procurement
20%
Reduction
Armored Vehicles
(Acquisition Costs per Vehicle)
Expect to Deliver 20%
Savings by 2016
Savings by 2016
• Global tender
• Re-design vehicles
• Improved match of
vehicle type to
environment
Non-Armored Vehicles
(Acquisition Costs per Vehicle)
20%
Reduction
($ millions)
21
Global Procurement
• Vehicle standardization
• Vehicle maintenance
• Money processing equipment
• Contractors/purchased services
• Global tenders
• ATM locks
Global Travel Costs
Next Focus Areas
$5 to $10
Reduction
Implemented global travel agent 1H14
($ millions)

22
IT Centralization
($ millions)
Global IT Costs
Data Centers
Key Projects
• Global data center strategy
• Global alignment of IT
organization & spend
organization & spend
• Global procurement/tender
of IT equipment
• Global application map
• Network & telephone
rationalization
rationalization
60%
Reduction
$15 to $20
Reduction

2016 Targets
23
2016 Non-GAAP Targets (a)
• 8% segment margin
• $290 - $330 million segment profit
• $2.50 - $3.00 EPS
How We Get There
• Fix U.S. and Mexico
• Rest of world margin +1.0% points
• Organic revenue growth ~5%
• Operational excellence
– Global procurement
– Centralization
(a) See appendix for information regarding reconciling to GAAP

24
Appendix

25
Legacy Liabilities - Underfunding - at December 31, 2013
($ millions)

Reinvestment
Ratio
Ratio
($ millions, except ratio)
26
Capex Spend

27
GAAP
Basis
Expenses Related
to Currency
Devaluation in
Venezuela (a)
to Currency
Devaluation in
Venezuela (a)
Losses on
Closure (b)
Closure (b)
Employee
Benefit
Settlement
Losses (c)
Benefit
Settlement
Losses (c)
U.S.
Retirement
Plans (d)
Retirement
Plans (d)
Share-based
Compensation
Adjustment (e)
Compensation
Adjustment (e)
Adjust
Income Tax
Rate (f)
Income Tax
Rate (f)
Non-
GAAP
Basis
GAAP
Basis
Adjust Venezuela
to 50 Bolivars to
the U.S. Dollar (g)
to 50 Bolivars to
the U.S. Dollar (g)
Adjusted Non
-GAAP Basis
(h)
-GAAP Basis
(h)
First Quarter 2014
Revenues:
Latin America
$
438.4
−
−
−
−
−
−
438.4
(113.1)
325.3
EMEA
298.0
−
−
−
−
−
−
298.0
−
298.0
North America
220.1
−
−
−
−
−
−
220.1
−
220.1
Asia Pacific
35.1
−
−
−
−
−
−
35.1
−
35.1
Revenues
$
991.6
−
−
−
−
−
−
991.6
(113.1)
878.5
Operating profit:
Latin America
$
(74.8)
123.3
−
0.9
−
−
−
49.4
(28.9)
20.5
EMEA
14.8
−
−
−
−
−
−
14.8
−
14.8
North America
1.1
−
−
−
1.2
−
−
2.3
−
2.3
Asia Pacific
4.4
−
−
−
−
−
−
4.4
−
4.4
Segment operating profit
(54.5)
123.3
−
0.9
1.2
−
−
70.9
(28.9)
42.0
Non-segment
(18.0)
−
−
−
4.8
−
−
(13.2)
−
(13.2)
Operating profit
$
(72.5)
123.3
−
0.9
6.0
−
−
57.7
(28.9)
28.8
Amounts attributable to Brink’s:
Income from continuing operations
$
(58.4)
74.9
−
0.6
3.8
−
1.2
22.1
(11.2)
10.9
Diluted EPS - continuing operations
(1.19)
1.53
−
0.01
0.08
−
0.02
0.45
(0.23)
0.22
Non-GAAP Reconciliations - 1Q2014
Amounts may not add due to rounding. See page 30 for notes.

28
GAAP
Basis
Expenses Related
to Currency
Devaluation in
Venezuela (a)
to Currency
Devaluation in
Venezuela (a)
Losses on
Closure (b)
Closure (b)
Employee
Benefit
Settlement
Losses (c)
Benefit
Settlement
Losses (c)
U.S.
Retirement
Plans (d)
Retirement
Plans (d)
Share-based
Compensation
Adjustment (e)
Compensation
Adjustment (e)
Adjust
Income Tax
Rate (f)
Income Tax
Rate (f)
Non-
GAAP
Basis
GAAP
Basis
Adjust Venezuela
to 50 Bolivars to
the U.S. Dollar (g)
to 50 Bolivars to
the U.S. Dollar (g)
Adjusted Non
-GAAP Basis
(h)
-GAAP Basis
(h)
Second Quarter 2014
Revenues:
Latin America
$
336.5
−
−
−
−
−
−
336.5
−
336.5
EMEA
302.9
−
−
−
−
−
−
302.9
−
302.9
North America
225.7
−
−
−
−
−
−
225.7
−
225.7
Asia Pacific
36.4
−
−
−
−
−
−
36.4
−
36.4
Revenues
$
901.5
−
−
−
−
−
−
901.5
−
901.5
Operating profit:
Latin America
$
(1.5)
9.8
0.7
0.9
−
0.6
−
10.5
−
10.5
EMEA
17.3
−
−
−
−
0.5
−
17.8
−
17.8
North America
5.7
−
−
−
0.8
0.3
−
6.8
−
6.8
Asia Pacific
4.6
−
−
−
−
0.1
−
4.7
−
4.7
Segment operating profit
26.1
9.8
0.7
0.9
0.8
1.5
−
39.8
−
39.8
Non-segment
(15.4)
−
−
−
2.8
2.7
−
(9.9)
−
(9.9)
Operating profit
$
10.7
9.8
0.7
0.9
3.6
4.2
−
29.9
−
29.9
Amounts attributable to Brink’s:
Income from continuing operations
$
2.3
6.0
0.7
0.8
2.3
3.4
(2.1)
13.4
(0.6)
12.8
Diluted EPS - continuing operations
0.05
0.12
0.01
0.02
0.05
0.07
(0.04)
0.27
(0.01)
0.26
Non-GAAP Reconciliations - 2Q2014
Amounts may not add due to rounding. See page 30 for notes.

29
GAAP
Basis
Expenses Related
to Currency
Devaluation in
Venezuela (a)
to Currency
Devaluation in
Venezuela (a)
Losses on
Closure (b)
Closure (b)
Employee
Benefit
Settlement
Losses (c)
Benefit
Settlement
Losses (c)
U.S.
Retirement
Plans (d)
Retirement
Plans (d)
Share-based
Compensation
Adjustment (e)
Compensation
Adjustment (e)
Adjust
Income Tax
Rate (f)
Income Tax
Rate (f)
Non-
GAAP
Basis
GAAP
Basis
Adjust Venezuela
to 50 Bolivars to
the U.S. Dollar (g)
to 50 Bolivars to
the U.S. Dollar (g)
Adjusted Non
-GAAP Basis
(h)
-GAAP Basis
(h)
First Half 2014
Revenues:
Latin America
$
774.9
−
−
−
−
−
−
774.9
(113.1)
661.8
EMEA
600.9
−
−
−
−
−
−
600.9
−
600.9
North America
445.8
−
−
−
−
−
−
445.8
−
445.8
Asia Pacific
71.5
−
−
−
−
−
−
71.5
−
71.5
Revenues
$
1,893.1
−
−
−
−
−
−
1,893.1
(113.1)
1,780.0
Operating profit:
Latin America
$
(76.3)
133.1
0.7
1.8
−
0.6
−
59.9
(28.9)
31.0
EMEA
32.1
−
−
−
−
0.5
−
32.6
−
32.6
North America
6.8
−
−
−
2.0
0.3
−
9.1
−
9.1
Asia Pacific
9.0
−
−
−
−
0.1
−
9.1
−
9.1
Segment operating profit
(28.4)
133.1
0.7
1.8
2.0
1.5
−
110.7
(28.9)
81.8
Non-segment
(33.4)
−
−
−
7.6
2.7
−
(23.1)
−
(23.1)
Operating profit
$
(61.8)
133.1
0.7
1.8
9.6
4.2
−
87.6
(28.9)
58.7
Amounts attributable to Brink’s:
Income from continuing operations
$
(56.1)
80.9
0.7
1.4
6.1
3.4
(0.9)
35.5
(11.8)
23.7
Diluted EPS - continuing operations
(1.15)
1.65
0.01
0.03
0.12
0.07
(0.02)
0.72
(0.24)
0.48
Non-GAAP Reconciliations - First Half 2014
Amounts may not add due to rounding. See page 30 for notes.

30
Non-GAAP Reconciliations - 2014 Notes
(a) To eliminate the effects of the March 2014 currency devaluation in Venezuela as described in (g) below. Expenses eliminated from non-GAAP results
include first-quarter currency exchange losses totaling $122 million related to remeasured net monetary assets and $1 million first-quarter and $10
include first-quarter currency exchange losses totaling $122 million related to remeasured net monetary assets and $1 million first-quarter and $10
million second-quarter expenses related to nonmonetary assets. Nonmonetary assets were not remeasured to a lower basis when the currency
devalued. Instead, under highly inflationary accounting rules, these assets retained their higher historical bases, which excess is recognized in earnings
as the asset is consumed.
(b) To eliminate an impairment loss related to Latin America operations that are expected to be shut down within the next 12 months.
(c) To eliminate employee benefit settlement losses in Mexico.
(d) To eliminate expenses related to U.S. retirement plans.
(e) To eliminate the expense related to an accounting adjustment related to share-based compensation. The accounting adjustment revises the accounting
for share-based compensation from fixed to variable fair value accounting as defined in ASC Topic 718, Stock Compensation. Additional information will
for share-based compensation from fixed to variable fair value accounting as defined in ASC Topic 718, Stock Compensation. Additional information will
be available in the company’s Form 10-Q to be filed for the second quarter of 2014.
(f) To adjust effective income tax rate in the interim period to be equal to the midpoint of the estimated range of the full-year Non-GAAP effective income
tax rate. The midpoint of the estimated range of the full-year Non-GAAP effective tax rate for 2014 is 36.5%.
(g) Effective March 24, 2014, Brink’s began remeasuring its Venezuelan operating results using currency exchange rates reported under a newly established
currency exchange process in Venezuela (the “SICAD II process”). The rate published for this process has averaged approximately 50 since opening
currency exchange process in Venezuela (the “SICAD II process”). The rate published for this process has averaged approximately 50 since opening
March 24, 2014. This adjustment reflects a hypothetical remeasurement of Brink’s Venezuela’s first quarter 2014 revenue and operating results using a
rate of 50 bolivars to the U.S. dollar, which approximates the rate observed in the new SICAD II currency exchange process in March 2014.
(h) Non-GAAP results adjusted for Venezuelan results at 50 bolivars per U.S. dollar.

31
GAAP
Basis
Gains and Losses
on Acquisitions and
Dispositions (a)
on Acquisitions and
Dispositions (a)
Expenses Related to
Currency Devaluation
in
Currency Devaluation
in
Venezuela (b)
Employee
Benefit
Settlement
Losses (c)
Benefit
Settlement
Losses (c)
U.S.
Retirement
Plans (d)
Retirement
Plans (d)
Adjust
Income Tax
Rate (e)
Income Tax
Rate (e)
Non-
GAAP
Basis
GAAP
Basis
Adjust Venezuela
to 50 Bolivars to
the U.S. Dollar (f)
to 50 Bolivars to
the U.S. Dollar (f)
Adjusted Non
-GAAP Basis
(g)
-GAAP Basis
(g)
First Quarter 2013
Revenues:
Latin America
$
412.9
−
−
−
−
−
412.9
(84.5)
328.4
EMEA
277.8
−
−
−
−
−
277.8
−
277.8
North America
223.2
−
−
−
−
−
223.2
−
223.2
Asia Pacific
36.6
−
−
−
−
−
36.6
−
36.6
Revenues
$
950.5
−
−
−
−
−
950.5
(84.5)
866.0
Operating profit:
Latin America
$
23.4
−
13.9
0.3
−
−
37.6
(18.0)
19.6
EMEA
8.6
−
−
−
−
−
8.6
−
8.6
North America
(2.0)
−
−
−
2.9
−
0.9
−
0.9
Asia Pacific
4.3
−
−
−
−
−
4.3
−
4.3
Segment operating profit
34.3
−
13.9
0.3
2.9
−
51.4
(18.0)
33.4
Non-segment
(17.0)
(1.1)
−
−
10.5
−
(7.6)
−
(7.6)
Operating profit
$
17.3
(1.1)
13.9
0.3
13.4
−
43.8
(18.0)
25.8
Amounts attributable to Brink’s:
Income from continuing operations
$
2.9
(1.1)
8.7
0.2
8.2
0.1
19.0
(8.9)
10.1
Diluted EPS - continuing operations
0.06
(0.02)
0.18
−
0.17
−
0.39
(0.18)
0.21
Non-GAAP Reconciliations - 1Q2013
Amounts may not add due to rounding. See page 37 for notes.

32
GAAP
Basis
Gains and Losses
on Acquisitions and
Dispositions (a)
on Acquisitions and
Dispositions (a)
Expenses Related to
Currency Devaluation
in Venezuela
Currency Devaluation
in Venezuela
(b)
Employee
Benefit
Settlement
Losses (c)
Benefit
Settlement
Losses (c)
U.S.
Retirement
Plans (d)
Retirement
Plans (d)
Adjust
Income Tax
Rate (e)
Income Tax
Rate (e)
Non-
GAAP
Basis
GAAP
Basis
Adjust Venezuela
to 50 Bolivars to
the U.S. Dollar (f)
to 50 Bolivars to
the U.S. Dollar (f)
Adjusted Non
-GAAP Basis
(g)
-GAAP Basis
(g)
Second Quarter 2013
Revenues:
Latin America
$
413.6
−
−
−
−
−
413.6
(83.9)
329.7
EMEA
293.4
−
−
−
−
−
293.4
−
293.4
North America
226.3
−
−
−
−
−
226.3
−
226.3
Asia Pacific
36.6
−
−
−
−
−
36.6
−
36.6
Revenues
$
969.9
−
−
−
−
−
969.9
(83.9)
886.0
Operating profit:
Latin America
$
24.4
−
0.2
0.5
−
−
25.1
(8.6)
16.5
EMEA
18.7
−
−
−
−
−
18.7
−
18.7
North America
6.3
−
−
−
2.9
−
9.2
−
9.2
Asia Pacific
5.0
−
−
−
−
−
5.0
−
5.0
Segment operating profit
54.4
−
0.2
0.5
2.9
−
58.0
(8.6)
49.4
Non-segment
(21.6)
−
−
−
10.2
−
(11.4)
−
(11.4)
Operating profit
$
32.8
−
0.2
0.5
13.1
−
46.6
(8.6)
38.0
Amounts attributable to Brink’s:
Income from continuing operations
$
13.2
−
0.1
0.4
7.7
1.5
22.9
(5.8)
17.1
Diluted EPS - continuing operations
0.27
−
−
0.01
0.16
0.03
0.47
(0.12)
0.35
Non-GAAP Reconciliations - 2Q2013
Amounts may not add due to rounding. See page 37 for notes.

33
GAAP
Basis
Gains and Losses
on Acquisitions and
Dispositions (a)
on Acquisitions and
Dispositions (a)
Expenses Related to
Currency Devaluation
in Venezuela
Currency Devaluation
in Venezuela
(b)
Employee
Benefit
Settlement
Losses (c)
Benefit
Settlement
Losses (c)
U.S.
Retirement
Plans (d)
Retirement
Plans (d)
Adjust
Income Tax
Rate (e)
Income Tax
Rate (e)
Non-
GAAP
Basis
GAAP
Basis
Adjust Venezuela
to 50 Bolivars to
the U.S. Dollar (f)
to 50 Bolivars to
the U.S. Dollar (f)
Adjusted Non
-GAAP Basis
(g)
-GAAP Basis
(g)
First Half 2013
Revenues:
Latin America
$
826.5
−
−
−
−
−
826.5
(168.4)
658.1
EMEA
571.2
−
−
−
−
−
571.2
−
571.2
North America
449.5
−
−
−
−
−
449.5
−
449.5
Asia Pacific
73.2
−
−
−
−
−
73.2
−
73.2
Revenues
$
1,920.4
−
−
−
−
−
1,920.4
(168.4)
1,752.0
Operating profit:
Latin America
$
47.8
−
14.1
0.8
−
−
62.7
(26.6)
36.1
EMEA
27.3
−
−
−
−
−
27.3
−
27.3
North America
4.3
−
−
−
5.8
−
10.1
−
10.1
Asia Pacific
9.3
−
−
−
−
−
9.3
−
9.3
Segment operating profit
88.7
−
14.1
0.8
5.8
−
109.4
(26.6)
82.8
Non-segment
(38.6)
(1.1)
−
−
20.7
−
(19.0)
−
(19.0)
Operating profit
$
50.1
(1.1)
14.1
0.8
26.5
−
90.4
(26.6)
63.8
Amounts attributable to Brink’s:
Income from continuing operations
$
16.1
(1.1)
8.8
0.6
15.9
1.6
41.9
(14.7)
27.2
Diluted EPS - continuing operations
0.33
(0.02)
0.18
0.01
0.33
0.03
0.86
(0.30)
0.56
Non-GAAP Reconciliations - First Half 2013
Amounts may not add due to rounding. See page 37 for notes.

34
GAAP
Basis
Gains and Losses
on Acquisitions and
Dispositions (a)
on Acquisitions and
Dispositions (a)
Expenses Related to
Currency Devaluation
in Venezuela
Currency Devaluation
in Venezuela
(b)
Employee
Benefit
Settlement
Losses (c)
Benefit
Settlement
Losses (c)
U.S.
Retirement
Plans (d)
Retirement
Plans (d)
Adjust
Income Tax
Rate (e)
Income Tax
Rate (e)
Non-
GAAP
Basis
GAAP
Basis
Adjust Venezuela
to 50 Bolivars to
the U.S. Dollar (f)
to 50 Bolivars to
the U.S. Dollar (f)
Adjusted Non
-GAAP Basis
(g)
-GAAP Basis
(g)
Third Quarter 2013
Revenues:
Latin America
$
423.8
−
−
−
−
−
423.8
(100.1)
323.7
EMEA
301.2
−
−
−
−
−
301.2
−
301.2
North America
222.5
−
−
−
−
−
222.5
−
222.5
Asia Pacific
34.9
−
−
−
−
−
34.9
−
34.9
Revenues
$
982.4
−
−
−
−
−
982.4
(100.1)
882.3
Operating profit:
Latin America
$
42.8
−
0.2
0.8
−
−
43.8
(20.7)
23.1
EMEA
32.1
−
−
−
−
−
32.1
−
32.1
North America
0.2
−
−
−
2.9
−
3.1
−
3.1
Asia Pacific
4.8
−
−
−
−
−
4.8
−
4.8
Segment operating profit
79.9
−
0.2
0.8
2.9
−
83.8
(20.7)
63.1
Non-segment
(20.7)
(0.9)
−
−
10.3
−
(11.3)
−
(11.3)
Operating profit
$
59.2
(0.9)
0.2
0.8
13.2
−
72.5
(20.7)
51.8
Amounts attributable to Brink’s:
Income from continuing operations
$
29.8
(0.9)
0.1
0.6
7.7
(1.7)
35.6
(11.6)
24.0
Diluted EPS - continuing operations
0.61
(0.02)
−
0.01
0.16
(0.03)
0.73
(0.24)
0.49
Non-GAAP Reconciliations - 3Q2013
Amounts may not add due to rounding. See page 37 for notes.

35
GAAP
Basis
Gains and Losses
on Acquisitions and
Dispositions (a)
on Acquisitions and
Dispositions (a)
Expenses Related to
Currency Devaluation
in Venezuela
Currency Devaluation
in Venezuela
(b)
Employee
Benefit
Settlement
Losses (c)
Benefit
Settlement
Losses (c)
U.S.
Retirement
Plans (d)
Retirement
Plans (d)
Adjust
Income Tax
Rate (e)
Income Tax
Rate (e)
Non-
GAAP
Basis
GAAP
Basis
Adjust Venezuela
to 50 Bolivars to
the U.S. Dollar (f)
to 50 Bolivars to
the U.S. Dollar (f)
Adjusted Non
-GAAP Basis
(g)
-GAAP Basis
(g)
Fourth Quarter 2013
Revenues:
Latin America
$
470.4
−
−
−
−
−
470.4
(123.0)
347.4
EMEA
305.9
−
−
−
−
−
305.9
−
305.9
North America
226.4
−
−
−
−
−
226.4
−
226.4
Asia Pacific
36.7
−
−
−
−
−
36.7
−
36.7
Revenues
$
1,039.4
−
−
−
−
−
1,039.4
(123.0)
916.4
Operating profit:
Latin America
$
59.3
2.2
0.3
0.9
−
−
62.7
(21.6)
41.1
EMEA
22.1
−
−
−
−
−
22.1
−
22.1
North America
0.2
−
−
−
2.9
−
3.1
−
3.1
Asia Pacific
2.6
0.9
−
−
−
−
3.5
−
3.5
Segment operating profit
84.2
3.1
0.3
0.9
2.9
−
91.4
(21.6)
69.8
Non-segment
(21.8)
(0.8)
−
−
10.3
−
(12.3)
−
(12.3)
Operating profit
$
62.4
2.3
0.3
0.9
13.2
−
79.1
(21.6)
57.5
Amounts attributable to Brink’s:
Income from continuing operations
$
26.0
4.0
0.2
0.6
8.2
0.1
39.1
(9.8)
29.3
Diluted EPS - continuing operations
0.53
0.08
−
0.01
0.17
−
0.79
(0.20)
0.60
Non-GAAP Reconciliations - 4Q2013
Amounts may not add due to rounding. See page 37 for notes.

36
GAAP
Basis
Gains and Losses
on Acquisitions and
Dispositions (a)
on Acquisitions and
Dispositions (a)
Expenses Related to
Currency Devaluation
in Venezuela
Currency Devaluation
in Venezuela
(b)
Employee
Benefit
Settlement
Losses (c)
Benefit
Settlement
Losses (c)
U.S.
Retirement
Plans (d)
Retirement
Plans (d)
Adjust
Income Tax
Rate (e)
Income Tax
Rate (e)
Non-GAAP
Basis
Basis
Adjust Venezuela
to 50 Bolivars to
the U.S. Dollar (f)
to 50 Bolivars to
the U.S. Dollar (f)
Adjusted Non
-GAAP Basis
(g)
-GAAP Basis
(g)
Full Year 2013
Revenues:
Latin America
$
1,720.7
−
−
−
−
−
1,720.7
(391.5)
1,329.2
EMEA
1,178.3
−
−
−
−
−
1,178.3
−
1,178.3
North America
898.4
−
−
−
−
−
898.4
−
898.4
Asia Pacific
144.8
−
−
−
−
−
144.8
−
144.8
Revenues
$
3,942.2
−
−
−
−
−
3,942.2
(391.5)
3,550.7
Operating profit:
Latin America
$
149.9
2.2
14.6
2.5
−
−
169.2
(68.9)
100.3
EMEA
81.5
−
−
−
−
−
81.5
−
81.5
North America
4.7
−
−
−
11.6
−
16.3
−
16.3
Asia Pacific
16.7
0.9
−
−
−
−
17.6
−
17.6
Segment operating profit
252.8
3.1
14.6
2.5
11.6
−
284.6
(68.9)
215.7
Non-segment
(81.1)
(2.8)
−
−
41.3
−
(42.6)
−
(42.6)
Operating profit
$
171.7
0.3
14.6
2.5
52.9
−
242.0
(68.9)
173.1
Amounts attributable to Brink’s:
Income from continuing operations
$
71.9
2.0
9.1
1.8
31.8
−
116.6
(36.1)
80.5
Diluted EPS - continuing operations
1.47
0.04
0.18
0.04
0.65
−
2.38
(0.74)
1.64
Non-GAAP Reconciliations - Full Year 2013
Amounts may not add due to rounding. See page 37 for notes.

37
Non-GAAP Reconciliations - 2013 Notes
(a) To eliminate
• a $1.1 million adjustment in the first quarter of 2013 to the amount of gain recognized on a 2010 business acquisition in Mexico as a result of a
favorable adjustment to the purchase price received in the first quarter of 2013.
favorable adjustment to the purchase price received in the first quarter of 2013.
• $1.7 million of adjustments in the third and fourth quarters of 2013 primarily related to the January 2013 acquisition of Rede Trel in Brazil.
• $3.1 million in adjustments in the fourth quarter of 2013 related to the increase in a loss contingency assumed in the 2010 Mexico acquisition and
the impairment of an intangible asset acquired in the 2009 India acquisition.
the impairment of an intangible asset acquired in the 2009 India acquisition.
• a $2.6 million tax adjustment related to the Belgium disposition.
(b) To eliminate the effects of the February 2013 currency devaluation in Venezuela in which the official exchange rate in Venezuela declined 16% from 5.3
to 6.3 bolivars to the U.S. dollar. Expenses eliminated from non-GAAP results include first quarter currency exchange losses totaling $13.4 million related
to remeasured net monetary assets as well as expenses related to nonmonetary assets ($0.5 million in the first quarter, $0.2 million in the second
quarter, $0.2 million in the third quarter and $0.3 million in the fourth quarter). Nonmonetary assets were not remeasured to a lower basis when the
currency devalued. Instead, under highly inflationary accounting rules, these assets retained their higher historical bases, which excess is recognized in
earnings as the asset is consumed.
(c) To eliminate employee benefit settlement losses in Mexico.
(d) To eliminate expenses related to U.S. retirement plans.
(e) To adjust effective income tax rate in the interim period to be equal to the full-year non-GAAP effective income tax rate. The full-year non-GAAP
effective tax rate for 2013 is 33.1%.
(f) Effective March 24, 2014, Brink’s began remeasuring its Venezuelan operating results using currency exchange rates reported under a newly established
currency exchange process in Venezuela (the “SICAD II process”). This adjustment reflects a hypothetical remeasurement of Brink’s Venezuela’s 2013
revenue and operating results using a rate of 50 bolivars to the U.S. dollar, which approximates the rate observed in the new SICAD II currency exchange
process in March 2014. Losses that would have been recognized in 2013 had Brink’s used a rate of 50 bolivars to the U.S. dollar to remeasure its net
monetary assets have been excluded from this adjustment and the Adjusted Non-GAAP results.
(g) Non-GAAP results adjusted for Venezuelan results at 50 bolivars per U.S. dollar.
38
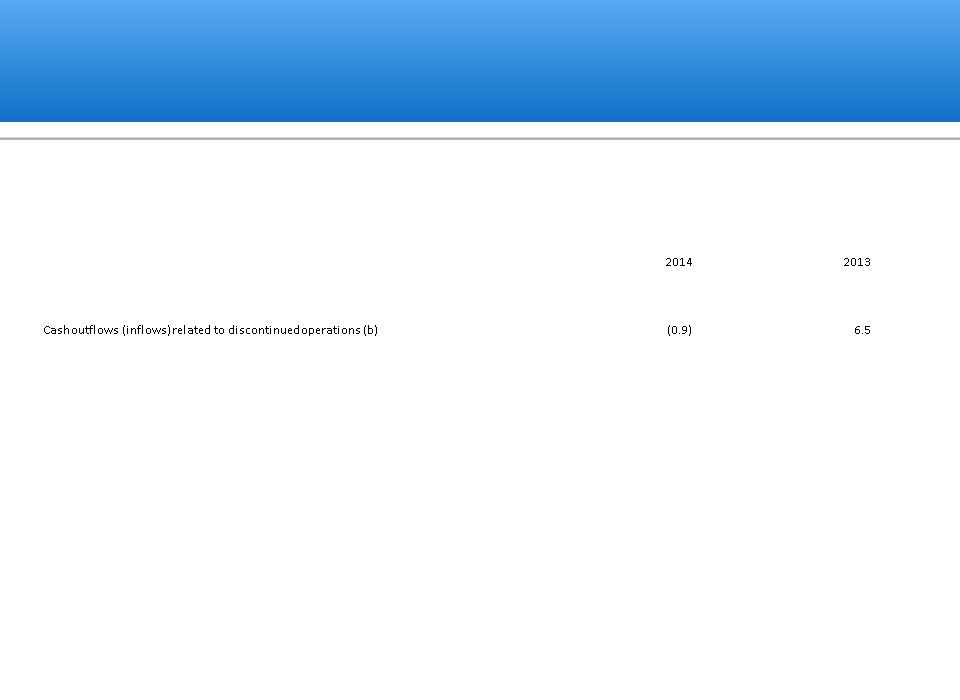
Non-GAAP Reconciliations - Cash Flows
|
NON-GAAP CASH FLOWS FROM OPERATING ACTIVITIES - RECONCILED TO AMOUNTS REPORTED UNDER U.S. GAAP
|
||||||
|
|
|
|||||
|
|
First Half
|
|||||
|
|
|
|
|
|||
|
Cash flows from operating activities - GAAP
|
$
|
47.6
|
|
$
|
41.1
|
|
|
Decrease (increase) in certain customer obligations (a)
|
|
(8.1)
|
|
|
(14.2)
|
|
|
|
(0.9)
|
|
|
|||
|
|
|
|
|
|
|
|
|
|
Cash flows from operating activities - Non-GAAP
|
$
|
38.6
|
|
$
|
33.4
|
(a) To eliminate the change in the balance of customer obligations related to cash received and processed in certain of our Cash Management Services
operations. The title to this cash transfers to us for a short period of time. The cash is generally credited to customers’ accounts the following day and
we do not consider it as available for general corporate purposes in the management of our liquidity and capital resources.
(b) To eliminate cash flows related to our discontinued operations.
Non-GAAP cash flows from operating activities is a supplemental financial measure that is not required by, or presented in accordance with GAAP. The purpose
of the non-GAAP cash flows from operating activities is to report financial information excluding the impact of cash received and processed in certain of our
secure Cash Management Service operations and without cash flows from discontinued operations. Brink’s believes these measures are helpful in assessing
cash flows from operations, enable period-to-period comparability and are useful in predicting future operating cash flows. Non-GAAP cash flows from
operating activities should not be considered as an alternative to cash flows from operating activities determined in accordance with GAAP and should be read
in conjunction with our consolidated statements of cash flows.

39
Non-GAAP Reconciliations - Projected Financial Information
|
|
|
|
|
||||
|
|
|
|
|||||
|
|
|
|
|||||
|
GAAP
|
0.6%
|
|
3-4%
|
|
4-5%
|
|
7%
|
(a) U.S. GAAP margins for Mexico are not provided for 2010 and 2014 - 2016 because we are unable to quantify settlement losses during these periods without unreasonable
efforts.
Consolidated Non-GAAP targets for 2016 (including segment margin, segment operating profit, and EPS target) are not reconciled to GAAP counterparts because we are unable
to quantify certain amounts that would be required to be included in the GAAP measure without unreasonable effort.
to quantify certain amounts that would be required to be included in the GAAP measure without unreasonable effort.
|
U.S. Profit Improvement Outlook
|
||||||||||||
|
|
|
Branch Margin
|
|
SG&A
|
|
Operating Profit
|
||||||
|
|
|
2013
|
|
2016
|
|
2013
|
|
2016
|
|
2013
|
|
2016
|
|
Non-GAAP
|
|
$ 112
|
|
134
|
|
99
|
|
87
|
|
13
|
|
47
|
|
Pension expense
|
|
(11)
|
|
1
|
|
1
|
|
0
|
|
(12)
|
|
1
|
|
GAAP
|
|
$ 101
|
|
135
|
|
100
|
|
87
|
|
1
|
|
48
|
|
Mexico Segment Margin History and Outlook
|
|||||||||||||
|
|
2010
|
|
2011
|
|
2012
|
|
2013
|
|
2014
|
|
2015
|
|
2016
|
|
Non-GAAP
|
0.0%
|
|
2.6%
|
|
4.0%
|
|
5.0%
|
|
~4%
|
|
6-8%
|
|
10.0%
|
|
Settlement losses
|
(a)
|
|
(0.5)%
|
|
(0.8)%
|
|
(0.6)%
|
|
(a)
|
|
(a)
|
|
(a)
|
|
Acquisition adjustments
|
n/a
|
|
0%
|
|
0.5%
|
|
(0.5)%
|
|
(a)
|
|
n/a
|
|
n/a
|
|
GAAP
|
(a)%
|
|
2.1%
|
|
3.7%
|
|
4.1%
|
|
(a)
|
|
(a)
|
|
(a)
|
|
Mexico Profit Improvement Outlook
|
||||||||||||
|
|
|
Branch Margin
|
|
SG&A
|
|
Operating Profit
|
||||||
|
|
|
2013
|
|
2016
|
|
2013
|
|
2016
|
|
2013
|
|
2016
|
|
Non-GAAP
|
|
$ 65
|
|
86
|
|
42
|
|
38
|
|
23
|
|
48
|
|
Settlement losses
|
|
(2)
|
|
(a)
|
|
0
|
|
(a)
|
|
(2)
|
|
(a)
|
|
Acquisition adjustment
|
|
0
|
|
n/a
|
|
2
|
|
n/a
|
|
(2)
|
|
n/a
|
|
GAAP
|
|
$ 63
|
|
(a)
|
|
44
|
|
(a)
|
|
18
|
|
(a)
|
Amounts may not add due to rounding

40
|
NET DEBT - RECONCILED TO U.S. GAAP
|
June 30,
|
|
December 31,
|
|||||
|
|
2014
|
|
2013
|
|||||
|
Debt:
|
|
|
|
|
||||
|
|
|
|
||||||
|
|
Long-term debt
|
|
|
449.0
|
|
355.1
|
||
|
|
|
|
|
|
||||
|
Less:
|
|
|
|
|
|
|
||
|
Cash and cash equivalents
|
|
|
224.7
|
|
255.5
|
|||
|
Amounts held by Cash Management Services operations (a)
|
|
|
(39.2)
|
|
(31.3)
|
|||
|
|
|
|
Cash and cash equivalents available for general corporate purposes
|
|
|
185.5
|
|
224.2
|
|
|
|
|
|
|
|
|
|
|
|
|
|
Net Debt
|
|
$
|
342.6
|
|
211.8
|
|
(a) Title to cash received and processed in certain of our secure Cash Management Services operations transfers to us for a short period of time. The
cash is generally credited to customers’ accounts the following day and we do not consider it as available for general corporate purposes in the
management of our liquidity and capital resources and in our computation of Net Debt.
management of our liquidity and capital resources and in our computation of Net Debt.
Net Debt is a supplemental Non-GAAP financial measure that is not required by, or presented in accordance with GAAP. We use Net Debt as a measure of
our financial leverage. We believe that investors also may find Net Debt to be helpful in evaluating our financial leverage. Net Debt should not be considered
our financial leverage. We believe that investors also may find Net Debt to be helpful in evaluating our financial leverage. Net Debt should not be considered
as an alternative to Debt determined in accordance with GAAP and should be reviewed in conjunction with our consolidated balance sheets. Set forth above
is a reconciliation of Net Debt, a Non-GAAP financial measure, to Debt, which is the most directly comparable financial measure calculated and reported in
accordance with GAAP. Net Debt excluding cash and debt in Venezuelan operations was $361 million at June 30, 2014, and $306 million at December 31,
2013.
Non-GAAP Reconciliations - Net Debt