Attached files
| file | filename |
|---|---|
| 8-K - 8-K - ROSETTA STONE INC | a14-15714_18k.htm |
Exhibit 99.2
|
|
Wall Street Analyst Forum Institutional Investor Conference New York, NY June 19, 2014 |

|
|
Certain information contained in this presentation and certain comments today constitute forward-looking statements for purposes of the safe harbor provisions of The Private Securities Litigation Reform Act of 1995. These forward-looking statements reflect the Company's current views with respect to future events and are subject to certain risks, uncertainties, and assumptions. A number of important factors could cause actual results or events to differ materially from those indicated by such forward-looking statements, including demand for our language learning solutions; the advantages of our products, services, technology, brand and business model as compared to others; our strategic focus; our ability to maintain effective internal controls or to remediate material weaknesses; our cash needs and expectations regarding cash flow from operations; our product development plans; our international operations and growth plans; our plans regarding our kiosks and retail relationships; our plans regarding our Enterprise and Education business; the impact of any revisions to our pricing strategy; our ability to manage and grow our business and execute our business strategy; our financial performance; our actions to realign our cost structure and revitalizing our go-to-market strategy; our plans to transition our distribution to more online in the consumer business; our ability to expand our product offerings beyond our core adult-focused language learning solutions, including the launch of Kids reading and brain fitness; our ability to introduce successfully Lexia’s Core5 reading product to the consumer market; our ability to expand our offerings to more devices and apps, our ability to identify and successfully close and integrate additional acquisition targets; our plans with respect to and our ability to successfully integrate Lexia, Livemocha, Tell Me More and Vivity into our business; adverse trends in general economic conditions and the other factors including the “Risk Factors” more fully described in the Company's filings with the U.S. Securities and Exchange Commission (SEC), including the Company’s annual report on Form 10-K for the year period ended December 31, 2013, which is on file with the SEC. We encourage you to review those factors before making any investment decision. You should not place undue reliance on forward-looking statements because they involve factors that are, in some cases, beyond our control and that could materially affect actual results, levels of activity, performance, or achievements. Today’s presentation and discussion also contains references to non-GAAP financial measures. The full definition and reconciliation of those measures is available in our Form 8-K filed with the SEC on May 7, 2014. Management uses these non-GAAP measures to compare the Company's performance to that of prior periods for trend analyses, for purposes of determining executive incentive compensation, and for budgeting and planning purposes. Management believes that the use of these non-GAAP financial measures provides an additional tool for investors to use in evaluating ongoing operating results and trends. Our definitions of non-GAAP measures may not be comparable to the definitions used by other companies, and we encourage you to review and understand all our financial reporting before making any investment decision. Safe Harbor 2 Safe Harbor |
|
|
Strategic Focus |
|
|
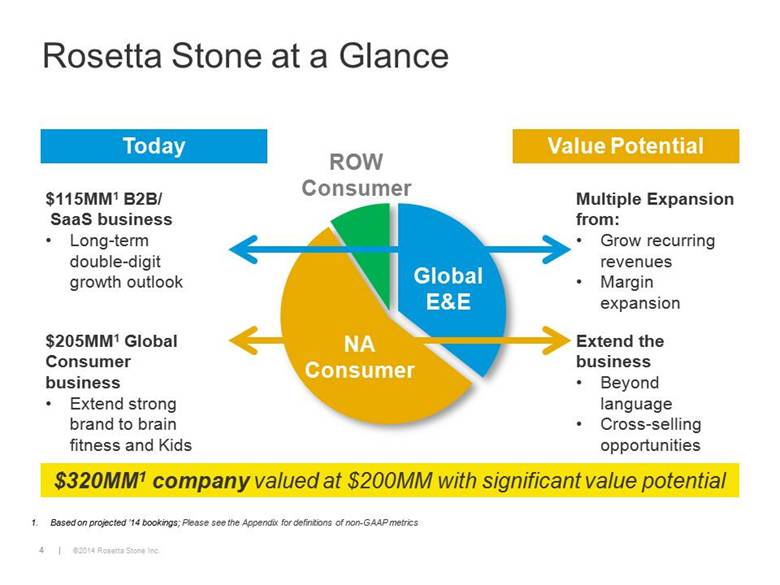
Rosetta Stone at a Glance Today Value Potential Global E&E NA Consumer ROW Consumer $115MM1 B2B/ SaaS business Long-term double-digit growth outlook $205MM1 Global Consumer business Extend strong brand to brain fitness and Kids Multiple Expansion from: Grow recurring revenues Margin expansion Extend the business Beyond language Cross-selling opportunities $320MM1 company valued at $200MM with significant value potential Based on projected ’14 bookings; Please see the Appendix for definitions of non-GAAP metrics |
|
|
Executing Transformation Over Last 2 Years From: To: Evidence: Language only Learning Company Expansion into Literacy & Brain Fitness Mostly Consumer Overweight B2B B2B now 36% vs.<25% in '12 One-time sale Recurring / Lifetime value B2B now 100% SaaS Mostly physical Digital & mobile ecosystems 42% of Consumer now delivered digitally vs 5% in 2012 Build In-house Buy, Rent, build 4 Acquisitions |
|
|
M&A Accelerating Strategy & Building Value Acquisition Purchase Price Valuation Key Benefits (April 2013) $8.5MM 0.4x Invested Capital Technology platform powering new product ~$6MM cross-sold in ’13 (August 2013) $22.5MM 1.3x bookings1 35% PF bookings1 growth in 1Q14 Core 5 product launch Migrating to subscription (January 2014) $28MM 1.2x bookings1 Deeper content Leverages salesforce China presence (January 2014) $12MM 3.0x bookings1 9MM downloads High RS learner interest Started cross-selling Please see the Appendix for definitions of non-GAAP metrics. |
|
|
Expanded Asset Portfolio Provides Increased Market Opportunities Brand Distribution Platform Leading brand #1 awareness in U.S. Retail / etail network 49 partners and >5K points of sale Online community 2MM new signups since April ’13 Speech technology For real-time, on-device use Live coaching 35,000 seats filled per month; two-way Kids offerings 500K app downloads Note: selected examples only Personalized learning Developing capabilities for adaptive curriculums App store presence 3.4MM RS downloads K-12 Literacy offerings >1M students using in U.S. Brain Fitness offerings 9MM downloads Product platform Rapidly deliver our product vision across multiple product lines Advanced course Assessment, CEFR alignment, level depth B2B salesforce 150 professionals RS.com / FB page 1.5M unique web visitors per month; 2.3MM FB total fans Brand |
|
|
Business Segment Strategies Global E&E NA Consumer ROW Consumer English & Literacy $115MM1 in ’14 Lightly Tailored $30MM1 in ’14 Natural Adjacencies $170MM1 in ’14 Complete Language Learning Suite Expanded Sales Force Penetrate Literacy Market Stabilize Language Business by Growing User Base Leverage Marketing Platform and Cross-sell a Portfolio of Learning Products Right-size operations Lightly tailor solutions to needs of targeted segments; Web and Third-party Partner Models Based on projected ’14 bookings; Please see the Appendix for definitions of non-GAAP metrics |
|
|
E&E Key Points |
|
|
NA Consumer Key Points |
|
|
Multiple Value Creation Opportunities Material Value Creation Potential Segment Drivers Multiple Scenario ($MM) Low High Global E&E Bookings1 growth $115MM @ 2-4x bookings $230 $460 NA Consumer Stable bookings, Kids Literacy success $180MM @ ½-1x bookings $90 $180 Fit Brains Rapid growth $5MM @ 8-12x bookings $40 $60 Cash $56 $56 Value potential $416 $756 ~$20 / share ~$35 / share Based on projected ’14 bookings; Please see the Appendix for definitions of non-GAAP metrics |
|
|
Financials |

|
|
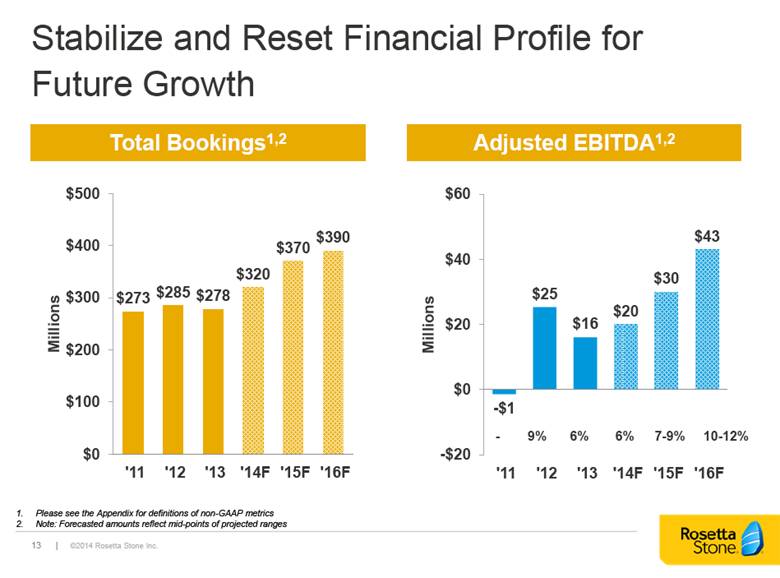
Stabilize and Reset Financial Profile for Future Growth Total Bookings1,2 Adjusted EBITDA1,2 Please see the Appendix for definitions of non-GAAP metrics Note: Forecasted amounts reflect mid-points of projected ranges - 9% 6% 6% 7-9% 10-12% |
|
|
2014 Consolidated Financial Outlook Please see the Appendix for definitions of non-GAAP metrics; Bookings growth comment reflects run-rate growth assuming that acquisitions were included in Rosetta Stone’s 2013 bookings FY 2014 Guidance1,2 Amount/Range Commentary Consolidated Bookings $315MM to $325MM Mid-single digit % growth Adjusted EBITDA $18MM to $22MM ~5% margin Shares outstanding ~22MM Capital Expenditures $10MM to $14MM Increase due to Acquisitions & Integration Long-term effective tax rate 39% |
|
|
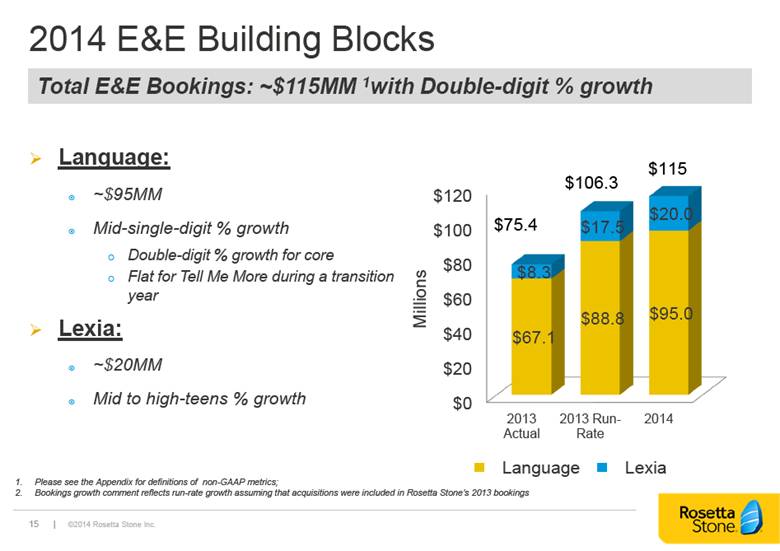
Language: ~$95MM Mid-single-digit % growth Double-digit % growth for core Flat for Tell Me More during a transition year Lexia: ~$20MM Mid to high-teens % growth 2014 E&E Building Blocks Total E&E Bookings: ~$115MM 1with Double-digit % growth Please see the Appendix for definitions of non-GAAP metrics; Bookings growth comment reflects run-rate growth assuming that acquisitions were included in Rosetta Stone’s 2013 bookings |
|
|
Core N.A. Consumer: $165-$170MM Flat to down New Initiatives (N.A.): $10MM Contribution from TMM, Fit Brains and Kids’ Initiatives ROW Consumer: $25MM to $30MM Flat to down -10% due to Asian downsizing Consumer Building Blocks Total Consumer Bookings1: $200-210MM with low single-digit % growth $200-210 $198.7 Please see the Appendix for definitions of non-GAAP metrics |
|
|
Low-end of bookings ranges in 2015 and 2016 reflect organic achievement High-end of bookings ranges in 2015 and 2016 reflect organic plus impact of future acquisitions Long Term Financial Outlook Bookings1 Adjusted EBITDA Margin2 $278 6% $315-$325 5-6% 2013 2014 $380-$400 10-12% 2015 $360-$380 7-9% 2016 Please see the Appendix for definitions of non-GAAP metrics Adjusted EBITDA as a percentage of bookings |
|
|
1Q14 Results In-line with 2014 Plan |
|
|
Appendix |
|
|
Bookings represent executed sales contracts received by the Company that are either recorded immediately as revenue or as deferred revenue. Adjusted EBITDA is GAAP net income/(loss) plus interest income and expense, income tax benefit and expense, depreciation, amortization and stock-based compensation expense, goodwill impairment plus the change in deferred revenue (excluding acquired deferred revenue) less the change in deferred commissions. In addition, Adjusted EBITDA excludes any items related to the litigation with Google Inc., restructuring and related wind down costs, severance costs and transaction and other costs associated with mergers and acquisitions as well as all adjustments related to recording the non-cash tax valuation allowance for deferred tax assets. Adjusted EBITDA for prior periods has been revised to conform to current definition. Free cash flow is cash flow from operations less cash used in purchases of property and equipment. Non-GAAP Metric Definitions |