Attached files
| file | filename |
|---|---|
| 8-K - FORM 8-K - CASCADE BANCORP | v381060_8k.htm |

Annual Meeting Presentation Nasdaq ticker: CACB June 2014

CAUTIONARY STATEMENT REGARDING FORWARD - LOOKING STATEMENTS This document contains forward - looking statements about Cascade Bancorp’s plans and anticipated results of operations and financ ial condition. These statements include, but are not limited to, our plans, objectives, expectations, and intentions and are not statements of historical fact. When used in this rep ort, the word "expects," "believes," "anticipates,” “could,” “may,” “will,” “should,” “plan,” “predicts,” “projections,” “continue” and other similar expressions constitute forward - looking statements, as do any other statements that expressly or implicitly predict future events, results or performance, and such statements are made pursuant to the safe harbor provisions of the Private Securities Litigation Reform Act of 1995. Certain risks and uncertainties and Cascade Bancorp’s success in managing such risks and uncertainties could cause actual res ult s to differ materially from those projected, including among others, the following factors: local and national economic conditions could be less favorable than expected or could ha ve a more direct and pronounced effect on us than expected and adversely affect our results of operations and financial condition; the local housing/real estate market could c ont inue to decline for a longer period than we anticipate; the risks presented by a continued economic recession, which could continue to adversely affect credit quality, collateral va lue s, including real estate collateral and OREO properties, investment values, liquidity and loan originations, reserves for loan losses and charge offs of loans and loan portfolio deli nqu ency rates and may be exacerbated by our concentration of operations in the States of Oregon and Idaho generally, and Central, Southern and Northwest Oregon, as well as the greater Bo ise /Treasure Valley, Idaho area, specifically; interest rate changes could significantly reduce net interest income and negatively affect funding sources; competition among financial ins tit utions could increase significantly; competition or changes in interest rates could negatively affect net interest margin, as could other factors listed from time to time in Cas cad e Bancorp’s Securities and Exchange Commission (“SEC”) reports; the reputation of the financial services industry could further deteriorate, which could adversely affect our abilit y t o access markets for funding and to acquire and retain customers; and existing regulatory requirements, changes in regulatory requirements and legislation (including without limita tio n, the Dodd - Frank Wall Street Reform and Consumer Protection Act) and our inability to meet those requirements, including capital requirements and increases in our deposit ins ura nce premium, could adversely affect the businesses in which we are engaged, our results of operations and financial condition. Such forward - looking statements also include, but are n ot limited to, statements about the benefits of the business combination transaction involving Cascade Bancorp and Home Federal Bancorp, Inc., including future financial and ope rat ing results, the combined company’s plans, objectives, expectations and intentions and other statements that are not historical facts. These forward - looking statements are subject to numerous assumptions, risks and uncertainties which change over time. Forward - looking statements speak only as of the date they are made and we assume no duty t o update forward - looking statements. Important factors that could cause actual results to differ materially from those indicated by such forward - looking statements include ris ks and uncertainties relating to: (i) the risk that the businesses will not be integrated successfully; (ii) the risk that the cost savings and any other synergies from the transact ion may not be fully realized or may take longer to realize than expected; (iii) disruption from the transaction making it more difficult to maintain relationships with customers, employees or vendors; (iv) the diversion of management time on post - merger and integration - related issues; (v) general worldwide economic conditions and related uncertainties; (vi) liquidity risk affecting Cascade’s ability to meet its obligations when they come due; (vii) excessive loan losses; (viii) the effect of changes in governmental regulations; and (ix) other factors we discuss or refer to in the “Risk Factors” section of Cascade’s most recent Annual Report on Form 10 - K filed with the SEC on March 31, 2014. These risks as well as other additional risks and u ncertainties are identified and discussed in Cascade’s reports filed with the SEC and available at the SEC’s website at www.sec.gov. These forward - looking statements speak only as of the date of this document. Cascade Bancorp undertakes no obligation to publish revised forward - looking statements to reflect the occurrence of unanticipated events or circumstances a fter the date hereof. Readers should carefully review all disclosures filed by Cascade Bancorp from time to time with the SEC. 2

Includes Cascade and HOME network post integration (1) Proforma 12/31/14 from SEC form S - 4 previously filed (2) Ranking and Percentage Market share SNL financial CASCADE BANCORP OVERVIEW 3 Cascade Bancorp Proforma (1) • Headquart ers: • Assets: • Deposits: • Loans: • Footprint: • Ticker: • Market Capitalization: • Shares Outstanding • Float: • Bend, OR • $2.3 billion • $2.0 billion • $1.4 billion • 40 branches / 2 states • CACB • $319.4 mm • 71.6 mm shares • 30.2 mm shares Deposit Franchise (2) Metro Area Boise, ID Bend, OR Eugene, OR Medford, OR Grants Pass, OR Prineville, OR Klamath Falls, OR Portland # Offices 15 10 4 3 2 2 1 1 Deposit Share 7.3% 27.6% 2.9% 2.8% 10.3% 35.9% 1.8% 0.3% Rank 5 1 11 11 4 1 7 25

INVESTMENT HIGHLIGHTS • Experienced and outcome - driven management team and Board • Previous credit challenges identified and resolved • Top market share in fast - growing markets • #1 deposit share in Bend MSA • #1 Community Bank in Boise MSA (1) • Region leading core deposit franchise • 50% of combined deposits in checking accounts • 0.11% cost of funds (CACB) • Acquisition of HOME completed: • Springboard toward a goal of a $5B community bank in the Pacific Northwest • Significant opportunities for cost and revenue synergies • Goal to deliver region leading returns and profitability (1) source: SNL banks less than 10Bill in deposits 4

Terry Zink President, Chief Executive Officer and Director Greg Newton Executive Vice President, Chief Financial Officer Chip Reeves Executive Vice President, Chief Banking Officer Peggy Biss Executive Vice President, Chief Administrative Officer Dan Lee Executive Vice President, Chief Credit Officer • President and Chief Executive Officer since January 1, 2012 • Most recently served as President of Fifth Third Bank • Managed the bank’s strategic growth throughout 13 states, which included overseeing operations of approximately 22,000 employees, 1,300 branches and more than $110B in assets • Prior to joining Fifth Third Bank, served nearly 17 years with Wells Fargo & Company in several senior management positions in California and Nebraska • Joined Cascade in 1997 • Served in key treasury and controllership roles with major Seattle banks after starting early Federal Reserve experience • Currently serves as investor relations contact • Active in the community and with the Oregon Bankers Association • Joined Cascade in August 2012 • Served as President of Fifth Third Bank’s Chicago region, overseeing all lines of business as part of this $ 115B Midwest regional bank. • Over 20 years in banking; mainly commercial lending and branch delivery • As SVP, headed CRE Special Assets at Fifth Third • Holds a BA from Miami University in Oxford, Ohio • Actively involved with community and industry leadership programs, including serving on the Boards for several organizations • Joined Cascade in 1978 • Chief Human Resource Officer until 2014 • Established Bank’s Human Resource Department in 1988 • Holds Senior Professional in Human Resources designation • Pacific Coast Banking School, Graduate School of Banking • Served in operational, branch management and lending roles • Active with Oregon Bankers Association and Northwest Human Resource Association • Actively involved with community and industry organizations, including Board and Board Chair positions • Joined Cascade in April 2012 • Diverse 30 years of banking including Chief Credit Officer and Market President leadership roles in the Midwest • Included large regional and community banks including multi - state responsibility as a regional Chief Credit Officer at a $150B bank • Holds a BS and MBA from Indiana University and attended Stonier Graduate School of Banking. • Has been actively involved with his community and is a board member of the ABA Government Relations Committee 5 MANAGEMENT TEAM

DRAMATIC TURNAROUND 2008 ‘ Great Recession’ + ADC concentration risk leads to C&D order 2008 - 2010 Bank suffers severe credit losses and requires recapitalization 2011 $177M recapitalization from private equity and one major investor • $68 million gain on TRUPS payoff • Bulk sale of $110M NPA’s 2012: New leadership (CEO , CCO, CBO) key priorities: reduce remaining classified loans, return to profitability and clear regulatory restrictions • Implemented new credit culture, policies and procedures • Returned to profitable operations • Credit quality continued improvement - $92 million or 35% reduction in special mention and substandard year - over - year 2013: All regulatory restrictions removed; engaged 2 M&A transactions; loan & deposit growth restarted: • 16% YOY loan growth; 8.5% YOY deposit growth • Recapture of ~ $51M of DTA • AWB small in - market branches acquired/converted Q4 2013 • HOME transaction definitive Q4 2013 – closed & customer conversio n May 2014 6

Non - Performing Assets ($000s) IMPROVING CREDIT METRICS (Resolutions of NPA’s & Criticized and Classified Loans) Classified Assets to Tier 1 + ALLL ($000s) Classified Assets Total Classified Assets % of Tier 1+ALLL NPAs % Of Total Bank Assets 7 2.3% 2.0% 1.7% 1.5% 1.9% 1.6% 0.84% 0.82% 0.69% 0.5% $- $10,000 $20,000 $30,000 $40,000 Q4 Q1 Q2 Q3 Q4 Q1 Q2 Q3 Q4 Q1 2011 2012 2013 2014 0.0% 0.5% 1.0% 1.5% 2.0% 2.5% 107.5% 106.4% 80.1% 74.6% 53.4% 37.5% 31.9% 26.7% 25.1% $- $25,000 $50,000 $75,000 $100,000 $125,000 $150,000 $175,000 $200,000 Q4 Q1 Q2 Q3 Q4 Q1 Q2 Q3 Q4 Q1 2011 2012 2013 2014 0.0% 25.0% 50.0% 75.0% 100.0% 125.0%
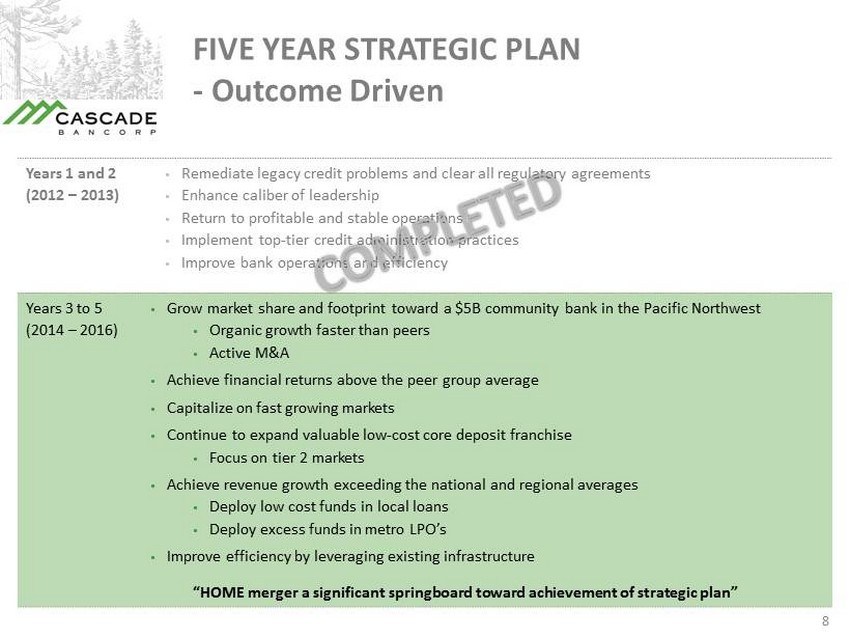
FIVE YEAR STRATEGIC PLAN - Outcome Driven 8 Years 1 and 2 (2012 – 2013) • Remediate legacy credit problems and clear all regulatory agreements • Enhance caliber of leadership • Return to profitable and stable operations • Implement top - tier credit administration practices • Improve bank operations and efficiency Years 3 to 5 (2014 – 2016) • Grow market share and footprint toward a $5B community bank in the Pacific Northwest • Organic growth faster than peers • Active M&A • Achieve financial returns above the peer group average • Capitalize on fast growing markets • Continue to expand valuable low - cost core deposit franchise • Focus on tier 2 markets • Achieve revenue growth exceeding the national and regional averages • Deploy low cost funds in local loans • Deploy excess funds in metro LPO’s • Improve efficiency by leveraging existing infrastructure “HOME merger a significant springboard toward achievement of strategic plan”

source: SNL financial (1) Community bank defined as having less than $10B in assets Improves Scale, Earnings and Efficiency • Adds scale and market share in growth markets • Greater than 70% increase in assets • Solidifies #1 market share in Bend • #1 Community bank share in Boise ( 1) - (# 5 share overall) • Entry to Eugene market • Doubles deposit market share in Boise and Southern Oregon • Leverages low - cost core deposits • Combined deposits are 50% checking • Cost Efficiencies on Target • Significant market overlap • Leverage infrastructure • Projected significant improvement in profitability • Cross - sale opportunities and advanced products and services for customers CACB Combination with Home Bancorp – A Transformative Combination - 9
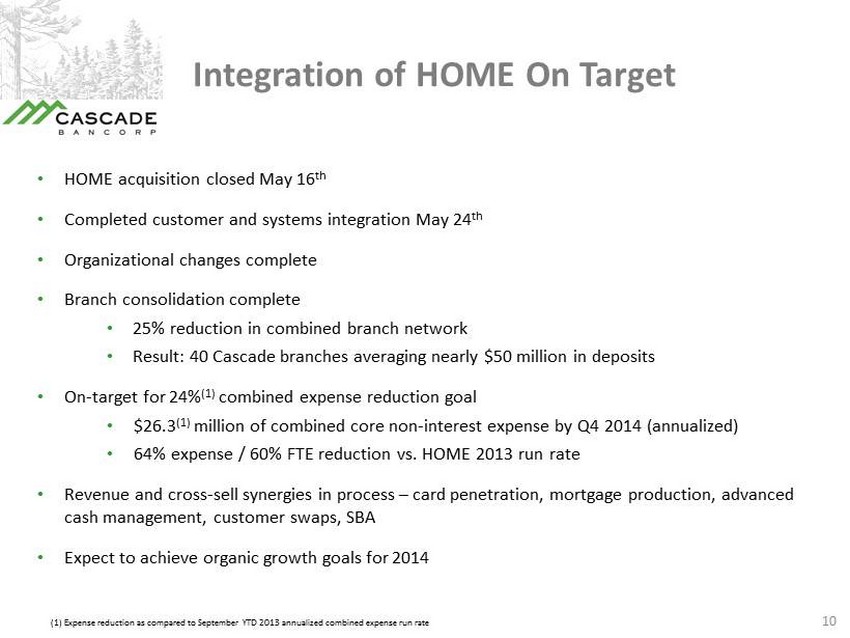
Integration of HOME On Target • HOME acquisition closed May 16 th • Completed customer and systems integration May 24 th • Organizational changes complete • Branch consolidation complete • 25% reduction in combined branch network • Result: 40 Cascade branches averaging nearly $50 million in deposits • On - target for 24% (1) combined expense reduction goal • $26.3 (1) million of combined core non - interest expense by Q4 2014 (annualized) • 64% expense / 60% FTE reduction vs. HOME 2013 run rate • Revenue and cross - sell synergies in process – card penetration, mortgage production, advanced cash management, customer swaps, SBA • Expect to achieve organic growth goals for 2014 10 (1) Expense reduction as compared to September YTD 2013 annualized combined expense run rate

Demand, $206 , 10% NOW & Other Transaction, $96 , 5% MMDA & Savings, $1,375 , 70% Jumbo Time, $133 , 7% Retail Time, $150 , 8% DEPOSIT COMPOSITION Proforma Combined March 31, 2014 Source: SNL Financial (regulatory data as of 3/31/2014) * Note: Pro forma for Home Federal Bancorp, Inc. acquisition. Combine deposit composition excludes purchase accounting adjust men ts (1) Peer set includes all banks nationwide with assets between $1B and $5B (2) The above percentages reflect regulatory classification including reclassifies of certain DDA to MMA category 11 17.3% Non - Interest Bearing (GAAP) 0.22 % Cost of Deposits Ranks in top quartile of peer set (1) Total Deposits* – $2.0B Combined Low C ost C ore Deposits • CACB 8% YOY growth 2013 • Combined DDA at 50% (2) • 0.11% cost of funds (CACB) • 0.10% cost of funds HOME (excluding CD portfolio)
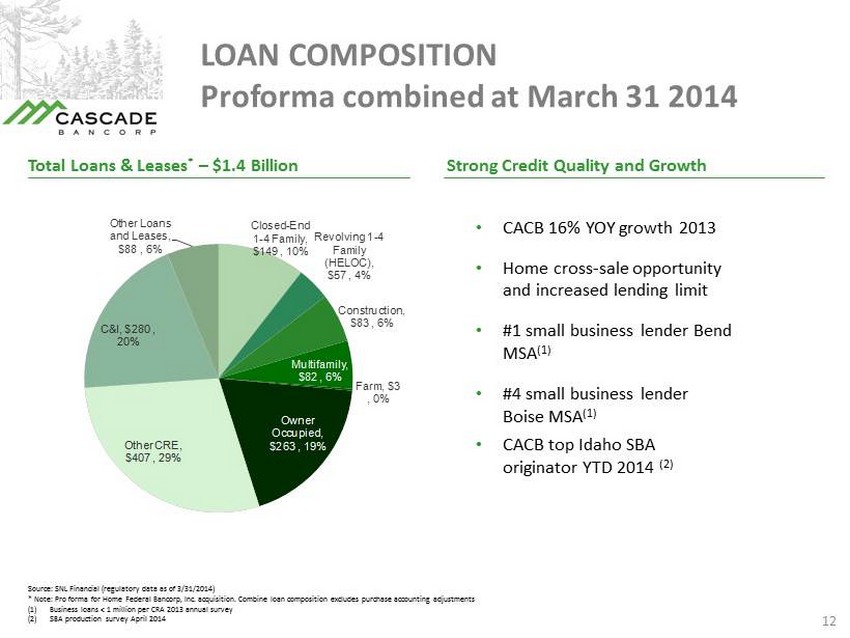
Closed - End 1 - 4 Family, $149 , 10% Revolving 1 - 4 Family (HELOC), $57 , 4% Construction, $83 , 6% Multifamily, $82 , 6% Farm, $3 , 0% Owner Occupied, $263 , 19% Other CRE, $407 , 29% C&I, $280 , 20% Other Loans and Leases, $88 , 6% LOAN COMPOSITION Proforma combined at March 31 2014 Source: SNL Financial (regulatory data as of 3/31/2014) * Note: Pro forma for Home Federal Bancorp, Inc. acquisition. Combine loan composition excludes purchase accounting adjustmen ts (1) Business loans < 1 million per CRA 2013 annual survey (2) SBA production survey April 2014 12 Total Loans & Leases * – $1.4 Billion Strong Credit Quality and Growth • CACB 16% YOY growth 2013 • Home cross - sale opportunity and increased lending limit • #1 small business lender Bend MSA (1) • #4 small business lender Boise MSA (1) • CACB top Idaho SBA originator YTD 2014 (2)

(1) source: SNL banks less than 10Bill in deposits (2) Map: Market Ranking and Percentage Market share shown in parentheses per SNL; Community bank defined as having less than $10B in assets Significant Scale in Fast - Growth Markets 13 • #1 community bank deposit share in both Boise and Bend MSA’s (1) • Represents 2/3 of total Cascade deposits (1) • Boise MSA in 92 nd percentile - rate of population growth in USA (2 ) • Bend MSA in 82 nd percentile - rate of population growth in USA (2)

Proforma Capital Ratios (1 ) Preliminary at December 31, 2013 14 (1) Source: CACB proforma per previously filed SEC form S - 4 as of December 31, 2013 with preliminary purchase accounting estimates — all numbers subject to revision at close Cascade Home Proforma 12/31/13 12/31/13 12/31/13 Common Equity to Assets 13.4% 16.9% 13.1% Tangible Equity to Tangible Assets 13.4% 16.7% 9.6%
INVESTMENT HIGHLIGHTS • Experienced and outcome - driven management team and Board • Previous credit challenges identified and resolved • Top market share in fast - growing markets • Region leading core deposit franchise • Acquisition of HOME completed – springboard toward a goal of a $5B community bank in the Pacific Northwest • Goal to deliver region leading returns and profitability 15

CASCADE – a Unique Franchise 16 Deposit Franchise Management Expertise Lending Focus • 8% Core deposit growth in 2013 • 11 bps cost of total deposits • 37% non - interest bearing deposits • 50% checking deposits • 92% core deposits (ex. Jumbo CD’s) • EVP’s average 25 years of combined expertise • 90% EVPs have had significant roles with national and/or super - regional banks • Strong credit quality - resolved legacy asset issues • 16% loan growth 2013 • Diversify with commercial focus – loan portfolio 43% C&I + OOCRE • Deploy LPOs in western metros • HOME cross - sell opportunities Market Footprint Scale & Efficiency IRR & Liquidity • Footprint serves fast growth markets in Northwest • Footprint population and household income projected to grow much faster than the national average • Footprint supports faster organic growth PLUS market share gain potential • Home deal adds scale and leverages Infrastructure for efficiency • May 2014 successful conversion demonstrates readiness for M&A • “among the very best conversions we have witnessed” per KPMG (project mgt) • Loyal core deposit base invaluable upon rate rise • Enables natural match funding of duration risk • Strong liquidity with ample deposits and saleable securities to fund future loan growth

Questions and Answers