Attached files
| file | filename |
|---|---|
| 8-K - 8-K - Ares Management Corp | a14-15079_18k.htm |
Exhibit 99.1

ARES MANAGEMENT, L.P. REPORTS FIRST QUARTER 2014 RESULTS
|
· |
Total assets under management1 increased 26.9% over the last twelve months to $77.0 billion as of March 31, 2014 |
|
|
|
|
· |
Fee earning assets under management increased 20.3% over the last twelve months to $57.2 billion as of March 31, 2014 |
|
|
|
|
· |
First quarter 2014 management fees of $139.9 million were up 28.7% compared to the same period in 2013; management fees represented 86% of total fee revenue in the first quarter 2014 |
|
|
|
|
· |
First quarter 2014 economic net income was $77.4 million; pro forma for the initial public offering, economic net income after tax was $72.5 million or $0.34 per unit |
|
|
|
|
· |
First quarter 2014 distributable earnings were $54.5 million; pro forma distributable earnings after tax were $0.22 per common unit |
|
|
|
|
· |
First quarter 2014 GAAP net income2 was $56.2 million |
LOS ANGELES-- Ares Management, L.P. (the “Company,” “Ares,” “we,” and “our”) (NYSE:ARES) today reported its financial results for the quarter ended March 31, 2014. As Ares was not a public company during the reporting period, the financial results reported herein reflect those of our operating subsidiaries, Ares Holdings Inc. (“AHI”) and Ares Investments LLC (“AI LLC”) and their consolidated subsidiaries (“Consolidated Company Entities”) prior to our initial public offering (“IPO”) and the related reorganization.
“We are excited about the next growth phase for Ares as a public company,” commented Tony Ressler, Chief Executive Officer of the general partner of Ares. “We believe our diversified platform is well positioned to benefit from the growth in global demand for alternative investments as investors seek higher returns without taking commensurate risk.”
During the twelve months ended March 31, 2014, Ares reported growth in both assets under management and fee earning assets under management of 26.9% and 20.3%, respectively, reaching $77.0 billion and $57.2 billion, respectively. This growth in AUM drove an increase in management fee revenue of 28.7% for the three months ended March 31, 2014 compared to the same period a year ago.
“Our first quarter results highlight the continued growth in our assets under management as our compelling investment track record and diverse fund offerings have enabled us to attract $17.0 billion of new investor capital over the last twelve months,” commented Michael Arougheti, President of the general partner of Ares. “In addition, we have made significant new investments to expand our platform as evidenced by the addition of approximately 160 professionals over the last twelve months, including 110 that joined Ares in conjunction with the expansion of our Real Estate platform. We believe these investments will help us continue our strong asset and management fee growth while further enhancing our diversity and scale.”
Economic net income for the three months ended March 31, 2014 was $77.4 million compared to $93.9 million for the first quarter of 2013. The decline was primarily related to lower unrealized net performance fees in Tradable Credit as the first quarter of 2013 marked an unusually robust period for market appreciation on credit assets. In addition, higher compensation and benefits and G&A costs were incurred in the first quarter of 2014 to support growth initiatives primarily as a result of the additional personnel employed from the acquisition of AREA Property Partners, L.P. (the “AREA Acquisition”), growth within the Direct Lending Group’s European platform and new non-investment professionals added in business development, information technology, legal and compliance. On a pro forma basis, taking into consideration changes related to our IPO, which closed on May 7, 2014, our first quarter economic net income, net of income taxes, was $72.5 million or $0.34 per unit.
1 In this press release we refer to certain non-GAAP financial measures, including assets under management, fee earning assets under management, economic net income and distributable earnings. The definitions and reconciliations of these measures to the most directly comparable GAAP measures, as well as an explanation of why we use these measures, are included in this press release.
2 GAAP net income excludes income attributable to non-controlling and redeemable interests in Consolidated Funds.
Distributable Earnings were $54.5 million for the three months ended March 31, 2014. For the three months ended March 31, 2014, a distribution of approximately 85% of pre-tax Distributable Earnings, totaling approximately $46.0 million, was made to our pre-IPO owners.
ARES MANAGEMENT, L.P.
FIRST QUARTER 2014 KEY PERFORMANCE METRICS
|
$ in thousands unless otherwise noted |
|
|
Three months ended |
| ||
|
|
|
|
2014 |
|
2013 |
|
|
|
|
|
|
|
|
|
|
Management Fees (including ARCC Part I Fees of $28.3 million and $23.8 million in 2014 and 2013, respectively) |
|
|
$139,861 |
|
$108,630 |
|
|
|
|
|
|
|
|
|
|
Other Fees (Admin. & Deal Income) |
|
|
6,865 |
|
4,660 |
|
|
Comp. & Benefits (1) |
|
|
(90,354) |
|
(64,915) |
|
|
G&A (2) |
|
|
(25,412) |
|
(13,327) |
|
|
Fee Related Earnings |
|
|
$30,960 |
|
$35,048 |
|
|
|
|
|
|
|
|
|
|
Net Performance Fees |
|
|
$22,705 |
|
$36,411 |
|
|
Net Investment Income |
|
|
23,740 |
|
22,410 |
|
|
Performance Related Earnings |
|
|
$46,445 |
|
$58,821 |
|
|
|
|
|
|
|
|
|
|
Economic Net Income |
|
|
$77,405 |
|
$93,869 |
|
|
Pro Forma Economic Net Income After Income Taxes (3) |
|
|
$72,468 |
|
|
|
|
Pro forma Economic Net Income After Income Taxes per Unit (3)(4) |
|
|
$0.34 |
|
|
|
|
Distributable Earnings |
|
|
$54,547 |
|
$62,807 |
|
|
Pro Forma Distributable Earnings After Income Taxes per Common Unit (3)(5) |
|
|
$0.22 |
|
|
|
|
|
|
|
|
|
|
|
|
Other Data |
|
|
|
|
|
|
|
Accrued Incentives (Gross) |
|
|
$490,883 |
|
$469,636 |
|
|
Accrued Incentives (Net) |
|
|
$186,868 |
|
$195,626 |
|
|
Management Fees as a Percentage of Total Fee Revenue (6) |
|
|
86.0% |
|
74.9% |
|
(1) Includes compensation and benefits of $27.7 million and $19.1 million for 2014 and 2013, respectively, that is not allocated to a business segment.
(2) Includes G&A of $13.5 million and $5.6 million for 2014 and 2013, respectively, that is not allocated to a business segment.
(3) Assumes our IPO and related reorganization had taken place on January 1, 2014.
(4) Pro forma units of 213,622,248 includes both common units and Ares Operating Group Units exchangeable into common units.
(5) Pro forma Distributable Earnings attributable to holders of common units over total common units outstanding of 80,667,664. See Exhibit H for more detail.
(6) Total fee revenue is calculated as management fees plus net performance fees.
Management Fee Revenue. Management fee revenue increased $31.2 million to $139.9 million for the three months ended March 31, 2014 compared to $108.6 million for the comparable period in 2013. The increase was driven by an increase in management fees primarily within (i) the Direct Lending Group as Ares Capital Corporation (“ARCC”) and certain European funds deployed additional capital and (ii) the Real Estate Group as the quarterly results reflected an increase of $13.7 million in management fees from the AREA Acquisition (closed during the third quarter of 2013).
Compensation and Benefits. Compensation and benefits expenses increased $25.4 million for the three months ended March 31, 2014 compared to the first quarter of 2013. The increase was partially attributable to $7.5 million from the addition of approximately 110 new personnel from the AREA Acquisition, $3.4 million from costs related to the externalization of the management of Ares’ European Direct Lending platform and $3.1 million attributable to new personnel in the Business Development Group.
General and Administrative Expenses. General and administrative expenses increased $12.1 million for the three months ended March 31, 2014 compared to the three months ended March 31, 2013. The increase was partially attributable to $4.1 million from expenses related to new office locations and other overhead costs associated with the AREA Acquisition and $0.6 million associated with other new office locations.
Fee Related Earnings. FRE was $31.0 million for the three months ended March 31, 2014 compared to $35.1 million for the three months ended March 31, 2013, representing a decrease of $4.1 million. The decrease in FRE was primarily due to a decrease in one-time deferred management fees of $1.1 million earned in the first quarter of 2013 and an increase in compensation and benefits and general, administrative and other expenses of $25.4 million and $12.1 million, respectively. This decrease was partially offset by an increase in management fees and administrative fees and other income of $32.4 and $2.2 million, respectively, in 2014.
Performance Related Earnings. PRE was $46.4 million for the three months ended March 31, 2014 compared to $58.8 million for the three months ended March 31, 2013. The decrease in PRE of $12.4 million was primarily attributable to the decreases in unrealized net performance fees of $10.2 million and realized net performance fees of $3.5 million. The decrease was partially offset by an increase in interest and other income of $1.2 million in 2014.
Economic Net Income. ENI was $77.4 million for the three months ended March 31, 2014 compared to $93.9 million for the three months ended March 31, 2013, representing a decrease of $16.5 million. The decrease in ENI was primarily driven by decreases in net performance fees of $13.7 million, and in FRE of $4.1 million, partially offset by an increase in net investment income of $1.3 million. Pro forma ENI after the provision for income taxes was $72.5 million, or $0.34 per unit, for the first quarter of 2014. The effective tax rate applied to pro forma ENI was 6.1% for the first three months of 2014.
Distributable Earnings. Total DE decreased by $8.3 million to $54.5 million for the three months ended March 31, 2014 compared to the three months ended March 31, 2013. The decrease was primarily due to a decrease of $3.5 million in net realized performance fees and an increase in compensation and benefits and general, administrative and other expenses of $25.4 million and $12.0 million, respectively. This decrease was partially offset by an increase in management fees and administrative fees and other income of $32.4 and $2.2 million, respectively, in 2014. Pro forma Distributable Earnings after applicable income taxes allocated to common unit holders were $0.22 per common unit for the first quarter of 2014.
Accrued Incentives. Net accrued performance fees as of March 31, 2014 decreased by $8.8 million, or 4.5%, to $186.9 million when compared to $195.6 million as of March 31, 2013. The decrease in net accrued incentives was primarily driven by the realization and payment of accrued incentive fees from our Private Equity fund ACOF II and ARCC.
Assets Under Management
|
|
|
AUM | ||
|
|
|
March 31, 2014 | ||
|
($ in millions) |
|
3 Months |
|
12 Months |
|
Beginning of Period AUM |
|
$74,005 |
|
$60,696 |
|
Acquisitions |
|
- |
|
6,091 |
|
Commitments (1) |
|
4,834 |
|
16,957 |
|
Capital Reduction (2) |
|
(1,394) |
|
(4,860) |
|
Distribution (3) |
|
(1,280) |
|
(5,955) |
|
Change in Fund Value (4) |
|
881 |
|
4,117 |
|
End of Period AUM |
|
$77,046 |
|
$77,046 |
|
Average AUM |
|
$75,525 |
|
$68,871 |
(1) Represents new commitments during the period, including equity and debt commitments, as well as equity offerings by our publicly traded vehicles and is offset by return of uncalled commitments to fund investors.
(2) Represents the permanent reduction in leverage during the period.
(3) Represents distributions and redemptions net of recallable amounts.
(4) Includes fund net income, including interest income, realized and unrealized gains (losses), fees and expenses and the impact of revaluing foreign currency.
Total AUM was $77.0 billion as of March 31, 2014, an increase of $3.0 billion, or 4.1%, compared to total AUM of $74.0 billion as of December 31, 2013. The increase in AUM was primarily due to $4.8 billion of new commitments to our funds which was comprised of $4.3 billion in commitments to the Tradable Credit Group, including $316 million of new equity commitments and $3.9 billion of new debt commitments in leveraged loan funds and $96.1 million of new equity commitments in High Yield funds, $128 million of new capital commitments to ARCC and $350 million of commitments in the Real Estate Group to our publicly traded real estate debt fund, Ares Commercial Real Estate Corporation (“ACRE”). The increase in AUM was partially offset by a capital reduction of $1.4 billion, primarily driven by the Tradable Credit and Real Estate Groups. Distributions for the three months totaled $1.3 billion, of which $595.7 million was attributable to the Tradable Credit Group.
For the twelve months ended March 31, 2014, AUM increased $16.3 billion, or 26.9%, compared to total AUM of $60.7 billion as of March 31, 2013. The increase in AUM was primarily due to $17.0 billion of new commitments to our funds which was mainly comprised of $7.6 billion in commitments to the Tradable Credit Group’s leveraged loan funds, including $1.9 billion of new equity commitments and $5.7 billion of new debt commitments; $741 million in new equity commitments in the Tradable Credit Group High Yield funds; $2.1 billion of new equity commitments in the Tradable Credit Group Alternative Credit funds; $1.9 billion of new equity commitments and $2.9 billion of new debt commitments to the Direct Lending Group; and $1.1 billion of new equity commitments and $771 million in new debt commitments in the Real Estate Group. In addition, the increase in AUM was also due to the $6.1 billion of AUM added from the AREA Acquisition in July 2013. The increase in AUM was partially offset by capital reductions of $4.9 billion, of which $3.2 billion was attributable to the Tradable Credit Group, and distributions for the twelve months ended March 31, 2014 totaling $6.0 billion, of which $2.8 billion and $1.3 billion was attributable to the Tradable Credit and Real Estate Groups, respectively.
Fee Earning Assets Under Management
|
|
|
AUM | ||
|
|
|
March 31, 2014 | ||
|
($ in millions) |
|
3 Months |
|
12 Months |
|
Beginning of Period FEAUM |
|
$59,162 |
|
$47,588 |
|
Acquisitions |
|
- |
|
5,384 |
|
Commitments (1) |
|
259 |
|
2,919 |
|
Subscriptions / Deployment / Increase in Leverage (2) |
|
1,731 |
|
9,477 |
|
Redemptions / Distributions / Decrease in Leverage (3) |
|
(4,653) |
|
(10,371) |
|
Market Appreciation / (Depreciation) (4) |
|
768 |
|
2,694 |
|
Change in Fee Basis (5) |
|
(39) |
|
(463) |
|
End of Period FEAUM |
|
$57,228 |
|
$57,228 |
|
Average FEAUM |
|
$58,195 |
|
$52,408 |
(1) Represents new commitments during the period for funds that earn management fees based on committed capital.
(2) Represents subscriptions, capital deployment and increase in leverage (for funds that earn fees on a gross asset basis).
(3) Represents redemptions, distributions and decrease in leverage (for funds that earn fees on a gross asset basis).
(4) Includes fund net income, including interest income, realized and unrealized gains (losses), fees and expenses and the impact of revaluing foreign currency (for funds that earn management fees based on market value).
(5) Represents the change of fee basis from committed capital to invested capital.
Total Fee Earning Assets Under Management (“FEAUM”) was $57.2 billion as of March 31, 2014, a decrease of $2.0 billion, or 3.3%, compared to total FEAUM of $59.2 billion as of December 31, 2013. The decrease in FEAUM was primarily due to $3.4 billion and $0.8 billion of Redemptions / Distributions / Decreases in Leverage in the Tradable Credit and Real Estate Groups, respectively. The decrease in FEAUM was partially offset by Subscriptions / Deployment / Increase in Leverage of $1.7 billion, of which $971.0 million, $268.2 million, $487.2 million and $4.9 million was attributable to the Tradable Credit, Private Equity, Direct Lending and Real Estate Groups, respectively.
For the twelve months ended March 31, 2014, FEAUM increased $9.6 billion, or 20.3%, compared to total FEAUM of $47.6 billion as of March 31, 2013. The increase in FEAUM was primarily due to Subscriptions / Deployment / Increase in Leverage of $9.5 billion, which was mainly comprised of $4.3 billion in the Tradable Credit Group and $4.5 billion in the Direct Lending Group. In addition, the AREA Acquisition in July 2013 contributed $5.4 billion in FEAUM to the Real Estate Group. These increases were partially offset by Redemptions / Distributions / Decrease in Leverage of $10.4 billion, of which $7.0 billion was from the Tradable Credit Group, $1.6 billion from the Direct Lending Group, $0.4 billion from the Private Equity Group and $1.4 billion from the Real Estate Group. Change in fund value totaled $2.7 billion across our portfolio during the twelve months ended March 31, 2014.
Incentive Generating AUM and Incentive Eligible AUM
($ in millions)
|
|
|
As of March 31, 2014 |
|
As of December 31, 2013 | ||||
|
|
|
Incentive |
|
Incentive Eligible |
|
Incentive |
|
Incentive Eligible |
|
Tradable Credit Group |
|
$4,920 |
|
$7,683 |
|
$5,351 |
|
$7,779 |
|
Direct Lending Group(1) |
|
8,969 |
|
13,474 |
|
8,763 |
|
13,122 |
|
Private Equity Group |
|
4,075 |
|
9,296 |
|
4,184 |
|
9,595 |
|
Real Estate Group |
|
1,550 |
|
5,508 |
|
1,572 |
|
5,645 |
|
Total |
|
$19,514 |
|
$35,961 |
|
$19,870 |
|
$36,141 |
(1) Includes the applicable IGAUM or IEAUM of ARCC as a result of ARCC Part II Fees.
Total Incentive Generating AUM (“IGAUM”) was $19.5 billion as of March 31, 2014, a decrease of $0.4 billion, or 1.8%, compared to total IEAUM of $19.9 billion as of December 31, 2013.
Total Incentive Eligible AUM (“IEAUM”) was $36.0 billion as of March 31, 2014 compared to $36.1 billion as of December 31, 2013.
Available Capital and Assets Under Management Not Earning Fees
($ in millions)
|
|
|
As of March 31, 2014 |
|
As of December 31, 2013 | ||||
|
|
|
Available |
|
AUM Not Yet |
|
Available |
|
AUM Not Yet |
|
Tradable Credit Group |
|
$5,094 |
|
$1,657 |
|
$1,723 |
|
$1,698 |
|
Direct Lending Group |
|
7,177 |
|
6,894 |
|
7,215 |
|
6,684 |
|
Private Equity Group |
|
4,406 |
|
737 |
|
4,462 |
|
720 |
|
Real Estate Group |
|
1,516 |
|
519 |
|
1,866 |
|
881 |
|
Total |
|
$18,193 |
|
$9,807 |
|
$15,266 |
|
$9,983 |
Total Available Capital was $18.2 billion as of March 31, 2014, an increase of $2.9 billion or 19.2%, compared to $15.3 billion as of December 31, 2013. The increase was driven by growth in available capital of $3.4 billion within the Tradable Credit Group. Total assets under management not yet earnings fees was $9.8 billion, a decrease of $0.2 billion or 2.0% compared to $10.0 billion as of December 31, 2013.
|
Tradable Credit Group |
· Management Fee Revenue: Management fee revenue was $33.7 million for the three months ended March 31, 2014 compared to $31.2 million for the three months ended March 31, 2013. The increase was driven by a 6.0% increase in the average fee earning AUM during the three months ended March 31, 2014 compared to the comparable period in 2013.
o Partially offsetting the management fee increase was $1.1 million in non-recurring management fee revenue that was received in the three months ended March 31, 2013 and not received in the comparable 2014 period.
· Fee Related Earnings: FRE was $19.2 million for the three months ended March 31, 2014 compared to $19.9 million for the same period in 2013. The decrease in FRE was primarily due to an increase in compensation and benefits and general, administrative and other expenses of $3.3 million partially offset by the $2.5 million increase in management fee revenue.
· Performance Related Earnings: PRE was $16.9 million for the three months ended March 31, 2014 compared to $43.9 million for the three months ended March 31, 2013. The decrease in PRE of $27.0 million was primarily attributable to the decrease in net performance fees of $16.8 million as credit asset appreciation in the first quarter of 2013 was more robust compared to the first quarter of 2014 and a decline in net investment income of $10.4 million.
· Economic Net Income: ENI was $36.1 million for the three months ended March 31, 2014 compared to $63.8 million for the three months ended March 31, 2013, representing a decrease of $27.7 million.
· Distributable Earnings: DE decreased to $40.7 million for the three months ended March 31, 2014 from $47.6 million for the three months ended March 31, 2013. The decrease was primarily due to a $4.3 million decrease in realized net performance fees and lower FRE.
|
|
|
For The Three Months Ended | ||
|
($ in thousands) |
|
March 31, 2014 |
|
March 31, 2013 |
|
Management Fee Revenue |
|
$33,693 |
|
$31,170 |
|
Fee Related Earnings |
|
$19,209 |
|
$19,928 |
|
Performance Related Earnings |
|
$16,877 |
|
$43,896 |
|
Economic Net Income |
|
$36,086 |
|
$63,824 |
|
Distributable Earnings |
|
$40,704 |
|
$47,607 |
Note: Segment results are shown before the unallocated support costs of the Operations Management Group.
· Total AUM: Total AUM increased 12.3% in the three months ended March 31, 2014 primarily due to $4.3 billion in new commitments to our leveraged loan funds and $0.1 billion in new commitments to our high yield bond funds. Total AUM increased 20.3% in the twelve months ended March 31, 2014 primarily due to $7.6 billion in new commitments to our leveraged loan funds and $2.1 billion in new commitments to our alternative credit funds.
· Fee Earning AUM: FEAUM decreased 8.2% in the three months ended March 31, 2014 primarily due to a $2.7 billion reduction in leverage on funds that earn fees on gross assets. FEAUM increased 1.1% in the twelve months ended March 31, 2014 primarily due to $1.6 billion in Subscriptions / Deployment to our leveraged loan funds and $1.8 billion in Subscriptions / Deployment to our alternative credit funds.
|
|
|
Total AUM |
|
Fee Earning AUM |
|
AUM | ||||
|
|
|
March 31, 2014 |
|
March 31, 2014 |
|
($ in billions) | ||||
|
($ in millions) |
|
3 Months |
|
12 Months |
|
3 Months |
|
12 Months |
|
|
|
Beginning of Period AUM |
|
$27,928 |
|
$26,058 |
|
$25,982 |
|
$23,606 |
| |
|
Acquisitions |
|
- |
|
- |
|
- |
|
- |
| |
|
Commitments |
|
4,357 |
|
10,378 |
|
- |
|
1,213 |
| |
|
Subscriptions / Deployment |
|
- |
|
- |
|
971 |
|
4,312 |
| |
|
Capital Reduction / Distributions |
|
(1,180) |
|
(5,999) |
|
(3,433) |
|
(7,009) |
| |
|
Change in Fund Value |
|
255 |
|
924 |
|
340 |
|
1,812 |
| |
|
Change in Fee Basis |
|
- |
|
- |
|
- |
|
(74) |
| |
|
End of Period AUM |
|
$31,361 |
|
$31,361 |
|
$23,860 |
|
$23,860 |
| |
|
Average AUM |
|
$29,645 |
|
$28,709 |
|
$24,921 |
|
$23,733 |
| |
|
Direct Lending Group |
· Management Fee Revenue: Management fee revenue was $66.2 million for the three months ended March 31, 2014 compared to $51.5 million for the three months ended March 31, 2013. The increase was primarily due to additional capital raises for ARCC and the expansion of the Direct Lending Group’s European platform in 2014.
· Fee Related Earnings: FRE was $32.2 million for the three months ended March 31, 2014 compared to $22.8 million for the three months ended March 31, 2013. The increase was due to an increase in management fees of $14.8 million partially offset by an increase in compensation and benefits expense of $5.3 million.
· Performance Related Earnings: PRE was $1.6 million for the three months ended March 31, 2014 compared to $4.2 million for the three months ended March 31, 2013. The PRE decrease was primarily attributable to a reduction in net investment income due to lower corporate investments.
· Economic Net Income: ENI was $33.7 million for the three months ended March 31, 2014 compared to $27.0 million for the three months ended March 31, 2013. The increase in ENI for the three months ended March 31, 2014 was due to an increase in FRE of $9.3 million. The increase was partially offset by a decrease in net investment income of $2.8 million.
· Distributable Earnings: DE increased by $8.8 million, or 39.5%, to $31.2 million for the three months ended March 31, 2014 compared to the three months ended March 31, 2013. The increase was primarily due to an increase in FRE.
|
|
|
For The Three Months Ended | ||
|
($ in thousands) |
|
March 31, 2014 |
|
March 31, 2013 |
|
Management Fee Revenue (including ARCC Part I Fees of $28.3 million and $23.8 million in 2014 and 2013, respectively) |
|
$66,204 |
|
$51,450 |
|
Fee Related Earnings |
|
$32,168 |
|
$22,829 |
|
Performance Related Earnings |
|
$1,572 |
|
$4,204 |
|
Economic Net Income |
|
$33,740 |
|
$27,033 |
|
Distributable Earnings |
|
$31,158 |
|
$22,342 |
Note: Segment results are shown before the unallocated support costs of the Operations Management Group.
· Total AUM: Total AUM increased modestly to $27.6 billion in the three months ended March 31, 2014 as new commitments and fund value increases slightly outpaced distributions. In the twelve months ended March 31, 2014, total AUM increased $4.9 billion or 21.4% primarily due to new commitments totaling $4.8 billion offset by distributions of $0.9 billion.
· Fee Earning AUM: FEAUM increased modestly to $20.1 billion in the three months ended March 31, 2014 as Subscriptions / Deployment and fund value increases outpaced capital reductions. In the twelve months ended March 31, 2014, FEAUM increased $4.8 billion or 31.4% as subscriptions of $4.5 billion and fund value increases of $0.9 billion outpaced capital reductions of $1.6 billion.
|
|
|
Total AUM |
|
Fee Earning AUM |
|
AUM | ||||
|
|
|
March 31, 2014 |
|
March 31, 2014 |
|
($ in billions) | ||||
|
($ in millions) |
|
3 Months |
|
12 Months |
|
3 Months |
|
12 Months |
|
|
|
Beginning of Period AUM |
|
$27,493 |
|
$22,706 |
|
$19,581 |
|
$15,318 |
| |
|
Acquisitions |
|
- |
|
- |
|
- |
|
- |
| |
|
Commitments |
|
128 |
|
4,815 |
|
5 |
|
1,289 |
| |
|
Subscriptions / Deployment |
|
- |
|
- |
|
487 |
|
4,458 |
| |
|
Capital Reduction / Distributions |
|
(235) |
|
(1,349) |
|
(395) |
|
(1,585) |
| |
|
Change in Fund Value |
|
178 |
|
1,391 |
|
454 |
|
873 |
| |
|
Change in Fee Basis |
|
- |
|
- |
|
- |
|
(220) |
| |
|
End of Period AUM |
|
$27,563 |
|
$27,563 |
|
$20,133 |
|
$20,133 |
| |
|
Average AUM |
|
$27,528 |
|
$25,135 |
|
$19,857 |
|
$17,726 |
| |
|
Private Equity Group |
· Management Fee Revenue: Management fee revenue decreased modestly by $0.4 million, or 1.5%, to $23.2 million for the three months ended March 31, 2014 compared to the three months ended March 31, 2013.
· Fee Related Earnings: FRE was $13.1 million for the three months ended March 31, 2014 compared to $14.8 million for the three months ended March 31, 2013, representing a decrease of $1.7 million. The decrease was due to a decrease in management fees of $0.3 million and an increase in compensation and benefits expenses.
· Performance Related Earnings: PRE was $25.5 million for the three months ended March 31, 2014 compared to $9.9 million for the three months ended March 31, 2013, representing an increase of $15.6 million. The PRE increase was primarily attributable to the increase in net investment income of $15.6 million.
· Economic Net Income: ENI was $38.6 million for the three months ended March 31, 2014 compared to $24.7 million for the three months ended March 31, 2013, representing an increase of $13.9 million.
· Distributable Earnings: DE increased by $1.9 million, or 11.6%, to $18.7 million for the three months ended March 31, 2014 compared to the three months ended March 31, 2013. The increase was primarily due to an increase in realized investment income of $2.9 million and an increase in net realized performance fees of $0.8 million.
|
|
|
For The Three Months Ended | ||
|
($ in thousands) |
|
March 31, 2014 |
|
March 31, 2013 |
|
Management Fee Revenue |
|
$23,196 |
|
$23,543 |
|
Fee Related Earnings |
|
$13,077 |
|
$14,826 |
|
Performance Related Earnings |
|
$25,492 |
|
$9,884 |
|
Economic Net Income |
|
$38,569 |
|
$24,710 |
|
Distributable Earnings |
|
$18,698 |
|
$16,752 |
Note: Segment results are shown before the unallocated support costs of the Operations Management Group.
· Total AUM: Total AUM was $9.8 billion as of March 31, 2014, a decline of $35.8 million, or 0.4%, compared to total AUM of $9.9 billion as of December 2013. In the twelve months ended March 31, 2014, AUM declined $475.5 million, or 4.6%, compared to total AUM of $10.3 billion as of March 31, 2013 primarily due to distributions of $1.2 billion partially offset by an increase in fund value of $716.1 million.
· Fee Earning AUM: Total FEAUM was $7.4 billion as of March 31, 2014, an increase of $215.5 million, or 3.0%, compared to total FEAUM of $7.2 billion as of December 31, 2013. In the twelve months ended March 31, 2014, FEAUM declined $116.3 million, or 1.5%, compared to total fee earning AUM of $7.5 billion as of March 31, 2013, primarily due to distributions of $376.6 million.
|
|
|
Total AUM |
|
Fee Earning AUM |
|
AUM | ||||
|
|
|
March 31, 2014 |
|
March 31, 2014 |
|
($ in billions) | ||||
|
($ in millions) |
|
3 Months |
|
12 Months |
|
3 Months |
|
12 Months |
|
|
|
Beginning of Period AUM |
|
$9,862 |
|
$10,302 |
|
$7,212 |
|
$7,544 |
| |
|
Acquisitions |
|
- |
|
- |
|
- |
|
- |
| |
|
Commitments |
|
- |
|
34 |
|
- |
|
23 |
| |
|
Subscriptions / Deployment |
|
- |
|
- |
|
268 |
|
350 |
| |
|
Capital Reduction / Distributions |
|
(291) |
|
(1,225) |
|
(53) |
|
(377) |
| |
|
Change in Fund Value |
|
255 |
|
716 |
|
- |
|
- |
| |
|
Change in Fee Basis |
|
- |
|
- |
|
- |
|
(112) |
| |
|
End of Period AUM |
|
$9,826 |
|
$9,826 |
|
$7,428 |
|
$7,428 |
| |
|
Average AUM |
|
$9,844 |
|
$10,064 |
|
$7,320 |
|
$7,486 |
| |
|
Real Estate Group |
· Management Fee Revenue: Management fee revenue increased by $14.3 million to $16.8 million in the three months ended March 31, 2014 compared to $2.5 million for the three months ended March 31, 2013. The increase was principally attributable to the management fee contracts acquired in the AREA Acquisition and additional capital raises by ACRE.
· Fee Related Earnings: FRE was $2.3 million for the three months ended March 31, 2014 compared to ($2.4) million for the three months ended March 31, 2013. The increase in FRE of $4.7 million was primarily attributable to an increase in management fee revenue of $14.3 million partially offset by increases in compensation and benefits expense and general, administrative and other expenses of $10.9 million.
· Performance Related Earnings: PRE was $2.5 million for the three months ended March 31, 2014 compared to $0.8 million for the three months ended March 31, 2013. The increase was driven by a $3.0 million increase in unrealized performance fees for the period ended March 31, 2014.
· Economic Net Income: ENI was $4.8 million for the three months ended March 31, 2014 compared to a $1.5 million loss for the three months ended March 31, 2013.
· Distributable Earnings: DE increased by $4.9 million to $1.5 million for the three months ended March 31, 2014 compared to the three months ended March 31, 2013. The increase was primarily driven by an increase in FRE of $4.7 million.
|
|
|
For The Three Months Ended | ||
|
($ in thousands) |
|
March 31, 2014 |
|
March 31, 2013 |
|
Management Fee Revenue |
|
$16,768 |
|
$2,467 |
|
Fee Related Earnings |
|
$2,306 |
|
$(2,354) |
|
Performance Related Earnings |
|
$2,504 |
|
$837 |
|
Economic Net Income |
|
$4,810 |
|
$(1,517) |
|
Distributable Earnings |
|
$1,499 |
|
$(3,422) |
Note: Segment results are shown before the unallocated support costs of the Operations Management Group.
· Total AUM: Total AUM was $8.3 billion as of March 31, 2014, a decline of $425.5 million, or 4.9%, compared to total AUM of $8.7 billion as of December 31, 2013. In the twelve months ended March 31, 2014, AUM increased $6.7 billion, or 408.9%, compared to total AUM of $1.6 billion as of March 31, 2013. The increase is primarily due to the AREA Acquisition which contributed $6.1 billion in AUM.
· Fee Earning AUM: Total FEAUM was $5.8 billion as of March 31, 2014, a decrease of $580.2 million, or 9.1%, compared to total FEAUM of $6.4 billion as of December 31, 2013. In the twelve months ended March 31, 2014, FEAUM increased $4.7 billion, or 418.9%, compared to total FEAUM of $1.1 billion as of March 31, 2013. The increase was primarily due to the AREA Acquisition which contributed $5.4 billion in FEAUM to the Real Estate Group.
|
|
|
Total AUM |
|
Fee Earning AUM |
|
AUM | ||||
|
|
|
March 31, 2014 |
|
March 31, 2014 |
|
($ in billions) | ||||
|
($ in millions) |
|
3 Months |
|
12 Months |
|
3 Months |
|
12 Months |
|
|
|
Beginning of Period AUM |
|
$8,721 |
|
$1,630 |
|
$6,388 |
|
$1,119 |
| |
|
Acquisitions |
|
- |
|
6,091 |
|
- |
|
5,384 |
| |
|
Commitments |
|
350 |
|
1,731 |
|
254 |
|
393 |
| |
|
Subscriptions / Deployment |
|
- |
|
- |
|
5 |
|
357 |
| |
|
Capital Reduction / Distributions |
|
(968) |
|
(2,242) |
|
(773) |
|
(1,399) |
| |
|
Change in Fund Value |
|
193 |
|
1,085 |
|
(26) |
|
10 |
| |
|
Change in Fee Basis |
|
- |
|
- |
|
(39) |
|
(57) |
| |
|
End of Period AUM |
|
$8,296 |
|
$8,296 |
|
$5,808 |
|
$5,808 |
| |
|
Average AUM |
|
$8,509 |
|
$4,963 |
|
$6,098 |
|
$3,463 |
| |
Reconciliation of Certain Non-GAAP Measures to Consolidated GAAP Financial Measures
In this press release, Ares discloses the following financial measures that are calculated and presented on the basis of methodologies other than in accordance with generally accepted accounting principles in the United States of America: ENI, FRE, PRE and DE. Income before provision for income taxes is the GAAP financial measure most comparable to ENI, FRE, PRE and DE. Reconciliations of these non-GAAP financial measures to income before taxes are included in Exhibit F to this press release. These non-GAAP financial measures should be considered in addition to and not as a substitute for, or superior to, financial measures presented in accordance with GAAP.
Net Income Excluding Consolidated Funds
Net income of the Company excluding net income attributable to non-controlling interests and redeemable interests in the Consolidated Funds for the three months ended March 31, 2014 was $56.2 million, a 24.6% decrease compared to $74.5 million for the three months ended March 31, 2013.
Balance Sheet Statistics and Investment Capacity
As of March 31, 2014, our cash and cash equivalents were $36.6 million, investments at fair value were $519.8 million, net performance fees receivable were $186.9 million, and debt outstanding was $172.1 million. As of March 31, 2014, the Company had a $735 million Credit Facility with approximately $585 million in available capacity.
|
Key Balance Sheet Statistics |
|
|
|
|
|
Net Performance Fees Receivable by Group |
|
|
| ||
|
($ in thousands) |
|
March 31, |
|
December 31, |
|
($ in thousands) |
|
March |
|
December |
|
|
|
|
|
|
|
|
|
|
|
|
|
|
|
Cash and cash equivalents |
|
$36,634 |
|
$89,802 |
|
Tradable Credit Group |
|
$141,474 |
|
$138,775 |
|
|
Investments, at fair value |
|
$519,750 |
|
$504,291 |
|
Direct Lending Group |
|
$2,856 |
|
$8,890 |
|
|
Debt obligations |
|
$172,119 |
|
$153,119 |
|
Private Equity Group |
|
$42,538 |
|
$38,108 |
|
|
Performance fees receivable |
|
$490,883 |
|
$481,751 |
|
|
|
|
|
|
|
|
Performance fee compensation payable |
|
$304,015 |
|
$295,978 |
|
|
|
|
|
|
|
|
Net performance fee receivable |
|
$186,868 |
|
$185,773 |
|
Net performance fee receivable |
|
$186,868 |
|
$185,773 |
|
Distribution
On April 24, 2014, AHI and AI made first quarter 2014 distributions to their equity holders in the aggregate amount of $46.0 million, representing approximately 85% of pre-tax Distributable Earnings of $54.5 million. There were no public unitholders at the time of the first quarter 2014 distribution.
Recent Developments
|
· |
On May 1, 2014, in connection with the IPO, the Company converted Ares Holdings LLC into a limited partnership, Ares Holdings L.P., and converted Ares Investments LLC into a limited partnership, Ares Investments L.P. In addition, the Company recently formed Ares Domestic Holdings L.P., Ares Offshore Holdings L.P. and Ares Real Estate Holdings L.P. |
|
|
|
|
· |
On May 7, 2014, the Company closed its IPO of 11,363,636 common units priced at $19.00 per unit, raising $215.9 million in gross proceeds, before deducting underwriting discounts and expenses payable by Ares. On June 4, 2014, the Company issued an additional 225,794 common units in connection with a partial exercise of the underwriters’ option to purchase additional common units, raising additional gross proceeds of $4.3 million. |
|
|
|
|
· |
On May 7, 2014, the Company further amended and restated the Credit Facility to increase the size from $735 million to $1,030.0 million and extend the maturity from December 2017 to April 2019. |
Conference Call and Webcast Information
On Tuesday June 10, 2014, the Company invites all interested persons to attend its webcast/conference call at 12:00 p.m. (Eastern Time) to discuss its first quarter 2014 financial results.
All interested parties are invited to participate via telephone or the live webcast, which will be hosted on a webcast link located on the Home page of the Investor Resources section of the Company’s website at http://www.aresmgmt.com. Please visit the website to test your connection before the webcast. Domestic callers can access the conference call by dialing (888) 317-6003. International callers can access the conference call by dialing +1 (412) 317-6061. All callers will need to enter the Participant Elite Entry Number 3581683 followed by the # sign and reference “Ares Management, L.P.” once connected with the operator. All callers are asked to dial in 10-15 minutes prior to the call so that name and company information can be collected. For interested parties, an archived replay of the call will be available through June 23, 2014 at 5:00 p.m. (Eastern Time) to domestic callers by dialing (877) 344-7529 and to international callers by dialing +1(412) 317-0088. For all replays, please reference conference number 10047012. An archived replay will also be available through June 23, 2014 on a webcast link located on the Home page of the Investor Resources section of the Company’s website.
About Ares Management, L.P.
Ares is a leading global alternative asset manager with approximately $77.0 billion of assets under management and approximately 700 employees in more than 15 offices in the United States, Europe and Asia as of March 31, 2014. Since its inception in 1997, Ares has adhered to a disciplined investment philosophy that focuses on delivering strong risk-adjusted investment returns throughout market cycles. Ares believes each of its four distinct but complementary investment groups in Tradable Credit, Direct Lending, Private Equity and Real Estate is a market leader based on assets under management and investment performance. Ares was built upon the fundamental principle that each group benefits from being part of the greater whole.
Forward-Looking Statements
Statements included herein may constitute “forward-looking statements” within the meaning of the Private Securities Litigation Reform Act of 1995, which relate to future events or our future performance or financial condition. These statements are not guarantees of future performance, condition or results and involve a number of risks and uncertainties. Actual results may differ materially from those in the forward-looking statements as a result of a number of factors, including those described from time to time in our filings with the Securities and Exchange Commission. Ares Management, L.P. undertakes no duty to update any forward-looking statements made herein or on the webcast/conference call.
Available Information
Ares Management, L.P.’s filings with the Securities and Exchange Commission, press releases, earnings releases and other financial information are available on its website at www.aresmgmt.com. The contents of such website are not and should not be deemed to be incorporated by reference herein.
Contact
Ares Management, L.P.
Carl Drake
(800) 340-6597
cdrake@aresmgmt.com
Appendix
Exhibit A. Fund Performance Metrics
($ in millions)
The following table includes fund performance metrics for significant investment funds that contributed at least 1% of total management fees for the three months ended March 31, 2014. In addition, the following table includes performance information for the fund with the greatest amount of management fees for the three months ended March 31, 2014 for each of the sub strategies within Ares’ Segments, which are not otherwise represented by the significant funds.
|
|
|
|
|
|
|
Returns |
|
|
|
|
|
| ||||
|
Fund |
|
Year of |
|
Assets Under |
|
Since |
|
Past 5 |
|
Past 3 |
|
Segment |
|
Investment Strategy |
|
|
|
ECO I |
|
2006 |
|
$2,655 |
|
2.2 |
|
23.6 |
|
9.9 |
|
Tradable Credit |
|
Alternative: Credit Opportunities |
|
(1)(2)(3)(4) |
|
HY II |
|
2007 |
|
$393 |
|
9.0 |
|
16.8 |
|
8.3 |
|
Tradable Credit |
|
Long-only: High Yield |
|
(1)(2)(3) |
|
AELIS VI |
|
2008 |
|
$826 |
|
16.5 |
|
n/a |
|
9.6 |
|
Tradable Credit |
|
Long-only: Loans |
|
(1)(2)(6) |
|
CSF |
|
2008 |
|
$1,652 |
|
14.3 |
|
13.1 |
|
8.5 |
|
Tradable Credit |
|
Alternative: Credit Opportunities |
|
(1)(2)(5) |
|
BVK |
|
2009 |
|
$412 |
|
6.4 |
|
n/a |
|
5.6 |
|
Tradable Credit |
|
Alternative: Special Situations |
|
(1)(2)(3) |
|
ASIP II |
|
2009 |
|
$838 |
|
11.1 |
|
n/a |
|
7.1 |
|
Tradable Credit |
|
Alternative: Credit Opportunities |
|
(1)(2)(3) |
|
ARDC |
|
2012 |
|
$487 |
|
n/a |
|
n/a |
|
n/a |
|
Tradable Credit |
|
Alternative: Dynamic Credit |
|
(1)(7) |
|
ARCC |
|
2004 |
|
$9,913 |
|
13.9 |
|
43.0 |
|
11.0 |
|
Direct Lending |
|
U.S. Direct Lending |
|
(8)(9) |
|
ACE II |
|
2013 |
|
$1,536 |
|
n/a |
|
n/a |
|
n/a |
|
Direct Lending |
|
European Direct Lending |
|
(7) |
|
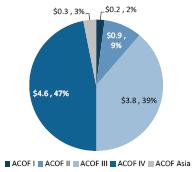
ACOF II |
|
2006 |
|
$949 |
|
14.7 |
|
24.6 |
|
11.1 |
|
Private Equity |
|
U.S./European Flexible Capital |
|
(1)(2)(10) |
|
ACOF III |
|
2008 |
|
$3,813 |
|
24.5 |
|
26.7 |
|
16.7 |
|
Private Equity |
|
U.S./European Flexible Capital |
|
(1)(2)(10) |
|
ACOF Asia |
|
2011 |
|
$259 |
|
n/a |
|
n/a |
|
n/a |
|
Private Equity |
|
China Growth Capital |
|
(1)(2)(7) |
|
ACOF IV |
|
2012 |
|
$4,648 |
|
n/a |
|
n/a |
|
n/a |
|
Private Equity |
|
U.S./European Flexible Capital |
|
(1)(2)(7) |
|
EU III |
|
2007 |
|
$1,245 |
|
5.7 |
|
9.0 |
|
8.2 |
|
Real Estate |
|
Real Estate Equity |
|
(1)(2)(10) |
|
U.S. VII |
|
2008 |
|
$778 |
|
14.4 |
|
n/a |
|
17.3 |
|
Real Estate |
|
Real Estate Equity |
|
(1)(2)(10)(11) |
|
ACRE |
|
2012 |
|
$1,368 |
|
6.4 |
|
n/a |
|
n/a |
|
Real Estate |
|
Real Estate Debt |
|
(1)(12) |
|
(1) |
Assets under management equals the sum of the NAV for such fund, the drawn and undrawn debt (at the fund-level including amounts subject to restrictions) and uncalled committed capital. |
|
(2) |
Net numbers are after giving effect to management fees and performance fees as applicable. ECO I, AELIS VI, CSF, ACOF II, ACOF III, ACOF Asia, ACOF IV, EU III and US VII net numbers are also after giving effect to other expenses. |
|
(3) |
The return is an annualized net return calculated using the modified Dietz method, which is an estimate of the time-weighted return and adjusts portfolio cash flows according to the time they were invested in the portfolio and is calculated by dividing (A) net asset value change over the period minus cash flow, by (B) (i) beginning net asset value plus (ii) weighted cash flow. |
|
(4) |
From the inception of ECO I through year-end 2008, the fund was managed primarily as a long-only strategy, employing 3-4x debt to equity leverage during a period of high volatility within the credit markets, which impacted fund performance. Beginning in 2009, ECO I’s strategy was modified to incorporate a broader array of hedges and other shorting instruments with targeted leverage levels reduced to 1-1.5x on a debt to equity basis. AUM includes capital committed by CSF, a fund of funds. |
|
(5) |
The return is an annualized net internal rate of return of cash flows on investments and the investments ending valuations for the period. The past five and three years net returns are calculated using beginning investment valuations for such period. CSF is a fund of funds and AUM represented may include AUM that has been committed to other Ares funds. |
|
(6) |
The return is an annualized net internal rate of return of cash flows to and from fee-paying limited partners and the fee-paying limited partners’ ending capital for the period. The past five and three years net returns are calculated using beginning fee-paying limited partners’ capital for such period. |
|
(7) |
The return is not shown due to the fund’s recent vintage. |
|
(8) |
Does not include AUM of the SSLP (through which ARCC co invests with affiliates of General Electric Company) or Ivy Hill Asset Management, L.P. (a wholly owned portfolio company of ARCC). |
|
(9) |
The return is the annualized return to ARCC’s stockholders based on ARCC’s public stock price and is calculated assuming dividends are reinvested at the end of day stock price on the relevant quarterly ex dividend dates. The return is calculated assuming stockholders did not participate in the rights issuance as of March 20, 2008. |
|
(10) |
The return is a net internal rate of return computed based on cash flows to and from partners and the partners’ ending capital for the period. The past five and three years, if presented, net returns are calculated using beginning partners’ capital for such period. |
|
(11) |
Returns since inception are from the first capital event which took place on July 23, 2010 and was a distribution of capital. |
|
(12) |
Return shown represents the dollar weighted average of the unleveraged effective yield of ACRE’s principal lending portfolio measured at the end of the eight quarterly periods ending March 31, 2014. Unleveraged effective yield is based on the contractual interest rate (adjusted for any deferred loan fees, costs, premium or discount) and assumes no dispositions, early prepayments or defaults and does not take into consideration the impact of leverage utilized by ACRE, fees, expenses and other costs incurred by ACRE or its stockholders, which are expected to be significant. Unleveraged effective yield does not represent net returns to investors of ACRE. |
Additional information for funds that are structured as closed end private comingled funds as of March 31, 2014:
($ in millions)
|
Fund |
|
Original Capital |
|
Cumulative |
|
Realized |
|
Unrealized |
|
Total |
|
Gross |
|
Net |
|
Segment |
|
|
|
AELIS VI |
|
$660 |
|
$660 |
|
$1,269 |
|
$207 |
|
$1,476 |
|
2.2x |
|
2.0x |
|
Tradable Credit |
|
(1)(4)(7)(8) |
|
ACE II |
|
$1,229 |
|
$465 |
|
$6 |
|
$489 |
|
$495 |
|
1.1x |
|
1.1x |
|
Direct Lending |
|
(2)(4)(7)(8) |
|
ACOF II |
|
$2,065 |
|
$2,069 |
|
$3,508 |
|
$678 |
|
$4,186 |
|
2.0x |
|
1.8x |
|
Private Equity |
|
(2)(5)(7)(8) |
|
ACOF III |
|
$3,510 |
|
$3,730 |
|
$3,566 |
|
$3,245 |
|
$6,811 |
|
1.8x |
|
1.6x |
|
Private Equity |
|
(2)(5)(7)(8) |
|
ACOF Asia |
|
$220 |
|
$170 |
|
$10 |
|
$226 |
|
$237 |
|
1.4x |
|
1.3x |
|
Private Equity |
|
(2)(5)(7)(8) |
|
ACOF IV |
|
$4,700 |
|
$975 |
|
- |
|
$1,036 |
|
$1,036 |
|
1.1x |
|
1.0x |
|
Private Equity |
|
(2)(5)(7)(8) |
|
EU III |
|
$1,375 |
|
$1,185 |
|
$544 |
|
$1,100 |
|
$1,644 |
|
1.4x |
|
1.2x |
|
Real Estate |
|
(3)(6)(7)(8)(9) |
|
U.S. VII |
|
$756 |
|
$689 |
|
$392 |
|
$804 |
|
$1,196 |
|
1.7x |
|
1.4x |
|
Real Estate |
|
(3)(6)(7)(8)(9) |
|
(1) |
Realized proceeds represent the total distributions made from the fund to the partners, including any amounts paid to the general partner as management fees, carried interest and other expenses. |
|
(2) |
Realized proceeds represent the sum of all cash dividends, interest income, other fees and cash proceeds from realizations of portfolio investments. |
|
(3) |
Realized proceeds include distributions of operating income, sales and financing proceeds received through March 31, 2014. Returns include the reinvestment of proceeds from asset liquidations, income, and other earnings and reflect the deduction of any relevant transactional costs/expenses. |
|
(4) |
Unrealized value represents the fund’s NAV as of March 31, 2014. |
|
(5) |
Unrealized value represents the fair value of remaining investments as of March 31, 2014. |
|
(6) |
Unrealized value represents the fair value of remaining real estate investments and commitments as of March 31, 2014 (excluding balance sheet items). |
|
(7) |
The Gross MoIC as of March 31, 2014 is before giving effect to taxes, management fees, the general partner’s carried interest and other expenses. |
|
(8) |
The Net MoIC as of March 31, 2014 is after giving effect to management fees, the general partner’s carried interest and other expenses. |
|
(9) |
Also includes equity committed, but not yet deployed, to deals that have closed as of March 31, 2014. |
|
(10) |
There can be no assurance that unrealized investments will be realized at the valuations shown. |
Exhibit B. Corporate Investments
($ in thousands)
|
Private Equity |
|
March 31, |
|
December 31, |
|
|
ACOF I |
|
$1,116 |
|
$1,009 |
|
|
ACOF II |
|
15,016 |
|
19,982 |
|
|
ACOF III |
|
93,350 |
|
90,909 |
|
|
ACOF IV |
|
8,772 |
|
8,326 |
|
|
ACOF Asia |
|
109,865 |
|
96,630 |
|
|
Private Equity |
|
$228,119 |
|
$216,856 |
|
|
|
|
|
|
|
|
|
Tradable Credit |
|
|
|
|
|
|
Long Only |
|
$41,281 |
|
$51,854 |
|
|
Alternative Credit |
|
125,319 |
|
110,716 |
|
|
Tradable Credit |
|
$166,600 |
|
$162,570 |
|
|
|
|
|
|
|
|
|
Direct Lending |
|
|
|
|
|
|
U.S. Other |
|
$2,582 |
|
$3,700 |
|
|
Europe |
|
86,381 |
|
85,472 |
|
|
Direct Lending |
|
$88,963 |
|
$89,172 |
|
|
|
|
|
|
|
|
|
Real Estate |
|
|
|
|
|
|
U.S. Equity |
|
$33,550 |
|
$32,786 |
|
|
European Equity |
|
1,344 |
|
1,735 |
|
|
Debt |
|
1,174 |
|
1,172 |
|
|
Real Estate |
|
$36,068 |
|
$35,693 |
|
|
|
|
|
|
|
|
|
Grand Total |
|
$519,750 |
|
$504,291 |
|
Exhibit C. Segment Results
($ in thousands)
As of and for the three months ended March 31, 2014:
|
|
|
Private |
|
Direct |
|
Tradable |
|
Real |
|
Total |
|
OMG |
|
Total Stand |
|
Management fees |
|
|
|
|
|
|
|
|
|
|
|
|
|
|
|
Recurring fees (includes, in the case of the Direct Lending Group, $28,318 of ARCC Part I Fees) |
|
$23,196 |
|
$66,204 |
|
$33,693 |
|
$16,768 |
|
$139,861 |
|
$— |
|
$139,861 |
|
Previously deferred fees |
|
— |
|
— |
|
— |
|
— |
|
— |
|
— |
|
— |
|
Total management fees |
|
23,196 |
|
66,204 |
|
33,693 |
|
16,768 |
|
139,861 |
|
— |
|
139,861 |
|
Administrative fees and other income |
|
76 |
|
90 |
|
17 |
|
1,290 |
|
1,473 |
|
5,392 |
|
6,865 |
|
General, administrative and other expenses |
|
(2,000) |
|
(1,914) |
|
(3,696) |
|
(4,267) |
|
(11,877) |
|
(13,535) |
|
(25,412) |
|
Compensation and benefits |
|
(8,195) |
|
(32,212) |
|
(10,805) |
|
(11,485) |
|
(62,697) |
|
(27,657) |
|
(90,354) |
|
Fee related earnings (loss) |
|
13,077 |
|
32,168 |
|
19,209 |
|
2,306 |
|
66,760 |
|
(35,800) |
|
30,960 |
|
Performance fees—realized |
|
13,086 |
|
39 |
|
10,213 |
|
— |
|
23,338 |
|
— |
|
23,338 |
|
Performance fees—unrealized |
|
21,341 |
|
2,292 |
|
13,509 |
|
2,950 |
|
40,092 |
|
— |
|
40,092 |
|
Performance fee compensation expense—realized |
|
(10,472) |
|
(29) |
|
(5,506) |
|
— |
|
(16,007) |
|
— |
|
(16,007) |
|
Performance fee compensation expense—unrealized |
|
(16,912) |
|
(1,451) |
|
(6,355) |
|
— |
|
(24,718) |
|
— |
|
(24,718) |
|
Net performance fees |
|
7,043 |
|
851 |
|
11,861 |
|
2,950 |
|
22,705 |
|
— |
|
22,705 |
|
Investment income (loss)—realized |
|
1,131 |
|
(597) |
|
18,018 |
|
730 |
|
19,282 |
|
— |
|
19,282 |
|
Investment income (loss)—unrealized |
|
15,156 |
|
1,524 |
|
(12,866) |
|
(862) |
|
2,952 |
|
— |
|
2,952 |
|
Interest and other income |
|
2,785 |
|
98 |
|
251 |
|
11 |
|
3,145 |
|
— |
|
3,145 |
|
Interest expense |
|
(623) |
|
(304) |
|
(387) |
|
(325) |
|
(1,639) |
|
— |
|
(1,639) |
|
Net investment income (loss) |
|
18,449 |
|
721 |
|
5,016 |
|
(446) |
|
23,740 |
|
— |
|
23,740 |
|
Performance related earnings |
|
25,492 |
|
1,572 |
|
16,877 |
|
2,504 |
|
46,445 |
|
— |
|
46,445 |
|
Economic net income (loss) |
|
$38,569 |
|
$33,740 |
|
$36,086 |
|
$4,810 |
|
$113,205 |
|
$(35,800) |
|
$77,405 |
|
Distributable earnings (loss) |
|
$18,698 |
|
$31,158 |
|
$40,704 |
|
$1,499 |
|
$92,059 |
|
$(37,512) |
|
$54,547 |
|
Total assets |
|
$477,710 |
|
$195,543 |
|
$555,851 |
|
$167,315 |
|
$1,396,419 |
|
$10,437 |
|
$1,406,856 |
Exhibit C. Segment Results (continued)
($ in thousands)
As of and for the three months ended March 31, 2013:
|
|
|
Private |
|
Direct |
|
Tradable |
|
Real |
|
Total |
|
OMG |
|
Total Stand |
|
Management fees |
|
|
|
|
|
|
|
|
|
|
|
|
|
|
|
Recurring fees (includes, in the case of the Direct Lending Group, $23,836 of ARCC Part I Fees) |
|
$23,543 |
|
$51,450 |
|
$30,031 |
|
$2,467 |
|
$107,491 |
|
$— |
|
$107,491 |
|
Previously deferred fees |
|
— |
|
— |
|
1,139 |
|
— |
|
1,139 |
|
— |
|
1,139 |
|
Total management fees |
|
23,543 |
|
51,450 |
|
31,170 |
|
2,467 |
|
108,630 |
|
— |
|
108,630 |
|
Administrative fees and other income |
|
117 |
|
83 |
|
— |
|
5 |
|
205 |
|
4,455 |
|
4,660 |
|
General, administrative and other expenses |
|
(2,238) |
|
(1,802) |
|
(2,475) |
|
(1,258) |
|
(7,773) |
|
(5,554) |
|
(13,327) |
|
Compensation and benefits |
|
(6,596) |
|
(26,902) |
|
(8,767) |
|
(3,568) |
|
(45,833) |
|
(19,082) |
|
(64,915) |
|
Fee related earnings (loss) |
|
14,826 |
|
22,829 |
|
19,928 |
|
(2,354) |
|
55,229 |
|
(20,181) |
|
35,048 |
|
Performance fees—realized |
|
9,012 |
|
— |
|
9,038 |
|
— |
|
18,050 |
|
— |
|
18,050 |
|
Performance fees—unrealized |
|
25,513 |
|
1,499 |
|
54,351 |
|
— |
|
81,363 |
|
— |
|
81,363 |
|
Performance fee compensation expense—realized |
|
(7,209) |
|
— |
|
(36) |
|
— |
|
(7,245) |
|
— |
|
(7,245) |
|
Performance fee compensation expense—unrealized |
|
(20,269) |
|
(823) |
|
(34,665) |
|
— |
|
(55,757) |
|
— |
|
(55,757) |
|
Net performance fees |
|
7,047 |
|
676 |
|
28,688 |
|
— |
|
36,411 |
|
— |
|
36,411 |
|
Investment income (loss)—realized |
|
926 |
|
(825) |
|
19,513 |
|
(37) |
|
19,577 |
|
— |
|
19,577 |
|
Investment income (loss)—unrealized |
|
2,424 |
|
3,839 |
|
(3,961) |
|
1,048 |
|
3,350 |
|
— |
|
3,350 |
|
Interest and other income |
|
406 |
|
1,151 |
|
312 |
|
39 |
|
1,908 |
|
— |
|
1,908 |
|
Interest expense |
|
(919) |
|
(637) |
|
(656) |
|
(213) |
|
(2,425) |
|
— |
|
(2,425) |
|
Net investment income (loss) |
|
2,837 |
|
3,528 |
|
15,208 |
|
837 |
|
22,410 |
|
— |
|
22,410 |
|
Performance related earnings |
|
9,884 |
|
4,204 |
|
43,896 |
|
837 |
|
58,821 |
|
— |
|
58,821 |
|
Economic net income (loss) |
|
$24,710 |
|
$27,033 |
|
$63,824 |
|
$(1,517) |
|
$114,050 |
|
$(20,181) |
|
$93,869 |
|
Distributable earnings (loss) |
|
$16,752 |
|
$22,342 |
|
$47,607 |
|
$(3,422) |
|
$83,279 |
|
$(20,472) |
|
$62,807 |
|
Total assets |
|
$407,526 |
|
$211,238 |
|
$656,974 |
|
$53,547 |
|
$1,329,285 |
|
$9,444 |
|
$1,338,729 |
Exhibit D. Combined and Consolidated Statements of Financial Conditions and Statement of Operations (GAAP Financials)
($ in thousands)
|
|
|
As of March 31, |
|
As of December 31, |
|
|
|
|
2014 |
|
2013 |
|
|
Assets |
|
|
|
|
|
|
Cash and cash equivalents |
|
$36,634 |
|
$89,802 |
|
|
Restricted cash and cash equivalents |
|
7,657 |
|
13,344 |
|
|
Investments, at fair value |
|
121,608 |
|
89,438 |
|
|
Performance fees receivable |
|
136,430 |
|
137,682 |
|
|
Derivative assets, at fair value |
|
1,132 |
|
1,164 |
|
|
Due from affiliates |
|
119,330 |
|
108,920 |
|
|
Intangible assets, net |
|
59,938 |
|
68,742 |
|
|
Goodwill |
|
60,531 |
|
58,159 |
|
|
Other assets |
|
71,957 |
|
73,600 |
|
|
Assets of Consolidated Funds |
|
|
|
|
|
|
Cash and cash equivalents |
|
1,276,657 |
|
1,638,003 |
|
|
Investments, at fair value |
|
19,485,067 |
|
20,823,338 |
|
|
Due from affiliates |
|
9,930 |
|
2,010 |
|
|
Dividends and interest receivable |
|
170,490 |
|
133,158 |
|
|
Receivable for securities sold |
|
447,263 |
|
427,871 |
|
|
Derivative assets, at fair value |
|
8,961 |
|
14,625 |
|
|
Other assets |
|
21,916 |
|
25,528 |
|
|
Total assets |
|
$22,035,501 |
|
$23,705,384 |
|
|
Liabilities |
|
|
|
|
|
|
Debt obligations |
|
$172,119 |
|
$153,119 |
|
|
Accounts payable, accrued expenses and other liabilities |
|
63,621 |
|
67,486 |
|
|
Deferred tax liability, net |
|
20,793 |
|
21,002 |
|
|
Performance fee compensation payable |
|
304,015 |
|
295,978 |
|
|
Derivative liabilities, at fair value |
|
2,942 |
|
2,907 |
|
|
Accrued compensation |
|
55,557 |
|
132,917 |
|
|
Due to affiliates |
|
23,312 |
|
32,690 |
|
|
Liabilities of Consolidated Funds |
|
|
|
|
|
|
Accounts payable, accrued expenses and other liabilities |
|
66,010 |
|
95,839 |
|
|
Payable for securities purchased |
|
601,349 |
|
945,115 |
|
|
Derivative liabilities, at fair value |
|
53,643 |
|
75,115 |
|
|
Due to affiliates |
|
2,530 |
|
2,695 |
|
|
Securities sold short, at fair value |
|
— |
|
1,633 |
|
|
Deferred tax liability, net |
|
20,449 |
|
35,904 |
|
|
CLO loan obligations |
|
11,275,857 |
|
11,774,157 |
|
|
Fund borrowings |
|
1,769,737 |
|
2,070,598 |
|
|
Mezzanine debt |
|
327,892 |
|
323,164 |
|
|
Total liabilities |
|
14,759,826 |
|
16,030,319 |
|
|
Commitments and contingencies |
|
|
|
|
|
|
Redeemable interest in Consolidated Funds |
|
1,119,585 |
|
1,093,770 |
|
|
Redeemable interest in AHI, AI and consolidated subsidiaries |
|
43,587 |
|
40,751 |
|
|
Non-controlling interest in Consolidated Funds: |
|
|
|
|
|
|
Non-controlling interest in Consolidated Funds |
|
5,283,933 |
|
5,691,874 |
|
|
Equity appropriated for Consolidated Funds |
|
106,758 |
|
155,261 |
|
|
Non-controlling interest in Consolidated Funds |
|
5,390,691 |
|
5,847,135 |
|
|
Non-controlling interest in equity of AHI, AI and consolidated subsidiaries |
|
178,543 |
|
167,731 |
|
|
Controlling interest in equity of AHI, AI and consolidated subsidiaries: |
|
|
|
|
|
|
Members’ Equity |
|
350,862 |
|
321,891 |
|
|
Common Stock (class A shares, 50,000 authorized, 5,010 shares issued and outstanding, $0.001 par value) |
|
0 |
|
0 |
|
|
Additional paid-in-capital |
|
315,553 |
|
338,375 |
|
|
Retained earnings |
|
(124,408) |
|
(135,573) |
|
|
Accumulated other comprehensive gain |
|
1,262 |
|
985 |
|
|
Total controlling interest in equity of AHI, AI and consolidated subsidiaries |
|
543,269 |
|
525,678 |
|
|
Total equity |
|
6,112,503 |
|
6,540,544 |
|
|
Total liabilities, redeemable interests, non-controlling interests and equity |
|
$22,035,501 |
|
$23,705,384 |
|
Exhibit D. Combined and Consolidated Statements of Financial Conditions and Statement of Operations (GAAP Financials) (continued) ($ in thousands)
|
|
|
For the Three Months Ended |
| ||
|
|
|
2014 |
|
2013 |
|
|
Revenues |
|
|
|
|
|
|
Management fees (includes ARCC Part I Fees of $28,318 and $23,836 for the periods ended March 31, 2014 and 2013, respectively) |
|
$110,549 |
|
$78,394 |
|
|
Performance fees |
|
16,214 |
|
25,154 |
|
|
Other fees |
|
6,865 |
|
3,989 |
|
|
Total revenues |
|
133,628 |
|
107,537 |
|
|
Expenses |
|
|
|
|
|
|
Compensation and benefits |
|
95,693 |
|
71,975 |
|
|
Performance fee compensation |
|
40,725 |
|
63,002 |
|
|
General, administrative and other expenses |
|
38,775 |
|
16,982 |
|
|
Consolidated Funds expenses |
|
8,937 |
|
61,108 |
|
|
Total expenses |
|
184,130 |
|
213,067 |
|
|
Other income (expense) |
|
|
|
|
|
|
Interest and other income |
|
124 |
|
651 |
|
|
Interest expense |
|
(1,639) |
|
(2,425) |
|
|
Net realized loss on investments |
|
(66) |
|
(1,137) |
|
|
Net change in unrealized appreciation on investments |
|
4,146 |
|
8,285 |
|
|
Interest and other income of Consolidated Funds |
|
345,345 |
|
311,490 |
|
|
Interest expense of Consolidated Funds |
|
(145,042) |
|
(125,958) |
|
|
Net realized gain on investments of Consolidated Funds |
|
54,965 |
|
57,956 |
|
|
Net change in unrealized appreciation on investments of Consolidated Funds |
|
67,344 |
|
104,252 |
|
|
Total other income |
|
325,177 |
|
353,114 |
|
|
Income before taxes |
|
274,675 |
|
247,584 |
|
|
Income tax expense (benefit) |
|
(6,695) |
|
24,450 |
|
|
Net income |
|
281,370 |
|
223,134 |
|
|
Less: Net income attributable to non-controlling interests and redeemable non-controlling interests in Consolidated Funds |
|
225,181 |
|
148,591 |
|
|
Less: Net income attributable to non-controlling interests and redeemable non-controlling interests in consolidated subsidiaries |
|
13,342 |
|
12,601 |
|
|
Net income attributable to controlling interests in AHI, AI and consolidated subsidiaries |
|
$42,847 |
|
$61,942 |
|
Exhibit E. Supplemental Financial Information Consolidating Schedules ($ in thousands, except share data)
|
|
|
For the Three Months Ended March 31, 2014 | ||||||
|
|
|
Consolidated |
|
Consolidated |
|
Eliminations |
|
Consolidated |
|
Assets |
|
|
|
|
|
|
|
|
|
Cash and cash equivalents |
|
$36,634 |
|
$— |
|
$— |
|
$36,634 |
|
Restricted cash and cash equivalents |
|
7,657 |
|
— |
|
— |
|
7,657 |
|
Investments, at fair value |
|
519,750 |
|
— |
|
(398,142) |
|
121,608 |
|
Performance fees receivable |
|
490,883 |
|
— |
|
(354,453) |
|
136,430 |
|
Derivative assets, at fair value |
|
1,132 |
|
— |
|
— |
|
1,132 |
|
Due from affiliates |
|
136,986 |
|
— |
|
(17,656) |
|
119,330 |
|
Intangible assets, net |
|
59,938 |
|
— |
|
— |
|
59,938 |
|
Goodwill |
|
60,531 |
|
— |
|
— |
|
60,531 |
|
Other assets |
|
93,345 |
|
— |
|
(21,388) |
|
71,957 |
|
Assets of Consolidated Funds |
|
|
|
|
|
|
|
|
|
Cash and cash equivalents |
|
— |
|
1,276,657 |
|
— |
|
1,276,657 |
|
Investments, at fair value |
|
— |
|
19,485,067 |
|
— |
|
19,485,067 |
|
Due from affiliates |
|
— |
|
9,930 |
|
— |
|
9,930 |
|
Dividends and interest receivable |
|
— |
|
170,490 |
|
— |
|
170,490 |
|
Receivable for securities sold |
|
— |
|
447,263 |
|
— |
|
447,263 |
|
Derivative assets, at fair value |
|
— |
|
8,961 |
|
— |
|
8,961 |
|
Other assets |
|
— |
|
21,916 |
|
— |
|
21,916 |
|
Total assets |
|
$1,406,856 |
|
$21,420,284 |
|
$(791,639) |
|
$22,035,501 |
|
Liabilities |
|
|
|
|
|
|
|
|
|
Debt obligations |
|
$172,119 |
|
$— |
|
$— |
|
$172,119 |
|
Accounts payable, accrued expenses and other liabilities |
|
63,621 |
|
— |
|
— |
|
63,621 |
|
Deferred tax liability, net |
|
20,793 |
|
— |
|
— |
|
20,793 |
|
Performance fee compensation payable |
|
304,015 |
|
— |
|
— |
|
304,015 |
|
Derivative liabilities, at fair value |
|
2,942 |
|
— |
|
— |
|
2,942 |
|
Accrued compensation |
|
55,557 |
|
— |
|
— |
|
55,557 |
|
Due to affiliates |
|
22,410 |
|
— |
|
902 |
|
23,312 |
|
Liabilities of Consolidated Funds |
|
|
|
|
|
|
|
|
|
Accounts payable, accrued expenses and other liabilities |
|
— |
|
66,010 |
|
— |
|
66,010 |
|
Payable for securities purchased |
|
— |
|
601,349 |
|
— |
|
601,349 |
|
Derivative liabilities, at fair value |
|
— |
|
53,643 |
|
— |
|
53,643 |
|
Due to affiliates |
|
— |
|
83,649 |
|
(81,119) |
|
2,530 |
|
Deferred tax liability |
|
— |
|
20,449 |
|
— |
|
20,449 |
|
CLO loan obligations |
|
— |
|
11,330,112 |
|
(54,255) |
|
11,275,857 |
|
Fund borrowings |
|
— |
|
1,769,737 |
|
— |
|
1,769,737 |
|
Mezzanine debt |
|
— |
|
327,892 |
|
— |
|
327,892 |
|
Total liabilities |
|
641,457 |
|
14,252,841 |
|
(134,472) |
|
14,759,826 |
|
Commitments and contingencies |
|
|
|
|
|
|
|
|
|
Redeemable interest in Consolidated Funds |
|
— |
|
1,119,585 |
|
— |
|
1,119,585 |
|
Redeemable interest in AHI, AI and consolidated subsidiaries |
|
43,587 |
|
— |
|
— |
|
43,587 |
|
Non-controlling interest in Consolidated Funds: |
|
|
|
|
|
|
|
|
|
Non-controlling interest in Consolidated Funds |
|
— |
|
5,941,100 |
|
(657,167) |
|
5,283,933 |
|
Equity appropriated for Consolidated Funds |
|
— |
|
106,758 |
|
— |
|
106,758 |
|
Non-controlling interest in Consolidated Funds |
|
— |
|
6,047,858 |
|
(657,167) |
|
5,390,691 |
|
Non-controlling interest in equity of AHI, AI and consolidated subsidiaries |
|
178,543 |
|
— |
|
— |
|
178,543 |
|
Controlling interest in equity of AHI, AI and consolidated subsidiaries: |
|
|
|
|
|
|
|
|
|
Members’ equity |
|
350,862 |
|
— |
|
— |
|
350,862 |
|
Common stock (class A shares, 50,000 authorized, 5,010 shares issued and outstanding, $0.001 par value) |
|
0 |
|
— |
|
— |
|
0 |
|
Additional paid in capital |
|
315,553 |
|
— |
|
— |
|
315,553 |
|
Retained earnings |
|
(124,408) |
|
— |
|
— |
|
(124,408) |
|
Accumulated other comprehensive gain |
|
1,262 |
|
— |
|
— |
|
1,262 |
|
Total controlling interest in equity of AHI, AI and consolidated subsidiaries |
|
543,269 |
|
— |
|
— |
|
543,269 |
|
Total equity |
|
721,812 |
|
6,047,858 |
|
(657,167) |
|
6,112,503 |
|
Total liabilities, redeemable interests, non-controlling interests and equity |
|
$1,406,856 |
|
$21,420,284 |
|
$(791,639) |
|
$22,035,501 |
Exhibit E. Supplemental Financial Information Consolidating Schedules (continued) ($ in thousands, except share data)
|
|
|
For the Three Months Ended March 31, 2014 | ||||||
|
|
|
Consolidated |
|
Consolidated |
|
Eliminations |
|
Consolidated |
|
Revenues |
|
|
|
|
|
|
|
|
|
Management fees (includes ARCC Part I Fees of $28,318) |
|
$139,861 |
|
$— |
|
$(29,312) |
|
$110,549 |
|
Performance fees |
|
60,480 |
|
— |
|
(44,266) |
|
16,214 |
|
Other fees |
|
6,865 |
|
— |
|
— |
|
6,865 |
|
Total revenues |
|
207,206 |
|
— |
|
(73,578) |
|
133,628 |
|
Expenses |
|
|
|
|
|
|
|
|
|
Compensation and benefits |
|
95,693 |
|
— |
|
— |
|
95,693 |
|
Performance fee compensation |
|
40,725 |
|
— |
|
— |
|
40,725 |
|
General, administrative and other expense |
|
38,775 |
|
— |
|
— |
|
38,775 |
|
Consolidated Fund expenses |
|
— |
|
40,637 |
|
(31,700) |
|
8,937 |
|
Total expenses |
|
175,193 |
|
40,637 |
|
(31,700) |
|
184,130 |
|
Other income (expense) |
|
|
|
|
|
|
|
|
|
Interest and other income |
|
3,483 |
|
— |
|
(3,359) |
|
124 |
|
Interest expense |
|
(1,639) |
|
— |
|
— |
|
(1,639) |
|
Net realized gain (loss) on investments |
|
19,281 |
|
— |
|
(19,347) |
|
(66) |
|
Net change in unrealized appreciation (depreciation) on investments |
|
5,565 |
|
— |
|
(1,419) |
|
4,146 |
|
Interest and other income of Consolidated Funds |
|
— |
|
345,476 |
|
(131) |
|
345,345 |
|
Interest expense of Consolidated Funds |
|
— |
|
(145,737) |
|
695 |
|
(145,042) |
|
Net realized gain on investments of Consolidated Funds |
|
— |
|
54,965 |
|
— |
|
54,965 |
|
Net change in unrealized appreciation on investments of Consolidated Funds |
|
— |
|
66,413 |
|
931 |
|
67,344 |
|
Total other income |
|
26,690 |
|
321,117 |
|
(22,630) |
|
325,177 |
|
Income before taxes |
|
58,703 |
|
280,480 |
|
(64,508) |
|
274,675 |
|
Income tax expense (benefit) |
|
2,514 |
|
(9,209) |
|
— |
|
(6,695) |
|
Net income |
|
56,189 |
|
289,689 |
|
(64,508) |
|
281,370 |
|
Less: Net income attributable to non-controlling interests and redeemable non-controlling interests in Consolidated Funds |
|
— |
|
289,689 |
|
(64,508) |
|
225,181 |
|
Less: Net income attributable to non-controlling interests in consolidated subsidiaries |
|
13,342 |
|
— |
|
— |
|
13,342 |
|
Net income attributable to controlling interests in AHI, AI and consolidated subsidiaries |
|
$42,847 |
|
$— |
|
$— |
|
$42,847 |
Exhibit E. Supplemental Financial Information Consolidating Schedules (continued) ($ in thousands, except share data)
|
|
|
For the Year Ended December 31, 2013 | ||||||
|
|
|
Consolidated |
|
Consolidated |
|
Eliminations |
|
Consolidated |
|
Assets |
|
|
|
|
|
|
|
|
|
Cash and cash equivalents |
|
$89,802 |
|
$— |
|
$— |
|
$89,802 |
|
Restricted cash and cash equivalents |
|
13,344 |
|
— |
|
— |
|
13,344 |
|
Investments, at fair value |
|
504,291 |
|
— |
|
(414,853) |
|
89,438 |
|
Performance fees receivable |
|
481,751 |
|
— |
|
(344,069) |
|
137,682 |
|
Derivative assets, at fair value |
|
1,164 |
|
— |
|
— |
|
1,164 |
|
Due from affiliates |
|
130,625 |
|
— |
|
(21,705) |
|
108,920 |
|
Intangible assets, net |
|
68,742 |
|
— |
|
— |
|
68,742 |
|
Goodwill |
|
58,159 |
|
— |
|
— |
|
58,159 |
|
Other assets |
|
96,904 |
|
— |
|
(23,304) |
|
73,600 |
|
Assets of Consolidated Funds |
|
|
|
|
|
|
|
|
|
Cash and cash equivalents |
|
— |
|
1,638,003 |
|
— |
|
1,638,003 |
|
Investments, at fair value |
|
— |
|
20,823,338 |
|
— |
|
20,823,338 |
|
Due from affiliates |
|
— |
|
2,010 |
|
— |
|
2,010 |
|
Dividends and interest receivable |
|
— |
|
133,158 |
|
— |
|
133,158 |
|
Receivable for securities sold |
|
— |
|
427,871 |
|
— |
|
427,871 |
|
Derivative assets, at fair value |
|
— |
|
14,625 |
|
— |
|
14,625 |
|
Other assets |
|
— |
|
27,505 |
|
(1,977) |
|
25,528 |
|
Total assets |
|
$1,444,782 |
|
$23,066,510 |
|
$(805,908) |
|
$23,705,384 |
|
Liabilities |
|
|
|
|
|
|
|
|
|
Debt obligations |
|
$153,119 |
|
$— |
|
$— |
|
$153,119 |
|
Accounts payable, accrued expenses and other liabilities |
|
69,550 |
|
— |
|
(2,064) |
|
67,486 |
|
Deferred tax liability, net |
|
21,002 |
|
— |
|
— |
|
21,002 |
|
Performance fee compensation payable |
|
295,978 |
|
— |
|
— |
|
295,978 |
|
Derivative liabilities, at fair value |
|
2,907 |
|
— |
|
— |
|
2,907 |
|
Accrued compensation |
|
132,917 |
|
— |
|
— |
|
132,917 |
|
Due to affiliates |
|
35,149 |
|
— |
|
(2,459) |
|
32,690 |
|
Liabilities of Consolidated Funds |
|
|
|
|
|
|
|
|
|
Accounts payable, accrued expenses and other liabilities |
|
— |
|
95,839 |
|
— |
|
95,839 |
|
Payable for securities purchased |
|
— |
|
945,115 |
|
— |
|
945,115 |
|
Derivative liabilities, at fair value |
|
— |
|
75,115 |
|
— |
|
75,115 |
|
Due to affiliates |
|
— |
|
92,211 |
|
(89,516) |
|
2,695 |
|
Securities sold short, at fair value |
|
— |
|
1,633 |
|
— |
|
1,633 |
|
Deferred tax liability |
|
— |
|
35,904 |
|
— |
|
35,904 |
|
CLO loan obligations |
|
— |
|
11,838,396 |
|
(64,239) |
|
11,774,157 |
|
Fund borrowings |
|
— |
|
2,070,598 |
|
— |
|
2,070,598 |
|
Mezzanine debt |
|
— |
|
323,164 |
|
— |
|
323,164 |
|
Total liabilities |
|
710,622 |
|
15,477,975 |
|
(158,278) |
|
16,030,319 |
|
Commitments and contingencies |
|
|
|
|
|
|
|
|
|
Redeemable interest in Consolidated Funds |
|
— |
|
1,093,770 |
|
— |
|
1,093,770 |
|
Redeemable interest in AHI, AI and consolidated subsidiaries |
|
40,751 |
|
— |
|
— |
|
40,751 |
|
Non-controlling interest in Consolidated Funds: |
|
|
|
|
|
|
|
|
|
Non-controlling interest in Consolidated Funds |
|
— |
|
6,339,504 |
|
(647,630) |
|
5,691,874 |
|
Equity appropriated for Consolidated Funds |
|
— |
|
155,261 |
|
— |
|
155,261 |
|
Non-controlling interest in Consolidated Funds |
|
— |
|
6,494,765 |
|
(647,630) |
|
5,847,135 |
|
Non-controlling interest in equity of AHI, AI and consolidated subsidiaries |
|
167,731 |
|
— |
|
— |
|
167,731 |
|
Controlling interest in equity of AHI, AI and consolidated subsidiaries: |
|
|
|
|
|
|
|
|
|
Members’ equity |
|
321,891 |
|
— |
|
— |
|
321,891 |
|
Common stock (class A shares, 50,000 authorized, 5,010 shares issued and outstanding, $0.001 par value) |
|
0 |
|
— |
|
— |
|
0 |
|
Additional paid in capital |
|
338,375 |
|
— |
|
— |
|
338,375 |
|
Retained earnings |
|
(135,573) |
|
— |
|
— |
|
(135,573) |
|
Accumulated other comprehensive gain |
|
985 |
|
— |
|
— |
|
985 |
|
Total controlling interest in equity of AHI, AI and consolidated subsidiaries |
|
525,678 |
|
— |
|
— |
|
525,678 |
|
Total equity |
|
693,409 |
|
6,494,765 |
|
(647,630) |
|
6,540,544 |
|
Total liabilities, redeemable interests, non-controlling interests and equity |
|
$1,444,782 |
|
$23,066,510 |
|
$(805,908) |
|
$23,705,384 |
Exhibit E. Supplemental Financial Information Consolidating Schedules (continued) ($ in thousands, except share data)
|
|
|
For the Three Months Ended March 31, 2013 | ||||||
|
|
|
Consolidated |
|
Consolidated |
|
Eliminations |
|
Consolidated |
|
Revenues |
|
|
|
|
|
|
|
|
|
Management fees (includes ARCC Part I Fees of $23,836) |
|
$108,630 |
|
$— |
|
$(30,236) |
|
$78,394 |
|
Performance fees |
|
99,413 |
|
— |
|
(74,259) |
|
25,154 |
|
Other fees |
|
4,660 |
|
— |
|
(671) |
|
3,989 |
|
Total revenues |
|
212,703 |
|
— |
|
(105,166) |
|
107,537 |
|
Expenses |
|
|
|
|
|
|
|
|
|
Compensation and benefits |
|
71,975 |
|
— |
|
— |
|
71,975 |
|
Performance fee compensation |
|
63,002 |
|
— |
|
— |
|
63,002 |
|
General, administrative and other expense |
|
16,982 |
|
— |
|
— |
|
16,982 |
|
Consolidated Fund expenses |
|
— |
|
122,345 |
|
(61,237) |
|
61,108 |
|
Total expenses |
|
151,959 |
|
122,345 |
|
(61,237) |
|
213,067 |
|
Other income (expense) |
|
|
|
|
|
|
|
|
|
Interest and other income |
|
2,208 |
|
— |
|
(1,557) |
|
651 |
|
Interest expense |
|
(2,425) |
|
— |
|
— |
|
(2,425) |
|
Net realized gain (loss) on investments |
|
19,577 |
|
— |
|
(20,714) |
|
(1,137) |
|
Net change in unrealized appreciation on investments |
|
3,050 |
|
— |
|
5,235 |
|
8,285 |
|
Interest and other income of Consolidated Funds |
|
— |
|
311,686 |
|
(196) |
|
311,490 |
|
Interest expense of Consolidated Funds |
|
— |
|
(131,178) |
|
5,220 |
|
(125,958) |
|
Net realized gain on investments of Consolidated Funds |
|
— |
|
57,956 |
|
— |
|
57,956 |
|
Net change in unrealized appreciation (depreciation) on investments of Consolidated Funds |
|
— |
|
105,225 |
|
(973) |
|
104,252 |
|
Total other income |
|
22,410 |
|
343,689 |
|
(12,985) |
|
353,114 |
|
Income before taxes |
|
83,154 |
|
221,344 |
|
(56,914) |
|
247,584 |
|
Income tax expense |
|
8,611 |
|
15,839 |
|
— |
|
24,450 |
|
Net income |
|
74,543 |
|
205,505 |
|
(56,914) |
|
223,134 |
|
Less: Net income attributable to non-controlling interests and redeemable non-controlling interests in Consolidated Funds |
|
— |
|
205,505 |
|
(56,914) |
|
148,591 |
|
Less: Net income attributable to non-controlling interests in consolidated subsidiaries |
|
12,601 |
|
— |
|
— |
|
12,601 |
|
Net income attributable to controlling interests in AHI, AI and consolidated subsidiaries |
|
$61,942 |
|
$— |
|
$— |
|
$61,942 |
Exhibit F. Reconciliation from Combined Segments(1) to GAAP Financials ($ in thousands)
|
|
|
For the Three Months Ended March 31, | ||
|
|
|
2014 |
|
2013 |
|
Economic net income and fee related earnings: |
|
|
|
|
|
Income before taxes |
|
$274,675 |
|
$247,584 |
|
Adjustments |
|
|
|
|
|
Amortization of intangibles |
|
8,831 |
|
2,299 |
|
Depreciation expense |
|
2,059 |
|
1,233 |
|
Equity compensation expenses |
|
5,339 |
|
6,310 |
|
Income tax expense |
|
— |
|
41 |
|
Acquisition-related expenses |
|
1,421 |
|
750 |
|
Placement fees and underwriting costs |
|
1,052 |
|
82 |
|
OMG expenses, net |
|
35,800 |
|
20,181 |
|
Income of non-controlling interests in Consolidated Funds |
|
(225,181) |
|
(148,591) |
|
Income tax expense (benefit) of non-controlling interests in Consolidated Funds |
|
9,209 |
|
(15,839) |
|
Economic net income |
|
$113,205 |
|
$114,050 |
|
Total performance fee income- realized |
|
$(23,338) |
|
$(18,050) |
|
Total performance fee income - unrealized |
|
(40,092) |
|
(81,363) |
|
Total performance fee expense- realized |
|
16,007 |
|
7,245 |
|
Total performance fee expense - unrealized |
|
24,718 |
|
55,757 |
|
Net investment income |
|
(23,740) |
|
(22,410) |
|
Fee related earnings |
|
$66,760 |
|
$55,229 |
|
Management fees |
|
139,861 |
|
108,630 |
|
Administrative fees and other income |
|
1,473 |
|
205 |
|
Compensation and benefits |
|
(62,697) |
|
(45,833) |
|
General, administrative and other expenses |
|
(11,877) |
|
(7,773) |
|
Fee related earnings |
|
$66,760 |
|
$55,229 |
|
|
|
|
|
|
|
Performance related earnings: |
|
|
|
|
|
Income before taxes |
|
$274,675 |
|
$247,584 |
|
Adjustments |
|
|
|
|
|
Amortization of intangibles |
|
8,831 |
|
2,299 |
|
Depreciation expense |
|
2,059 |
|
1,233 |
|
Equity compensation expenses |
|
5,339 |
|
6,310 |
|
Income tax expense(2) |
|
— |
|
41 |
|
Acquisition-related expenses |
|
1,421 |
|
750 |
|
Placement fees and underwriting costs |
|
1,052 |
|
82 |
|
OMG expenses, net |
|
35,800 |
|
20,181 |
|
Income of non-controlling interests in Consolidated Funds |
|
(225,181) |
|
(148,591) |
|
Income tax expense (benefit) of non-controlling interests in Consolidated Funds |
|
9,209 |
|
(15,839) |
|
Economic net income |
|
113,205 |
|
114,050 |
|
Total management fees |
|
(139,861) |
|
(108,630) |
|
Administrative fees and other income |
|
(1,473) |
|
(205) |
|
Compensation and benefits |
|
62,697 |
|
45,833 |
|
General, administrative and other expenses |
|
11,877 |
|
7,773 |
|
Performance related earnings |
|
$46,445 |
|
$58,821 |
|
Total performance fee income - realized |
|
$23,338 |
|
$18,050 |
|
Total performance fee income - unrealized |
|
40,092 |
|
81,363 |
|
Total performance fee expense - realized |
|
(16,007) |
|
(7,245) |
|
Total performance fee expense - unrealized |
|
(24,718) |
|
(55,757) |
|
Net investment income |
|
23,740 |
|
22,410 |
|
Performance related earnings |
|
$46,445 |
|
$58,821 |
|
Distributable earnings: |
|
|
|
|
|
Income before taxes |
|
$274,675 |
|
$247,584 |
|
Adjustments: |
|
|
|
|
|
Amortization of intangibles |
|
8,831 |
|
2,299 |
|
Equity compensation expenses |
|
5,339 |
|
6,310 |
|
OMG distributable loss(3) |
|
37,512 |
|
20,472 |
|
Income of non-controlling interests in Consolidated Funds |
|
(225,181) |
|
(148,591) |
|
Income tax expense (benefit) of non-controlling interests in Consolidated Funds |
|
9,209 |
|
(15,839) |
|
Unrealized performance fees |
|
(40,092) |
|
(81,363) |
|
Unrealized performance fee compensation expense |
|
24,718 |
|
55,757 |
|
Unrealized investment and other loss |
|
(2,952) |
|
(3,350) |
|
Distributable earnings |
|
$92,059 |
|
$83,279 |
|
Fee related earnings |
|
$66,760 |
|
$55,229 |
|
Performance fees—realized |
|
23,338 |
|
18,050 |
|
Performance fee compensation expense—realized |
|
(16,007) |
|
(7,245) |
|
Other income realized, net |
|
20,788 |
|
19,060 |
|
Net performance fee—realized |
|
28,119 |
|
29,865 |
|
Less: |
|
|
|
|
|
One time acquisition costs |
|
- |
|
(750) |
|
Income tax expense(2) |
|
- |
|
(41) |
|
Placement fees and underwriting costs |
|
(1,052) |
|
(82) |
|
Non cash depreciation and amortization(4) |
|
(1,768) |
|
(942) |
|
Distributable earnings |
|
$92,059 |
|
$83,279 |
(1) Excludes results of the OMG.
(2) Relates to local income taxes paid by subsidiary operating entities included in general, administrative and other expenses.
(3) Represents OMG distributable earnings which includes depreciation expense.
(4) Depreciation and amortization is reduced by the amounts attributed to OMG equal to $291 and $291 for the periods ended March 31, 2014 and 2013, respectively.
Exhibit G. Pro Forma Units (1)
|
|
|
Pro Forma |
|
Adjusted |
|
|
Ares Management, L.P. Common Units Outstanding |
|
80,667,664 |
|
80,667,664 |
|
|
Ares Operating Group Units (Exchangeable Into Common Units) Outstanding |
|
130,921,766 |
|
- |
|
|
Dilutive Effect of Unvested Restricted Common Units(2) |
|
2,032,818 |
|
774,910(3) |
|
|
Dilutive Effect of Unvested Stock Options |
|
- |
|
- |
|
|
Total Pro Forma Units |
|
213,622,248 |
|
81,442,574 |
|
(1) Units Outstanding are shown pro forma for the IPO, which was completed on May 7, 2014, of 11,363,636 in common units and includes an additional 225,794 common units issued pursuant to the partial exercise by the underwriters of their option to purchase additional units which was completed on June 4, 2014.
(2) We apply the treasury stock method to determine the dilutive weighted-average common units represented by our restricted units to be settled in common units and options to acquire common units. Under the treasury stock method, compensation expense attributed to future services and not yet recognized is presumed to be used to acquire outstanding common units, thus reducing the weighted-average number of units and the dilutive effect of these awards.
(3) Represent proportional dilutive impact based upon the percentage of Ares Operating Group Units owned (38.12%).
Exhibit H. Pro Forma Data for the Three Months Ended March 31, 2014 ($ in thousands, except per unit data)
|
Pro Forma Economic Net Income per Unit |
|
|
|
|
Economic Net Income Before Taxes |
|
$77,405 |
|
|
Less Entity Level Foreign, State and Local Taxes |
|
(206) |
|
|
Economic Net Income After Entity Level, Foreign, State and Local Taxes |
|
$77,199 |
|
|
Pro Forma Economic Net Income per Unit |
|
$0.36 |
|
|
|
|
|
|
|
Pro Forma After Tax Economic Net Income per Unit |
|
|
|
|
Economic Net Income After Entity Level, Foreign, State and Local Taxes |
|
$77,199 |
|
|
Less Provision for Income Taxes (1) |
|
(4,724) |
|
|
Pro Forma After Tax Economic Net Income |
|
$72,475 |
|
|
Pro Forma After Tax Economic Net Income per Unit |
|
$0.34 |
|
|
|
|
|
|
|
Pro Forma After Tax Economic Net Income per Common Unit |
|
|
|
|
Economic Net Income After Entity Level, Foreign, State and Local Taxes |
|
$77,199 |
|
|
x Pro Forma Common Ownership Percentage |
|
38.12% |
|
|
Pro Forma Economic Net Income Attributable to Common Unitholders |
|
$29,428 |
|
|
Less Provision for Income Taxes (1) |
|
(4,724) |
|
|
Pro Forma After Tax Economic Net Income Attributable to Common Unitholders |
|
$24,704 |
|
|
Pro Forma After Tax Economic Net Income per Common Unit |
|
$0.30 |
|
|
|
|
|
|
|
|
|
|
|
|
Pro Forma Distributable Earnings per Ares Operating Group Unit Outstanding |
|
|
|
|
Distributable Earnings |
|
$54,753 |
|
|
Less Entity Level Foreign, State and Local Tax |
|
(206) |
|
|
Distributable Earnings After Entity Level Foreign, State and Local Tax |
|
$54,547 |
|
|
|
|
|
|
|
Less: Dividend Equivalent Related to RSUs (2) |
|
(1,129) |
|
|
Pro Forma Distributable Earnings after Dividend Equivalent |
|
$53,418 |
|
|
x Pro Forma Ares Operating Group Units (Exchangeable into Common Units) Percentage |
|
61.88% |
|
|
Pro Forma Distributable Earnings Attributable to Ares Operating Group Units (Exchangeable into Common Units) |
|
$33,055 |
|
|
Pro Forma Distributable Earnings per Ares Operating Group Unit (Exchangeable into Common Units) Outstanding |
|
$0.25 |
|
|
|
|
|
|
|
Pro Forma Distributable Earnings per Common Unit Outstanding |
|
|
|
|
Pro Forma Distributable Earnings after Dividend Equivalent |
|
$53,418 |
|
|
x Pro Forma Common Ownership Percentage |
|
38.12% |
|
|
Pro Forma Distributable Earnings Attributable to Common Unitholders |
|
$20,363 |
|
|
Less Current Provision for Income Taxes(3) |
|
(2,865) |
|
|
Pro Forma Distributable Earnings After Tax Attributable to Common Unitholders |
|
$17,498 |
|
|
Pro Forma Distributable Earnings per Common Unit Outstanding |
|
$0.22 |
|
(1) The provision for income taxes on ENI was calculated by multiplying (1) Ares’ pro forma share of ENI that is subject to corporate level taxes (reduced by the pro forma interest expense attributable to a intercompany loan between Ares and a corporate subsidiary) by (2) Ares’ assumed corporate tax rate.
(2) Unvested restricted unitholders will receive pro rata cash payments as if their units were fully vested. The dividend equivalent represents the amount that will be paid to the unvested restricted unitholders on a pro forma basis.
(3) The provision for income taxes on Distributable Earnings (DE) represents the current provision for income taxes on pre-tax net income or loss (reduced by the pro forma interest expense attributable to an intercompany loan between Ares and a corporate subsidiary), adjusted to reflect Ares’ post-IPO ownership percentage (which differed slightly from the pre-IPO ownership percentage) of Ares’ tax paying corporate subsidiaries.
Exhibit I. Glossary of Terms
|
ARCC Part I Fees |
ARCC Part I Fees refers to fees based on ARCC’s net investment income (before ARCC Part I Fees and fees based on ARCC’s net capital gains, which are paid annually (“ARCC Part II Fees”)), which are paid quarterly. |
|
Ares Operating Group Units |
Ares Operating Group Units refer, collectively, to a partnership unit in each of the Ares Operating Group entities, which include Ares Holdings L.P., Ares Domestic L.P., Ares Offshore Holdings L.P., Ares Investments L.P. and Ares Real Estate Holdings L.P.
|
|
Assets Under Management |
Assets Under Management (or “AUM”) refers to the assets of our funds. For our funds other than CLOs, our AUM represents the sum of the net asset value of such funds, the drawn and undrawn debt (at the fund level including amounts subject to restrictions) and uncalled committed capital (including commitments to funds that have yet to commence their investment periods). For our funds that are CLOs, our AUM represents subordinated notes (equity) plus all drawn and undrawn debt tranches.
|
|
Consolidated Funds |
Consolidated Funds refers collectively to certain Ares-affiliated funds, related co-investment entities and certain CLOs that are required under GAAP to be consolidated in our combined and consolidated financial statements.
|
|
Economic Net Income |
Economic net income (or “ENI”) represents net income excluding (a) income tax expense, (b) operating results of our Consolidated Funds, (c) depreciation expense, (d) the effects of changes arising from corporate actions, and (e) certain other items that we believe are not indicative of our performance. Changes arising from corporate actions include equity-based compensation expenses, the amortization of intangible assets, transaction costs associated with acquisitions and capital transactions, placement fees and underwriting costs and expenses incurred in connection with corporate reorganization.
|
|
Distributable Earnings |
Distributable earnings (or “DE”) is a pre income tax measure that is used to assess performance and amounts potentially available for distributions to stakeholders. Distributable earnings is calculated as the sum of Fee Related Earnings, realized performance fees, realized performance fee compensation expense, realized net other income, and further adjusts for expenses arising from transaction costs associated with acquisitions, placement fees and underwriting costs, expenses incurred in connection with corporate reorganization and depreciation. Distributable earnings differs from income before taxes computed in accordance with GAAP as it is presented before giving effect to unrealized performance fee income, unrealized performance fee compensation expense, unrealized net investment income, amortization of intangibles, equity compensation expense and is further adjusted by certain items described in “Management’s Discussion and Analysis of Financial Condition and Results of Operations ---Reconciliation of Certain Non-GAAP Measures to Consolidated GAAP Financial Measures.”
|
|
Fee Earning Assets Under Management |
Fee earning AUM (or “FEAUM”) refers to the AUM of our funds on which we directly or indirectly earn management fees. Fee earning AUM is equal to the sum of all the individual fee bases of our funds that contribute directly or indirectly to our management fees.
|
|
Fee Related Earnings |
Fee related earnings (or “FRE”) is a component of ENI and is used to assess the ability of our business to cover direct base compensation and operating expenses from management fees. FRE differs from income before taxes computed in accordance with GAAP as it adjusts for the items included in the calculation of ENI and further adjusts for performance fees, performance fee compensation, investment income from our Consolidated Funds and certain other items that we believe are not indicative of our performance. |
|
Incentive Generating Assets Under Management |
Incentive generating AUM (or “IGAUM”) refers to the AUM of our funds that are currently generating, on a realized or unrealized basis, performance fee revenue. It generally represents the NAV of our funds for which we are entitled to receive a performance fee, excluding capital committed by us and our professionals (which generally is not subject to a performance fee). |
|
Incentive Eligible Assets Under Management |
Incentive eligible AUM (or “IEAUM”) refers to the AUM of our funds that are eligible to produce performance fee revenue, regardless of whether or not they are currently generating performance fees. It generally represents the NAV plus uncalled equity of our funds for which we are entitled to receive a performance fee, excluding capital committed by us and our professionals (which generally is not subject to a performance fee). |
|
Operations Management Group |
In addition to our four segments, we have an Operations Management Group (the “OMG”) that consists of five independent, shared resource groups to support our reportable segments by providing infrastructure and administrative support in the areas of accounting/finance, operations/information technology, business development, legal/compliance and human resources. The OMG’s expenses are not allocated to our four reportable segments but we consider the cost structure of the OMG when evaluating our financial performance. This information constitutes non GAAP financial information within the meaning of Regulation G, as promulgated by the SEC. Our management uses this information to assess the performance of our reportable segments and our Operations Management Group, and we believe that this information enhances the ability of unitholders to analyze our performance. |
|
Our Funds |
Our funds refers to the funds, alternative asset companies and other entities and accounts that are managed or co-managed by Ares. It also includes funds managed by Ivy Hill Asset Management, L.P. (“IHAM”), a wholly owned portfolio company of ARCC, and a registered investment adviser |
|
Performance Related Earnings |
Performance related earnings (or “PRE”) is a measure used to assess our investment performance. PRE differs from income (loss) before taxes computed in accordance with GAAP as it only includes performance fee income, performance fee compensation and investment income earned from our Consolidated Funds and non-consolidated Funds. |
|
Senior Secured Loan Fund LLC |
Senior Secured Loan Fund LLC (or “SSLP”) is a program co-managed by a subsidiary of Ares through which ARCC co-invests with affiliates of General Electric Company.
|
|
Total Fee Revenue |
Total fee revenue refers to the sum of segment management fees and net performance fees.
|