Attached files
| file | filename |
|---|---|
| 8-K - FORM 8-K - ALLEGHANY CORP /DE | d741057d8k.htm |
Exhibit 99.1

Alleghany Morgan Stanley Financials Conference June 10, 2014
Forward-Looking Statements This presentation contains “forward-looking statements” within the meaning of the Private Securities Litigation Reform Act of 1995. These forward-looking statements are not historical facts but instead represent only Alleghany’s belief regarding future events, many of which, by their nature, are inherently uncertain and outside Alleghany’s control. Except for Alleghany’s ongoing obligation to disclose material information as required by federal securities laws, Alleghany is not under any obligation (and expressly disclaims any obligation) to update or alter any projections, goals, assumptions, or other statements, whether written or oral, that may be made from time to time, whether as a result of new information, future events or otherwise. Factors that could cause Alleghany’s actual results and experience to differ, possibly materially, from those expressed in the forward-looking statements include the factors set forth in Alleghany’s most recent Annual Report on Form 10-K and Quarterly Reports on Form 10-Q filed with the United States Securities and Exchange Commission and made available on Alleghany’s website at www.alleghany.com.
Weston Hicks President and chief executive officer
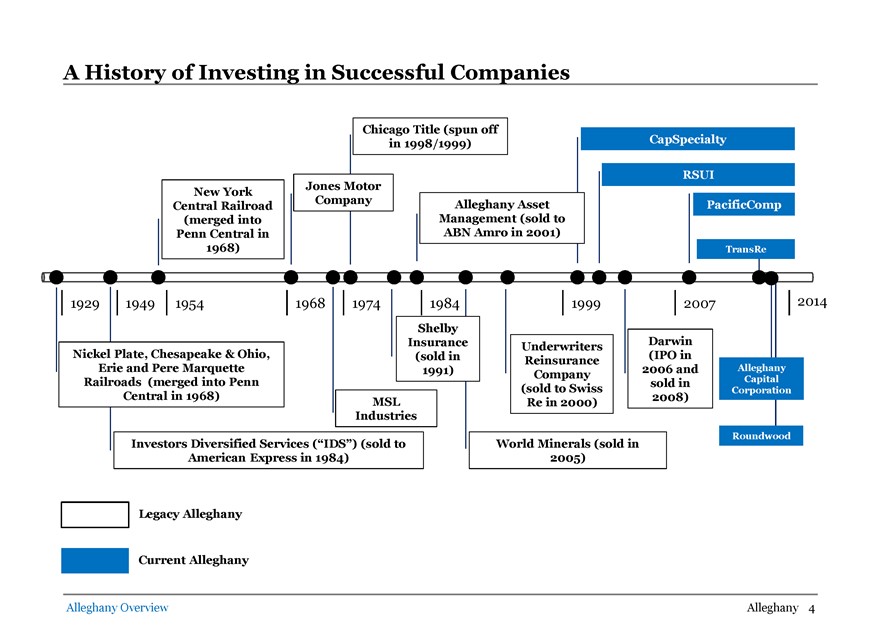
A History of Investing in Successful Companies Chicago Title (spun off in 1998/1999) New York Central Railroad (merged into Penn Central in 1968) Jones Motor Company Alleghany Asset Management (sold to ABN Amro in 2001) Nickel Plate, Chesapeake & Ohio, Erie and Pere Marquette Railroads (merged into Penn Central in 1968) 1929 1949 1954 1968 1974 1984 1999 2007 2014 CapSpecialty RSUI PacificComp TransRe Shelby Insurance Darwin Underwriters (sold in (IPO in Reinsurance 1991) 2006 and Alleghany Company Capital sold in (sold to Swiss Corporation MSL 2008) Re in 2000) Industries Investors Diversified Services (“IDS”) (sold to American Express in 1984) World Minerals (sold in 2005) Roundwood Current Alleghany Legacy Alleghany Alleghany Overview Alleghany 4
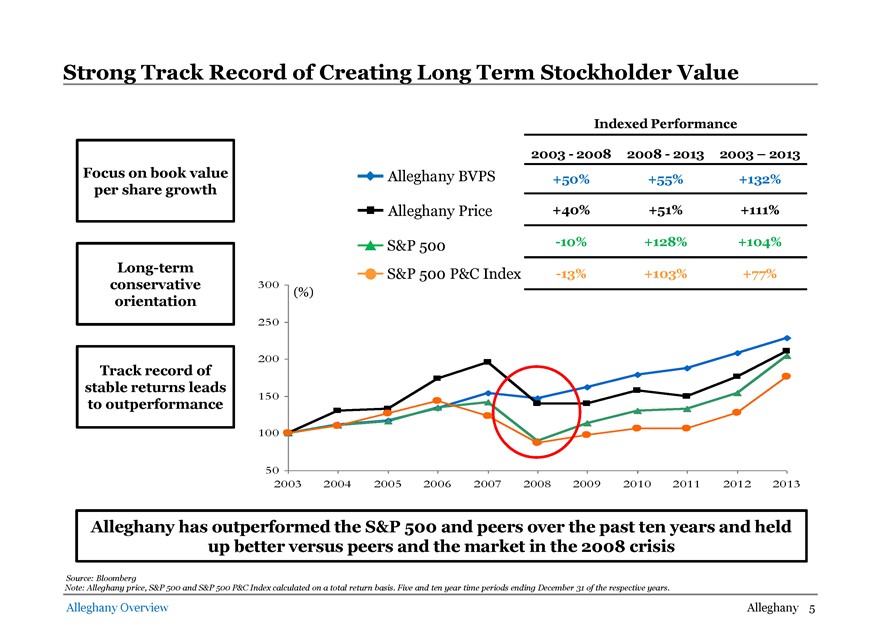
Strong Track Record of Creating Long Term Stockholder Value Focus on book value per share growth Long-term conservative orientation Track record of stable returns leads to outperformance Indexed Performance 2003 - 2008 2008 - 2013 2003 – 2013 Alleghany BVPS +50% +55% +132% Alleghany Price +40% +51% +111% S&P 500 -10% +128% +104% S&P 500 P&C Index -13% +103% +77% 300 (%) 250 200 150 100 50 2003 2004 2005 2006 2007 2008 2009 2010 2011 2012 2013 Alleghany has outperformed the S&P 500 and peers over the past ten years and held up better versus peers and the market in the 2008 crisis Source: Bloomberg Note: Alleghany price, S&P 500 and S&P 500 P&C Index calculated on a total return basis. Five and ten year time periods ending December 31 of the respective years. Alleghany Overview Alleghany 5
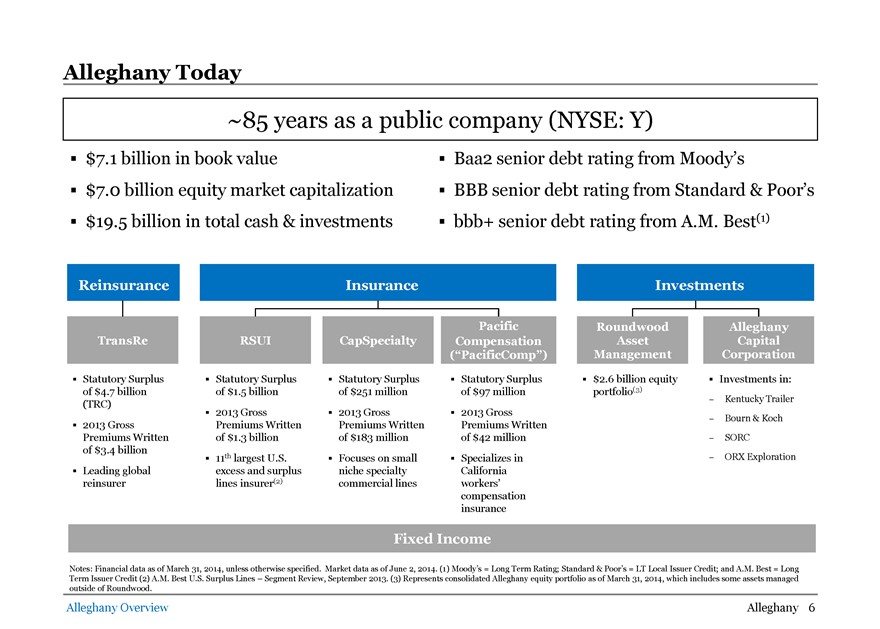
Alleghany Today ~85 years as a public company (NYSE: Y) $7.1 billion in book value Baa2 senior debt rating from Moody’s $7.0 billion equity market capitalization BBB senior debt rating from Standard & Poor’s $19.5 billion in total cash & investments bbb+ senior debt rating from A.M. Best(1) Reinsurance TransRe Statutory Surplus of $4.7 billion (TRC) 2013 Gross Premiums Written of $3.4 billion Leading global reinsurer Insurance CapSpecialty Statutory Surplus of $251 million 2013 Gross Premiums Written of $183 million Focuses on small niche specialty commercial lines Pacific Compensation (“PacificComp”) Statutory Surplus of $97 million 2013 Gross Premiums Written of $42 million Specializes in California workers’ compensation insurance Investments Roundwood Alleghany Asset Capital Management Corporation $2.6 billion equity Investments in: portfolio(3) - Kentucky Trailer - Bourn & Koch - SORC - ORX Exploration Fixed Income Notes: Financial data as of March 31, 2014, unless otherwise specified. Market data as of June 2, 2014. (1) Moody’s = Long Term Rating; Standard & Poor’s = LT Local Issuer Credit; and A.M. Best = Long Term Issuer Credit (2) A.M. Best U.S. Surplus Lines – Segment Review, September 2013. (3) Represents consolidated Alleghany equity portfolio as of March 31, 2014, which includes some assets managed outside of Roundwood. Alleghany Overview Alleghany 6
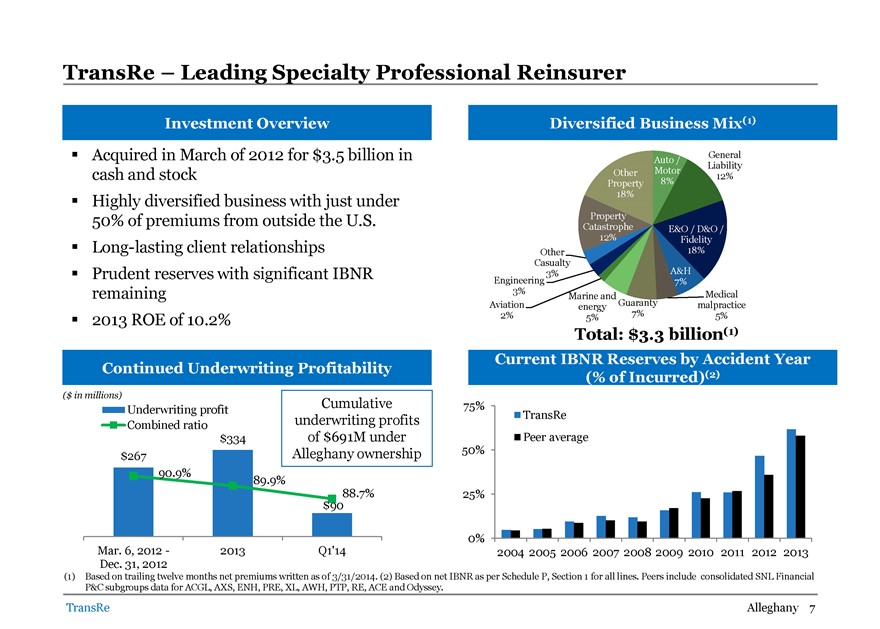
TransRe – Leading Specialty Professional Reinsurer Investment Overview Acquired in March of 2012 for $3.5 billion in cash and stock Highly diversified business with just under 50% of premiums from outside the U.S. Long-lasting client relationships Prudent reserves with significant IBNR remaining 2013 ROE of 10.2% Diversified Business Mix(1) General Auto / Liability Other Motor 12% Property 8% 18% Property Catastrophe E&O / D&O / 12% Fidelity Other 18% Casualty 3% A&H Engineering 7% 3% Medical Marine and Aviation energy Guaranty malpractice 2% 5% 7% 5% Total: $3.3 billion(1) Continued Underwriting Profitability ($ in millions) Cumulative Underwriting profit Combined ratio underwriting profits 400 $334 of $691M under 95.0% $267 Alleghany ownership 93.0% 300 90.9% 91.0% 200 89.9% 88.7% 89.0% $90 100 87.0% 0 85.0% Mar. 6, 2012 - 2013 Q1’14 Dec. 31, 2012 Current IBNR Reserves by Accident Year (% of Incurred)(2) 75% TransRe Peer average 50% 25% 0% 2004 2005 2006 2007 2008 2009 2010 2011 2012 2013 (1) Based on trailing twelve months net premiums written as of 3/31/2014. (2) Based on net IBNR as per Schedule P, Section 1 for all lines. Peers include consolidated SNL Financial P&C subgroups data for ACGL, AXS, ENH, PRE, XL, AWH, PTP, RE, ACE and Odyssey. TransRe Alleghany 7
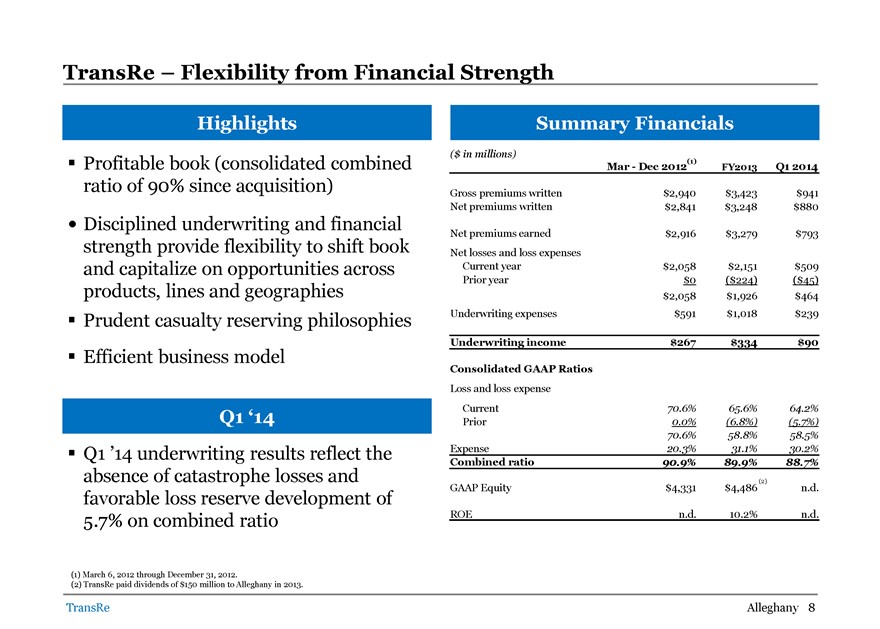
TransRe – Flexibility from Financial Strength Highlights Profitable book (consolidated combined ratio of 90% since acquisition) Disciplined underwriting and financial strength provide flexibility to shift book and capitalize on opportunities across products, lines and geographies Prudent casualty reserving philosophies Efficient business model Q1 ‘14 Q1 ’14 underwriting results reflect the absence of catastrophe losses and favorable loss reserve development of 5.7% on combined ratio Summary Financials ($ in millions) Mar - Dec 2012(1) FY2013 Q1 2014 Gross premiums written $2,940 $3,423 $941 Net premiums written $2,841 $3,248 $880 Net premiums earned $2,916 $3,279 $793 Net losses and loss expenses Current year $2,058 $2,151 $509 Prior year $0 ($224) ($45) $2,058 $1,926 $464 Underwriting expenses $591 $1,018 $239 Underwriting income $267 $334 $90 Consolidated GAAP Ratios Loss and loss expense Current 70.6% 65.6% 64.2% Prior 0.0% (6.8%) (5.7%) 70.6% 58.8% 58.5% Expense 20.3% 31.1% 30.2% Combined ratio 90.9% 89.9% 88.7% GAAP Equity $4,331 $4,486(2) n.d. ROE n.d. 10.2% n.d. (1) March 6, 2012 through December 31, 2012. (2) TransRe paid dividends of $150 million to Alleghany in 2013. TransRe Alleghany 8
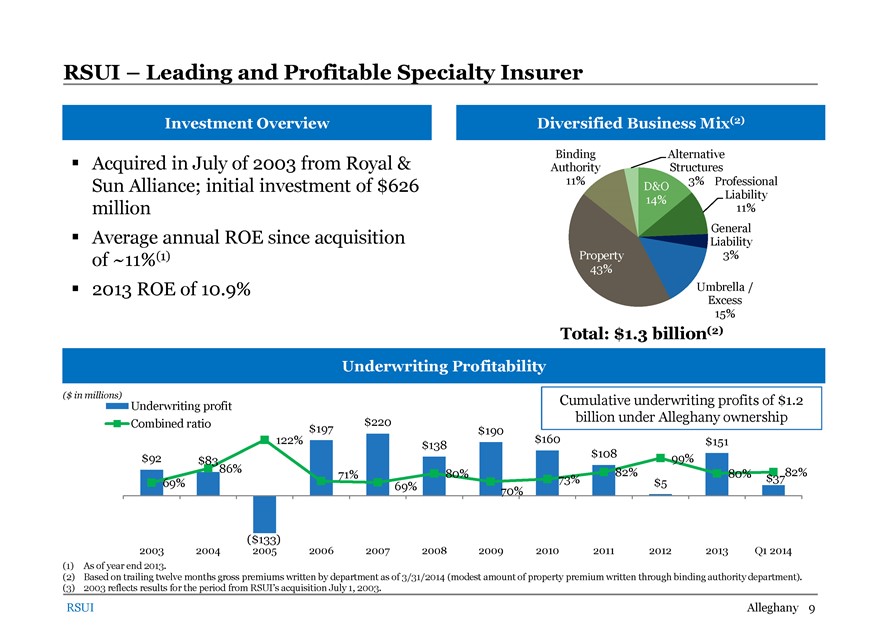
RSUI – Leading and Profitable Specialty Insurer Investment Overview Acquired in July of 2003 from Royal & Sun Alliance; initial investment of $626 million Average annual ROE since acquisition of ~11%(1) 2013 ROE of 10.9% Diversified Business Mix(2) Binding Alternative Authority Structures 11% 3% Professional D&O 14% Liability 11% General Liability Property 3% 43% Umbrella / Excess 15% Total: $1.3 billion(2) Underwriting Profitability ($ in millions) Cumulative underwriting profits of $1.2 Underwriting profit $220 billion under Alleghany ownership 250.0 Combined ratio $197 200.0 $190 122% $160 $151 $138 150.0 $92 $108 99% $83 100.0 86% 82% 82% 71% 80% 80% $37 50.0 69% 73% $5 0.0 69% 70% (50.0) (100.0) (150.0) ($133) 0. 2003 2004 2005 2006 2007 2008 2009 2010 2011 2012 2013 Q1 2014 (1) As of year end 2013. (2) Based on trailing twelve months gross premiums written by department as of 3/31/2014 (modest amount of property premium written through binding authority department). (3) 2003 reflects results for the period from RSUI’s acquisition July 1, 2003. RSUI Alleghany 9
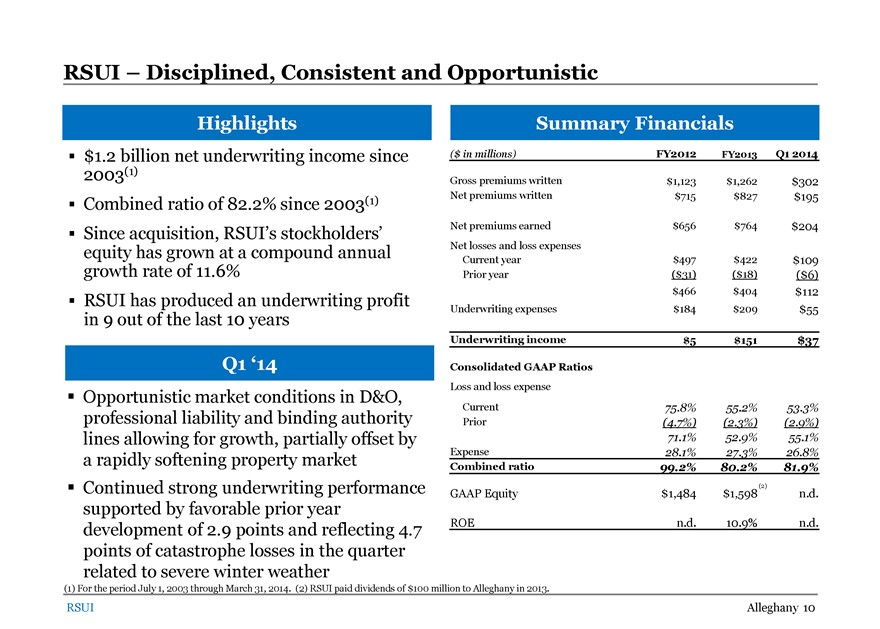
RSUI – Disciplined, Consistent and Opportunistic Highlights $1.2 billion net underwriting income since 2003(1) Combined ratio of 82.2% since 2003(1) Since acquisition, RSUI’s stockholders’ equity has grown at a compound annual growth rate of 11.6% RSUI has produced an underwriting profit in 9 out of the last 10 years Q1 ‘14 Opportunistic market conditions in D&O, professional liability and binding authority lines allowing for growth, partially offset by a rapidly softening property market Continued strong underwriting performance supported by favorable prior year development of 2.9 points and reflecting 4.7 points of catastrophe losses in the quarter related to severe winter weather Summary Financials ($ in millions) FY2012 FY2013 Q1 2014 Gross premiums written $1,123 $1,262 $302 Net premiums written $715 $827 $195 Net premiums earned $656 $764 $204 Net losses and loss expenses Current year $497 $422 $109 Prior year ($31) ($18) ($6) $466 $404 $112 Underwriting expenses $184 $209 $55 Underwriting income $5 $151 $37 Consolidated GAAP Ratios Loss and loss expense Current 75.8% 55.2% 53.3% Prior (4.7%) (2.3%) (2.9%) 71.1% 52.9% 55.1% Expense 28.1% 27.3% 26.8% Combined ratio 99.2% 80.2% 81.9% (2) GAAP Equity $1,484 $1,598 n.d. ROE n.d. 10.9% n.d. (1) For the period July 1, 2003 through March 31, 2014. (2) RSUI paid dividends of $100 million to Alleghany in 2013. RSUI Alleghany 10
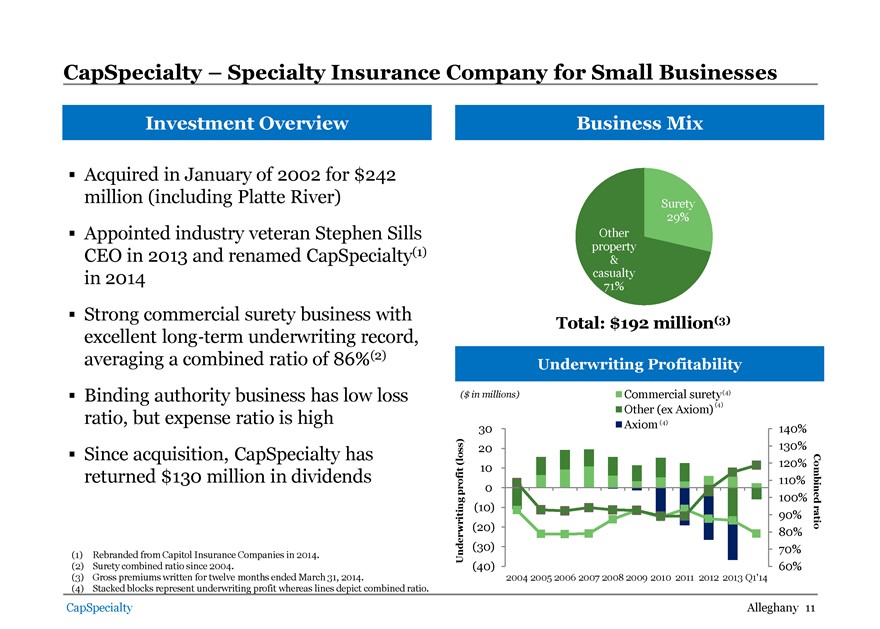
CapSpecialty – Specialty Insurance Company for Small Businesses Investment Overview Acquired in January of 2002 for $242 million (including Platte River) Appointed industry veteran Stephen Sills CEO in 2013 and renamed CapSpecialty(1) in 2014 Strong commercial surety business with excellent long-term underwriting record, averaging a combined ratio of 86%(2) Binding authority business has low loss ratio, but expense ratio is high Since acquisition, CapSpecialty has returned $130 million in dividends Business Mix Surety 29% Other property & casualty 71% Total: $192 million(3) Underwriting Profitability ($ in millions) Commercial surety(4) Other (ex Axiom) (4) Axiom (4) 30 140% 130% (loss) 20 10 120% 110% profit 0 100% Combined (10) 90% ratio (20) 80% Underwriting (30) 70% (40) 60% 2004 2005 2006 2007 2008 2009 2010 2011 2012 2013 Q1’14 (1) Rebranded from Capitol Insurance Companies in 2014. (2) Surety combined ratio since 2004. (3) Gross premiums written for twelve months ended March 31, 2014. (4) Stacked blocks represent underwriting profit whereas lines depict combined ratio. CapSpecialty Alleghany 11
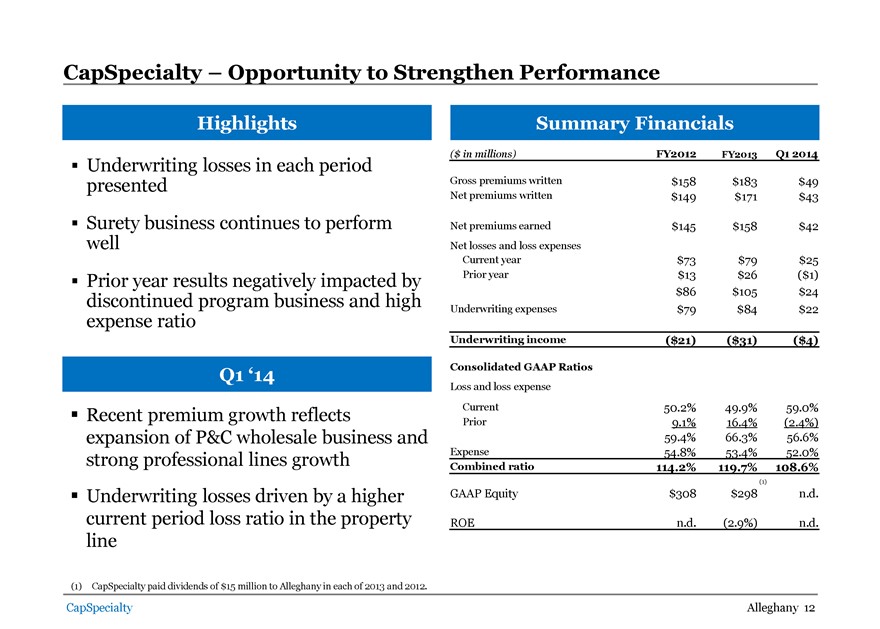
CapSpecialty – Opportunity to Strengthen Performance Highlights Underwriting losses in each period presented Surety business continues to perform well Prior year results negatively impacted by discontinued program business and high expense ratio Q1 ‘14 Recent premium growth reflects expansion of P&C wholesale business and strong professional lines growth Underwriting losses driven by a higher current period loss ratio in the property line Summary Financials ($ in millions) FY2012 FY2013 Q1 2014 Gross premiums written $158 $183 $49 Net premiums written $149 $171 $43 Net premiums earned $145 $158 $42 Net losses and loss expenses Current year $73 $79 $25 Prior year $13 $26 ($1) $86 $105 $24 Underwriting expenses $79 $84 $22 Underwriting income ($21) ($31) ($4) Consolidated GAAP Ratios Loss and loss expense Current 50.2% 49.9% 59.0% Prior 9.1% 16.4% (2.4%) 59.4% 66.3% 56.6% Expense 54.8% 53.4% 52.0% Combined ratio 114.2% 119.7% 108.6% (1) GAAP Equity $308 $298 n.d. ROE n.d. (2.9%) n.d. (1) CapSpecialty paid dividends of $15 million to Alleghany in each of 2013 and 2012. CapSpecialty Alleghany 12
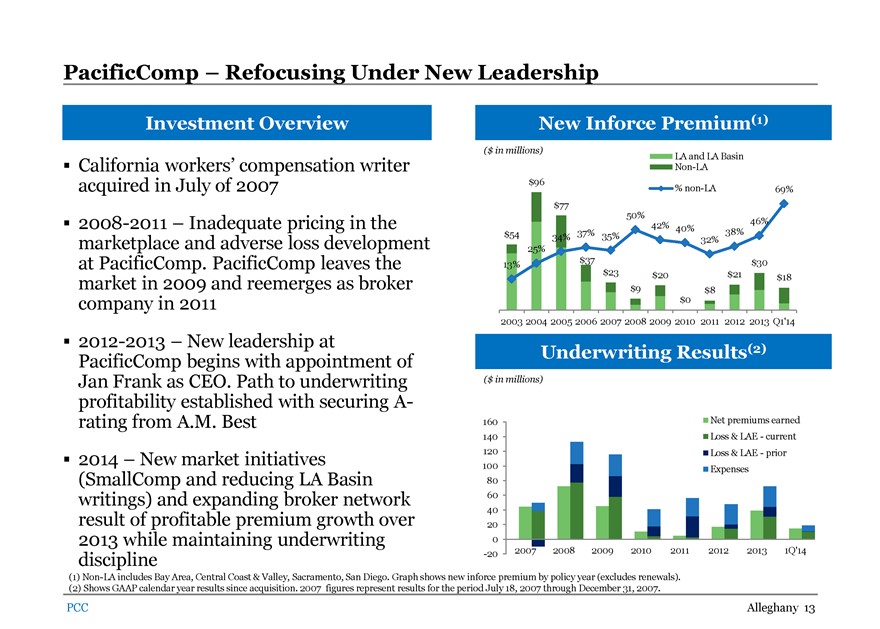
PacificComp – Refocusing Under New Leadership Investment Overview California workers’ compensation writer acquired in July of 2007 2008-2011 – Inadequate pricing in the marketplace and adverse loss development at PacificComp. PacificComp leaves the market in 2009 and reemerges as broker company in 2011 2012-2013 – New leadership at PacificComp begins with appointment of Jan Frank as CEO. Path to underwriting profitability established with securing A- rating from A.M. Best 2014 – New market initiatives (SmallComp and reducing LA Basin writings) and expanding broker network result of profitable premium growth over 2013 while maintaining underwriting discipline New Inforce Premium(1) ($ in millions) LA and LA Basin Non-LA 90% $96 100.0 % non-LA 69% $77 70% 80.0 50% 46% 42% 40% 50% $54 37% 35% 38% 60.0 34% 32% 25% $37 30% 40.0 13% $30 $23 $20 $21 $18 20.0 10% $9 $8 $0 0.0 -10% 2003 2004 2005 2006 2007 2008 2009 2010 2011 2012 2013 Q1’14 Underwriting Results(2) ($ in millions) 160 Net premiums earned 140 Loss & LAE - current 120 Loss & LAE - prior 100 Expenses 80 60 40 20 0 -20 2007 2008 2009 2010 2011 2012 2013 1Q’14 (1) Non-LA includes Bay Area, Central Coast & Valley, Sacramento, San Diego. Graph shows new inforce premium by policy year (excludes renewals). (2) Shows GAAP calendar year results since acquisition. 2007 figures represent results for the period July 18, 2007 through December 31, 2007. PCC Alleghany 13

PacificComp – Improving Underwriting and Financial Performance Highlights After ceasing new business writings entirely in 2009, PacificComp began writing a very modest amount of new business in 2011 and has increased growth as conditions have improved New business focus on San Diego, Central and Northern California Expense ratio improving as premium growth resumes Q1 ‘14 Further loss development from prior years has slowed significantly as new claims leadership focuses on closing legacy claims Underwriting losses lower compared to 2013, largely a result of premium growth (1) Includes AIHLRe. Summary Financials(1) ($ in millions) FY2012 FY2013 Q1 2014 Gross premiums written $19 $42 $16 Net premiums written $19 $41 $16 Net premiums earned $17 $39 $14 Net losses and loss expenses Current year $15 $31 $10 Prior year $6 $13 $1 $20 $44 $11 Underwriting expenses $28 $28 $8 Underwriting income ($31) ($33) ($5) Consolidated GAAP Ratios Loss and loss expense Current 86.8% 79.7% 71.5% Prior 33.2% 33.9% 4.2% 120.0% 113.6% 75.7% Expense 166.5% 71.7% 55.5% Combined ratio 286.5% 185.3% 131.2% GAAP Equity $127 $104 n.d. ROE n.d. (16.1%) n.d. PCC Alleghany 14
Jack Sennott Senior Vice President and chief financial officer
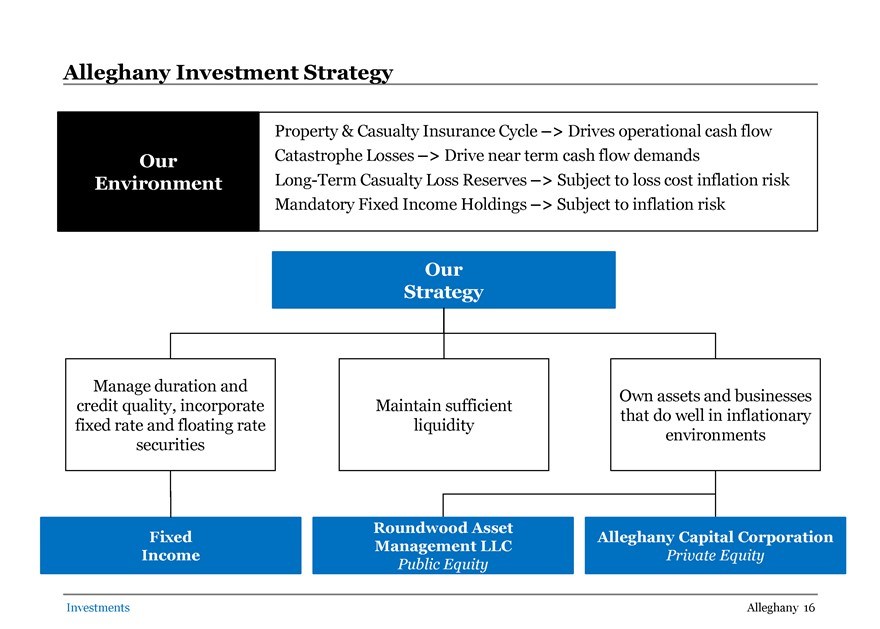
Alleghany Investment Strategy Property & Casualty Insurance Cycle –> Drives operational cash flow Our Catastrophe Losses –> Drive near term cash flow demands Environment Long-Term Casualty Loss Reserves –> Subject to loss cost inflation risk Mandatory Fixed Income Holdings –> Subject to inflation risk Our Strategy Manage duration and Own assets and businesses credit quality, incorporate Maintain sufficient that do well in inflationary fixed rate and floating rate liquidity environments securities Roundwood Asset Fixed Alleghany Capital Corporation Management LLC Income Private Equity Public Equity Investments Alleghany 16
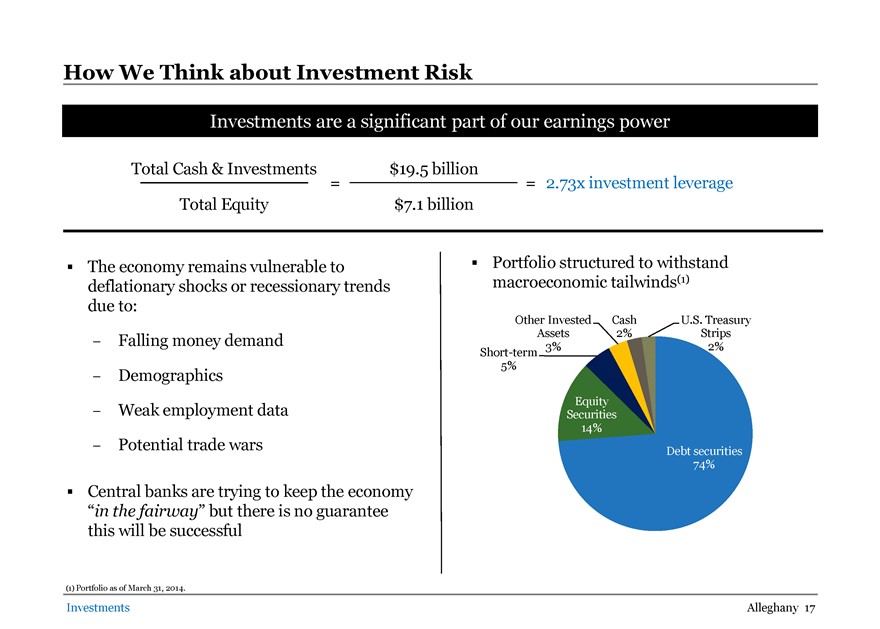
How We Think about Investment Risk Investments are a significant part of our earnings power Total Cash & Investments $19.5 billion = = 2.73x investment leverage Total Equity $7.1 billion The economy remains vulnerable to Portfolio structured to withstand deflationary shocks or recessionary trends macroeconomic tailwinds(1) due to: Other Invested Cash U.S. Treasury money demand Assets 2% Strips - Falling Short-term 3% 2% 5% - Demographics Equity - Weak employment data Securities 14% - Potential trade wars Debt securities 74% Central banks are trying to keep the economy “in the fairway” but there is no guarantee this will be successful (1) Portfolio as of March 31, 2014. Investments Alleghany 17
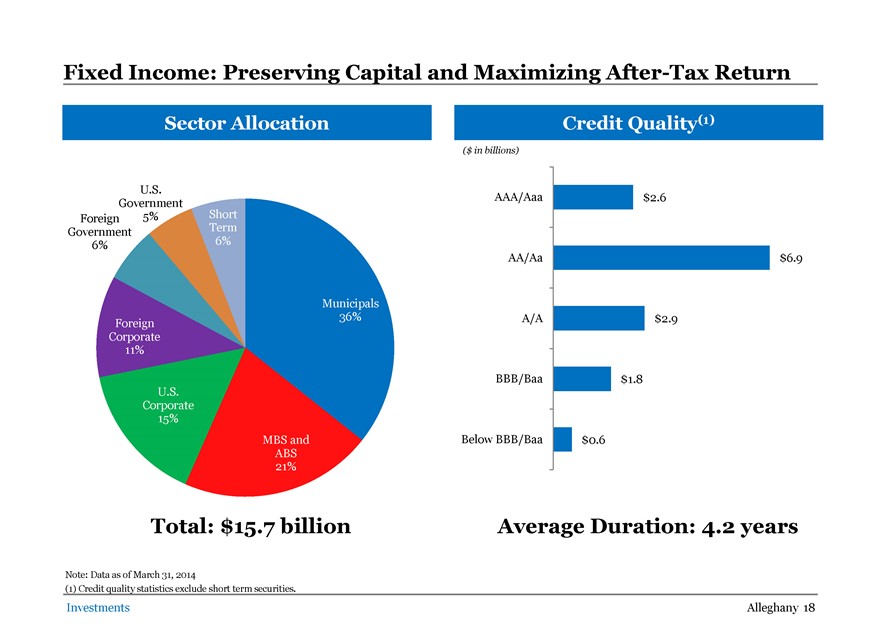
Fixed Income: Preserving Capital and Maximizing After-Tax Return Sector Allocation Credit Quality(1) ($ in billions) U.S. AAA/Aaa $2.6 Government Short Foreign 5% Term Government 6% 6% AA/Aa $6.9 Municipals 36% A/A $2.9 Foreign Corporate 11% BBB/Baa $1.8 U.S. Corporate 15% MBS and Below BBB/Baa $0.6 ABS 21% Total: $15.7 billion Average Duration: 4.2 years Note: Data as of March 31, 2014 (1) Credit quality statistics exclude short term securities. Investments Alleghany 18
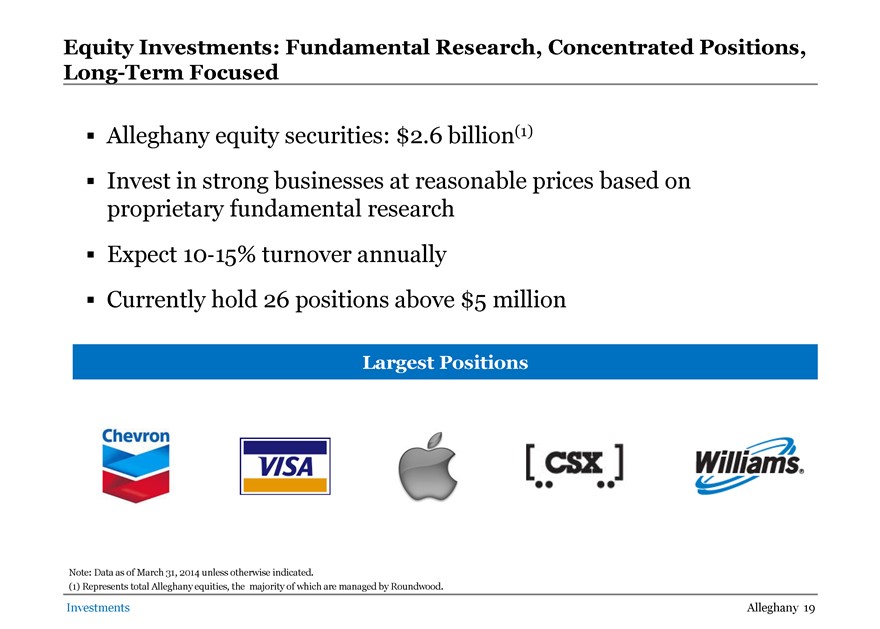
Equity Investments: Fundamental Research, Concentrated Positions, Long-Term Focused Alleghany equity securities: $2.6 billion(1) Invest in strong businesses at reasonable prices based on proprietary fundamental research Expect 10-15% turnover annually Currently hold 26 positions above $5 million Largest Positions Note: Data as of March 31, 2014 unless otherwise indicated. (1) Represents total Alleghany equities, the majority of which are managed by Roundwood. Investments Alleghany 19 Chevron VISA CSX Williams
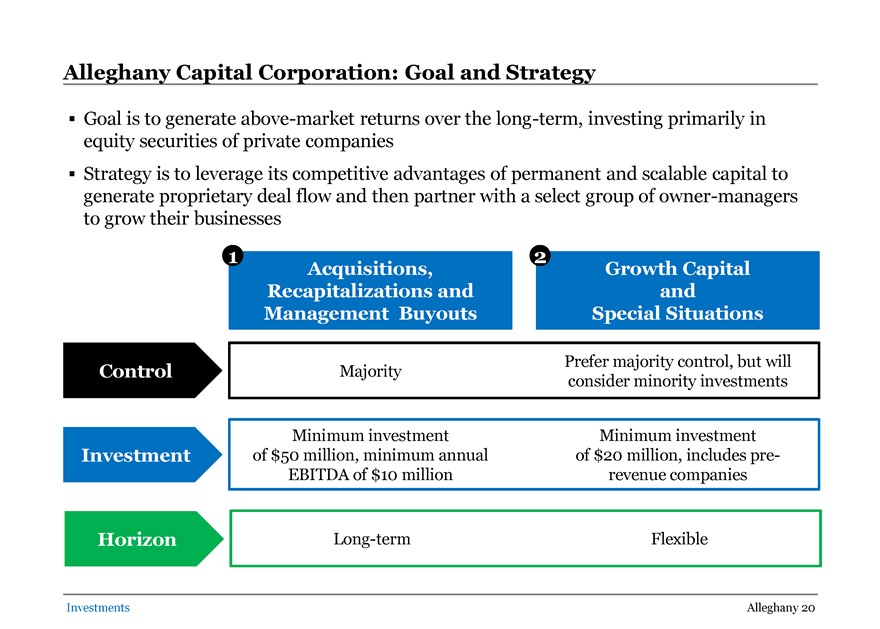
Alleghany Capital Corporation: Goal and Strategy Goal is to generate above-market returns over the long-term, investing primarily in equity securities of private companies Strategy is to leverage its competitive advantages of permanent and scalable capital to generate proprietary deal flow and then partner with a select group of owner-managers to grow their businesses 1 2 Acquisitions, Growth Capital Recapitalizations and and Management Buyouts Special Situations Prefer majority control, but will Control Majority consider minority investments Minimum investment Minimum investment Investment of $50 million, minimum annual of $20 million, includes pre-EBITDA of $10 million revenue companies Horizon Long-term Flexible Investments Alleghany 20
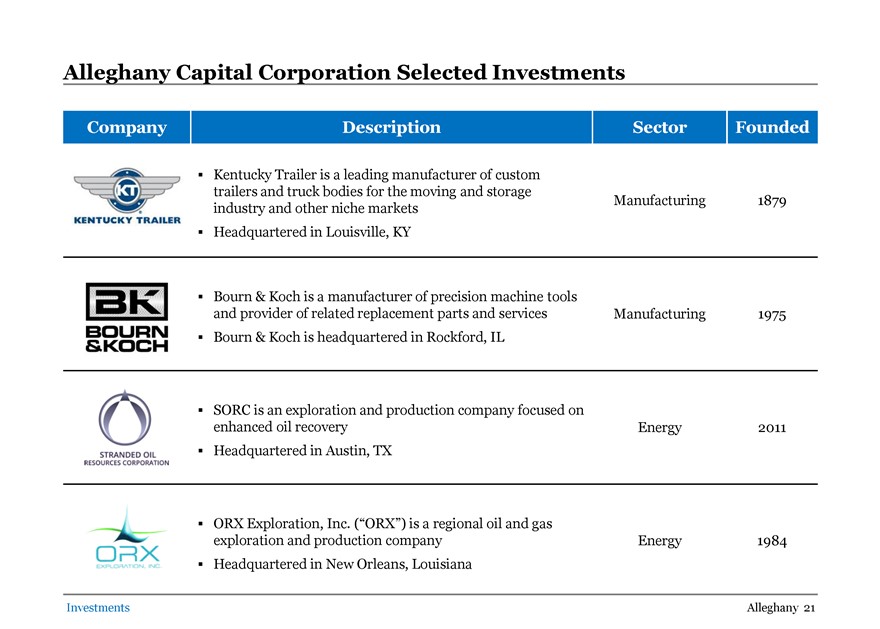
Alleghany Capital Corporation Selected Investments Company Description Sector Founded Kentucky Trailer is a leading manufacturer of custom trailers and truck bodies for the moving and storage Manufacturing 1879 industry and other niche markets Headquartered in Louisville, KY of precision machine tools Bourn & Koch is a manufacturer and provider of related replacement parts and services Manufacturing 1975 Bourn & Koch is headquartered in Rockford, IL SORC is an exploration and production company focused on enhanced oil recovery Energy 2011 Headquartered in Austin, TX Exploration, Inc. (“ORX”) is a regional oil and gas oration and production company Energy 1984 Headquartered in New Orleans, Louisiana Investments Alleghany 21 KENTUCKY TRAILER BOURN&KOCH STRANDED OIL RESOURCES CORPORATION ORX
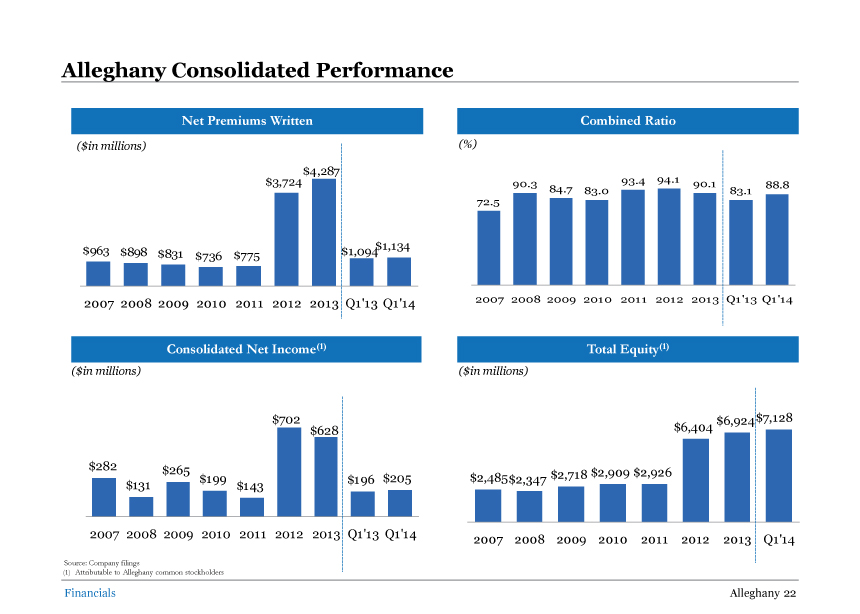
Alleghany Consolidated Performance Net Premiums Written Combined Ratio ($in millions) (%) $4,287 $3,724 90.3 93.4 94.1 90.1 84.7 88.8 83.0 83.1 72.5 $963 $1,134 $898 $831 $736 $775 $1,093 2007 2008 2009 2010 2011 2012 2013 Q1’13 Q1’14 2007 2008 2009 2010 2011 2012 2013 Q1’13 Q1’14 Consolidated Net Income(1) Total Equity(1) ($in millions) ($in millions) $702 $6,924$7,128 $628 $6,404 $299 $271 $205 $2,485 $2,718 $2,909 $2,926 $199 $196 $2,347 $148 $143 2007 2008 2009 2010 2011 2012 2013 Q1’13 Q1’14 2007 2008 2009 2010 2011 2012 2013 Q1’14 Source: Company filings (1) Attributable to Alleghany stockholders Financials Alleghany 22
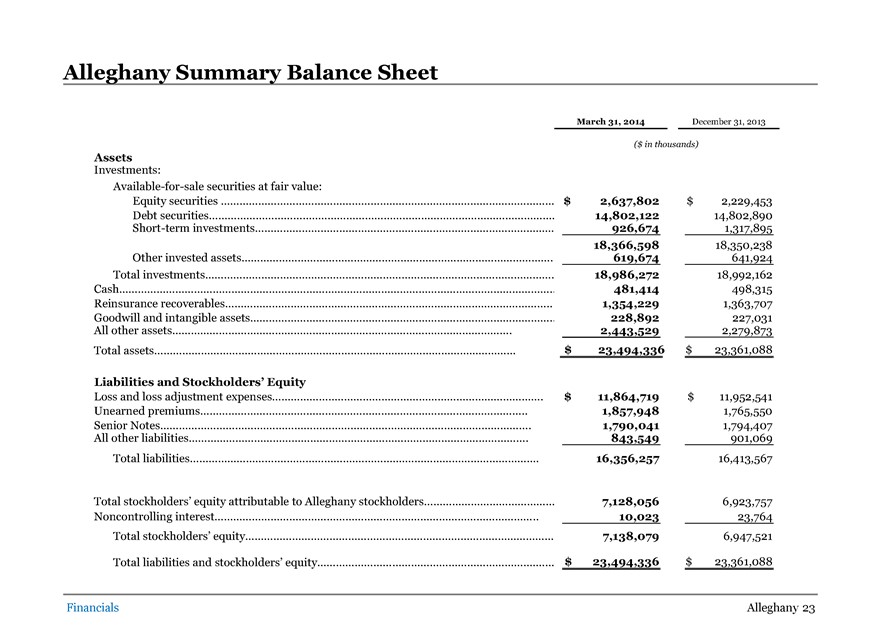
Alleghany Summary Balance Sheet March 31, 2014 December 31, 2013 ($ in thousands) Assets Investments: Available-for-sale securities at fair value: Equity securities 2,637,802$ $ 2,229,453 Debt securities 14,802,122 14,802,890 Short-term investments 926,674 1,317,895 18,366,598 18,350,238 Other invested assets 619,674 641,924 Total investments 18,986,272 18,992,162 Cash 481,414 498,315 Reinsurance recoverables 1,354,229 1,363,707 Goodwill and intangible assets 228,892 227,031 All other assets 2,443,529 2,279,873 Total assets $ 23,494,336 $ 23,361,088 Liabilities and Stockholders’ Equity Loss and loss adjustment expenses $ 11,864,719 $ 11,952,541 Unearned premiums 1,857,948 1,765,550 Senior Notes 1,790,041 1,794,407 All other liabilities 843,549 901,069 Total liabilities 16,356,257 16,413,567 Total stockholders’ equity attributable to Alleghany stockholders 7,128,056 6,923,757 Noncontrolling interest 10,023 23,764 Total stockholders’ equity 7,138,079 6,947,521 Total liabilities and stockholders’ equity $ 23,494,336 $ 23,361,088 Financials Alleghany 23
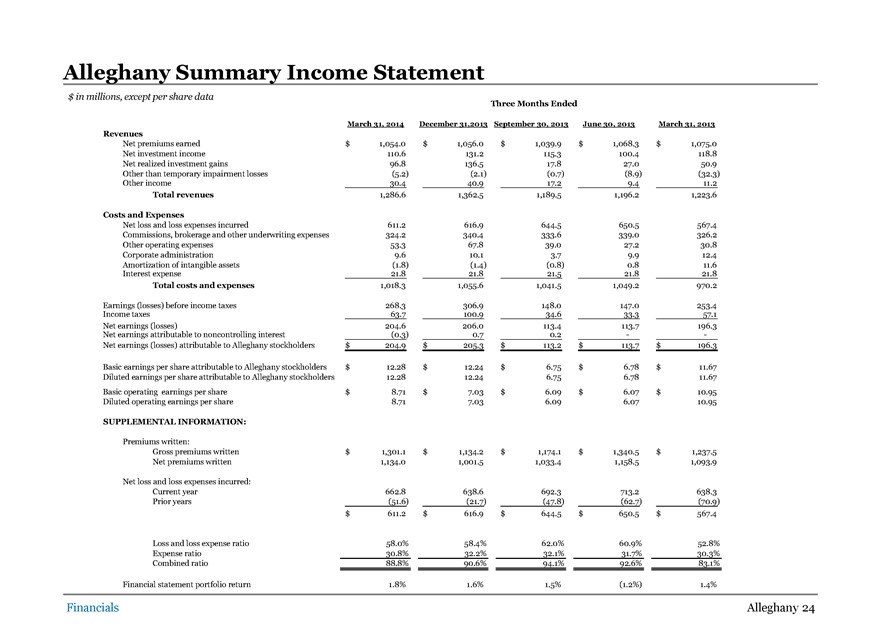
Alleghany Summary Income Statement $ in millions, except per share data Three Months Ended March 31, 2014 December 31,2013 September 30, 2013 June 30, 2013 March 31, 2013 Revenues Net premiums earned $ 1,054.0 $ 1,056.0 $ 1,039.9 $ 1,068.3 $ 1,075.0 Net investment income 110.6 131.2 115.3 100.4 118.8 Net realized investment gains 96.8 136.5 17.8 27.0 50.9 Other than temporary impairment losses (5.2) (2.1) (0.7) (8.9) (32.3) Other income 30.4 40.9 17.2 9.4 11.2 Total revenues 1,286.6 1,362.5 1,189.5 1,196.2 1,223.6 Costs and Expenses Net loss and loss expenses incurred 611.2 616.9 644.5 650.5 567.4 Commissions, brokerage and other underwriting expenses 324.2 340.4 333.6 339.0 326.2 Other operating expenses 53.3 67.8 39.0 27.2 30.8 Corporate administration 9.6 10.1 3.7 9.9 12.4 Amortization of intangible assets (1.8) (1.4) (0.8) 0.8 11.6 Interest expense 21.8 21.8 21.5 21.8 21.8 Total costs and expenses 1,018.3 1,055.6 1,041.5 1,049.2 970.2 Earnings (losses) before income taxes 268.3 306.9 148.0 147.0 253.4 Income taxes 63.7 100.9 34.6 33.3 57.1 Net earnings (losses) 204.6 206.0 113.4 113.7 196.3 Net earnings attributable to noncontrolling interest (0.3) 0.7 0.2 - -Net earnings (losses) attributable to Alleghany stockholders $ 204.9 $ 205.3 $ 113.2 $ 113.7 $ 196.3 Basic earnings per share attributable to Alleghany stockholders $ 12.28 $ 12.24 $ 6.75 $ 6.78 $ 11.67 Diluted earnings per share attributable to Alleghany stockholders 12.28 12.24 6.75 6.78 11.67 Basic operating earnings per share $ 8.71 $ 7.03 $ 6.09 $ 6.07 $ 10.95 Diluted operating earnings per share 8.71 7.03 6.09 6.07 10.95 SUPPLEMENTAL INFORMATION: Premiums written: Gross premiums written $ 1,301.1 $ 1,134.2 $ 1,174.1 $ 1,340.5 $ 1,237.5 Net premiums written 1,134.0 1,001.5 1,033.4 1,158.5 1,093.9 Net loss and loss expenses incurred: Current year 662.8 638.6 692.3 713.2 638.3 Prior years (51.6) (21.7) (47.8) (62.7) (70.9) $ 611.2 $ 616.9 $ 644.5 $ 650.5 $ 567.4 Loss and loss expense ratio 58.0% 58.4% 62.0% 60.9% 52.8% Expense ratio 30.8% 32.2% 32.1% 31.7% 30.3% Combined ratio 88.8% 90.6% 94.1% 92.6% 83.1% Financial statement portfolio return 1.8% 1.6% 1.5% (1.2%) 1.4% Financials Alleghany 24
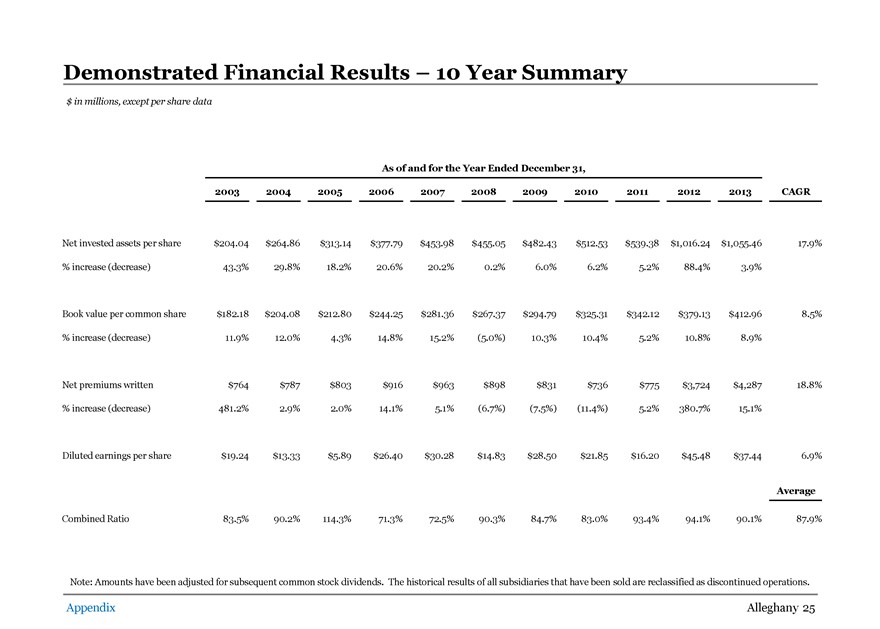
Demonstrated Financial Results – 10 Year Summary $ in millions, except per share data As of and for the Year Ended December 31, 2003 2004 2005 2006 2007 2008 2009 2010 2011 2012 2013 CAGR Net invested assets per share $204.04 $264.86 $313.14 $377.79 $453.98 $455.05 $482.43 $512.53 $539.38 $1,016.24 $1,055.46 17.9% % increase (decrease) 43.3% 29.8% 18.2% 20.6% 20.2% 0.2% 6.0% 6.2% 5.2% 88.4% 3.9% Book value per common share $182.18 $204.08 $212.80 $244.25 $281.36 $267.37 $294.79 $325.31 $342.12 $379.13 $412.96 8.5% % increase (decrease) 11.9% 12.0% 4.3% 14.8% 15.2% (5.0%) 10.3% 10.4% 5.2% 10.8% 8.9% Net premiums written $764 $787 $803 $916 $963 $898 $831 $736 $775 $3,724 $4,287 18.8% % increase (decrease) 481.2% 2.9% 2.0% 14.1% 5.1% (6.7%) (7.5%) (11.4%) 5.2% 380.7% 15.1% Diluted earnings per share $19.24 $13.33 $5.89 $26.40 $30.28 $14.83 $28.50 $21.85 $16.20 $45.48 $37.44 6.9% Average Combined Ratio 83.5% 90.2% 114.3% 71.3% 72.5% 90.3% 84.7% 83.0% 93.4% 94.1% 90.1% 87.9% Note: Amounts have been adjusted for subsequent common stock dividends. The historical results of all subsidiaries that have been sold are reclassified as discontinued operations. Appendix Alleghany 25
Weston Hicks Summary and Outlook
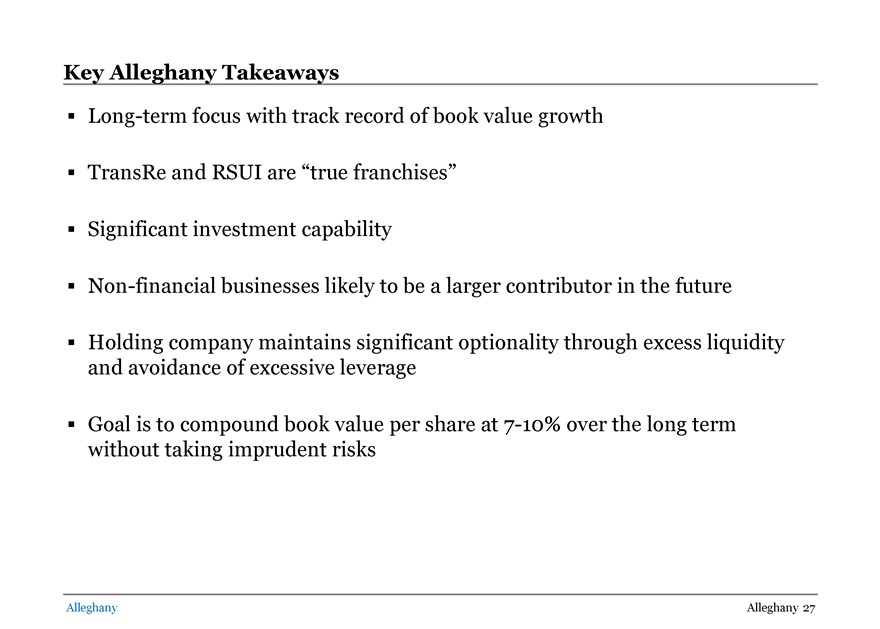
Key Alleghany Takeaways Long-term focus with track record of book value growth TransRe and RSUI are “true franchises” Significant investment capability Non-financial businesses likely to be a larger contributor in the future Holding company maintains significant optionality through excess liquidity and avoidance of excessive leverage Goal is to compound book value per share at 7-10% over the long term without taking imprudent risks Alleghany Alleghany 27