Attached files
| file | filename |
|---|---|
| EXCEL - IDEA: XBRL DOCUMENT - ALLEGHANY CORP /DE | Financial_Report.xls |
| EX-21 - EX-21 - ALLEGHANY CORP /DE | d840943dex21.htm |
| EX-95 - EX-95 - ALLEGHANY CORP /DE | d840943dex95.htm |
| EX-32.2 - EX-32.2 - ALLEGHANY CORP /DE | d840943dex322.htm |
| EX-31.1 - EX-31.1 - ALLEGHANY CORP /DE | d840943dex311.htm |
| EX-31.2 - EX-31.2 - ALLEGHANY CORP /DE | d840943dex312.htm |
| EX-32.1 - EX-32.1 - ALLEGHANY CORP /DE | d840943dex321.htm |
| EX-23.1 - EX-23.1 - ALLEGHANY CORP /DE | d840943dex231.htm |
| EX-12.1 - EX-12.1 - ALLEGHANY CORP /DE | d840943dex121.htm |
Table of Contents
UNITED STATES SECURITIES AND EXCHANGE COMMISSION
Washington, D.C. 20549
Form 10-K
| þ | ANNUAL REPORT PURSUANT TO SECTION 13 OR 15(d) OF THE SECURITIES EXCHANGE ACT OF 1934 |
For the fiscal year ended December 31, 2014
or
| ¨ | TRANSITION REPORT PURSUANT TO SECTION 13 OR 15(d) OF THE SECURITIES EXCHANGE ACT OF 1934 |
For the transition period from to
Commission file number 1-9371
ALLEGHANY CORPORATION
(Exact name of registrant as specified in its charter)
| Delaware | 51-0283071 | |
| (State or other jurisdiction of incorporation or organization) |
(I.R.S. Employer Identification Number) | |
| 7 Times Square Tower, New York, New York |
10036 | |
| (Address of principal executive offices) | (Zip Code) | |
Registrant’s telephone number, including area code:
212-752-1356
Securities registered pursuant to Section 12(b) of the Act:
| Title of Each Class |
Name of Each Exchange on Which Registered | |
| Common Stock, $1.00 par value | New York Stock Exchange |
Securities registered pursuant to Section 12(g) of the Act:
Not applicable
Indicate by check mark if the registrant is a well-known seasoned issuer, as defined in Rule 405 of the Securities Act.
Yes þ No ¨
Indicate by check mark if the registrant is not required to file reports pursuant to Section 13 or Section 15(d) of the Act.
Yes ¨ No þ
Indicate by check mark whether the registrant (1) has filed all reports required to be filed by Section 13 or 15(d) of the Securities Exchange Act of 1934 during the preceding 12 months (or for such shorter period that the registrant was required to file such reports), and (2) has been subject to such filing requirements for the past 90 days.
Yes þ No ¨
Indicate by check mark whether the registrant has submitted electronically and posted on its corporate Web site, if any, every Interactive Data File required to be submitted and posted pursuant to Rule 405 of Regulation S-T (§ 232.405 of this chapter) during the preceding 12 months (or for such shorter period that the registrant was required to submit and post such files.
Yes þ No ¨
Indicate by check mark if disclosure of delinquent filers pursuant to Item 405 of Regulation S-K is not contained herein, and will not be contained, to the best of registrant’s knowledge, in definitive proxy or information statements incorporated by reference in Part III of this Form 10-K or any amendment to this Form 10-K. ¨
Indicate by check mark whether the registrant is a large accelerated filer, an accelerated filer, a non-accelerated filer, or a smaller reporting company. See the definitions of “large accelerated filer,” “accelerated filer” and “smaller reporting company” in Rule 12b-2 of the Exchange Act. (Check one):
| Large accelerated filer þ |
Accelerated filer ¨ | Non-accelerated filer ¨ | Smaller reporting company ¨ | |||
| (Do not check if a smaller reporting company) | ||||||
Indicate by check mark whether the registrant is a shell company.
Yes ¨ No þ
The aggregate market value of voting and non-voting common shares held by non-affiliates of the registrant as of June 30, 2014 (the last business day of the registrant’s most recently completed second fiscal quarter) was approximately $6,908,861,926 based on the closing sale price of the registrant’s common shares on the New York Stock Exchange on that date.
As of February 16, 2015, 16,003,568 shares of the registrant’s common stock, par value $1.00 per share, were outstanding.
DOCUMENTS INCORPORATED BY REFERENCE
Portions of the registrant’s definitive proxy statement relating to the Annual Meeting of Stockholders of Alleghany Corporation to be held on April 24, 2015 to be filed with the Securities and Exchange Commission pursuant to Regulation 14A are incorporated by reference into Part III of this Annual Report on Form 10-K.
Table of Contents
ALLEGHANY CORPORATION
23
Table of Contents
ALLEGHANY CORPORATION
References in this Annual Report on Form 10-K for the year ended December 31, 2014, or this “Form 10-K,” to the “Company,” “Alleghany,” “we,” “us,” and “our” refer to Alleghany Corporation and its consolidated subsidiaries unless the context otherwise requires. In addition, unless the context otherwise requires, references to
| Ÿ | “TransRe” are to our wholly-owned reinsurance holding company subsidiary Transatlantic Holdings, Inc. and its subsidiaries, |
| Ÿ | “AIHL” are to our wholly-owned insurance holding company subsidiary Alleghany Insurance Holdings LLC, |
| Ÿ | “RSUI” are to our wholly-owned subsidiary RSUI Group, Inc. and its subsidiaries, |
| Ÿ | “CapSpecialty” are to our wholly-owned subsidiary CapSpecialty, Inc. (formerly known as Capitol Transamerica Corporation) and its subsidiaries, |
| Ÿ | “PacificComp” are to our wholly-owned subsidiary Pacific Compensation Corporation and its subsidiaries, |
| Ÿ | “AIHL Re” are to our wholly-owned subsidiary AIHL Re LLC, |
| Ÿ | “Roundwood” are to our wholly-owned subsidiary Roundwood Asset Management LLC, |
| Ÿ | “ACC” are to our wholly-owned subsidiary Alleghany Capital Corporation, |
| Ÿ | “SORC” are to our wholly-owned subsidiary Stranded Oil Resources Corporation and its subsidiaries, |
| Ÿ | “Bourn & Koch” are to our majority-owned subsidiary Bourn & Koch, Inc., |
| Ÿ | “Kentucky Trailer” are to our majority-owned subsidiary R.C. Tway Company, LLC, and |
| Ÿ | “Alleghany Properties” are to our wholly-owned subsidiary Alleghany Properties Holdings LLC and its subsidiaries. |
NOTE ON FORWARD-LOOKING STATEMENTS
This Form 10-K contains disclosures which are forward-looking statements as defined in the Private Securities Litigation Reform Act of 1995. Forward-looking statements include all statements that do not relate solely to historical or current facts, and can be identified by the use of words such as “may,” “will,” “expect,” “project,” “estimate,” “anticipate,” “plan,” “believe,” “potential,” “should” or the negative versions of those words or other comparable words. These forward-looking statements are based upon our current plans or expectations and are subject to a number of uncertainties and risks that could significantly affect current plans, anticipated actions and our future financial condition and results. These statements are not guarantees of future performance, and we have no specific intention to update these statements. The uncertainties and risks include, but are not limited to,
| Ÿ | significant weather-related or other natural or man-made catastrophes and disasters; |
| Ÿ | the cyclical nature of the property and casualty reinsurance and insurance industries; |
| Ÿ | changes in market prices of our significant equity investments and changes in value of our debt securities portfolio; |
| Ÿ | adverse loss development for events insured by our reinsurance and insurance subsidiaries in either the current year or prior years; |
| Ÿ | the long-tail and potentially volatile nature of certain casualty lines of business written by our reinsurance and insurance subsidiaries; |
| Ÿ | the cost and availability of reinsurance; |
| Ÿ | the reliance by our reinsurance operating subsidiaries on a limited number of brokers; |
| Ÿ | increases in the levels of risk retention by our reinsurance and insurance subsidiaries; |
| Ÿ | exposure to terrorist acts and acts of war; |
24
Table of Contents
| Ÿ | the willingness and ability of our reinsurance and insurance subsidiaries’ reinsurers to pay reinsurance recoverables owed to our reinsurance and insurance subsidiaries; |
| Ÿ | changes in the ratings assigned to our reinsurance and insurance subsidiaries; |
| Ÿ | claims development and the process of estimating reserves; |
| Ÿ | legal, political, judicial and regulatory changes, including the federal financial regulatory reform of the insurance industry by the Dodd-Frank Wall Street Reform and Consumer Protection Act; |
| Ÿ | the uncertain nature of damage theories and loss amounts; |
| Ÿ | the loss of key personnel of our reinsurance or insurance operating subsidiaries; |
| Ÿ | fluctuation in foreign currency exchange rates; |
| Ÿ | the failure to comply with the restrictive covenants contained in the agreements governing our indebtedness; |
| Ÿ | the ability to make payments on, or repay or refinance, our debt; |
| Ÿ | risks inherent in international operations; and |
| Ÿ | difficult and volatile conditions in the global market. |
Additional risks and uncertainties include general economic and political conditions, including the effects of a prolonged U.S. or global economic downturn or recession; changes in costs; variations in political, economic or other factors; risks relating to conducting operations in a competitive environment; effects of acquisition and disposition activities, inflation rates, or recessionary or expansive trends; changes in interest rates; extended labor disruptions, civil unrest, or other external factors over which we have no control; and changes in our plans, strategies, objectives, expectations, or intentions, which may happen at any time at our discretion. As a consequence, current plans, anticipated actions, and future financial condition and results may differ from those expressed in any forward-looking statements made by us or on our behalf. See Part I, Item 1A, “Risk Factors” of this Form 10-K for a more detailed discussion of these risks and uncertainties.
25
Table of Contents
Overview
We are a Delaware corporation which owns and manages certain operating subsidiaries and investments, anchored by a core position in property and casualty reinsurance and insurance. We were initially incorporated in 1929, were subsequently incorporated in 1984 under the laws of the State of Delaware and, in December 1986, we succeeded to the business of our parent company, Alleghany Corporation. Through our wholly-owned subsidiary AIHL and its subsidiaries, we are engaged in the property and casualty insurance business. AIHL’s insurance operations are principally conducted by its subsidiaries RSUI, CapSpecialty and PacificComp. CapSpecialty has been a subsidiary of AIHL since January 2002, RSUI has been a subsidiary of AIHL since July 2003, and PacificComp has been a subsidiary of AIHL since July 2007. AIHL Re has been a wholly-owned subsidiary of Alleghany since its formation in May 2006. AIHL Re is a captive reinsurance company which provides reinsurance to our insurance operating subsidiaries and affiliates. On March 6, 2012, or the “TransRe Acquisition Date,” we consummated a merger transaction, or the “merger,” with TransRe, at which time TransRe became one of our wholly-owned subsidiaries and our reinsurance operations commenced. See Note 2 to Notes to Consolidated Financial Statements set forth in Part II, Item 8, “Financial Statements and Supplementary Data” of this Form 10-K for additional detail on the merger. Our public equity investments, including those held by TransRe’s and AIHL’s operating subsidiaries, are managed primarily by our wholly-owned subsidiary Roundwood.
Although our primary sources of revenues and earnings are our reinsurance and insurance operations and investments, we manage, source, execute and monitor certain private capital investments primarily through our wholly-owned subsidiary ACC. ACC’s private capital investments are included in corporate activities for segment reporting purposes and include: (i) SORC, an exploration and production company focused on enhanced oil recovery, headquartered in Austin, Texas; (ii) Bourn & Koch, a manufacturer and remanufacturer/retrofitter of precision machine tools and supplier of replacement parts, headquartered in Rockford, Illinois; (iii) Kentucky Trailer, a manufacturer of custom trailers and truck bodies for the moving and storage industry and other markets, headquartered in Louisville, Kentucky; (iv) an approximately 40 percent equity interest in ORX Exploration, Inc., or “ORX,” a regional oil and gas exploration and production company, headquartered in New Orleans, Louisiana; and (v) a 30 percent equity interest in Jazwares, LLC, or “Jazwares,” a toy and consumer electronics company, headquartered in Sunrise, Florida, which interest was acquired on July 31, 2014 for $60.3 million. ORX and Jazwares are accounted for under the equity-method of accounting. In addition, we own and manage properties in the Sacramento, California region through our wholly-owned subsidiary Alleghany Properties.
We owned a minority stake in Homesite Group Incorporated, or “Homesite,” a national, full-service, mono-line provider of homeowners insurance, until its sale to American Family Insurance Company, a Wisconsin-based mutual insurance company, on December 31, 2013.
As of December 31, 2014, we had total assets of $23.5 billion and total stockholders’ equity attributable to Alleghany stockholders of $7.5 billion.
Our principal executive offices are located in leased office space at 7 Times Square Tower, New York, New York 10036, and our telephone number is (212) 752-1356. Our Annual Reports on Form 10-K, Quarterly Reports on Form 10-Q, Current Reports on Form 8-K and amendments to those reports filed or furnished pursuant to Section 13(a) or 15(d) of the Securities Exchange Act of 1934, as amended, or the “Exchange Act,” are available, free of charge, on our website at www.alleghany.com, as soon as reasonably practicable after we electronically file this material with, or furnish it to, the U.S. Securities and Exchange Commission, or the “SEC.” Reports and other information we file with the SEC may also be viewed at the SEC’s website at www.sec.gov or viewed or obtained at the SEC Public Reference Room at 100 F Street, N.E., Washington, DC 20549. Our Financial Personnel Code of Ethics, Employee Code of Business Conduct and Ethics, Director Code of Business Conduct and Ethics, Corporate Governance Guidelines and the charters for our Audit,
26
Table of Contents
Compensation and Nominating and Governance Committees are also available on our website. In addition, interested parties may obtain, free of charge, copies of any of the above reports or documents upon request to the Secretary of Alleghany.
Segment Information
Our segments are reported in a manner consistent with the way management evaluates the businesses. As such, we classify our business into two reportable segments – reinsurance and insurance. In addition, reinsurance and insurance underwriting activities are evaluated separately from investment and corporate activities. The primary components of “corporate activities” are Alleghany Properties, SORC, our investments in Homesite (prior to its sale on December 31, 2013) and ORX and other activities at the parent level. Beginning April 26, 2012, August 30, 2013 and July 31, 2014, corporate activities also includes the operating results of Bourn & Koch, Kentucky Trailer and our investment in Jazwares, respectively. See below and Note 13 to Notes to Consolidated Financial Statements set forth in Part II, Item 8, “Financial Statements and Supplementary Data” of this Form 10-K for an analysis of our underwriting results by segment and corporate activities, and Part II, Item 7, “Management’s Discussion and Analysis of Financial Condition and Results of Operations—Consolidated Results of Operations.”
Reinsurance Segment
General. The reinsurance segment consists of property and casualty reinsurance operations conducted by TransRe’s reinsurance operating subsidiaries.
TransRe, through its principal wholly-owned subsidiaries Transatlantic Reinsurance Company, or “TRC,” TransRe London Ltd., or “TRL,” and TransRe Zurich Ltd., or “TRZ,” offers reinsurance capacity to reinsurance and insurance companies for property and casualty products. These products are distributed through brokers and on a direct basis in both the domestic and foreign markets. TransRe is headquartered in New York, New York with five other locations in the U.S. and has operations worldwide, including: Africa, Australia, Bermuda, Canada, five locations in Asia, three locations in Central and South America, and seven locations in the U.K. and Europe. TRC is licensed, accredited or authorized or can serve as a reinsurer in all 50 states and the District of Columbia in the U.S. and in Puerto Rico and Guam. TRC is also licensed in Bermuda, Canada, Japan, the U.K., the Dominican Republic, the Hong Kong Special Administrative Region of the People’s Republic of China, Germany, Australia and Singapore. In addition, TRL is licensed as a reinsurer in the U.K. and TRZ is licensed as a reinsurer in Switzerland and Dubai.
The reinsurance segment is reported by two major product lines, “property” and “casualty & other.”
| Ÿ | Property. TransRe’s principal lines of business within property include fire, allied lines, auto physical damage and homeowners multiple peril lines (which include property catastrophe risks). In 2014, property reinsurance accounted for approximately 33 percent of TransRe’s gross premiums written. |
| Ÿ | Casualty & other. TransRe’s principal lines of business within casualty & other include liability (including directors’ and officers’ liability, errors and omissions liability and general liability), medical malpractice, ocean marine and aviation, auto liability (including non-standard risks), accident and health, surety and credit. In 2014, casualty & other reinsurance accounted for approximately 67 percent of TransRe’s gross premiums written. |
Reinsurance contracts are generally classified as treaty or facultative contracts. TransRe offers reinsurance capacity on both a treaty and facultative basis. Treaty reinsurance is a contractual arrangement that provides for the automatic reinsuring of all or a portion of a specified class of risk underwritten by the ceding company. Facultative reinsurance is the reinsurance of individual risks. Rather than agreeing to reinsure all or a portion of a class of risk, the reinsurer separately rates and underwrites each risk. Facultative reinsurance is normally purchased for risks not covered by treaty reinsurance or for individual risks covered by reinsurance treaties that are in need of capacity beyond that provided by such treaties.
A ceding company’s reinsurance program may involve pro rata and excess-of-loss reinsurance on both a treaty and facultative basis. TransRe provides pro rata and excess-of-loss reinsurance for most major lines of
27
Table of Contents
business. Under pro rata reinsurance (also referred to as proportional or quota share reinsurance), the ceding company and the reinsurer share the premiums as well as the losses and expenses in an agreed proportion, and such proportional sharing of losses may be subject to a predetermined limit. As pro rata business is a proportional sharing of premiums and losses between ceding company and reinsurer, generally the underwriting reinsurance results of such business more closely reflect the underwriting results of the business ceded than do the results of excess-of-loss business. In pro rata reinsurance, the reinsurer generally pays the ceding company a ceding commission, which is generally based on the ceding company’s cost of obtaining the business being reinsured, such as brokers’ and agents’ commissions, local taxes and administrative expenses. Under excess-of-loss reinsurance (also referred to as non-proportional reinsurance), the reinsurer indemnifies the ceding company for all or a portion of the losses in excess of a predetermined amount, usually up to a predetermined limit. Premiums paid by the ceding company to the reinsurer for excess-of-loss coverage are generally not proportional to the premiums that the ceding company receives because the reinsurer does not assume a proportionate risk. Often there is no ceding commission on excess-of-loss reinsurance and therefore the pricing mechanism used by reinsurers in those instances is a rate applicable to premiums of the individual policy or policies subject to the reinsurance agreement. Both pro rata and excess-of-loss reinsurance may provide for aggregate limits of indemnification.
As of December 31, 2014, the statutory surplus of TRC was $4.8 billion, as determined in accordance with statutory accounting principles, or “SAP,” and the consolidated equity of TransRe was $5.1 billion, as determined in accordance with accounting principles generally accepted in the United States, or “GAAP.”
Distribution. TransRe provides property and casualty reinsurance capacity through brokers as well as directly to insurance and reinsurance companies in both the domestic and foreign markets. In 2014, approximately 83 percent of TransRe’s gross premiums written were written through brokers with the balance written directly. In 2014, companies controlled by Aon Corporation, Marsh & McLennan Companies, Inc. and Willis Group Holdings, plc, were TransRe’s largest brokerage sources of business, accounting for 29 percent, 22 percent and 11 percent, respectively, of gross premiums written. These three international brokers dominate the reinsurance brokerage industry. Due to the substantial percentages of premiums written through these brokers, the loss of business from any one of them could have a material adverse effect on TransRe’s business.
Underwriting. TransRe’s underwriting process emphasizes a team approach among TransRe’s underwriters, actuaries and claims staff, as appropriate. Treaties are reviewed for compliance with TransRe’s underwriting guidelines and objectives, and most treaties are evaluated in part based upon actuarial analyses conducted by TransRe. TransRe’s actuarial models used in such analyses are tailored in each case to the exposures and experience underlying the specific treaty and the loss experience for the risks covered. Property catastrophe exposed treaties are generally evaluated using industry standard models. These models are used as a guide for risk assessment and are continually updated. TransRe also frequently conducts underwriting and claims audits at the offices of a ceding company before and after entering into major treaties, because reinsurers, including TransRe, do not separately evaluate each of the individual risks assumed under their treaties and, consequently, are largely dependent on the original underwriting decisions made by the ceding company. Such dependence subjects TransRe, and reinsurers in general, to the possibility that the ceding companies have not adequately evaluated the risks to be reinsured and, therefore, that the premiums ceded in connection therewith may not adequately compensate the reinsurer for the risk assumed.
TransRe often seeks to lead treaty arrangements. The lead reinsurer on a treaty generally accepts one of the largest percentage shares of the treaty and takes the initiative in negotiating price, terms and conditions. TransRe believes that this strategy enables it to influence more effectively the terms and conditions of the treaties in which it participates. When TransRe does not lead a treaty, it may still suggest changes to any aspect of the treaty. TransRe may decline any treaty business offered to it based upon its assessment of all relevant factors. Such factors include type and level of risk assumed; actuarial and underwriting judgment with respect to rate adequacy; various treaty terms; prior and anticipated loss experience (including exposure to natural and man-made catastrophes) on the treaty; prior business experience with the ceding company; overall financial position; operating results; ratings from credit rating agencies of the ceding company; and social, legal, regulatory, environmental and general economic conditions affecting the risks assumed or the ceding company.
28
Table of Contents
Ratings. TRC, TRL and TRZ are rated A+ by Standard & Poor’s Ratings Services, or “S&P,” and A (Excellent) by A.M. Best Company, Inc., or “A.M. Best,” and TRC is rated A1 by Moody’s Investors Service Inc., or “Moody’s,” independent organizations that analyze the insurance industry and the financial positions of reinsurance and insurance subsidiaries. Additional information regarding ratings and the risks related to ratings from ratings agencies can be found on page 51 of this Form 10-K.
Insurance Segment
The insurance segment consists of property and casualty insurance operations conducted by AIHL through its insurance operating subsidiaries RSUI, headquartered in Atlanta, Georgia; CapSpecialty, headquartered in Middleton, Wisconsin; and PacificComp, headquartered in Agoura Hills, California. AIHL Re, our Vermont-domiciled captive reinsurance company, provides reinsurance to our insurance operating subsidiaries and affiliates. Unless we state otherwise, references to AIHL include the operations of RSUI, CapSpecialty, PacificComp and AIHL Re.
In 2014, property insurance accounted for approximately 47 percent, and casualty insurance accounted for approximately 53 percent, of AIHL’s gross premiums written.
RSUI
General. RSUI, which includes the operations of its wholly-owned subsidiaries RSUI Indemnity Company, or “RIC,” Landmark American Insurance Company, or “Landmark,” and Covington Specialty Insurance Company, or “Covington,” underwrites specialty insurance coverages in the property, umbrella/excess liability, general liability, directors’ and officers’ liability and professional liability lines of business. RSUI also writes a modest amount of reinsurance business on an assumed basis, which is included in the insurance segment.
The market for specialty insurance coverages differs significantly from the market for standard insurance coverages. The specialty market provides coverage for hard-to-place risks that generally do not fit the underwriting criteria of the standard market which provides coverage for largely uniform and relatively predictable exposures and which is highly regulated with respect to rates and forms.
RSUI writes specialty business on both an admitted and non-admitted basis. Insurers may market, sell and service insurance policies in the states where they are licensed. These insurers are referred to as admitted insurers. Admitted insurers are generally required to obtain regulatory approval of their policy forms and premium rates. Non-admitted insurance markets have developed to provide insurance that is otherwise unavailable from the admitted insurance markets of a state. Non-admitted insurance is procured by either state-licensed surplus lines brokers who place risks with insurers not licensed in that state or by insureds’ direct procurement from non-admitted insurers. Non-admitted insurance is subject to considerably less regulation with respect to policy rates and forms.
RSUI writes specialty business in the admitted specialty market primarily through RIC, a New Hampshire-domiciled insurer, in the 50 states and the District of Columbia where RIC is licensed and subject to state form and rate regulations. Most of the risks in the admitted specialty market are unique and hard-to-place in the standard market, but must remain with an admitted insurance company for regulatory and / or marketing reasons. As an admitted carrier, RIC is subject to more state regulation than a non-admitted carrier, particularly with regard to rate and form filing requirements, restrictions on the ability to exit lines of business, premium tax payments and membership in various state associations, such as state guaranty funds and assigned risk plans.
RSUI writes business on an approved, non-admitted basis primarily through Landmark, an Oklahoma-domiciled insurer. Landmark, as a non-admitted company, is not subject to state form and rate regulations and thus has more flexibility in its rates and coverages for specialized or hard-to-place risks. This typically results in coverages that are more restrictive and expensive than coverages written by a standard insurance company. As of December 31, 2014, Landmark was approved to write business on a non-admitted basis in 49 states.
Covington, a New Hampshire-domiciled insurer, was formed in September 2007 to, among other things, support non-admitted business written primarily by RSUI’s binding authority department, which writes small, specialized coverages pursuant to underwriting authority arrangements with managing general agents.
29
Table of Contents
Pursuant to quota share arrangements, effective as of January 1, 2009, Landmark and Covington cede 90 percent of all their respective premiums and losses, gross of third party reinsurance, to RIC.
As of December 31, 2014, the statutory surplus of RIC was approximately $1.5 billion, the statutory surplus of Landmark was $224.4 million, the statutory surplus of Covington was $48.5 million, each as determined in accordance with SAP, and the consolidated equity of RSUI was $1.6 billion, as determined in accordance with GAAP.
Distribution. As of December 31, 2014, RSUI conducted its insurance business through approximately 124 independent wholesale insurance brokers located throughout the U.S. and 31 managing general agents. RSUI’s wholesale brokers are appointed on an individual basis based on management’s appraisal of expertise, premium production potential, loss history with other insurance companies that they represent, and the size and experience of the agency, and only specific locations of a wholesale broker’s operations may be appointed to distribute RSUI’s products. Producer agreements which stipulate premium collection, payment terms and commission arrangements are in place with each wholesale broker. No wholesale broker holds underwriting, claims or reinsurance authority. RSUI has entered into underwriting authority arrangements with 31 managing general agents for small, specialized coverages. RSUI’s top five producing wholesale brokers accounted for approximately 64 percent of gross premiums written by RSUI in 2014. RSUI’s top two producing wholesale brokers, CRC Insurance Services, Inc. and AmWINS Group, Inc., accounted for, in the aggregate, approximately 36 percent of AIHL’s gross premiums written in 2014.
Underwriting. RSUI’s underwriting philosophy is based on handling only product lines in which its underwriters have underwriting expertise. RSUI generally focuses on higher severity, lower frequency specialty risks that can be effectively “desk underwritten” without the need for inspection or engineering reviews. RSUI tracks underwriting results for each of its underwriters and believes that the underwriting systems and applications it has in place facilitate efficient underwriting and high productivity levels. Underwriting authority is delegated on a “top-down” basis ultimately to individual underwriters based on experience and expertise. This authority is in writing and addresses maximum limits, excluded classes and coverages and premium size referral. Referral to a product line manager is required for risks exceeding an underwriter’s authority.
Ratings. RIC is rated A+ (Superior) by A.M. Best. Landmark and Covington are rated A+ (Superior) on a reinsured basis by A.M. Best.
CapSpecialty
General. CapSpecialty, primarily through its wholly-owned subsidiaries Capitol Indemnity Corporation, or “CIC,” Capitol Specialty Insurance Corporation, or “CSIC,” and Platte River Insurance Company, or “Platte River,” operates in the 50 states and the District of Columbia. CapSpecialty also includes the operations and results of Professional Risk Management Services, Inc., which was acquired from TransRe effective January 1, 2014.
CIC conducts its property and casualty insurance business on an admitted basis throughout the country, with a geographic concentration in the Midwestern and Plains states. CIC also writes surety products such as commercial surety bonds and contract surety bonds on a national basis. Commercial surety bonds include all surety bonds other than contract surety bonds and cover obligations typically required by law or regulation, such as licenses and permits. CIC offers contract surety bonds in the non-construction segment of the market which secure performance under supply, service and maintenance contracts.
CSIC conducts substantially all of its business on an approved, non-admitted basis on a national basis and writes primarily specialty lines of property and casualty insurance, including the professional lines of business.
Platte River is licensed in the 50 states and the District of Columbia and operates in conjunction with CIC primarily by providing surety products and offering pricing flexibility in those jurisdictions where both CIC and Platte River are licensed.
Effective January 1, 2014, CapSpecialty was recapitalized pursuant to a series of transactions which included the exchange by AIHL of its common stock in CapSpecialty for Series A Convertible Preferred Stock
30
Table of Contents
carrying a seven percent preference, or the “Preferred Stock,” and the subsequent sale by AIHL to TransRe of 24.9 percent of the Preferred Stock for a cash purchase price based on CapSpecialty’s December 31, 2013 GAAP book value. At the same time, CapSpecialty reserved shares of restricted common stock, or the “Restricted Stock,” which are subordinate to the Preferred Stock, for issuance to the management of CapSpecialty pursuant to a restricted stock plan. To the extent all preferences on the Preferred Stock are satisfied, and all shares of Restricted Stock are vested and issued, the Restricted Stock will represent 20 percent of the capital stock of CapSpecialty on a fully diluted basis.
As of December 31, 2014, the statutory surplus of CIC was $221.9 million, which included the statutory surplus of CSIC of $53.5 million and the statutory surplus of Platte River of $41.5 million, each as determined in accordance with SAP. As of December 31, 2014, the consolidated equity of CapSpecialty was $309.0 million, as determined in accordance with GAAP.
Distribution. CapSpecialty conducts its insurance business through independent and general insurance agents located throughout the U.S. As of December 31, 2014, CapSpecialty had approximately 146 independent agents and 73 general agents licensed to write property and casualty and surety coverages, approximately 112 agents specializing in professional liability coverages and approximately 311 independent agents licensed only to write surety coverages. The general agents write very little surety business and have full quoting and binding authority within the parameters of their agency contracts with respect to the property and casualty business that they write. Certain independent agents have binding authority for specific business owner policy products, including property and liability coverages, and non-contract surety products. No agent of CapSpecialty had writings in excess of 6.4 percent of CapSpecialty’s gross premiums written in 2014.
Underwriting. Elements of CapSpecialty’s underwriting process include prudent risk selection, appropriate pricing and coverage customization. All accounts are reviewed on an individual basis to determine underwriting acceptability. CapSpecialty is a subscriber to the Insurance Service Organization, or “ISO,” and the Surety and Fidelity Association of America, or “SFAA,” insurance reference resources recognized by the insurance industry. CapSpecialty’s underwriting procedures, rates and contractual coverage obligations are based on procedures and data developed by the ISO for property and casualty lines and by the SFAA for surety lines. Underwriting acceptability is determined by type of business, claims experience, length of time in business and business experience, age and condition of premises occupied and financial stability. Information is obtained from, among other sources, agent applications, financial reports and on-site loss control surveys. If an account does not meet pre-determined acceptability parameters, coverage is declined. If an in-force policy becomes unprofitable due to extraordinary claims activity or inadequate premium levels, a non-renewal notice is issued in accordance with individual state statutes and rules.
Ratings. CIC, CSIC and Platte River are rated A (Excellent) on a reinsured basis by A.M. Best.
PacificComp
General. Prior to June 2009, PacificComp’s main business was workers’ compensation insurance, which was conducted on a direct basis through its wholly-owned subsidiary Pacific Compensation Insurance Company, or “PCIC.” In June 2009, PacificComp determined that it was unable to write business at rates it deemed adequate due to the state of the California workers’ compensation market. As a result, PacificComp ceased soliciting new or renewal business on a direct basis commencing August 1, 2009, and took corresponding expense reduction steps, including staff reductions. During the 2009 third quarter, PacificComp sold the renewal rights of its directly placed workers’ compensation insurance policies and certain other assets and rights to an independent insurance brokerage.
As part of a strategic repositioning effort, effective April 12, 2010, PacificComp changed its name from Employers Direct Corporation and changed the name of its wholly-owned insurance subsidiary from Employers Direct Insurance Company to PCIC and took steps to emerge as a writer, through PCIC, of workers’ compensation insurance distributed through independent insurance brokers. PacificComp began writing a modest amount of new business through brokers during 2011. This business increased in 2012, 2013 and 2014 reflecting PacificComp’s distribution initiatives and increased market acceptance of PacificComp’s product offerings. PCIC is currently licensed in California and six additional states.
31
Table of Contents
In the second quarter of 2013, AIHL Re and PCIC entered into an intercompany reinsurance contract, effective January 1, 2013, pursuant to which AIHL Re provides PCIC with coverage for adverse development on net loss and allocated loss adjustment expenses in excess of PCIC’s carried reserves at December 31, 2012 and accident year stop-loss coverage for any net losses and allocated loss adjustment expenses in excess of 75.0 percent of net premiums earned for PCIC for accident years 2013, 2014 and 2015. AIHL Re’s commitments also are intended to cover the statutory collateral requirements at PCIC, if and when necessary. AIHL Re’s obligations are subject to an aggregate limit of $100.0 million. See Note 5(e) to Notes to Consolidated Financial Statements set forth in Part II, Item 8, “Financial Statements and Supplementary Data” of this Form 10-K for additional detail on the reinsurance contract.
As of December 31, 2014, the statutory surplus of PCIC was $92.5 million, as determined in accordance with SAP, and the consolidated equity of PacificComp was $97.7 million, as determined in accordance with GAAP.
Rating. PCIC is rated A- (Excellent) by A.M. Best.
Reserves
Each of our reinsurance and insurance subsidiaries establishes reserves on its balance sheet for unpaid loss and loss adjustment expense, or “LAE,” related to its property and casualty reinsurance and insurance contracts. The reserves for loss and LAE represent management’s best estimate of the ultimate cost of all reported and unreported losses incurred through the balance sheet date. The process of estimating these reserves is inherently difficult and involves a considerable degree of judgment, especially in view of changing legal and economic environments that impact the development of loss reserves. Therefore, quantitative techniques have to be supplemented by subjective considerations and managerial judgment. In addition, conditions and trends that have affected development of liabilities in the past may not necessarily occur or affect liability development to the same degree in the future. See Part II, Item 7, “Management’s Discussion and Analysis of Financial Condition and Results of Operations—Critical Accounting Estimates” for additional detail on our critical accounting estimates.
The following table shows changes in historical net loss and LAE reserves for our reinsurance and insurance subsidiaries for each year since 2004.
The first line of the upper portion of the table shows the net reserves as of December 31 of each of the indicated years, representing the estimated amounts of net outstanding loss and LAE for claims arising during that year and in all prior years that are unpaid, including losses that have been incurred but not yet reported, or “IBNR,” to our reinsurance and insurance subsidiaries. The upper (paid) portion of the table shows the cumulative net amounts paid as of December 31 of successive years with respect to the net reserve liability for each year.
The lower portion of the table shows the re-estimated amount of the previously recorded net reserves for each year based on experience as of the end of each succeeding year. The estimate changes as more information becomes known about claims for individual years. In evaluating the information in the table, it should be noted that a reserve amount reported in any period includes the effect of any subsequent change in such reserve amount. For example, if a loss was first reserved in 2005 at $100,000 and was determined in 2014 to be $150,000, the $50,000 deficiency would be included in the Cumulative (Deficiency) Redundancy row shown below for each of the years 2005 through 2013.
32
Table of Contents
Conditions and trends that have affected development of the ultimate liability in the past may not be indicative of future developments. Accordingly, it is not appropriate to extrapolate future redundancies or deficiencies based on this table.
Changes in Historical Net Reserves for Loss and LAE
| Year Ended December 31, | ||||||||||||||||||||||||||||||||||||||||||||
| 2004 | 2005 | 2006 | 2007 | 2008 | 2009 | 2010 | 2011 | 2012 | 2013 | 2014 | ||||||||||||||||||||||||||||||||||
| (in millions) | ||||||||||||||||||||||||||||||||||||||||||||
| Net liability as of end of year |
$ | 639.0 | $ | 952.9 | $ | 1,127.5 | $ | 1,412.9 | $ | 1,570.3 | $ | 1,573.3 | $ | 1,481.3 | $ | 1,481.2 | $ | 10,933.9 | $ | 10,650.4 | $ | 10,307.8 | ||||||||||||||||||||||
| Cumulative amount of net liability paid as of: |
||||||||||||||||||||||||||||||||||||||||||||
| One year later |
239.4 | 172.7 | 243.3 | 296.1 | 355.6 | 388.7 | 345.7 | 369.5 | 2,251.4 | 2,178.7 | ||||||||||||||||||||||||||||||||||
| Two years later |
310.8 | 356.1 | 421.7 | 515.0 | 659.5 | 642.2 | 616.4 | 623.9 | 3,867.7 | |||||||||||||||||||||||||||||||||||
| Three years later |
365.2 | 493.2 | 529.6 | 708.5 | 848.9 | 841.9 | 797.1 | 818.8 | ||||||||||||||||||||||||||||||||||||
| Four years later |
413.6 | 572.2 | 648.6 | 820.6 | 990.1 | 976.2 | 934.7 | |||||||||||||||||||||||||||||||||||||
| Five years later |
446.9 | 664.7 | 697.9 | 909.2 | 1,070.2 | 1,066.0 | ||||||||||||||||||||||||||||||||||||||
| Six years later |
465.4 | 703.0 | 732.3 | 963.7 | 1,135.0 | |||||||||||||||||||||||||||||||||||||||
| Seven years later |
475.0 | 725.8 | 766.2 | 1,011.5 | ||||||||||||||||||||||||||||||||||||||||
| Eight years later |
486.5 | 748.3 | 794.9 | |||||||||||||||||||||||||||||||||||||||||
| Nine years later |
492.0 | 762.8 | ||||||||||||||||||||||||||||||||||||||||||
| Ten years later |
502.8 | |||||||||||||||||||||||||||||||||||||||||||
| Net liability re-estimated as of: |
||||||||||||||||||||||||||||||||||||||||||||
| One year later |
631.8 | 943.2 | 1,115.4 | 1,370.0 | 1,552.4 | 1,539.6 | 1,455.5 | 1,468.9 | 10,730.9 | 10,435.2 | ||||||||||||||||||||||||||||||||||
| Two years later |
620.1 | 941.2 | 1,047.9 | 1,341.9 | 1,526.5 | 1,506.7 | 1,457.2 | 1,498.5 | 10,522.6 | |||||||||||||||||||||||||||||||||||
| Three years later |
593.3 | 899.7 | 1,012.5 | 1,306.7 | 1,486.0 | 1,497.8 | 1,482.5 | 1,469.4 | ||||||||||||||||||||||||||||||||||||
| Four years later |
584.1 | 873.0 | 976.7 | 1,263.2 | 1,465.4 | 1,502.7 | 1,447.7 | |||||||||||||||||||||||||||||||||||||
| Five years later |
566.7 | 858.8 | 933.0 | 1,241.9 | 1,462.2 | 1,478.2 | ||||||||||||||||||||||||||||||||||||||
| Six years later |
554.0 | 832.7 | 919.2 | 1,240.3 | 1,439.2 | |||||||||||||||||||||||||||||||||||||||
| Seven years later |
537.6 | 826.7 | 919.7 | 1,224.0 | ||||||||||||||||||||||||||||||||||||||||
| Eight years later |
539.5 | 835.8 | 911.3 | |||||||||||||||||||||||||||||||||||||||||
| Nine years later |
540.8 | 831.6 | ||||||||||||||||||||||||||||||||||||||||||
| Ten years later |
541.6 | |||||||||||||||||||||||||||||||||||||||||||
| Cumulative (deficiency) redundancy |
$ | 97.4 | $ | 121.3 | $ | 216.2 | $ | 188.9 | $ | 131.1 | $ | 95.1 | $ | 33.6 | $ | 11.8 | $ | 411.3 | $ | 215.2 | $ | — | ||||||||||||||||||||||
|
|
|
|
|
|
|
|
|
|
|
|
|
|
|
|
|
|
|
|
|
|
|
|||||||||||||||||||||||
| Gross liability - end of year |
$ | 1,246.4 | $ | 2,571.9 | $ | 2,228.9 | $ | 2,379.7 | $ | 2,578.6 | $ | 2,521.0 | $ | 2,328.7 | $ | 2,313.0 | $ | 12,239.8 | $ | 11,952.5 | $ | 11,597.2 | ||||||||||||||||||||||
| Less: reinsurance recoverable |
607.4 | 1,619.0 | 1,101.4 | 966.8 | 1,008.3 | 947.7 | 847.4 | 831.8 | 1,305.9 | 1,302.1 | 1,289.4 | |||||||||||||||||||||||||||||||||
|
|
|
|
|
|
|
|
|
|
|
|
|
|
|
|
|
|
|
|
|
|
|
|||||||||||||||||||||||
| Net liability - end of year |
$ | 639.0 | $ | 952.9 | $ | 1,127.5 | $ | 1,412.9 | $ | 1,570.3 | $ | 1,573.3 | $ | 1,481.3 | $ | 1,481.2 | $ | 10,933.9 | $ | 10,650.4 | $ | 10,307.8 | ||||||||||||||||||||||
|
|
|
|
|
|
|
|
|
|
|
|
|
|
|
|
|
|
|
|
|
|
|
|||||||||||||||||||||||
| Gross re-estimated liability - latest |
$ | 1,116.4 | $ | 2,314.1 | $ | 1,824.0 | $ | 1,991.5 | $ | 2,294.1 | $ | 2,288.9 | $ | 2,214.5 | $ | 2,275.8 | $ | 11,966.4 | $ | 11,789.6 | $ | 11,597.2 | ||||||||||||||||||||||
| Re-estimated recoverable - latest |
574.8 | 1,482.5 | 912.7 | 767.5 | 854.9 | 810.7 | 766.8 | 806.4 | 1,443.8 | 1,354.4 | 1,289.4 | |||||||||||||||||||||||||||||||||
|
|
|
|
|
|
|
|
|
|
|
|
|
|
|
|
|
|
|
|
|
|
|
|||||||||||||||||||||||
| Net re-estimated liability latest |
$ | 541.6 | $ | 831.6 | $ | 911.3 | $ | 1,224.0 | $ | 1,439.2 | $ | 1,478.2 | $ | 1,447.7 | $ | 1,469.4 | $ | 10,522.6 | $ | 10,435.2 | $ | 10,307.8 | ||||||||||||||||||||||
|
|
|
|
|
|
|
|
|
|
|
|
|
|
|
|
|
|
|
|
|
|
|
|||||||||||||||||||||||
| Gross cumulative (deficiency) redundancy |
$ | 130.0 | $ | 257.8 | $ | 404.9 | $ | 388.2 | $ | 284.5 | $ | 232.1 | $ | 114.2 | $ | 37.2 | $ | 273.4 | $ | 162.9 | $ | — | ||||||||||||||||||||||
The net cumulative redundancies since 2004 primarily reflect favorable casualty reserve development at RSUI for the 2004 through 2010 accident years, and favorable prior accident year property-related and casualty-related development in 2013 and 2014 at TransRe, partially offset by unfavorable prior accident year catastrophe-related development at RSUI in 2006 and 2007, unfavorable reserve development at PacificComp in each year from 2008 through 2014, and net unfavorable reserve development at CapSpecialty in each year from 2011 through 2013 related primarily to a discontinued line of business. Prior accident year reserve development is discussed on pages 93 and 94 of this Form 10-K.
33
Table of Contents
The reconciliation between the aggregate net loss and LAE reserves of our reinsurance and insurance subsidiaries reported in the annual statements filed with state insurance departments prepared in accordance with SAP and those reported in our consolidated financial statements prepared in accordance with GAAP for the last three years is shown below:
Reconciliation of Reserves for Loss and LAE from SAP Basis to GAAP Basis
| 2014 | As of December 31, 2013 |
2012 | ||||||||||
| (in millions) | ||||||||||||
| Statutory reserves |
$ | 9,886.9 | $ | 10,206.3 | $ | 10,475.2 | ||||||
| Net reserves of non-U.S. subsidiaries(1) |
420.9 | 444.1 | 459.1 | |||||||||
| Reinsurance recoverables(2) |
1,289.4 | 1,302.1 | 1,305.9 | |||||||||
| Purchase accounting adjustment |
— | — | (0.4 | ) | ||||||||
|
|
|
|
|
|
|
|||||||
| GAAP reserves |
$ | 11,597.2 | $ | 11,952.5 | $ | 12,239.8 | ||||||
|
|
|
|
|
|
|
|||||||
| (1) | TransRe’s non-U.S. subsidiaries do not file annual statements with state insurance departments in the U.S. |
| (2) | Reinsurance recoverables in this table include only unpaid ceded loss and LAE reserves. Amounts reflected under the caption “Reinsurance recoverables” on our consolidated balance sheets set forth in Part II, Item 8, “Financial Statements and Supplementary Data” of this Form 10-K also include paid loss recoverables. |
The reconciliation of beginning and ending aggregate reserves for unpaid loss and LAE of our reinsurance and insurance subsidiaries for the last three years is shown below:
Reconciliation of Reserves for Loss and LAE
| Year Ended December 31, | ||||||||||||
| 2014 | 2013 | 2012 | ||||||||||
| (in millions) | ||||||||||||
| Reserves as of January 1 |
$ | 11,952.5 | $ | 12,239.8 | $ | 2,313.0 | ||||||
| Less: reinsurance recoverables(1) |
1,302.1 | 1,305.9 | 831.8 | |||||||||
|
|
|
|
|
|
|
|||||||
| Net reserves |
10,650.4 | 10,933.9 | 1,481.2 | |||||||||
|
|
|
|
|
|
|
|||||||
| Reserves acquired(2) |
56.9 | — | 9,156.1 | |||||||||
|
|
|
|
|
|
|
|||||||
| Incurred loss, net of reinsurance, related to: |
||||||||||||
| Current year(3) |
2,709.7 | 2,682.3 | 2,642.6 | |||||||||
| Prior years |
(215.2 | ) | (203.0 | ) | (12.3 | ) | ||||||
|
|
|
|
|
|
|
|||||||
| Total incurred loss and LAE, net of reinsurance |
2,494.5 | 2,479.3 | 2,630.3 | |||||||||
|
|
|
|
|
|
|
|||||||
| Paid loss, net of reinsurance, related to: |
||||||||||||
| Current year |
520.8 | 518.5 | 1,950.5 | |||||||||
| Prior years |
2,178.1 | 2,236.8 | 369.5 | |||||||||
|
|
|
|
|
|
|
|||||||
| Total paid loss and LAE, net of reinsurance |
2,698.9 | 2,755.3 | 2,320.0 | |||||||||
|
|
|
|
|
|
|
|||||||
| Foreign exchange effect |
(195.1 | ) | (7.5 | ) | (13.7 | ) | ||||||
|
|
|
|
|
|
|
|||||||
| Reserves, net of reinsurance recoverables, as of December 31 |
10,307.8 | 10,650.4 | 10,933.9 | |||||||||
| Reinsurance recoverables as of December 31(1) |
1,289.4 | 1,302.1 | 1,305.9 | |||||||||
|
|
|
|
|
|
|
|||||||
| Reserves, gross of reinsurance recoverables, as of December 31 |
$ | 11,597.2 | $ | 11,952.5 | $ | 12,239.8 | ||||||
|
|
|
|
|
|
|
|||||||
| (1) | Reinsurance recoverables in this table include only unpaid ceded loss and LAE reserves. Amounts reflected under the caption “Reinsurance recoverables” on our consolidated balance sheets set forth in Part II, Item 8, “Financial Statements and Supplementary Data” of this Form 10-K also include paid loss recoverables. |
| (2) | For 2014, represents reserves acquired in connection with a loss portfolio transfer transaction. For 2012, represents the carrying value of TransRe’s net reserves acquired in the merger. As of the TransRe Acquisition Date, gross loss and LAE reserves were $9,627.8 million and ceded loss and LAE reserves were $471.7 million. |
34
Table of Contents
| (3) | 2012 includes amounts for TransRe from the TransRe Acquisition Date through December 31, 2012, including $87.8 million of favorable prior accident year development on loss and LAE reserves acquired. |
Asbestos-Related Illness and Environmental Impairment Reserves
Our reinsurance and insurance subsidiaries’ reserves for loss and LAE include amounts for risks relating to asbestos-related illness and environmental impairment. The reserves carried for such claims, including the IBNR portion, are based upon known facts and current law at the respective balance sheet dates. However, significant uncertainty exists in determining the amount of ultimate liability for asbestos-related illness and environmental impairment losses, particularly for those occurring in 1985 and prior, which represents the majority of TransRe’s asbestos-related illness and environmental impairment reserves. This uncertainty is due to inconsistent and changing court resolutions and judicial interpretations with respect to underlying policy intent and coverage and uncertainties as to the allocation of responsibility for resultant damages, among other reasons. Further, possible future changes in statutes, laws, regulations, theories of liability and other factors could have a material effect on these liabilities and, accordingly, future earnings. Although we are unable at this time to determine whether additional reserves, which could have a material adverse effect upon our results of operations, may be necessary in the future, we believe that our asbestos-related illness and environmental impairment reserves are adequate as of December 31, 2014.
As of December 31, 2014 and 2013, gross and net loss and LAE reserves for asbestos-related illness and environmental impairment liabilities were as follows:
| December 31, 2014 | December 31, 2013 | |||||||||||||||
| Gross | Net | Gross | Net | |||||||||||||
| (in millions) | ||||||||||||||||
| TransRe |
$ | 593.5 | $ | 438.3 | $ | 583.8 | $ | 431.9 | ||||||||
| CapSpecialty |
9.2 | 9.1 | 10.4 | 10.3 | ||||||||||||
|
|
|
|
|
|
|
|
|
|||||||||
| Total |
$ | 602.7 | $ | 447.4 | $ | 594.2 | $ | 442.2 | ||||||||
|
|
|
|
|
|
|
|
|
|||||||||
As of December 31, 2014, the reserves for asbestos-related illness liabilities were approximately 12 times the average paid claims for the prior three year period, compared with 11 times as of December 31, 2013. The reserves for environmental impairment liabilities were approximately 10 times the average paid claims for the prior three year period, compared with 9 times as of December 31, 2013.
The reconciliation of the beginning and ending gross reserves for unpaid loss and LAE related to asbestos–related illness and environmental impairment claims of our reinsurance and insurance subsidiaries for the years 2012 through 2014 is shown below:
Reconciliation of Asbestos-Related Illness Claims Reserves for Loss and LAE
| 2014 | 2013 | 2012 | ||||||||||
| (in millions) | ||||||||||||
| Reserves as of January 1 |
$ | 425.2 | $ | 371.3 | $ | 11.0 | ||||||
| Reserves acquired(1) |
— | — | 340.0 | |||||||||
| Loss and LAE incurred |
58.2 | 78.9 | 40.8 | |||||||||
| Paid losses(2) |
(39.1 | ) | (25.0 | ) | (20.5 | ) | ||||||
|
|
|
|
|
|
|
|||||||
| Reserves as of December 31 |
$ | 444.3 | $ | 425.2 | $ | 371.3 | ||||||
|
|
|
|
|
|
|
|||||||
| Type of reserves |
||||||||||||
| Case |
$ | 229.1 | $ | 172.8 | $ | 148.6 | ||||||
| IBNR |
215.2 | 252.4 | 222.7 | |||||||||
|
|
|
|
|
|
|
|||||||
| Total |
$ | 444.3 | $ | 425.2 | $ | 371.3 | ||||||
|
|
|
|
|
|
|
|||||||
| (1) | Represents the carrying value of TransRe’s reserves acquired in the merger. |
| (2) | Paid losses include commutations and legal settlements as well as regular paid losses. |
35
Table of Contents
Reconciliation of Environmental Impairment Claims Reserves for Loss and LAE
| 2014 | 2013 | 2012 | ||||||||||
| (in millions) | ||||||||||||
| Reserves as of January 1 |
$ | 169.0 | $ | 154.6 | $ | 2.7 | ||||||
| Reserves acquired(1) |
— | — | 150.1 | |||||||||
| Loss and LAE incurred |
15.4 | 26.9 | 15.4 | |||||||||
| Paid losses(2) |
(26.0 | ) | (12.5 | ) | (13.6 | ) | ||||||
|
|
|
|
|
|
|
|||||||
| Reserves as of December 31 |
$ | 158.4 | $ | 169.0 | $ | 154.6 | ||||||
|
|
|
|
|
|
|
|||||||
| Type of reserves |
||||||||||||
| Case |
$ | 38.7 | $ | 43.3 | $ | 37.0 | ||||||
| IBNR |
119.7 | 125.7 | 117.6 | |||||||||
|
|
|
|
|
|
|
|||||||
| Total |
$ | 158.4 | $ | 169.0 | $ | 154.6 | ||||||
|
|
|
|
|
|
|
|||||||
| (1) | Represents the carrying value of TransRe’s reserves acquired in the merger. |
| (2) | Paid losses include commutations and legal settlements as well as regular paid losses. |
Catastrophe Risk Management
The business of our reinsurance and insurance subsidiaries exposes them to losses from various catastrophe events. In a catastrophe event, losses from many insureds across multiple lines of business may result directly or indirectly from such single occurrence. The extent of losses caused by catastrophes is a function of the amount and type of insured exposure in the area affected by the event, as well as the severity of the event, potentially mitigated by any reinsurance coverage purchased by our reinsurance and insurance subsidiaries. Our reinsurance and insurance subsidiaries take certain measures to mitigate the impact of catastrophe events through various means including considering catastrophe risks in their underwriting and pricing decisions, purchasing reinsurance, monitoring and modeling accumulated exposures and managing exposure in key geographic zones and product lines that are prone to catastrophe events.
Natural disasters such as hurricanes, other windstorms, earthquakes and other catastrophes have the potential to materially and adversely affect our operating results. Other risks, such as an outbreak of a pandemic disease, a major terrorist event, the bankruptcy of a major company, or a marine or an aviation disaster, could also have a material adverse effect on our operating results.
We evaluate catastrophe events and assess the probability of occurrence and magnitude through the use of industry recognized models and other techniques. In addition, our reinsurance and insurance subsidiaries use modeled loss scenarios to set risk retention levels and help structure their reinsurance programs in an effort to ensure that the aggregate amount of catastrophe exposures conform to established risk tolerances and fit within the existing exposure portfolio. We supplement these models by judgmentally interpreting and adjusting when appropriate the modeled output and by monitoring the exposure risks of our operations. There is no single standard methodology to project possible losses from catastrophe exposures. Further, there are no industry standard assumptions used in projecting these losses, and the form and quality of the data obtained, including data obtained from insureds and ceding companies, and used in these models are not uniformly compatible with the data requirements of all models. Therefore, the use of different methodologies and assumptions could materially change the projected losses. Finally, these modeled losses may not be comparable with estimates made by other companies. Our reinsurance and insurance subsidiaries also use reinsurance to further limit their exposure to catastrophes, as is discussed in more detail under “Reinsurance Protection” below.
Reinsurance Protection
Our reinsurance and insurance subsidiaries reinsure portions of the risks they underwrite in order to reduce the effect of individual or aggregate exposure to losses, manage capacity, protect capital resources, reduce volatility in specific lines of business, improve risk-adjusted portfolio returns, and enable them to increase gross
36
Table of Contents
premium writings and risk capacity without requiring additional capital. Our reinsurance and insurance subsidiaries purchase reinsurance and retrocessional coverages from highly-rated third party reinsurers. If the assuming reinsurers are unable or unwilling to meet the obligations assumed under the applicable reinsurance agreements, our reinsurance and insurance subsidiaries would remain liable for such reinsurance portion not paid by these reinsurers. As such, funds, trust agreements and letters of credit are held to collateralize a portion of our reinsurance and insurance subsidiaries’ reinsurance recoverables, and our reinsurance and insurance subsidiaries reinsure portions of the risks they underwrite or assume with multiple reinsurance programs.
To a limited extent, TransRe enters into retrocession arrangements, including property catastrophe retrocession arrangements, in order to reduce the effect of individual or aggregate exposure to losses, reduce volatility in specific lines of business, improve risk-adjusted portfolio returns and increase gross premium writings and risk capacity without requiring additional capital.
RSUI reinsures its property lines of business through a program consisting of surplus share treaties, facultative placements, per risk and catastrophe excess-of-loss treaties. RSUI’s catastrophe reinsurance program (which covers catastrophe risks including, among others, windstorms and earthquakes) and per risk reinsurance program run on an annual basis from May 1 to the following April 30 and thus expired on April 30, 2014.
RSUI placed its catastrophe reinsurance program for the 2014 to 2015 period on May 1, 2014. The catastrophe reinsurance program provides coverage in three layers for $600.0 million of losses in excess of a $200.0 million net retention after application of the surplus share treaties and facultative reinsurance. The first layer provides coverage for $300.0 million of losses, subject to a 5.0 percent co-participation by RSUI, in excess of $200.0 million, the second layer provides coverage for $100.0 million of losses in excess of $500.0 million, with no co-participation by RSUI, and the third layer provides coverage for $200.0 million of losses in excess of $600.0 million, with no co-participation by RSUI. In addition, RSUI’s property per risk reinsurance program for the 2014 to 2015 period provides RSUI with coverage for $90.0 million of losses, subject to a 10.0 percent co-participation by RSUI, in excess of a $10.0 million net retention per risk after application of the surplus share treaties and facultative reinsurance.
With respect to potential losses arising from acts of terrorism, the Terrorism Risk Insurance Act of 2002, as extended and amended by the Terrorism Risk Insurance Extension Act of 2005, and the Terrorism Risk Insurance Program Reauthorization Act of 2007, which we collectively refer to as the “Terrorism Act,” established a program to provide federal assistance to the insurance industry in order to meet the needs of commercial insurance policyholders for coverages against losses due to certain acts of terrorism. The Terrorism Act expired on December 31, 2014.
On January 12, 2015, President Barack H. Obama signed into law the Terrorism Risk Insurance Program Reauthorization Act of 2015 to extend the Terrorism Act. The Terrorism Act fixes the insurer deductible at 20 percent of an insurer’s direct earned premium of the preceding calendar year and the federal share of compensation at 85 percent of insured losses that exceed insurer deductibles, but only until January 1, 2016, at which time the federal share shall decrease by 1 percentage point per calendar year until equal to 80 percent. The Terrorism Act is administered by the U.S. Secretary of the Treasury.
The Terrorism Act applies to foreign or domestic acts of terrorism occurring within the U.S. (including in the U.S. territorial sea and the Outer Continental Shelf), at U.S. missions abroad or on U.S. flag vessels or aircraft. In return for requiring insurers writing certain lines of property and casualty insurance to offer coverage to commercial insurance policyholders against specified acts of terrorism, the Terrorism Act requires the U.S. Federal government to reimburse such insurers for the federal share (initially set at 85 percent, as described above) of insured losses during a program year resulting from such acts of terrorism above a statutorily-defined deductible. In addition, federal reimbursement will only be paid under the Terrorism Act if the aggregate industry insured losses resulting from the covered act of terrorism exceed $100.0 million for insured losses occurring in 2015, but no payment will be made for any portion of aggregate industry insured losses that exceeds $100.0 billion in 2015. The $100.0 million threshold gradually increases to $200.0 million by 2020.
37
Table of Contents
It is not clear whether coverage under the Terrorism Act will extend retroactively to December 31, 2014, or whether the period between December 31, 2014 and January 12, 2015 is left uncovered. While we understand that federal agencies are working to provide guidance on this question, there can be no assurance of the impact of a gap in coverage, if any.
The coverage provided by the Terrorism Act does not apply to reinsurers. In general, TransRe does not provide coverage for certified acts of terrorism, as defined by the Terrorism Act, but it is exposed to potential losses from uncertified acts of terrorism in the U.S. or elsewhere. In addition, TransRe offers terrorism-specific treaty coverages to ceding companies on a limited basis. With respect to other lines of business, TransRe assumes terrorism risk in marine, aviation and other casualty treaties after careful underwriting consideration and, in many cases, with limitations. Potential losses from acts of terrorism could be material depending on the nature and location of the act.
Approximately 3 percent of all policies and approximately 12.5 percent of property policies written by RSUI in 2014 contained coverage for domestic and foreign acts of terrorism. RSUI uses various underwriting strategies to mitigate its exposure to terrorism losses. In addition, its casualty reinsurance programs provide coverage for domestic and foreign acts of terrorism. The cost of property reinsurance for acts of terrorism has increased significantly in recent years and capacity is limited. RSUI’s property reinsurance programs provide coverage only for domestic acts of terrorism and, as a result, RSUI is liable for losses under property policies that provide coverage for foreign acts of terrorism, subject to potential Terrorism Act reimbursement.
We have established a Reinsurance Security Committee, which includes certain of our officers and the chief financial officers of each of our reinsurance and insurance subsidiaries, who meet to track, analyze and manage the use of reinsurance by our reinsurance and insurance subsidiaries. The Reinsurance Security Committee considers and oversees the limits on the maximum amount of unsecured reinsurance recoverables that should be outstanding from any particular reinsurer, the lines of business that should be ceded to a particular reinsurer and, where applicable, the types of collateral that should be posted by reinsurers.
As of December 31, 2014, our reinsurance and insurance subsidiaries had total reinsurance recoverables of $1,361.1 million, consisting of $1,289.4 million of ceded outstanding loss and LAE and $71.7 million of recoverables on paid losses. The reinsurance purchased by our reinsurance and insurance subsidiaries does not relieve them from their obligations to their policyholders and cedants, and therefore, the financial strength of their reinsurers is important. Approximately 96 percent of our reinsurance recoverables balance as of December 31, 2014 was due from reinsurers having an A.M. Best financial strength rating of A (Excellent) or higher. Our reinsurance and insurance subsidiaries had no allowance for uncollectible reinsurance as of December 31, 2014. Information related to concentration of reinsurance recoverables can be found in Part II, Item 7, “Management’s Discussion and Analysis of Financial Condition and Results of Operations – Reinsurance” of this Form 10-K and Note 5(b) to Notes to Consolidated Financial Statements set forth in Part II, Item 8, “Financial Statements and Supplementary Data” of this Form 10-K. Information regarding the risks faced by our reinsurance and insurance subsidiaries with respect to their use of reinsurance can be found on page 50 of this Form 10-K.
Competition
The reinsurance and insurance industry is highly competitive, and industry consolidation has created an even more competitive business environment. Competition in the businesses of our reinsurance and insurance subsidiaries is based on many factors, including the perceived financial strength of the company, premium charges, other terms and conditions offered, services provided, commissions paid to producers, ratings assigned by independent rating agencies, speed of claims payment and reputation and experience in the lines of business to be written.
Our reinsurance and insurance subsidiaries compete with a large number of major U.S. and non-U.S. reinsurers and insurers in their selected lines of business, including regional companies, mutual companies, specialty insurance companies, underwriting agencies, government-owned or subsidized facilities, European underwriting syndicates and diversified financial services companies. In our reinsurance segment, TransRe’s property and casualty businesses compete on a worldwide basis. In our insurance segment, RSUI’s property and
38
Table of Contents
casualty businesses, and CapSpecialty’s admitted property and casualty businesses and surety and non-admitted specialty businesses, compete on a national basis, and PacificComp’s workers’ compensation insurance business competes primarily in California. Some of these competitors have significantly more premiums, capital and resources than our reinsurance and insurance subsidiaries.
In addition to competition from the reinsurance industry, TransRe faces competition from the capital markets, as well as some traditional reinsurers, which from time to time produce alternative products or reinsurance vehicles (such as collateralized reinsurance, reinsurance securitizations, catastrophe bonds and various derivatives, such as swaps and sidecars) that may compete with certain types of reinsurance, such as property catastrophe. Hedge funds may also provide reinsurance and retrocessional protections through captive companies or other alternative transactions on a fully collateralized basis for property and energy catastrophe business. Over time, these initiatives could significantly affect supply, pricing and competition in the reinsurance industry.
A discussion of the risks faced by our reinsurance and insurance subsidiaries due to competition within, and the cyclicality of, the reinsurance and insurance business can be found on pages 49 and 50 of this Form 10-K.
Employees
As of December 31, 2014, we employed a total of 2,067 persons, with 16 persons employed at the parent company, 623 persons employed at TransRe, 812 persons employed at our insurance operating subsidiaries and 616 persons employed at our other subsidiaries.
Regulation
General
Our reinsurance and insurance subsidiaries are subject to extensive supervision and regulation in the jurisdictions in which they operate and are required to comply with a wide range of laws and regulations applicable to insurance and reinsurance companies, although the degree and type of regulation varies from jurisdiction to jurisdiction. We expect the scope and extent of regulation globally, as well as regulatory oversight generally, to continue to increase.
U.S. Regulation
Our reinsurance and insurance subsidiaries are regulated in all U.S. jurisdictions in which they are licensed to conduct business. The extent of this regulation varies, but state insurance laws and regulations generally govern the market conduct and financial condition of reinsurers and insurers, including standards of solvency, types and concentrations of permissible investments, establishment and maintenance of reserves, credit for reinsurance and requirements of capital adequacy. In addition, state insurance laws and regulations govern the business conduct of insurers, including marketing and sales practices and claims handling, and require the approval of nearly all rates, policy forms and related materials for lines of insurance.
Through state “credit for reinsurance” laws, our reinsurance companies are indirectly subject to the effects of regulatory requirements imposed by the states in which their ceding insurers are domiciled and / or licensed. In general, an insurer that obtains reinsurance from a reinsurer that is licensed, accredited, authorized or approved by the state in which the insurer files statutory financial statements is permitted to take a credit on its statutory financial statements in an aggregate amount equal to all of the reinsurance recoverable on paid losses and the liabilities for unearned premiums and loss and LAE reserves ceded to the reinsurer, subject to certain limitations. Additionally, certain states allow credit to be taken for the amount ceded to a non-U.S. reinsurer domiciled in a country recognized as a “qualified jurisdiction” (based upon an assessment of the strength of such jurisdiction’s supervisory structure) that is designated by the state as a “certified reinsurer.” In such instances the ceding company is permitted to take a credit on its statutory financial statements in an aggregate amount equal to all of the reinsurance recoverable on paid losses and the liabilities for unearned premiums and loss and LAE reserves ceded to the reinsurer, subject to certain limitations provided the reinsurer posts acceptable security in
39
Table of Contents
an amount that varies in proportion to the reinsurer’s ratings (A.M. Best, S&P, Moody’s and / or Fitch Ratings Inc.). Finally, credit for reinsurance ceded to reinsurers that are not licensed, accredited, authorized, approved or certified in the ceding company’s jurisdiction must agree to post 100 percent qualified security, either in the form of a deposit, trust or letter of credit, in order that the ceding insurer be allowed to take full credit on its statutory financial statements in an aggregate amount equal to all or a portion of the reinsurance recoverable on paid losses and the liabilities for unearned premiums and loss and LAE reserves ceded to such reinsurers.
Insurance Holding Company Regulation. As an insurance holding company, we and our reinsurance and insurance subsidiaries are subject to regulation under the insurance holding company laws enacted in those states where our reinsurance and insurance subsidiaries are domiciled or where they conduct business. These laws generally require an insurance holding company and its reinsurer and insurer subsidiaries to register with their respective insurance regulators and to file with those regulators certain reports, including information concerning their capital structure, ownership, financial condition, certain intercompany transactions, including dividends and distributions, and general business operations. The insurance holding company laws of some states, including with respect to the payment of dividends and distributions, may be more restrictive than the insurance holding company laws of other states.
Under the insurance holding company laws and regulations, our reinsurance and insurance subsidiaries may not pay an “extraordinary” dividend or distribution, or pay a dividend except out of earned surplus, without the approval of state insurance regulators. In general, an “extraordinary” dividend or distribution is defined as a dividend or distribution that, together with other dividends and distributions made within the preceding 12 months, exceeds the greater (or, in some jurisdictions, the lesser) of (i) 10 percent of the insurer’s statutory surplus as of the end of the prior calendar year, and (ii) the adjusted statutory net investment income during the prior calendar year.
In addition, insurance holding company laws and regulations to which we and our reinsurance and insurance subsidiaries are subject generally require prior notification and approval or non-disapproval by the applicable insurance regulators of certain other significant transactions, including sales, loans, reinsurance agreements and service agreements between an insurer subsidiary, on the one hand, and its holding company or other subsidiaries of the holding company, on the other hand.
The insurance holding company laws and regulations of the states in which our reinsurance and insurance subsidiaries are domiciled also generally require that, before a person can acquire direct or indirect control of a reinsurer or an insurer domiciled in the state, prior written approval must be obtained from the insurer’s domiciliary state insurance regulator. The state insurance regulators are required to consider various factors, including the financial strength of the acquirer, the integrity and management experience of the acquirer’s board of directors and executive officers, and the acquirer’s plans for the future operations of the reinsurer or insurer. Pursuant to applicable laws and regulations, “control” over a reinsurer or an insurer is generally presumed to exist if any person, directly or indirectly, owns, controls, holds the power to vote or holds proxies representing, 10 percent or more of the voting securities of that reinsurer or insurer. Indirect ownership includes ownership of the shares of the ultimate controlling person’s common stock.
The acquisition of control laws described above may discourage potential acquisition proposals and may delay, deter or prevent an acquisition of control of us, including through transactions, and in particular unsolicited transactions, that some or all of our stockholders might consider to be desirable.
NAIC Solvency Modernization Initiative. During the past few years, the National Association of Insurance Commissioners, or the “NAIC,” engaged in a Solvency Modernization Initiative focused on updating the U.S. insurance regulatory framework regarding solvency issues, including capital requirements, governance and risk management, group supervision, accounting and financial reporting and credit for reinsurance. As part of this initiative, in December 2010, the NAIC adopted amendments to the Model Insurance Holding Company System Regulatory Act and Regulation, or the “Amended Model Act and Regulation.” The Amended Model Act and Regulation introduces, among other things, the concept of “enterprise” risk within an insurance holding company system. The Amended Model Act and Regulation imposes more extensive informational requirements on the
40
Table of Contents
ultimate controlling person of the reinsurer or insurer with the purpose of protecting such reinsurer or insurer from enterprise risk, including requiring an annual enterprise risk report by the ultimate controlling person of the reinsurer or insurer that identifies the material risks within the insurance holding company system that could pose enterprise risk to the reinsurer or insurer. The Amended Model Act and Regulation must be adopted by the individual states, and specifically the states in which our reinsurance and insurance subsidiaries are domiciled, for the new requirements to apply. It is not clear when all U.S. states will adopt these changes; however, the Amended Model Act and Regulation must be adopted by an individual state in order for the new requirements to apply to reinsurers and insurers domiciled in that state. As of December 31, 2014, most U.S. states had adopted such legislation, including most of the states where our reinsurance and insurance subsidiaries are domiciled. Because the NAIC has identified certain provisions of the Amended Model Act and Regulation which will be required to be adopted by the states in order for them to maintain NAIC accreditation, it is expected that the Amended Model Act and Regulation will be adopted in full or substantial part by all or almost all of the states by January 1, 2016.
Risk Management and ORSA. In September 2012, the NAIC adopted the Risk Management and Own Risk and Solvency Model Act, or the “ORSA Model Act.” The ORSA Model Act requires reinsurers and insurers that exceed specified premium thresholds to maintain a framework for managing the risks associated with their entire holding company group, including non-insurance companies. In addition, at least annually, the reinsurer or insurer must prepare a summary report, or the “ORSA Report,” regarding its internal assessment of risk management and capital adequacy for the entire holding company group. The ORSA Report will be filed, on a confidential basis, with the insurance holding company group’s lead regulator and made available to other domiciliary regulators within the holding company group. The ORSA Model Act provides that the first filing of the ORSA Report shall be in 2015. As of December 31, 2014, the ORSA Model Act has been adopted in approximately 21 states, including some of the states where our reinsurance and insurance subsidiaries are domiciled, and legislation was pending or under consideration in several other states. Because the NAIC is seeking to require that the provisions of the ORSA Model Act be adopted by the states in order for them to maintain their NAIC accreditation, the ORSA Model Act is expected to be adopted in full or substantial part by all or most of the states over the next several years.
Recent NAIC Initiatives. The NAIC continues to adopt new model laws and regulations that began as part of the NAIC’s Solvency Modernization Initiative. In November 2014, the NAIC adopted the Corporate Governance Annual Disclosure Model Act and the Corporate Governance Annual Disclosure Model Regulation, which, following enactment at the state level, will require insurers and reinsurers to disclose detailed information regarding their governance practices. In December 2014, the NAIC also adopted further amendments to the Amended Model Act and Regulation, which, following enactment at the state level, would authorize U.S. regulators to, among other items, lead or participate in the group-wide supervision of certain international insurance groups.
Rates and Policy Forms. Our insurance companies’ policy forms and various premium rates and rates for property or casualty or surety insurance policies are subject to regulation in every state in which they conduct business. In many states, rates and policy forms must be filed with the applicable insurance regulator prior to their use, and in some states, rates and forms must be affirmatively approved by the applicable insurance regulator prior to use.
The rates and coverage terms of reinsurance agreements with non-affiliates are generally not subject to regulation by any governmental authority. As a practical matter, however, the rates charged by primary insurers and the policy terms of primary insurance agreements may affect the rates charged and the policy terms under associated reinsurance agreements.
Market Conduct Examinations. The insurance laws and regulations to which our insurance companies are subject govern their marketplace activities, affecting the form and content of disclosure to consumers, product illustrations, advertising, product replacement, sales and underwriting practices and complaint and claims
41
Table of Contents
handling. These provisions are generally enforced through periodic market conduct examinations. Such insurance laws and regulations also govern the licensing of insurance companies and agents and regulate trade practices.
Periodic Financial Reporting and Risk-Based Capital. Reinsurance and insurance companies in the U.S. are required to report their financial condition and results of operations in accordance with SAP prescribed or permitted by state insurance regulators in conjunction with the NAIC. State insurance regulators also prescribe the form and content of statutory financial statements, perform periodic financial examinations of reinsurers and insurers, set minimum reserve and loss ratio requirements, establish standards for permissible types and amounts of investments and require minimum capital and surplus levels. These statutory capital and surplus requirements include risk-based capital, or “RBC,” rules promulgated by the NAIC. These RBC standards are intended to assess the level of risk inherent in a reinsurance or an insurance company’s business and consider items such as asset risk, credit risk, underwriting risk and other business risks relevant to its operations. In accordance with RBC formulas, a company’s RBC requirements are calculated and compared with its total adjusted capital to determine whether the company may be undercapitalized, and whether regulatory intervention is warranted. As of December 31, 2014, the total adjusted capital of our U.S. domiciled reinsurance and insurance companies exceeded the minimum levels required under RBC rules, and each had excess capacity to write additional premiums in relation to these requirements. Specifically, as of December 31, 2014, the amount of statutory capital and surplus necessary to satisfy regulatory requirements was not significant in relation to actual statutory capital and surplus.
The NAIC annually calculates certain statutory financial ratios for most reinsurance and insurance companies in the U.S. These calculations are known as the Insurance Regulatory Information System, or “IRIS,” ratios. There presently are thirteen IRIS ratios, with each ratio having an established “usual range” of results. The IRIS ratios assist state insurance departments in executing their statutory mandate to oversee the financial condition of insurance companies. A ratio falling outside the usual range is not considered a failing result; rather, unusual values are viewed as part of the regulatory early monitoring system. Furthermore, in some years, it may not be unusual for financially sound companies to have several ratios with results outside the usual ranges. The NAIC reports the ratios to state insurance departments who may then contact a company if four or more of its ratios fall outside the NAIC’s usual ranges. Based upon calculations as of December 31, 2014, PCIC had four of its ratios falling outside the NAIC’s usual ranges, due primarily to PCIC’s premium growth and underwriting loss.
Guarantee Associations and Similar Arrangements. Certain U.S. insurance companies are required under the guaranty fund laws of most states in which they transact business to pay assessments up to certain prescribed limits to fund policyholder losses or liabilities of insolvent insurance companies. Our U.S. insurance companies also are required to participate in various involuntary pools, principally involving workers’ compensation and windstorms.
Statutory Accounting Principles. State insurance regulators have developed SAP as a basis of accounting used to monitor and regulate the solvency of insurers. SAP is primarily concerned with measuring an insurer’s surplus to policyholders. Accordingly, SAP focuses on valuing assets and liabilities of an insurer at financial reporting dates in accordance with applicable insurance laws and regulations in the state in which such insurer is domiciled. SAP determines, among other things, the amount of statutory surplus and statutory net income of our reinsurance and insurance subsidiaries and thus determines, in part, the amount of funds they have available to pay as dividends.
GAAP is concerned with a company’s solvency, but it is also concerned with other financial measurements, such as income and cash flows. Accordingly, GAAP gives more consideration to appropriate matching of revenue and expenses and accounting for management’s stewardship of assets than does SAP. Due to differences in methodology between SAP and GAAP, the values for assets, liabilities and equity reflected in financial statements prepared in accordance with GAAP are materially different from those reflected in financial statements prepared under SAP.
42
Table of Contents
The NAIC has indicated it will consider policy positions regarding the new International Financial Reporting Standard, or “IFRS,” and its inclusion or exclusion from the U.S. framework of insurance solvency regulation and on the regulatory impacts of non-regulatory uses of statutory financial statements after completion of the insurance contracts joint project of the International Accounting Standards Board and the Financial Accounting Standards Board, or the “FASB,” and the SEC has made a decision regarding IFRS as a U.S. accounting standard for public companies. The potential outcomes identified by the NAIC include but are not limited to the replacement of SAP with GAAP with statutory adjustments or adoption of IFRS without adjustments. We will continue to monitor these developments and the impact they may have on our reinsurance and insurance subsidiaries.
Legislative and Regulatory Initiatives. As discussed in more detail under “Reinsurance Protection” above, the Terrorism Act established a federal assistance program to help the commercial property and casualty insurance industry cover claims arising from terrorism-related losses and regulates the terms of insurance relating to the terrorism coverage provided by our insurance companies.
On July 21, 2010, President Barack H. Obama signed into law the Dodd-Frank Wall Street Reform and Consumer Protection Act, or the “Dodd-Frank Act.” The Dodd-Frank Act made extensive changes to the laws regulating financial services firms and requires various federal agencies to adopt a broad range of new implementing rules and regulations. In addition to introducing sweeping reform of the U.S. financial services industry, the Dodd-Frank Act adopts certain changes to U.S. insurance regulation in general, and to non-admitted insurance and reinsurance in particular. While the Dodd-Frank Act does not result in the federal regulation of insurance, it does establish federal measures that will impact the reinsurance and insurance business and preempt certain state insurance measures. For example, the Dodd-Frank Act incorporates the Non-Admitted and Reinsurance Reform Act, or the “NRRA,” which became effective on July 21, 2011. Among other things, the NRRA established national uniform standards on how states may regulate and tax surplus lines insurance (and also sets national standards concerning the regulation of reinsurance). In particular, the NRRA gives regulators in the state where an insurer is domiciled exclusive authority to regulate and tax surplus lines insurance transactions, and regulators in a ceding insurer’s state of domicile are given the sole responsibility for regulating the balance sheet credit that the ceding insurer may take for reinsurance recoverables. At the present time, it is unclear what effect the NRRA changes specific to non-admitted insurance and reinsurance will have on our reinsurance and insurance subsidiaries, and there is still significant uncertainty as to how these and other provisions of the Dodd-Frank Act will be implemented in practice.
The Dodd-Frank Act created the Financial Stability Oversight Council, or “FSOC,” to identify and respond to risks to the financial stability of the U.S. and to promote market discipline. FSOC is authorized to designate a nonbank financial company as “systemically significant” if its material financial distress could threaten the financial stability of the U.S. In 2013, FSOC designated three nonbank financial companies, including two insurance groups, as systemically significant and in 2014, FSOC designated a third insurance group as systemically significant. Those designated entities will be subject to supervision by the Board of Governors of the Federal Reserve System as well as enhanced prudential standards, including stress tests, liquidity requirements, annual resolution plans or “living wills,” and enhanced public disclosures. FSOC’s potential recommendation of measures to address systemic risk in the insurance industry could affect our insurance and reinsurance operations as could a determination that we or our counterparties are systemically significant.
The Dodd-Frank Act also created the Federal Insurance Office, or the “FIO,” within the U.S. Department of Treasury, which is designed to promote national coordination within the insurance sector and which has the authority, in part, to monitor all aspects of the insurance industry, including identifying issues or gaps in the regulation of reinsurers and insurers that could contribute to a systemic crisis in the insurance industry or the U.S. financial system. Although the FIO is intended principally to exercise a monitoring and information gathering role, it does have the authority to enter into “Covered Agreements” with regulatory authorities outside the U.S. with respect to certain agreements with foreign governments regarding the supervision and regulation of the global reinsurance and insurance markets. In implementing such international agreements, the FIO has the authority to preempt state law if it is determined that state law is inconsistent with the agreement and treats a
43
Table of Contents
non-U.S. reinsurer or insurer less favorably than a U.S. reinsurer or insurer. The FIO has publicly stated its willingness to enter into a covered agreement with other jurisdictions, possibly to facilitate “mutual recognition” between the U.S. and other jurisdictions.
In December 2013, as required by the Dodd-Frank Act, the FIO released a report regarding the modernization and improvement of the U.S. insurance regulatory system. While noting that the current state-based system of insurance regulation is inherently limited in its ability to regulate uniformly and efficiently, the report expresses the FIO’s view that, in the short term, U.S. insurance regulation can be modernized and improved by a combination of steps to be taken by the states in order to increase consistency and transparency of regulation, and certain federal actions, particularly directed to representing U.S. interests in discussions and proceedings with foreign regulators concerning global insurance issues. However, the report also cautions that if the states do not act expeditiously to regulate matters on a more consistent and cooperative basis, there will be a greater role for federal regulation.
In December 2014, FIO delivered its report to the U.S. Congress describing the global reinsurance market and its critical role in supporting the U.S. insurance system. The report does not assess whether reinsurance or any particular reinsurer could be systemically important. However, noting the importance of the global reinsurance market to U.S. reinsurers, the report notes that the U.S. Treasury Department and the United States Trade Representative are considering a covered agreement with respect to collateral requirements for reinsurers. It is possible FIO will, in the future, issue recommendations in respect of the reinsurance market that would, if enacted, potentially impact negatively our business.
Federal agencies have been given significant discretion in drafting the rules and regulations that will implement the Dodd-Frank Act. In addition, the Dodd-Frank Act mandated multiple studies and reports for the U.S. Congress, including the FIO reports described above, which could in some cases result in additional legislative or regulatory action. We cannot predict the requirements of the regulations ultimately adopted under the Dodd-Frank Act or any related additional legislation, the additional costs resulting from compliance with such regulations or legislation or any changes to our operations that may be necessary to comply with the Dodd-Frank Act.
In addition, a number of legislative and regulatory initiatives currently under consideration may significantly affect our reinsurance and insurance business in a variety of ways. These measures include, among other things, tort reform, consumer privacy requirements and proposals for the establishment of state or federal catastrophe funds. The impact of Super Storm Sandy, which caused widespread property damage and flooding to large areas of the East Coast and the Northeastern U.S. in October 2012, has resulted in increased calls for state and federal legislative and regulatory intervention in the reinsurance and insurance business, especially in catastrophe prone areas. We are not able to assess the impact that any such future legislative or regulatory changes may have upon our reinsurance and insurance business.
International Regulation
General. TransRe is regulated in various foreign jurisdictions where it conducts business. In certain jurisdictions, TransRe operates through branches or representative offices of TRC and in other jurisdictions, TransRe has local reinsurance or insurance subsidiaries. TransRe’s subsidiaries, TRL in the U.K. and TRZ in Switzerland, comprise the largest component of TransRe’s international operations.
The extent of the regulation varies by foreign jurisdiction, but generally governs licensing requirements, solvency, currency, amount and type of security deposits, amount and type of reserves and amount and type of local investments. International operations and assets held abroad may be materially and adversely affected by economic, political and other developments in foreign countries, including possible changes in foreign and U.S. laws and regulations, nationalization and changes in regulatory policy, unexpected financial restrictions that foreign governments may impose and potential costs and difficulties in complying with a wide variety of foreign laws and regulations, as well as by the consequences of international hostilities and unrest. The risks of such occurrences and their overall effect upon us vary from country to country and cannot easily be predicted. Further, regulations governing technical reserves and remittance of balances in some countries may hinder remittance of profits and repatriation of assets.
44
Table of Contents
U.K. Regulation. Prior to December 2013, TransRe’s operations in the U.K. were conducted through a branch of TRC. Since December 2013, TransRe’s operations in the U.K. have been conducted by TRL and TRC’s branch operations in the U.K. TRL and TRC’s branch operations in the U.K. are supervised by the Prudential Regulatory Authority, or the “PRA,” which is responsible, among other things, for regulating the solvency of insurance and reinsurance companies, and the Financial Conduct Authority, or the “FCA,” which is responsible, among other things, for regulating market conduct. The PRA and FCA have extensive powers to intervene in the affairs of a regulated entity, including the power to enforce and take disciplinary measures in respect of breaches of its rules by authorized firms and approved persons. TRL and TRC’s branch operations in the U.K. are required to maintain a margin of solvency at all times in respect of the business conducted in accordance with PRA and FCA rules. The calculation of the margin of solvency depends on the type and amount of reinsurance business written.
Swiss Regulation. TRZ is licensed to carry on reinsurance business in Switzerland. As a result, TRZ is required to comply with the Federal Insurance Supervision Act, the Federal Insurance Supervision Ordinance and the regulations and guidance issued by the Swiss Financial Market Supervisory Authority, or “FINMA.” Some of the significant aspects of the Swiss regulatory framework include complying with capital and solvency, corporate governance, risk management and internal control requirements. In addition, TRZ is subject to annual reporting requirements enacted by FINMA.
Branch Regulation. TRC operates in a number of other jurisdictions through a series of foreign branches, including branches in Australia, Bermuda, Canada, France, Germany, Japan, the Hong Kong Special Administrative Region of the People’s Republic of China, the U.K., Switzerland and Singapore, and TRZ operates in Dubai through a branch. As a result, TRC and TRZ are required, among other things, to meet local licensing, reserve, currency, investment and capital requirements for these branches.
Legislative and Regulatory Initiatives. Within the European Union, or the “EU,” the EU Reinsurance Directive of November 2005, or the “Reinsurance Directive,” requires EU member states, or “Member States,” to adopt common standards for authorizing and supervising reinsurance companies that are head-quartered in a Member State. TRC operates within the EU as a “Third Country Reinsurer” under the Reinsurance Directive through a series of foreign branches and on a cross-border basis. Each branch of TRC in the EU is separately authorized by the relevant regulator in the Member State in which it is established. Currently, TRC continues to conduct business within the EU through its foreign branches with no significant impact on its operations. However, TransRe could be materially and adversely affected by rules adopted by a Member State relating to Third Country Reinsurers. For example, TRC may be required to post additional collateral in EU countries or may need to consider restructuring its business in order to comply with the rules adopted in EU countries relating to Third Country Reinsurers.
In addition to the Reinsurance Directive, an EU directive known as “Solvency II” was adopted by the European Parliament in April 2009. Solvency II is a fundamental revision to the current European regulatory regime that seeks to enhance transparency and risk management and encourage a proactive approach to company solvency. It is built on a risk-based approach to setting capital requirements for reinsurers and insurers. The implementation of Solvency II is dependent upon the adoption of a second directive, known as Omnibus II, the purpose of which is to provide for transitional arrangements for the introduction of the new regulatory regime, and to facilitate the adoption of rules for the implementation of the principles set out in Solvency II. After several delays, Omnibus II was adopted in March 2014 and Solvency II will be effective as of January 1, 2016. TransRe could be materially impacted by the implementation of Solvency II depending on the costs associated with implementation by each EU country, any increased capitalization requirements and any costs associated with adjustments to TransRe’s corporate operating structure. The implementation of Solvency II could also materially impact Alleghany on a group-wide basis, since Solvency II affects the calculation of the solvency of international groups which, like Alleghany, conduct reinsurance and insurance operations both inside and outside of the EU.
In Argentina, Brazil, Ecuador, People’s Republic of China and India, emerging markets where TransRe underwrites business on a cross-border basis, local regulations have recently been adopted that may operate to limit, restrict or increase the costs of TransRe’s access to these markets. If this trend continues to spread to other jurisdictions, TransRe’s ability to operate globally may be materially and adversely affected.
45
Table of Contents
In addition to regulation within the U.S., by the EU and by the various jurisdictions outside the U.S. where TransRe operates, we may be affected by regulatory policies adopted by the International Association of Insurance Supervisors, or the “IAIS.” Regulators in more than 200 jurisdictions and approximately 140 countries, representing both established and emerging markets, are working with the IAIS to consider changes to reinsurer and insurer solvency standards and group supervision of companies in a holding company system, including non-insurance companies. Current IAIS initiatives include development of a Common Framework for the Supervision of Internationally Active Insurance Groups, or “ComFrame,” which has been in progress since 2010. ComFrame is intended to provide a framework of basic standards for internationally active insurance groups, or “IAIGs,” and a process for supervisors to cooperate in the supervision of IAIGs. A fourth draft of ComFrame was published during 2014, to be followed by field testing. Since the field testing is expected to result in further modifications to ComFrame, IAIS currently anticipates that ComFrame will be adopted in 2018 and implemented in 2019. In October 2013, IAIS announced that it intends to develop a risk-based group-wide global insurance capital standard which will be included within ComFrame. When adopted and implemented, ComFrame may impose additional and duplicative supervisory and regulatory costs on our reinsurance and insurance companies.
Regulatory Convergence
Regulators within and outside the U.S. are increasingly coordinating the regulation of multinational insurers by conducting a supervisory college. A supervisory college, as defined by the IAIS, is “a forum for cooperation and communication between the involved supervisors established for the fundamental purpose of facilitating the effectiveness of supervision of entities which belong to an insurance group; facilitating both the supervisor of the group as a whole on a group-wide basis and improving the legal entity supervision of the entities within the insurance group.” We are continuing to assess the impact, if any, such coordination may have on insurance regulation and our reinsurance and insurance subsidiaries.
Corporate Activities
Parent Company Operations
At the parent level, we seek out attractive investment opportunities, including strategic investments in operating companies, delegate responsibilities to competent and motivated managers at the operating business level, set goals for our operating businesses, assist managers in the achievement of these goals, define risk parameters and appropriate incentives for our operating businesses, and monitor progress against their long-term objectives.
Roundwood. Our public equity investments, including those held by TransRe’s and AIHL’s operating subsidiaries, are managed primarily by our indirect, wholly-owned subsidiary Roundwood. For a discussion of our reinsurance and insurance subsidiaries’ investment results, see pages 84 and 85 of this Form 10-K.
ACC. We manage, source, execute and monitor our private capital investments, which include SORC, Bourn & Koch and Kentucky Trailer, primarily through our wholly-owned subsidiary ACC. ACC’s private capital investments include:
| Ÿ | SORC. In June 2011, we formed SORC, an exploration and production company focused on enhanced oil recovery, headquartered in Austin, Texas. From formation through December 31, 2014, we have invested $155.7 million in SORC. |
| Ÿ | Bourn & Koch. On April 26, 2012, we acquired Bourn & Koch, a manufacturer and remanufacturer/retrofitter of precision machine tools and supplier of replacement parts, headquartered in Rockford, Illinois. The results of Bourn & Koch have been included in our consolidated results beginning April 26, 2012. |
| Ÿ | Kentucky Trailer. On August 30, 2013, we invested in Kentucky Trailer, a manufacturer of custom trailers and truck bodies for the moving and storage industry and other markets, headquartered in Louisville, Kentucky, for a controlling equity interest. On January 2, 2014, we exercised our option to |
46
Table of Contents
| increase our common equity interest in Kentucky Trailer to 80 percent as well as increase our preferred equity interest, for an additional investment. The results of Kentucky Trailer have been included in our consolidated results beginning August 30, 2013. |
ACC also owns approximately 40 percent of ORX, a regional gas and oil exploration and production company, headquartered in New Orleans, Louisiana, and 30 percent of Jazwares, a toy and consumer electronics company, headquartered in Sunrise, Florida. Our ORX and Jazwares investments are reflected in our financial statements in other invested assets.
Alleghany Properties. We own and manage properties in the Sacramento, California region through our wholly-owned subsidiary Alleghany Properties. These properties include primarily improved and unimproved commercial land, as well as residential lots. As of December 31, 2014, Alleghany Properties owned approximately 320 acres of property in various land use categories ranging from multi-family residential to commercial. In late 2010, Alleghany Properties began making investments in California low income housing tax credit limited liability companies. As of December 31, 2014, Alleghany Properties held investments in three such companies.
We face risks from our property and casualty reinsurance and insurance businesses, our investments in debt and equity securities, and our credit agreement and senior notes, among others. Discussed below are significant risks that our businesses face. If any of the events or circumstances described as risks below actually occurs, our business, results of operations or financial condition could be materially and adversely affected. Our businesses may also be materially and adversely affected by risks and uncertainties not currently known to us or that we currently consider immaterial. In addition to other information provided in this report, the following risk factors should be considered when evaluating an investment in our securities.
Risk Factors Relating to our Business
The reserves for loss and LAE of our reinsurance and insurance subsidiaries are estimates and may not be adequate, which would require our reinsurance and insurance subsidiaries to establish additional reserves. Gross reserves for loss and LAE reported on our balance sheet as of December 31, 2014 were approximately $11.6 billion. These loss and LAE reserves reflect our best estimates of the cost of settling all claims and related expenses with respect to insured events that have occurred. Reserves do not represent an exact calculation of liability, but rather an estimate of what management expects the ultimate settlement and claims administration will cost for events that have occurred, whether known or unknown. These reserve estimates, which generally involve actuarial projections, are based on management’s assessment of facts and circumstances currently known and assumptions about anticipated loss emergence patterns, including expected future trends in claims severity and frequency, inflation, judicial theories of liability, reinsurance coverage, legislative changes and other factors.
The inherent uncertainties of estimating reserves are greater for certain types of liabilities, where long periods of time elapse before a definitive determination of liability is made and settlement is reached. Our liabilities for loss and LAE can generally be categorized into two distinct groups, short-tail business and long-tail business. Short-tail business refers to lines of business, such as property, for which losses are usually known and paid relatively soon after the loss actually occurs. Long-tail business describes lines of business for which specific losses may not be known and reported for some period and losses take much longer to emerge. Given the time frame over which long-tail exposures are ultimately settled, there is greater uncertainty and volatility in these lines than in short-tail lines of business. Our long-tail coverages consist of most casualty lines of business including professional liability, directors’ and officers’ liability, general liability, umbrella/excess liability and certain workers’ compensation exposures. Some factors that contribute to the uncertainty and volatility of long-tail casualty business, and thus require a significant degree of judgment in the reserving process, include the inherent uncertainty as to the length of reporting and payment development patterns, the possibility of judicial interpretations or legislative changes that might impact future loss experience relative to prior loss experience
47
Table of Contents
and the potential lack of comparability of the underlying data used in performing loss reserve analyses. In general, reinsurance business for any particular line of business is longer-tailed and, by its nature, losses are more difficult to estimate than they are for comparable insurance business.
In periods with increased economic volatility, it becomes more difficult to accurately predict claims costs. It is especially difficult to estimate the impact of inflation on loss reserves given the current economic environment and related government actions. Reserve estimates are continually refined in an ongoing process as experience develops and further claims are reported and settled. Adjustments to reserves are reflected in the results of the periods in which the adjustments are made. Because setting reserves is inherently uncertain, we cannot assure you that our current reserves will prove adequate in light of subsequent events. Should our reinsurance and insurance subsidiaries need to increase their reserves, our pre-tax income for the period would decrease by a corresponding amount. Although current reserves reflect our best estimate of the costs of settling claims, we cannot assure you that our reserve estimates will not need to be increased, perhaps by a material amount, in the future.
Because our reinsurance and insurance subsidiaries are property and casualty reinsurers and insurers, we face losses from natural and man-made catastrophes. Property and casualty reinsurers and insurers are subject to claims arising out of catastrophes that may have a significant effect on their results of operations, liquidity and financial condition. Catastrophe losses, or the absence thereof, have historically had a significant impact on our results.
Natural or man-made catastrophes can be caused by various events, including hurricanes, other windstorms, earthquakes and floods, as well as terrorist activities. The frequency and severity of catastrophes in any short period of time are inherently unpredictable. The extent of gross losses from a catastrophe event is a function of both the total amount of insured exposure in the area affected by the event and the severity of the event, potentially mitigated by any reinsurance coverage purchased by our reinsurance and insurance subsidiaries. Most catastrophes are restricted to limited geographic areas; however, hurricanes, other windstorms, earthquakes and floods may produce significant damage when those areas are heavily populated. It is therefore possible that a catastrophe event or multiple catastrophe events could produce significant losses and have a material adverse effect on our financial condition and results of operations.
In addition, longer-term natural catastrophe trends may be changing due to climate change, a phenomenon that has been associated with extreme weather events linked to rising temperatures, and includes effects on global weather patterns, greenhouse gases, sea, land and air temperatures, sea levels, rain and snow. Climate change, to the extent it produces rising temperatures and changes in weather patterns, could impact the frequency or severity of weather events such as hurricanes, other windstorms and tornado activity. To the extent climate change increases the frequency and severity of such weather events, our reinsurance and insurance subsidiaries, particularly TransRe and RSUI, may face increased claims, particularly with respect to properties located in coastal areas. Our reinsurance and insurance subsidiaries take certain measures to mitigate the impact of such events by considering these risks in their underwriting and pricing decisions, including their management of aggregate exposure levels and through the purchase of reinsurance. To the extent broad environmental factors, exacerbated by climate change or otherwise, lead to increases in insured losses, particularly if those losses exceed the expectations of our insurance subsidiaries, our financial condition and results of operations could be materially and adversely affected.
With respect to terrorism, to the extent that reinsurers have excluded coverage for certain terrorist acts or have priced this coverage at rates that make purchasing such coverage uneconomic, our reinsurance and insurance subsidiaries will not have reinsurance protection and are exposed to potential losses as a result of any acts of terrorism. To the extent an act of terrorism is certified by the U.S. Secretary of the Treasury, we may be covered under the Terrorism Act. This coverage under the Terrorism Act does not apply to reinsurers. Information regarding the Terrorism Act and its impact on our insurance subsidiaries can be found on pages 37 and 38 of this Form 10-K.
In general, TransRe does not provide coverage for acts of terrorism, as defined by the Terrorism Act, but it is exposed to potential losses from uncertified acts of terrorism in the U.S. or elsewhere, such as from terrorism-
48
Table of Contents
specific treaty coverages to ceding companies on a limited basis, and with respect to other lines of business from the assumption of terrorism risk in marine, aviation and other casualty treaties. Although TransRe assumes such terrorism risk after careful underwriting consideration and, in many cases, with limitations, a major terrorist event could have a material adverse impact on TransRe and us.
Finally, other catastrophes, such as an outbreak of a pandemic disease, the bankruptcy of a major company or a marine or aviation disaster, could also have a materially adverse effect on our business and operating results.
Significant competitive pressures may prevent our reinsurance and insurance subsidiaries from retaining existing business or writing new business at adequate rates. Our reinsurance and insurance subsidiaries compete with a large number of other companies in their selected lines of business. They compete, and will continue to compete, with major U.S. and non-U.S. reinsurers and insurers, other regional companies, mutual companies, specialty insurance companies, underwriting agencies, government-owned or subsidized facilities, European underwriting syndicates and diversified financial services companies. Many competitors have considerably greater financial resources and greater experience and may offer more products or services than do our reinsurance and insurance subsidiaries. Except for regulatory considerations, there are virtually no barriers to entry into the reinsurance and insurance industry.
Additionally, the reinsurance and insurance industry continues to consolidate and, accordingly, competition for customers will continue to increase. As a result, our reinsurance and insurance subsidiaries may incur greater customer retention and acquisition expense, which would affect the profitability of existing and new business. Further, as the industry continues to consolidate, reinsurance and insurance companies that merge could have increased market size and capital resources with which to negotiate price reductions and retain more risk, decreasing pricing and demand for reinsurance.
Competition in the businesses of our reinsurance and insurance subsidiaries is based on many factors, including the perceived financial strength of a company, premium charges, other terms and conditions offered, services provided, commissions paid to producers, ratings assigned by independent rating agencies, speed of claims payment and reputation and experience in the lines to be written. Such competition could cause the supply or demand for insurance to change, which could affect the ability of our reinsurance and insurance subsidiaries to price their products at adequate rates. If our reinsurance and insurance subsidiaries are unable to retain existing business or write new business at adequate rates, our results of operations could be materially and adversely affected.
In addition to competition from the reinsurance industry, TransRe faces competition from the capital markets, as well as some traditional reinsurers, which from time to time produce alternative products or reinsurance vehicles (such as collateralized reinsurance, reinsurance securitizations, catastrophe bonds and various derivatives, such as swaps and sidecars) that may compete with certain types of reinsurance, such as property catastrophe. Hedge funds may also provide reinsurance and retrocessional protections through captive companies or other alternative transactions on a fully collateralized basis for property and energy catastrophe business. Over time, these initiatives could significantly affect supply, pricing and competition in the reinsurance industry.
Our results may fluctuate as a result of many factors, including cyclical changes in the reinsurance and insurance industries. Historically, the performance of the property and casualty reinsurance and insurance industries has tended to fluctuate in cyclical periods of price competition and excess underwriting capacity, followed by periods of high premium rates and shortages of underwriting capacity. Although an individual reinsurance and insurance company’s performance is dependent on its own specific business characteristics, the profitability of most property and casualty reinsurance and insurance companies tends to follow this market cycle. Further, this cyclical market pattern can be more pronounced in the reinsurance market in which TransRe competes and in the excess and surplus market in which RSUI primarily competes than in the standard insurance market. In addition, compared with historical cyclical periods, a cycle of increased price competition and excess underwriting capacity may continue for a prolonged period of time as new and existing reinsurance and insurance market participants and products continue to enter the reinsurance and insurance markets. Unfavorable market conditions may affect the ability of our reinsurance and insurance subsidiaries to write business at rates they consider appropriate relative to the risk assumed. If we cannot write business at appropriate rates, our business would be significantly and adversely affected.
49
Table of Contents
When premium rates are high and there is a shortage of capacity in the standard insurance market, growth in the excess and surplus market can be significantly more rapid than growth in the standard insurance market. Similarly, when there is price competition and excess underwriting capacity in the standard insurance market, many customers that were previously driven into the excess and surplus market may return to the standard insurance market, exacerbating the effects of price competition.
Demand for reinsurance is influenced significantly by underwriting and investment results in both the standard insurance and the excess and surplus markets and market conditions. The supply of reinsurance is related to prevailing prices, the levels of insured losses and the levels of reinsurance industry surplus, among other factors, that, in turn, may fluctuate in response to changes in rates of return on investments being earned in the reinsurance industry. In addition, the supply of reinsurance is affected by a reinsurer’s confidence in its ability to accurately assess the probability of expected underwriting outcomes, particularly with respect to catastrophe losses.
Since cyclicality is due in large part to the collective actions of insurers, reinsurers and general economic conditions and the occurrence of unpredictable events, we cannot predict the timing or duration of changes in the market cycle. These cyclical patterns cause our revenues and net earnings to fluctuate. In addition, our results may fluctuate as a result of changes in economic, legal, political and social factors, among others.
We cannot guarantee that the reinsurers used by our reinsurance and insurance subsidiaries will pay in a timely fashion, if at all, and, as a result, we could experience losses even if reinsured. As part of their overall risk and capacity management strategy, our reinsurance and insurance subsidiaries purchase reinsurance by transferring or ceding part of the risk that they have underwritten to a reinsurance company in exchange for part of the premium received by our operating subsidiaries in connection with that risk. Although reinsurance makes the reinsurer liable to our reinsurance and insurance subsidiaries to the extent the risk is transferred or ceded to the reinsurer, our reinsurance and insurance subsidiaries remain liable for amounts not paid by a reinsurer. Reinsurers may not pay the reinsurance recoverables that they owe to our operating subsidiaries or they may not pay these recoverables on a timely basis. This risk may increase significantly if these reinsurers experience financial difficulties as a result of catastrophes, investment losses or other events. Accordingly, we bear credit risk with respect to our reinsurance and insurance subsidiaries’ reinsurers, and if they fail to pay, our financial results would be adversely affected. As of December 31, 2014, the amount due from reinsurers reported on our balance sheet was $1.4 billion.
If market conditions cause reinsurance to be more costly or unavailable, our reinsurance and insurance subsidiaries may be required to bear increased risks or reduce the level of their underwriting commitments. As part of their overall risk management strategy, our reinsurance and insurance subsidiaries purchase reinsurance for certain amounts of risk underwritten by them, including catastrophe risks. The reinsurance programs purchased by our operating subsidiaries are generally subject to annual renewal. Market conditions beyond their control determine the availability and cost of the reinsurance protection they purchase, which may affect the level of their business written and thus their profitability. If our reinsurance and insurance subsidiaries are unable to renew their expiring facilities or to obtain new reinsurance facilities, which could result as the number of companies offering reinsurance coverage declines due to industry consolidation, either their net exposures on future policies or reinsurance contracts would increase, which could increase the volatility of their results or, if they are unwilling or unable to bear an increase in net exposures, they would have to reduce the level of their underwriting commitments, especially catastrophe-exposed risks, which may reduce their revenues and net earnings. In certain reinsurance contracts, a cedant, to the extent it exhausts its original coverage under a reinsurance contract during a single coverage period (typically a single twelve-month period), can pay a reinsurance reinstatement premium to restore coverage during such coverage period. If our reinsurance and insurance subsidiaries exhaust their original and, if applicable, reinstated coverage under their third-party reinsurance contracts during a single coverage period, they will not have any reinsurance coverage available for losses incurred as a result of additional loss events during that coverage period. The exhaustion of such reinsurance coverage could have a material adverse effect on the profitability of our reinsurance and insurance subsidiaries in any given period and on our results of operations.
50
Table of Contents
TransRe and RSUI attempt to manage their exposure to catastrophe risk partially through the use of catastrophe modeling software. The failure of this software to accurately gauge the catastrophe-exposed risks they write could have a material adverse effect on our financial condition, results of operations and cash flows. As part of their approach to managing catastrophe risk, TransRe and RSUI use a number of tools, including third-party catastrophe modeling software, to help evaluate potential losses. TransRe and RSUI use modeled loss scenarios and internal analyses to set their level of risk retention and help structure their reinsurance programs. Modeled loss estimates, however, have not always accurately predicted their ultimate losses with respect to catastrophe events. Accordingly, they periodically review their catastrophe exposure management approach, which may result in the implementation of new monitoring tools and a revision of their underwriting guidelines and procedures. However, these efforts may not be successful in sufficiently mitigating risk exposures and losses resulting from future catastrophes.
Our reinsurance and insurance subsidiaries are rated by rating agencies and a decline in these ratings could affect the standings of these units in the reinsurance and insurance industries and cause their premium volume and earnings to decrease. Ratings have become an increasingly important factor in establishing the competitive positions of reinsurance and insurance companies. Some of our reinsurance and insurance subsidiaries are rated by A.M. Best, S&P and / or Moody’s, which we collectively refer to as the “Rating Agencies.” The Rating Agencies’ financial strength ratings reflect their opinions of a reinsurance or an insurance company’s financial strength, operating performance, strategic position and ability to meet its obligations to policyholders, and are neither an evaluation directed to investors of a security nor a recommendation to buy, sell or hold a security. These ratings are subject to periodic review, and we cannot assure you that any of our reinsurance or insurance companies will be able to retain their current ratings. If the ratings of our reinsurance or insurance companies are reduced from their current levels by the Rating Agencies, their competitive positions could suffer and it would be more difficult for them to market their products. A significant downgrade could result in a substantial loss of business as customers move to other companies with higher financial strength ratings.
In addition, in general, if the financial strength ratings of TransRe’s operating subsidiaries from the Rating Agencies fall below A-, certain rating agency triggers in a significant portion of TransRe’s operating subsidiaries’s contracts would allow customers to elect to take a number of actions such as terminating the contracts on a run-off or cut-off basis, requiring TransRe’s operating subsidiaries to post collateral for all or a portion of the obligations or requiring commutation under the contracts. Some of these contracts, however, contain dual triggers, such as requiring both a ratings downgrade below A- and a significant decline in the statutory surplus of TransRe’s operating subsidiaries before such cancellation or collateralization rights would be exercisable. Contracts may contain one or both of the aforementioned contractual provisions, or certain other collateralization or cancellation triggers. Whether a ceding company would exercise any of these cancellation rights would depend on, among other factors, the reason and extent of such downgrade or surplus reduction, the prevailing market conditions and the pricing and availability of replacement reinsurance coverage. We cannot predict the extent to which these contractual rights would be exercised, if at all, or what effect such exercises would have on our financial condition or future operations, but such effect potentially could be materially adverse to us.
TransRe may also enter into agreements with ceding companies that require it to provide collateral for its obligations, including where TransRe’s obligations to these ceding companies exceed negotiated thresholds. These thresholds may vary depending on the ratings of TransRe’s operating subsidiaries, and a ratings downgrade or a failure to achieve a certain rating may increase the amount of collateral TransRe is required to provide. TransRe may provide the collateral by delivering letters of credit to the ceding company, depositing assets into a trust for the benefit of the ceding company or permitting the ceding company to withhold funds that would otherwise be delivered to TransRe under the reinsurance contract. The amount of collateral TransRe is required to provide typically represents all or a portion of the obligations TransRe may owe a ceding company, often including estimates made by a ceding company of IBNR claims. Since TransRe may be required to provide collateral based on a ceding company’s estimate, TransRe may be obligated to provide collateral that exceeds TransRe’s estimate of the ultimate liability to such ceding company. An increase in the amount of collateral TransRe is obligated to provide to secure its obligations may have an adverse impact on, among other things, TransRe’s ability to write additional reinsurance.
51
Table of Contents
A limited number of brokers account for a large portion of TransRe’s premiums; the loss of all or a substantial portion of the business provided by them may have an adverse effect on us. The great majority of TransRe’s premiums are written through brokers. Three large international brokers dominate the reinsurance brokerage industry, and TransRe derives a significant portion of its premiums from these brokers. Further, TransRe may become increasingly reliant on these brokers due to continued consolidation in the broker sector. The loss of all or a substantial portion of the business provided by these brokers could have a material adverse effect on us.
Difficult and volatile conditions in the global capital and credit markets and in the overall economy could materially and adversely affect the results of our reinsurance and insurance subsidiaries. Disruption and volatility in the global capital and credit markets and in the overall economy affects our business in a number of ways, including the following:
| Ÿ | disruption in the capital and credit markets may increase claims activity in our reinsurance business, such as directors’ and officers’ liability, errors and omissions liability and trade credit lines; |
| Ÿ | volatility in the capital and credit markets makes it more difficult to access those markets, if necessary, to maintain or improve financial strength and credit ratings of our reinsurance and insurance subsidiaries or to generate liquidity; |
| Ÿ | disruption in the overall economy may reduce demand for reinsurance and insurance products; and |
| Ÿ | increases in inflation could result in higher losses on reinsurance contracts, particularly in longer-tailed lines of business, increased operating costs and a decrease in the fair value of our investment portfolio. |
It is difficult to predict when and how long these types of conditions may exist and how our markets, business and investments will be adversely affected. Accordingly, these conditions could have a material adverse effect on our consolidated financial condition or results of operations in future periods.
The businesses of our reinsurance and insurance subsidiaries are heavily regulated, and changes in regulation may reduce their profitability and limit their growth. Our reinsurance and insurance operating subsidiaries are subject to extensive regulation and supervision in the jurisdictions in which they conduct business, both in the U.S. and other countries. This regulation is generally designed to protect the interests of policyholders and not necessarily the interests of insurers, their stockholders or other investors. The regulation relates to authorization for lines of business, capital and surplus requirements, investment limitations, underwriting limitations, transactions with affiliates, dividend limitations, changes in control, premium rates and a variety of other financial and non-financial components of a reinsurance and insurance company’s business.
Virtually all states in which our insurance operating subsidiary companies conduct their business require them, together with other insurers licensed to do business in that state, to bear a portion of the loss suffered by some insureds as the result of impaired or insolvent insurance companies. In addition, in various states, our insurance operating subsidiary companies must participate in mandatory arrangements to provide various types of insurance coverage to individuals or other entities that otherwise are unable to purchase that coverage from private insurers. A few states require our insurance operating subsidiary companies to purchase reinsurance from a mandatory reinsurance fund. Such reinsurance funds can create a credit risk for insurers if not adequately funded by the state and, in some cases, the existence of a reinsurance fund could affect the prices charged for the policies issued by our reinsurance and insurance subsidiaries. The effect of these and similar arrangements could reduce the profitability of our insurance operating subsidiaries in any given period or limit their ability to grow their business.
In recent years, the state insurance regulatory framework has come under increased scrutiny, and some state legislatures have considered or enacted laws that may alter or increase state authority to regulate insurance companies and insurance holding companies. Further, the NAIC and state insurance regulators are continually reexamining existing laws and regulations, specifically focusing on modifications to statutory accounting principles, interpretations of existing laws and the development of new laws and regulations. On the federal level, the Dodd-Frank Act, signed into law on July 2010, mandated significant changes to the regulation of U.S. insurance effective as of July 21, 2011. We cannot predict the requirements of the regulations ultimately adopted
52
Table of Contents
under the Dodd-Frank Act or the impact such regulations will have on our business. These regulations, and any proposed or future state or federal legislation or NAIC initiatives, if adopted, may be more restrictive on the ability of our reinsurance and insurance subsidiaries to conduct business than current regulatory requirements or may result in higher costs. Information regarding the impact of regulation and current regulatory changes on our reinsurance and insurance operating subsidiaries can be found on pages 39 through 46 of this Form 10-K.
TransRe’s offices that operate in jurisdictions outside the U.S. are subject to certain limitations and risks that are unique to foreign operations. TransRe’s international operations are also regulated in various jurisdictions with respect to licensing requirements, solvency, currency, amount and type of security deposits, amount and type of reserves, amount and type of local investments and other matters. International operations and assets held abroad are subject to significant legal, market, operational, compliance and regulatory risks, including risks related to:
| Ÿ | economic, political and other developments in foreign countries; |
| Ÿ | changes in foreign or U.S. tax laws; |
| Ÿ | nationalization and changes in regulatory policy; |
| Ÿ | unexpected financial restrictions that foreign governments may impose; |
| Ÿ | the potential costs and difficulties in complying with a wide variety of foreign laws and regulations; and |
| Ÿ | the consequences of international hostilities and unrest. |
The risks of such occurrences and their overall effect upon us vary from country to country and cannot be predicted. In addition, our results of operations and net unrealized currency translation gain or loss (a component of accumulated other comprehensive income) are subject to volatility as the value of the foreign currencies fluctuate relative to the U.S. dollar. Further, regulations governing technical reserves and remittance balances in some countries may hinder remittance of profits and repatriation of assets.
TransRe’s international operations are also subject to risks related to complying, or monitoring compliance, with the requirements of anti-corruption laws, such as the U.S. Foreign Corrupt Practices Act and the U.K. Bribery Act, and the economic and trade sanctions laws of the U.S., including but not limited to the regulations administered by the Office of Foreign Assets Control of the U.S. Department of the Treasury, and sanctions laws implemented by other countries in which TransRe operates. The international and U.S. laws and regulations that are applicable to TransRe’s operations are complex and may increase the costs of regulatory compliance, limit or restrict TransRe’s reinsurance business or subject TransRe to regulatory actions or proceedings in the future. While TransRe attempts to comply with all applicable laws and regulations and to seek licenses to undertake various activities where appropriate, there can be no assurance that TransRe is, or will be, in full compliance with all applicable laws and regulations, or interpretations of these laws and regulations, at all times. In addition, it is TransRe’s policy to continually monitor compliance with, and voluntarily report to appropriate regulatory authorities any potential violations of, all applicable laws and regulations where it is deemed appropriate, including anti-corruption and trade sanction laws and any failure to comply with any such laws and regulations may subject TransRe to investigations, sanctions or other remedies, including fines, injunctions, increased scrutiny or oversight by regulatory authorities. The cost of compliance or the consequences of non-compliance, including reputational damage, could have a material adverse effect on our consolidated financial condition or results of operations in future periods.
With regards to TransRe’s operations within the EU, TRC operates within the EU as a Third Country Reinsurer under the Reinsurance Directive through a series of foreign branches and on a cross-border basis. Each branch of TRC in the EU is separately authorized by the relevant regulator in the Member State in which it is established. Currently, TRC continues to conduct business within the EU through its foreign branches with no significant impact on its operations. However, TransRe could be materially and adversely affected by rules adopted by a Member State relating to Third Country Reinsurers. For example, TRC may be required to post additional collateral in EU countries or may need to consider further restructuring its business in order to comply with the rules adopted in EU countries relating to Third Country Reinsurers.
53
Table of Contents
In addition to the Reinsurance Directive, an EU directive known as Solvency II was adopted by the European Parliament in April 2009. Solvency II is a fundamental revision to the current European regulatory regime that seeks to enhance transparency and risk management, and encourage a proactive approach to company solvency. It is built on a risk-based approach to setting capital requirements for reinsurers and insurers. TransRe could be materially impacted by the implementation of Solvency II depending on the costs associated with implementation by each EU country, any increased capitalization requirements and any costs associated with adjustments to TransRe’s corporate operating structure. The implementation of Solvency II could also materially impact Alleghany on a group-wide basis. Information regarding Solvency II and its impact on our operations can be found on page 45 of this Form 10-K.
In Brazil, Argentina and India, three emerging markets where TransRe underwrites business on a cross-border basis, local regulations have recently been adopted that may operate to limit, restrict or increase the costs of TransRe’s access to these markets. If this trend continues to spread to other jurisdictions, TransRe’s ability to operate globally may be materially and adversely affected.
The loss of key personnel at our reinsurance and insurance subsidiaries could adversely affect our results of operations, financial condition and cash flows. We rely upon the knowledge and talent of the employees of our reinsurance and insurance subsidiaries to successfully conduct their business. A loss of key personnel, especially the loss of underwriters or underwriting teams, could have a material adverse effect on our results of operations, financial condition and cash flows in future periods. Our success has depended, and will continue to depend in substantial part, upon our ability to attract and retain teams of underwriters in various business lines at our reinsurance and insurance subsidiaries. The loss of key services of any members of current underwriting teams at our reinsurance and insurance subsidiaries may adversely affect our business and results of operations.
There are significant hazards associated with oil exploration and production activities, some of which may not be fully covered by insurance. The business of exploring for, producing, storing and transporting oil is subject to risks and hazards, including environmental hazards, construction risks, industrial accidents, the encountering of unusual or unexpected geological formations, cave-ins, blowouts, fires, explosions, craterings, pipeline ruptures and spills, and flooding, earthquakes and other natural disasters. These occurrences could result in personal injury or death, environmental damage, damage to, or destruction of, mineral properties or production facilities or other physical assets, monetary losses and possible legal liability. Although we maintain insurance against some of these risks, insurance fully covering many of these risks is not generally available to us or if it is, we may elect not to obtain it due to the high premium costs or commercial impracticality. Any liabilities that we may incur for these risks and hazards could be significant and could have a material adverse effect on our reputation, financial condition and results of operations.
We are subject to cybersecurity risks and may incur increasing costs in an effort to minimize those risks. Our reinsurance and insurance subsidiaries depend on the proper functioning and availability of their information technology platforms, including communications and data processing systems, in operating their business. These systems consist of software programs that are integral to the efficient operation of the business of our reinsurance and insurance subsidiaries, including programs for proprietary pricing and exposure management, processing payments and claims, filing and making changes to records and providing customer support. Our reinsurance and insurance subsidiaries are also required to effect electronic transmissions with third parties including brokers, clients, vendors and others with whom they do business. Security breaches could expose them to a risk of loss or misuse of their information, litigation and potential liability. In addition, cyber incidents that impact the availability, reliability, speed, accuracy or other proper functioning of these systems could have a significant impact on the operations of our reinsurance and insurance subsidiaries, and potentially on their results. We may not have the resources or technical sophistication to anticipate or prevent rapidly evolving types of cyber attacks. A significant cyber incident, including system failure, security breach, disruption by malware or other damage could interrupt or delay the operations of our reinsurance and insurance subsidiaries, result in a violation of applicable privacy and other laws, damage their reputation, cause a loss of customers or give rise to monetary fines and other penalties, which could be significant.
54
Table of Contents
Risk Factors Relating to our Investments and Assets
The valuation of our investments includes methodologies, estimates and assumptions which are subject to differing interpretations or judgments; a change in interpretations or judgments could result in changes to investment valuations that may adversely affect our results of operations or financial condition. The vast majority of our investments are measured at fair value using methodologies, estimates and assumptions which are subject to differing interpretations or judgments. Financial instruments with quoted prices in active markets generally have more price observability and less judgment is used in measuring fair value. Conversely, financial instruments traded in other-than-active markets or that do not have quoted prices have less observability and are measured at fair value using valuation models or other pricing techniques that require more judgment. Investments recorded at fair value in the consolidated balance sheet are classified in a hierarchy for disclosure purposes consisting of three “levels” based on the observability of inputs available in the market used to measure the fair values.
Securities that are less liquid are more difficult to value and trade. During periods of market disruption, including periods of significantly rising or high interest rates, rapidly widening credit spreads or illiquidity, it may be difficult to value certain of the securities in our investment portfolio if trading becomes less frequent or market data becomes less observable. Certain asset classes in active markets with significant observable data may become illiquid due to changes in the financial environment. In such cases, valuing these securities may require more subjectivity and judgment. In addition, prices provided by third-party pricing services and broker quotes can vary widely even for the same security.
As such, valuations may include inputs and assumptions that are less observable or require greater estimation as well as valuation methods which are more sophisticated, thereby resulting in values which may be greater or less than the value at which the investments may be ultimately sold. Further, rapidly changing or strained credit and equity market conditions could materially impact the value of securities as reported within our consolidated financial statements and the period-to-period changes in value could vary significantly. Decreases in value may have a material adverse effect on our results of operations or financial condition.
A substantial amount of our assets is invested in debt securities and is subject to market fluctuations. A substantial portion of our investment portfolio consists of debt securities. As of December 31, 2014, our investment in debt securities was approximately $14.6 billion, or 77.5 percent of our total investment portfolio. The fair value of these assets and the investment income from these assets fluctuate depending on general economic and market conditions. A rise in interest rates would decrease unrealized gains and / or increase unrealized losses on our debt securities portfolio and potentially produce a net unrealized loss position, offset by our ability to earn higher rates of return on reinvested funds. Conversely, a decline in interest rates would increase unrealized gains and / or decrease unrealized losses on our debt securities portfolio, offset by lower rates of return on reinvested funds. Based upon the composition and duration of our investment portfolio as of December 31, 2014, a 100 basis point increase in interest rates would result in an approximate $569.3 million decrease in the fair value of our debt securities portfolio. In addition, some debt securities, such as mortgage-backed and other asset-backed securities, carry prepayment risk, or the risk that principal will be returned more rapidly or slowly than expected, as a result of interest rate fluctuations.
Defaults, downgrades or other events impairing the value of our debt securities portfolio may reduce our earnings. We are subject to the risk that the issuers of debt securities we own may default on principal and interest payments they owe us. The occurrence of a major economic downturn, acts of corporate malfeasance, widening risk spreads or other events that adversely affect the issuers of these debt securities could cause the value of our debt securities portfolio and our net earnings to decline and the default rate of the debt securities in our investment portfolio to increase. In addition, with economic uncertainty, the credit quality of issuers could be adversely affected and a ratings downgrade of the issuers of the debt securities we own could also cause the value of our debt securities portfolio and our net earnings to decrease. Any event reducing the value of these securities other than on a temporary basis could have a material adverse effect on our business, results of operations and financial condition. We continually monitor the difference between cost and the estimated fair value of our investments in debt securities. If a decline in the value of a particular debt security is deemed to be temporary, we
55
Table of Contents
record the decline as an unrealized loss in stockholders’ equity. If the decline is deemed to be other than temporary, we write it down to the carrying value of the investment and record an other than temporary impairment loss in our statement of earnings, which may be material to our operating results.
We invest some of our assets in equity securities, which are subject to fluctuations in market value. We invest a portion of our investment portfolio in equity securities, which are subject to fluctuations in market value. As of December 31, 2014, our investments in equity securities had a fair value of approximately $2.8 billion, which represented 14.9 percent of our investment portfolio. We hold our equity securities as available-for-sale, and any changes in the fair value of these securities, net of tax, would be reflected directly in stockholders’ equity or in the statement of earnings. If there is an increase in value or if a decline in the value of a particular equity security is deemed to be temporary, we record the change as an unrealized gain or loss in stockholders’ equity. If the decline is deemed to be other than temporary, we write its cost-basis down to the fair value of the security and record an other than temporary impairment loss in our statement of earnings, which may be material to our operating results. A severe or prolonged downturn in equity markets could give rise to significant impairment charges.
Changes in foreign currency exchange rates could impact the value of our assets and liabilities denominated in foreign currencies. A principal exposure to foreign currency risk is our obligation to settle claims denominated in foreign currencies in the subject foreign currencies. The possibility exists that we may incur foreign currency exchange gains or losses when we ultimately settle these claims. To mitigate this risk, we maintain investments denominated in certain foreign currencies in which the claims payments will be made. To the extent we do not seek to hedge our foreign currency risk or our hedges prove ineffective, the resulting impact of a movement in foreign currency exchange rates could materially and adversely affect our results of operations or financial condition. For example, stockholders’ equity attributable to Alleghany stockholders was reduced by $39.9 million during 2014 from the impact of changes in foreign currency exchange rates.
If any of our businesses do not perform well, we may be required to recognize an impairment of our goodwill or other intangible assets or to establish a valuation allowance against the deferred income tax asset, which could adversely affect our results of operations or financial condition. Goodwill represents the excess of the amount we paid to acquire subsidiaries and other businesses over the fair value of their net assets as of the date of acquisition. We test goodwill at least annually for impairment. Impairment testing is performed based upon estimates of the fair value of the operating subsidiary to which the goodwill relates. The fair value of the operating subsidiary is impacted by the performance of the business. The performance of our businesses may be adversely impacted by prolonged market declines. If we determine the goodwill has been impaired, we must write down the goodwill by the amount of the impairment, with a corresponding charge to net earnings. Such write-downs could have a material adverse effect on our results of operations or financial position. A decrease in the expected future earnings of an operating subsidiary could lead to an impairment of some or all of the goodwill or other long-lived intangible assets associated with such operating subsidiaries in future periods.
Deferred income tax represents the tax effect of the differences between the book and tax basis of assets and liabilities. Deferred tax assets are assessed periodically by management to determine if they are recoverable. Factors in management’s determination include the performance of the business including the ability to generate capital gains. If it is more likely than not that the deferred income tax asset will not be realized based on available information then a valuation allowance must be established with a corresponding charge to net earnings. Such charges could have a material adverse effect on our results of operations or financial position. Deterioration of financial market conditions could result in the impairment of long-lived intangible assets and the establishment of a valuation allowance on our deferred income tax assets.
Risks Relating to our Senior Notes and the Credit Agreement
Our failure to comply with restrictive covenants contained in the indentures governing the Senior Notes (as defined on page 102 of this Form 10-K) or any other indebtedness, including indebtedness under our revolving credit facility and any future indebtedness, could trigger prepayment obligations, which could adversely affect our business, financial condition and results of operations. The indentures governing
56
Table of Contents
the Senior Notes contain covenants that impose restrictions on Alleghany and TransRe with respect to, among other things, the incurrence of liens on the capital stock of certain of our subsidiaries. In addition, the indentures governing the Senior Notes contain certain other covenants, including covenants to timely pay principal and interest, and the Credit Agreement (as defined on page 99 of this Form 10-K) also requires us to comply with certain covenants. Our failure to comply with such covenants could result in an event of default under the indentures, under the Credit Agreement or under any other debt agreement we may enter into in the future, which could, if not cured or waived, result in us being required to repay the Senior Notes, the indebtedness under the Credit Agreement or any other future indebtedness. As a result, our business, financial condition, results of operations and liquidity could be adversely affected.
To service our debt, we will require a significant amount of cash, which may not be available to us. Our ability to make payments on, or repay or refinance, our debt, including the Senior Notes, will depend largely upon the future performance and use of our investment portfolio and our future operating performance, including the operating performance of our subsidiaries. Our future performance, to a certain extent, is subject to general economic, financial, competitive, legislative, regulatory and other factors that are beyond our control. In addition, our ability to borrow funds in the future will depend on the satisfaction of the covenants in the indentures governing the Senior Notes, in the Credit Agreement and in other debt agreements we may enter into in the future. Under the Credit Agreement, we also need to maintain certain financial ratios. We cannot assure you that our business, including the operating performance of our subsidiaries, will generate sufficient cash flow from operations or that future borrowings will be available to us under the Credit Agreement or from other sources in an amount sufficient to enable us to pay our debt, including the Senior Notes, or to fund our other liquidity needs.
Item 1B. Unresolved Staff Comments.
None.
The principal executive offices of Alleghany, ACC and Roundwood are located in leased office space in New York, New York. TransRe leases office space in New York, New York for its headquarters and office space in almost all of its locations around the world. RSUI leases office space in Atlanta, Georgia for its headquarters and office space in Sherman Oaks, California. CapSpecialty leases office space in Middleton, Wisconsin for its headquarters. PacificComp leases office space in Agoura Hills, California. Bourn & Koch and Kentucky Trailer own their principal offices and manufacturing facilities, which are located in Rockford, Illinois and Louisville, Kentucky, respectively. SORC leases office space in Austin, Texas for its headquarters. Alleghany Properties leases office space in Sacramento, California. Management considers its facilities suitable and adequate for the current level of operations.
Certain of our subsidiaries are parties to pending litigation and claims in connection with the ordinary course of their businesses. Each such subsidiary makes provisions for estimated losses to be incurred in such litigation and claims, including legal costs. We believe such provisions are adequate and do not believe that any pending litigation will have a material adverse effect on our consolidated results of operations, financial position or cash flows.
Item 4. Mine Safety Disclosures.
The information concerning mine safety violations or other regulatory matters required by SEC regulations is included in Exhibit 95 to this Form 10-K.
57
Table of Contents
Item 5. Market for Registrant’s Common Equity, Related Stockholder Matters and Issuer Purchases of Equity Securities.
Market Information, Holders and Dividends
Our common stock trades on the New York Stock Exchange under the symbol “Y”. The following table indicates quarterly high and low closing prices per share of our common stock, as reported on the New York Stock Exchange Composite Index, during the periods indicated.
| 2014 | 2013 | |||||||||||||||
| Quarter Ended: |
High | Low | High | Low | ||||||||||||
| March 31 |
$ | 407.38 | $ | 363.60 | $ | 395.92 | $ | 337.67 | ||||||||
| June 30 |
438.12 | 401.34 | 403.36 | 366.99 | ||||||||||||
| September 30 |
443.51 | 413.85 | 420.89 | 379.10 | ||||||||||||
| December 31 |
482.00 | 412.74 | 413.58 | 388.00 | ||||||||||||
As of February 16, 2015, there were approximately 829 holders of record of our common stock. This figure does not represent the actual number of beneficial owners of our common stock because such stock is frequently held in “street name” by securities dealers and others for the benefit of individual owners who may vote the shares.
Our Board of Directors determined not to declare a dividend for 2014 or 2013. Any future determination to pay dividends to holders of our common stock will be at the discretion of our Board of Directors and will be dependent upon many factors, including our earnings, financial condition, business needs and growth objectives, capital and surplus requirements of our reinsurance and insurance subsidiaries, regulatory restrictions, rating agency considerations and other factors.
Repurchases of Equity Securities
The following table summarizes our common stock repurchases in the quarter ended December 31, 2014:
| Total Number of Shares Repurchased |
Average Price Paid per Share |
Total Number of Shares Purchased as Part of Publicly Announced Plans or Programs(1) |
Approximate Dollar Value of Shares That May Yet Be Purchased Under the Plans or Programs (in millions)(1) |
|||||||||||||
| October 1 to October 31 |
146,798 | $ | 421.65 | 146,798 | $ | 307.5 | ||||||||||
| November 1 to November 30 |
14,041 | 454.94 | 14,041 | 301.1 | ||||||||||||
| December 1 to December 31 |
21,699 | 449.22 | 21,699 | 291.4 | ||||||||||||
|
|
|
|
|
|||||||||||||
| Total |
182,538 | 427.49 | 182,538 | |||||||||||||
|
|
|
|
|
|||||||||||||
| (1) | In October 2012, our Board of Directors authorized the repurchase of shares of our common stock, at such times and at prices as management determines advisable, up to an aggregate of $300.0 million. In July 2014, our Board of Directors authorized the repurchase of additional shares of common stock, at such times and at prices as management may determine advisable, up to an aggregate of $350.0 million upon the completion of the previously announced program. As of December 31, 2014, we had completed the 2012 repurchase program and had begun repurchasing shares under the new program. |
Performance Graph
The following information is not deemed to be “soliciting material” or to be “filed” with the SEC or subject to the liabilities of Section 18 of the Exchange Act, and the information shall not be deemed to be incorporated by reference in any filing by us under the Securities Act of 1933 or the Exchange Act, whether made before or after the date hereof and irrespective of any general incorporation language in any such filing.
58
Table of Contents
The following graph compares (i) the cumulative total stockholder return on our common stock; (ii) the cumulative total return on the Standard & Poor’s 500 Stock Index, or the “S&P 500 Index;” and (iii) the cumulative total return on the Standard & Poor’s 500 Property and Casualty Insurance Index, or the “P&C Index,” for the five year period beginning on December 31, 2009 through December 31, 2014. The graph assumes that the value of the investment was $100.00 on December 31, 2009.
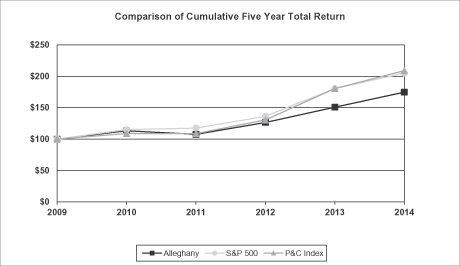
| Company / Index | Base Period |
INDEXED RETURNS Year Ending | ||||||||||
| 12/31/10 | 12/31/11 | 12/31/12 | 12/31/13 | 12/31/14 | ||||||||
|
Alleghany |
$100.00 | $113.22 | $107.54 | $126.44 | $150.77 | $174.72 | ||||||
| S&P 500 Index |
$100.00 | $115.06 | $117.49 | $136.30 | $180.44 | $205.14 | ||||||
| P&C Index |
$100.00 | $108.94 | $108.67 | $130.52 | $180.50 | $208.91 | ||||||
The graph above is based on the following assumptions: (i) cash dividends are reinvested on the ex-dividend date in respect of such dividend; and (ii) the two percent stock dividends we paid in each of 2010 and 2011 are included in the cumulative total stockholder return on our common stock.
59
Table of Contents
Item 6. Selected Financial Data.
Alleghany Corporation and Subsidiaries(1)
| Year Ended December 31, | ||||||||||||||||||||
| 2014 | 2013 | 2012 | 2011 | 2010 | ||||||||||||||||
| (in millions, except per share and share amounts) | ||||||||||||||||||||
| Operating Data |
||||||||||||||||||||
| Revenue |
$ | 5,231.8 | $ | 4,971.7 | $ | 4,753.2 | $ | 981.8 | $ | 985.4 | ||||||||||
|
|
|
|
|
|
|
|
|
|
|
|||||||||||
| Net earnings(3) |
$ | 679.2 | $ | 628.4 | $ | 702.2 | $ | 143.3 | $ | 198.5 | ||||||||||
|
|
|
|
|
|
|
|
|
|
|
|||||||||||
| Basic earnings per share of common stock(2)(3) |
$ | 41.40 | $ | 37.44 | $ | 45.48 | $ | 16.26 | $ | 21.85 | ||||||||||
|
|
|
|
|
|
|
|
|
|
|
|||||||||||
| Average number of shares of common stock(2) |
16,405,388 | 16,786,608 | 15,441,578 | 8,807,487 | 9,081,535 | |||||||||||||||
|
|
|
|
|
|
|
|
|
|
|
|||||||||||
| As of December 31, | ||||||||||||||||||||
| 2014 | 2013 | 2012 | 2011 | 2010 | ||||||||||||||||
| (in millions, except per share amounts) | ||||||||||||||||||||
| Balance Sheet |
||||||||||||||||||||
| Total assets |
$ | 23,489.4 | $ | 23,361.1 | $ | 22,808.0 | $ | 6,478.1 | $ | 6,431.7 | ||||||||||
|
|
|
|
|
|
|
|
|
|
|
|||||||||||
| Senior Notes |
$ | 1,767.1 | $ | 1,794.4 | $ | 1,811.5 | $ | 299.0 | $ | 298.9 | ||||||||||
|
|
|
|
|
|
|
|
|
|
|
|||||||||||
| Common stockholders’ equity(3) |
$ | 7,473.4 | $ | 6,923.8 | $ | 6,403.8 | $ | 2,925.7 | $ | 2,908.9 | ||||||||||
|
|
|
|
|
|
|
|
|
|
|
|||||||||||
| Common stockholders’ equity per share of common stock(2)(3) |
$ | 465.51 | $ | 412.96 | $ | 379.13 | $ | 342.12 | $ | 325.31 | ||||||||||
|
|
|
|
|
|
|
|
|
|
|
|||||||||||
| (1) | On August 30, 2013, we acquired Kentucky Trailer; on April 26, 2012, we acquired Bourn & Koch; and on March 6, 2012, we acquired TransRe. |
| (2) | Amounts have been adjusted for subsequent common stock dividends. |
| (3) | Attributable to Alleghany stockholders. |
60
Table of Contents
Item 7. Management’s Discussion and Analysis of Financial Condition and Results of Operations.
The following is a discussion and analysis of our financial condition and results of operations for the twelve months ended December 31, 2014, 2013 and 2012. This discussion and analysis should be read in conjunction with our audited consolidated financial statements and Notes to Consolidated Financial Statements set forth in Part II, Item 8, “Financial Statements and Supplementary Data” of this Form 10-K. This discussion contains forward-looking statements that involve risks and uncertainties and that are not historical facts, including statements about our beliefs and expectations. Our actual results could differ materially from those anticipated in these forward-looking statements as a result of various factors, including those discussed below and particularly under the headings “Risk Factors,” “Business” and “Note on Forward-Looking Statements” contained in Item 1A, Item 1, and Part I of this Form 10-K, respectively.
Comment on Non-GAAP Financial Measures
Throughout this Form 10-K, our analysis of our financial condition and results of operations is based on our consolidated financial statements which have been prepared in accordance with GAAP. Our results of operations have been presented in the way that we believe will be the most meaningful and useful to investors, analysts, rating agencies and others who use financial information in evaluating our performance. This presentation includes the use of underwriting profit, which is a “non-GAAP financial measure,” as such term is defined in Item 10(e) of Regulation S-K promulgated by the SEC. Underwriting profit represents net premiums earned less net loss and LAE and commissions, brokerage and other underwriting expenses, all as determined in accordance with GAAP, and does not include net investment income, net realized capital gains, other than temporary impairment, or “OTTI,” losses, gain on bargain purchase, other income, other operating expenses, corporate administration, amortization of intangible assets or interest expense. We consistently use underwriting profit as a supplement to earnings before income taxes, the most comparable GAAP financial measure, to evaluate the performance of our segments and believe that underwriting profit provides useful additional information to investors because it highlights net earnings attributable to a segment’s underwriting performance. Earnings before income taxes may show a profit despite an underlying underwriting loss, and when underwriting losses persist over extended periods, a reinsurance or an insurance company’s ability to continue as an ongoing concern may be at risk. However, underwriting profit is not meant to be considered in isolation or as a substitute for earnings before income taxes or any other measures of operating performance prepared in accordance with GAAP. A reconciliation of underwriting profit to earnings before income taxes is presented within “Consolidated Results of Operations.”
Overview
The following overview does not address all of the matters covered in the other sections of Management’s Discussion and Analysis of Financial Condition and Results of Operations or contain all of the information that may be important to our stockholders or the investing public. This overview should be read in conjunction with the other sections of Management’s Discussion and Analysis of Financial Condition and Results of Operations.
| Ÿ | Net earnings attributable to Alleghany stockholders were $679.2 million in 2014, compared with $628.4 million in 2013 and $702.2 million in 2012. |
| Ÿ | Earnings before income taxes were $931.9 million in 2014, compared with $855.2 million in 2013 and $719.3 million in 2012. |
| Ÿ | Net investment income decreased by 1.2 percent in 2014 over 2013, and increased by 48.8 percent in 2013 over 2012. |
| Ÿ | Net premiums written increased by 4.9 percent in 2014 over 2013, and increased by 15.1 percent in 2013 over 2012. |
| Ÿ | Underwriting profit was $494.8 million in 2014, compared with $420.7 million in 2013 and $220.3 million in 2012. |
| Ÿ | The combined ratio for our reinsurance and insurance segments was 88.8 percent in 2014, compared with 90.1 percent in 2013 and 94.1 percent in 2012. |
61
Table of Contents
| Ÿ | Catastrophe losses, net of reinsurance, were $95.2 million in 2014, compared with $150.9 million in 2013 and $470.1 million in 2012. |
| Ÿ | Net favorable prior accident year development on loss and LAE reserves was $215.2 million in 2014, compared with $203.0 million in 2013 and $12.3 million in 2012. The 2012 figure excludes $87.8 million of favorable prior accident year development on loss and LAE reserves acquired in the merger, which is included in TransRe’s current year net loss and LAE. |
As of December 31, 2014, we had total assets of $23.5 billion and total stockholders’ equity attributable to Alleghany stockholders of $7.5 billion. As of December 31, 2014, we had consolidated total investments of approximately $18.8 billion, of which $14.6 billion was invested in debt securities, $2.8 billion was invested in equity securities, $0.7 billion was invested in short-term investments and $0.7 billion was invested in other invested assets.
Consolidated Results of Operations
The following table summarizes our consolidated revenues, costs and expenses and earnings.
| Year Ended December 31, | ||||||||||||
| 2014 | 2013 | 2012 | ||||||||||
| (in millions) | ||||||||||||
| Revenues |
||||||||||||
| Net premiums earned |
$ | 4,410.6 | $ | 4,239.2 | $ | 3,733.0 | ||||||
| Net investment income |
459.9 | 465.7 | 313.0 | |||||||||
| Net realized capital gains |
247.1 | 232.1 | 157.9 | |||||||||
| Other than temporary impairment losses |
(36.3 | ) | (44.0 | ) | (2.9 | ) | ||||||
| Gain on bargain purchase |
— | — | 494.9 | |||||||||
| Other income |
150.5 | 78.7 | 57.3 | |||||||||
|
|
|
|
|
|
|
|||||||
| Total revenues |
5,231.8 | 4,971.7 | 4,753.2 | |||||||||
|
|
|
|
|
|
|
|||||||
| Costs and Expenses |
||||||||||||
| Net loss and LAE |
2,494.5 | 2,479.3 | 2,630.3 | |||||||||
| Commissions, brokerage and other underwriting expenses |
1,421.3 | 1,339.2 | 882.4 | |||||||||
| Other operating expenses |
252.7 | 164.9 | 123.7 | |||||||||
| Corporate administration |
47.1 | 36.1 | 75.8 | |||||||||
| Amortization of intangible assets |
(5.7 | ) | 10.2 | 253.3 | ||||||||
| Interest expense |
90.0 | 86.8 | 68.4 | |||||||||
|
|
|
|
|
|
|
|||||||
| Total costs and expenses |
4,299.9 | 4,116.5 | 4,033.9 | |||||||||
|
|
|
|
|
|
|
|||||||
| Earnings before income taxes |
931.9 | 855.2 | 719.3 | |||||||||
| Income taxes |
251.8 | 225.9 | 17.1 | |||||||||
|
|
|
|
|
|
|
|||||||
| Net earnings |
680.1 | 629.3 | 702.2 | |||||||||
| Net earnings attributable to noncontrolling interest |
0.9 | 0.9 | — | |||||||||
|
|
|
|
|
|
|
|||||||
| Net earnings attributable to Alleghany stockholders |
$ | 679.2 | $ | 628.4 | $ | 702.2 | ||||||
|
|
|
|
|
|
|
|||||||
| Revenues: |
||||||||||||
| Total reinsurance and insurance segments |
$ | 5,057.2 | $ | 4,809.9 | $ | 4,191.6 | ||||||
| Corporate activities(1) |
174.6 | 161.8 | 561.6 | |||||||||
| Earnings (losses) before income taxes: |
||||||||||||
| Total reinsurance and insurance segments |
$ | 1,013.7 | $ | 848.3 | $ | 295.6 | ||||||
| Corporate activities(1) |
(81.8 | ) | 6.9 | 423.7 | ||||||||
62
Table of Contents
| (1) | Consist of Alleghany Properties, SORC, our investments in Homesite (prior to its sale on December 31, 2013), and ORX and corporate activities at the parent level. In addition, beginning April 26, 2012, August 30, 2013 and July 31, 2014, corporate activities include the operating results of Bourn & Koch, Kentucky Trailer and our investment in Jazwares, respectively. Corporate activities also include interest expense associated with the senior notes issued by Alleghany, whereas interest expense associated with the senior notes issued by TransRe is included in “total reinsurance and insurance segments.” Information related to the senior notes can be found in Note 8 to Notes to Consolidated Financial Statements set forth in Part II, Item 8, “Financial Statements and Supplementary Data” of this Form 10-K. |
Segment results for our two reportable segments and for corporate activities for 2014, 2013 and 2012 are shown in the tables below:
| Year Ended December 31, 2014 |
Reinsurance Segment |
Insurance Segment |
Total Segments(1) |
Corporate Activities(1) |
Consolidated | |||||||||||||||
| (in millions, except ratios) | ||||||||||||||||||||
| Premiums written: |
||||||||||||||||||||
| Gross |
$ | 3,600.1 | $ | 1,525.3 | $ | 5,125.4 | $ | (28.8 | ) | $ | 5,096.6 | |||||||||
| Net |
3,410.1 | 1,087.4 | 4,497.5 | — | 4,497.5 | |||||||||||||||
| Net premiums earned |
3,330.7 | 1,079.9 | 4,410.6 | — | 4,410.6 | |||||||||||||||
|
|
|
|
|
|
|
|
|
|
|
|||||||||||
| Net loss and LAE: |
||||||||||||||||||||
| Current year (excluding catastrophe losses) |
2,044.8 | 569.7 | 2,614.5 | — | 2,614.5 | |||||||||||||||
| Current year catastrophe losses |
46.8 | 48.4 | 95.2 | — | 95.2 | |||||||||||||||
| Prior years |
(182.4 | ) | (32.8 | ) | (215.2 | ) | — | (215.2 | ) | |||||||||||
|
|
|
|
|
|
|
|
|
|
|
|||||||||||
| Total net loss and LAE |
1,909.2 | 585.3 | 2,494.5 | — | 2,494.5 | |||||||||||||||
| Commissions, brokerage and other underwriting expenses |
1,076.5 | 344.8 | 1,421.3 | — | 1,421.3 | |||||||||||||||
|
|
|
|
|
|
|
|
|
|
|
|||||||||||
| Underwriting profit(2) |
$ | 345.0 | $ | 149.8 | 494.8 | — | 494.8 | |||||||||||||
|
|
|
|
|
|||||||||||||||||
| Net investment income |
|
448.9 | 11.0 | 459.9 | ||||||||||||||||
| Net realized capital gains |
|
230.0 | 17.1 | 247.1 | ||||||||||||||||
| Other than temporary impairment losses |
|
(36.3 | ) | — | (36.3 | ) | ||||||||||||||
| Gain on bargain purchase |
|
— | — | — | ||||||||||||||||
| Other income |
|
4.0 | 146.5 | 150.5 | ||||||||||||||||
| Other operating expenses |
|
85.7 | 167.0 | 252.7 | ||||||||||||||||
| Corporate administration |
|
1.3 | 45.8 | 47.1 | ||||||||||||||||
| Amortization of intangible assets |
|
(6.1 | ) | 0.4 | (5.7 | ) | ||||||||||||||
| Interest expense |
|
46.8 | 43.2 | 90.0 | ||||||||||||||||
|
|
|
|
|
|
|
|||||||||||||||
| Earnings (losses) before income taxes |
|
$ | 1,013.7 | $ | (81.8 | ) | $ | 931.9 | ||||||||||||
|
|
|
|
|
|
|
|||||||||||||||
| Loss ratio(3): |
||||||||||||||||||||
| Current year (excluding catastrophe losses) |
61.4 | % | 52.8 | % | 59.3 | % | ||||||||||||||
| Current year catastrophe losses |
1.4 | % | 4.5 | % | 2.2 | % | ||||||||||||||
| Prior years |
-5.5 | % | -3.1 | % | -4.9 | % | ||||||||||||||
|
|
|
|
|
|
|
|||||||||||||||
| Total net loss and LAE |
57.3 | % | 54.2 | % | 56.6 | % | ||||||||||||||
| Expense ratio(4) |
32.3 | % | 31.9 | % | 32.2 | % | ||||||||||||||
|
|
|
|
|
|
|
|||||||||||||||
| Combined ratio(5) |
89.6 | % | 86.1 | % | 88.8 | % | ||||||||||||||
|
|
|
|
|
|
|
|||||||||||||||
63
Table of Contents
| Year Ended December 31, 2013 |
Reinsurance Segment |
Insurance Segment |
Total Segments(1) |
Corporate Activities(1) |
Consolidated | |||||||||||||||
| (in millions, except ratios) | ||||||||||||||||||||
| Premiums written: |
||||||||||||||||||||
| Gross |
$ | 3,423.0 | $ | 1,486.4 | $ | 4,909.4 | $ | (23.1) | $ | 4,886.3 | ||||||||||
| Net |
3,248.0 | 1,039.4 | 4,287.4 | — | 4,287.4 | |||||||||||||||
| Net premiums earned |
3,278.7 | 960.5 | 4,239.2 | — | 4,239.2 | |||||||||||||||
|
|
|
|
|
|
|
|
|
|
|
|||||||||||
| Net loss and LAE: |
||||||||||||||||||||
| Current year (excluding catastrophe losses) |
2,058.4 | 473.0 | 2,531.4 | — | 2,531.4 | |||||||||||||||
| Current year catastrophe losses |
92.1 | 58.8 | 150.9 | — | 150.9 | |||||||||||||||
| Prior years |
(224.1 | ) | 21.1 | (203.0 | ) | — | (203.0 | ) | ||||||||||||
|
|
|
|
|
|
|
|
|
|
|
|||||||||||
| Total net loss and LAE |
1,926.4 | 552.9 | 2,479.3 | — | 2,479.3 | |||||||||||||||
| Commissions, brokerage and other underwriting expenses |
1,018.3 | 320.9 | 1,339.2 | — | 1,339.2 | |||||||||||||||
|
|
|
|
|
|
|
|
|
|
|
|||||||||||
| Underwriting profit(2) |
$ | 334.0 | $ | 86.7 | 420.7 | — | 420.7 | |||||||||||||
|
|
|
|
|
|||||||||||||||||
| Net investment income |
|
415.2 | 50.5 | 465.7 | ||||||||||||||||
| Net realized capital gains |
|
197.7 | 34.4 | 232.1 | ||||||||||||||||
| Other than temporary impairment losses |
|
(44.0 | ) | — | (44.0 | ) | ||||||||||||||
| Gain on bargain purchase |
|
— | — | — | ||||||||||||||||
| Other income |
|
1.8 | 76.9 | 78.7 | ||||||||||||||||
| Other operating expenses |
|
83.7 | 81.2 | 164.9 | ||||||||||||||||
| Corporate administration |
|
— | 36.1 | 36.1 | ||||||||||||||||
| Amortization of intangible assets |
|
10.0 | 0.2 | 10.2 | ||||||||||||||||
| Interest expense |
|
49.4 | 37.4 | 86.8 | ||||||||||||||||
|
|
|
|
|
|
|
|||||||||||||||
| Earnings before income taxes |
|
$ | 848.3 | $ 6.9 | $ | 855.2 | ||||||||||||||
|
|
|
|
|
|
|
|||||||||||||||
| Loss ratio(3): |
||||||||||||||||||||
| Current year (excluding catastrophe losses) |
62.8 | % | 49.3 | % | 59.7 | % | ||||||||||||||
| Current year catastrophe losses |
2.8 | % | 6.1 | % | 3.6 | % | ||||||||||||||
| Prior years |
-6.8 | % | 2.2 | % | -4.8 | % | ||||||||||||||
|
|
|
|
|
|
|
|||||||||||||||
| Total net loss and LAE |
58.8 | % | 57.6 | % | 58.5 | % | ||||||||||||||
| Expense ratio(4) |
31.1 | % | 33.4 | % | 31.6 | % | ||||||||||||||
|
|
|
|
|
|
|
|||||||||||||||
| Combined ratio(5) |
89.9 | % | 91.0 | % | 90.1 | % | ||||||||||||||
|
|
|
|
|
|
|
|||||||||||||||
64
Table of Contents
| Year Ended December 31, 2012 |
Reinsurance Segment |
Insurance Segment |
Total Segments(1) |
Corporate Activities(1) |
Consolidated | |||||||||||||||
| (in millions, except ratios) | ||||||||||||||||||||
| Premiums written: |
||||||||||||||||||||
| Gross |
$ | 2,940.2 | $ | 1,300.9 | $ | 4,241.1 | $ | (18.2 | ) | $ | 4,222.9 | |||||||||
| Net |
2,840.7 | 883.2 | 3,723.9 | — | 3,723.9 | |||||||||||||||
| Net premiums earned |
2,915.9 | 817.1 | 3,733.0 | — | 3,733.0 | |||||||||||||||
|
|
|
|
|
|
|
|
|
|
|
|||||||||||
| Net loss and LAE: |
||||||||||||||||||||
| Current year (excluding catastrophe losses) |
1,779.7 | 392.8 | 2,172.5 | — | 2,172.5 | |||||||||||||||
| Current year catastrophe losses |
278.4 | 191.7 | 470.1 | — | 470.1 | |||||||||||||||
| Prior years(6) |
— | (12.3 | ) | (12.3 | ) | — | (12.3 | ) | ||||||||||||
|
|
|
|
|
|
|
|
|
|
|
|||||||||||
| Total net loss and LAE |
2,058.1 | 572.2 | 2,630.3 | — | 2,630.3 | |||||||||||||||
| Commissions, brokerage and other underwriting expenses |
591.1 | 291.3 | 882.4 | — | 882.4 | |||||||||||||||
|
|
|
|
|
|
|
|
|
|
|
|||||||||||
| Underwriting profit (loss)(2) |
$ | 266.7 | $ | (46.4 | ) | 220.3 | — | 220.3 | ||||||||||||
|
|
|
|
|
|||||||||||||||||
| Net investment income |
|
317.5 | (4.5 | ) | 313.0 | |||||||||||||||
| Net realized capital gains |
|
117.9 | 40.0 | 157.9 | ||||||||||||||||
| Other than temporary impairment losses |
|
(2.9 | ) | — | (2.9 | ) | ||||||||||||||
| Gain on bargain purchase |
|
— | 494.9 | 494.9 | ||||||||||||||||
| Other income |
|
26.1 | 31.2 | 57.3 | ||||||||||||||||
| Other operating expenses |
|
89.2 | 34.5 | 123.7 | ||||||||||||||||
| Corporate administration |
|
— | 75.8 | 75.8 | ||||||||||||||||
| Amortization of intangible assets |
|
253.3 | — | 253.3 | ||||||||||||||||
| Interest expense |
|
40.8 | 27.6 | 68.4 | ||||||||||||||||
|
|
|
|
|
|
|
|||||||||||||||
| Earnings before income taxes |
|
$ | 295.6 | $ | 423.7 | $ | 719.3 | |||||||||||||
|
|
|
|
|
|
|
|||||||||||||||
| Loss ratio(3): |
||||||||||||||||||||
| Current year (excluding catastrophe losses) |
61.0 | % | 48.1 | % | 58.2 | % | ||||||||||||||
| Current year catastrophe losses |
9.6 | % | 23.4 | % | 12.6 | % | ||||||||||||||
| Prior years |
0.0 | % | -1.5 | % | -0.3 | % | ||||||||||||||
|
|
|
|
|
|
|
|||||||||||||||
| Total net loss and LAE |
70.6 | % | 70.0 | % | 70.5 | % | ||||||||||||||
| Expense ratio(4) |
20.3 | % | 35.7 | % | 23.6 | % | ||||||||||||||
|
|
|
|
|
|
|
|||||||||||||||
| Combined ratio(5) |
90.9 | % | 105.7 | % | 94.1 | % | ||||||||||||||
|
|
|
|
|
|
|
|||||||||||||||
| (1) | Total Segments excludes elimination of minor reinsurance activity between segments which is reported in corporate activities. |
| (2) | Underwriting profit represents net premiums earned less net loss and LAE and commissions, brokerage and other underwriting expenses, all as determined in accordance with GAAP, and does not include net investment income, net realized capital gains, OTTI losses, gain on bargain purchase, other income, other operating expenses, corporate administration, amortization of intangible assets or interest expense. Underwriting profit is a non-GAAP financial measure and does not replace earnings before income taxes determined in accordance with GAAP as a measure of profitability. See “Comment on Non-GAAP Financial Measures” herein for additional detail on the presentation of our results of operations. |
| (3) | The loss ratio is derived by dividing the amount of net loss and LAE by net premiums earned, all as determined in accordance with GAAP. |
| (4) | The expense ratio is derived by dividing the amount of commissions, brokerage and other underwriting expenses by net premiums earned, all as determined in accordance with GAAP. |
| (5) | The combined ratio is the sum of the loss ratio and expense ratio, all as determined in accordance with GAAP. The combined ratio represents the percentage of each premium dollar a reinsurance or an insurance company has to spend on net loss and LAE, and commissions, brokerage and other underwriting expenses. |
| (6) | $87.8 million of favorable prior accident year on loss and LAE reserves acquired in the merger is included in current year net loss and LAE. |
65
Table of Contents
Comparison of 2014, 2013 and 2012
A comparison of our consolidated results for 2014 compared with 2013, and for 2013 compared with 2012 follows. Our results for 2013 compared with 2012 reflect certain impacts that arose from the merger. These impacts primarily relate to the gain on bargain purchase of $494.9 million in 2012, due diligence, legal, investment banking and other merger-related costs, or “Transaction Costs,” (a component of corporate administration expense) of $33.8 million in 2012, and the write-off of deferred acquisition costs of TransRe as of the TransRe Acquisition Date, as well as the establishment of an intangible asset roughly approximating the amount of deferred acquisition costs. This intangible asset was amortized over an approximate one year period, similar to how deferred acquisition costs are amortized, but is shown as part of amortization of intangible assets as opposed to part of commissions, brokerage and other underwriting expenses. This amortization was largely completed as of March 6, 2013, the one year anniversary of the TransRe Acquisition Date. In addition, as the merger closed on March 6, 2012, comparative amounts for 2013 reflect activity for the entire year while amounts for 2012 reflect activity at TransRe only for the 300 day period from the TransRe Acquisition Date to December 31, 2012. Information related to the merger can be found in Note 2 to Notes to Consolidated Financial Statements set forth in Part II, Item 8, “Financial Statements and Supplementary Data” of this Form 10-K.
Premiums. The following table summarizes our consolidated premiums.
| Year Ended December 31, | Percent Change | |||||||||||||||||||
| 2014 | 2013 | 2012 | 2014 vs 2013 | 2013 vs 2012 | ||||||||||||||||
| (in millions) | ||||||||||||||||||||
| Premiums written: |
||||||||||||||||||||
| Gross |
$ | 5,096.6 | $ | 4,886.3 | $ | 4,222.9 | 4.3 | % | 15.7 | % | ||||||||||
| Net |
4,497.5 | 4,287.4 | 3,723.9 | 4.9 | % | 15.1 | % | |||||||||||||
| Net premiums earned |
4,410.6 | 4,239.2 | 3,733.0 | 4.0 | % | 13.6 | % | |||||||||||||
2014 vs 2013. The increases in gross premiums written and net premiums written in 2014 from 2013 reflect increases at our reinsurance segment and, to a lesser extent, at our insurance segment. The increase at our reinsurance segment primarily reflects certain expanded treaty participations with existing long-term clients. The increase at our insurance segment reflects significant growth at CapSpecialty and PacificComp. The increases in net premiums earned in 2014 from 2013 reflect increases at our insurance segment and, to a lesser extent, at our reinsurance segment.
2013 vs 2012. The increases in gross premiums written, net premiums written and net premiums earned in 2013 from 2012 primarily reflect increases at our reinsurance segment due to the merger impacts discussed above.
Premiums for 2014, 2013 and 2012 are more fully described in the following pages.
Net loss and LAE. The following table summarizes our consolidated net loss and LAE.
| Year Ended December 31, | Percent Change | |||||||||||||||||||
| 2014 | 2013 | 2012 | 2014 vs 2013 | 2013 vs 2012 | ||||||||||||||||
| (in millions, except ratios) | ||||||||||||||||||||
| Net loss and LAE: |
||||||||||||||||||||
| Current year (excluding catastrophe losses) |
$ | 2,614.5 | $ | 2,531.4 | $ | 2,172.5 | 3.3% | 16.5% | ||||||||||||
| Current year catastrophe losses |
95.2 | 150.9 | 470.1 | -36.9% | -67.9% | |||||||||||||||
| Prior years |
(215.2 | ) | (203.0 | ) | (12.3 | ) | 6.0% | 1550.4% | ||||||||||||
|
|
|
|
|
|
|
|||||||||||||||
| $ | 2,494.5 | $ | 2,479.3 | $ | 2,630.3 | 0.6% | -5.7% | |||||||||||||
| Net loss and LAE ratio: |
||||||||||||||||||||
| Current year (excluding catastrophe losses) |
59.3% | 59.7% | 58.2% | |||||||||||||||||
| Current year catastrophe losses |
2.2% | 3.6% | 12.6% | |||||||||||||||||
| Prior years |
-4.9% | -4.8% | -0.3% | |||||||||||||||||
|
|
|
|
|
|
|
|||||||||||||||
| 56.6% | 58.5% | 70.5% | ||||||||||||||||||
66
Table of Contents
2014 vs 2013. The increase in net loss and LAE in 2014 from 2013 primarily reflects the impact of increased net premiums earned at our insurance segment, as discussed above, and lower net favorable prior year loss and LAE reserve development at our reinsurance segment, partially offset by lower catastrophe losses at our reinsurance and insurance segments, and net favorable prior year loss and LAE reserve development in 2014 compared to net adverse prior year loss and LAE reserve development in 2013 at our insurance segment. By contrast, our loss ratio was lower in 2014 from 2013, primarily reflecting lower catastrophe losses at our reinsurance and insurance segments.
2013 vs 2012. The decrease in net loss and LAE in 2013 from 2012 primarily reflects lower catastrophe losses at our reinsurance and insurance segments and higher net favorable prior year loss and LAE reserve development at our reinsurance segment, partially offset by the merger impacts discussed above. 2012 catastrophe losses include significant losses from Super Storm Sandy. The 2012 net loss and LAE figure related to prior years excludes $87.8 million of favorable prior accident year development on loss and LAE reserves acquired in the merger, which is included in TransRe’s current year net loss and LAE.
Net loss and LAE for 2014, 2013 and 2012 are more fully described in the following pages.
Commissions, brokerage and other underwriting expenses. The following table summarizes our consolidated commissions, brokerage and other underwriting expenses.
| Year Ended December 31, | Percent Change | |||||||||||||||||||
| 2014 | 2013 | 2012 | 2014 vs 2013 | 2013 vs 2012 | ||||||||||||||||
| (in millions, except ratios) | ||||||||||||||||||||
| Commissions, brokerage and other underwriting expenses |
$ | 1,421.3 | $ | 1,339.2 | $ | 882.4 | 6.1 | % | 51.8 | % | ||||||||||
| Expense ratio |
32.2% | 31.6% | 23.6% | |||||||||||||||||
2014 vs 2013. The increase in commissions, brokerage and other underwriting expenses in 2014 from 2013 primarily reflects the impact of increased net premiums earned at our reinsurance and insurance segments, as discussed above, and higher commission rates at our reinsurance segment.
2013 vs 2012. The increase in commissions, brokerage and other underwriting expenses in 2013 from 2012 primarily reflects the merger impacts discussed above.
Commissions, brokerage and other underwriting expenses for 2014, 2013 and 2012 are more fully described in the following pages.
Underwriting profit. The following table summarizes our consolidated underwriting profit.
| Year Ended December 31, | Percent Change | |||||||||||||||||||
| 2014 | 2013 | 2012 | 2014 vs 2013 | 2013 vs 2012 | ||||||||||||||||
| (in millions, except ratios) | ||||||||||||||||||||
| Underwriting profit |
$ | 494.8 | $ | 420.7 | $ | 220.3 | 17.6% | 91.0% | ||||||||||||
| Combined ratio |
88.8% | 90.1% | 94.1% | |||||||||||||||||
2014 vs 2013. The increase in underwriting profit in 2014 from 2013 primarily reflects lower catastrophe losses at our reinsurance and insurance segments.
2013 vs 2012. The increase in underwriting profit in 2013 from 2012 primarily reflects lower catastrophe losses at our reinsurance and insurance segments, higher net favorable prior year loss and LAE reserve development at our reinsurance segment and the merger impacts discussed above. 2012 catastrophe losses include significant losses from Super Storm Sandy.
Underwriting profits for 2014, 2013 and 2012 are more fully described in the following pages.
67
Table of Contents
Investment results. The following table summarizes our consolidated investment results.
| Year Ended December 31, | Percent Change | |||||||||||||||||||
| 2014 | 2013 | 2012 | 2014 vs 2013 | 2013 vs 2012 | ||||||||||||||||
| (in millions) | ||||||||||||||||||||
| Net investment income |
$459.9 | $465.7 | $313.0 | -1.2% | 48.8% | |||||||||||||||
| Net realized capital gains |
247.1 | 232.1 | 157.9 | 6.5% | 47.0% | |||||||||||||||
| Other than temporary impairment losses |
(36.3 | ) | (44.0 | ) | (2.9 | ) | -17.5% | 1417.2% | ||||||||||||
2014 vs 2013. The decrease in net investment income in 2014 from 2013 primarily reflects the absence in 2014 of earnings from Homesite (which was sold on December 31, 2013), compared with $42.9 million of earnings from Homesite in 2013 and, to a lesser extent, the impact of changes in foreign currency exchange rates, partially offset by higher interest income from more favorable reinvestment rates for our reinsurance segment and our increased allocation to investment-grade and below investment-grade credit instruments managed through our investment management relationship with Ares Management, L.P., or “Ares.” Absent earnings from Homesite, our net investment income would have increased in 2014.
2013 vs 2012. The increase in net investment income in 2013 from 2012 primarily reflects the merger impacts discussed above.
Investment results for 2014, 2013 and 2012 are more fully described in the following pages.
Other income and expenses. The following table summarizes our consolidated other income and expenses.
| Year Ended December 31, | Percent Change | |||||||||||||||||||
| 2014 | 2013 | 2012 | 2014 vs 2013 | 2013 vs 2012 | ||||||||||||||||
| (in millions) | ||||||||||||||||||||
| Gain on bargain purchase |
$ — | $ — | $494.9 | — | -100.0% | |||||||||||||||
| Other income |
150.5 | 78.7 | 57.3 | 91.2% | 37.3% | |||||||||||||||
| Other operating expenses |
252.7 | 164.9 | 123.7 | 53.2% | 33.3% | |||||||||||||||
| Corporate administration |
47.1 | 36.1 | 75.8 | 30.5% | -52.4% | |||||||||||||||
| Amortization of intangible assets |
(5.7 | ) | 10.2 | 253.3 | -155.9% | -96.0% | ||||||||||||||
| Interest expense |
90.0 | 86.8 | 68.4 | 3.7% | 26.9% | |||||||||||||||
Gain on bargain purchase. The gain on bargain purchase in 2012 reflects the merger impacts discussed above.
Other income and other operating expenses. Other income and other operating expenses include revenues and expenses associated with our non-insurance operations. Other operating expenses also includes the long-term incentive compensation of our reinsurance segment and insurance segment, which totaled $83.5 million, $80.1 million and $84.9 million for 2014, 2013 and 2012, respectively (see Note 14 to Notes to Consolidated Financial Statements set forth in Part II, Item 8, “Financial Statements and Supplementary Data” of this Form 10-K for additional information).
The increases in other income and other operating expenses in 2014 from 2013 and 2013 from 2012 primarily reflect the acquisition of Kentucky Trailer on August 30, 2013 and Bourn & Koch on April 26, 2012 and, to a lesser extent, increased expenses at SORC.
Corporate administration. The increase in corporate administration expense in 2014 from 2013 primarily reflects the absence of a one-time reduction in expenses of $8.8 million from the freezing of pension benefits at the parent level in 2013. The decrease in corporate administration expense in 2013 from 2012 primarily reflects the Transaction Costs of the merger as discussed above.
68
Table of Contents
Amortization of intangible assets. Amortization of intangible assets in 2012 and 2013 primarily reflect the merger impacts discussed above. Amortization of intangible assets in 2014 reflects the amortization of net intangible liabilities arising from the merger.
Income taxes. The following table summarizes our consolidated income tax expense.
| Year Ended December 31, | Percent Change | |||||||||||||||||||
| 2014 | 2013 | 2012 | 2014 vs 2013 | 2013 vs 2012 | ||||||||||||||||
| (in millions, except ratios) | ||||||||||||||||||||
| Income taxes |
$251.8 | $225.9 | $17.1 | 11.5% | 1221.1% | |||||||||||||||
| Effective tax rate |
27.0% | 26.4% | 2.4% | |||||||||||||||||
2014 vs 2013. The slightly higher effective tax rate in 2014 compared with 2013 primarily reflects higher taxable income in 2014 relative to a fairly steady level of tax-exempt interest income arising from municipal bond securities.
2013 vs 2012. The higher effective tax rate in 2013 compared with 2012 primarily reflects the absence of a gain on bargain purchase, which had a significant impact in 2012. The gain on bargain purchase resulted in a significant increase in earnings before income taxes without a corresponding increase in income taxes. The impact of the gain on bargain purchase on the effective tax rate in 2012 was partially offset by the impact of certain non-deductible Transaction Costs in 2012, which resulted in losses before income taxes without a corresponding decrease in income taxes.
Earnings. The following table summarizes our earnings.
| Year Ended December 31, | Percent Change | |||||||||||||||||||
| 2014 | 2013 | 2012 | 2014 vs 2013 | 2013 vs 2012 | ||||||||||||||||
| (in millions) | ||||||||||||||||||||
| Earnings before income taxes |
$931.9 | $855.2 | $719.3 | 9.0% | 18.9% | |||||||||||||||
| Net earnings attributable to Alleghany stockholders |
679.2 | 628.4 | 702.2 | 8.1% | -10.5% | |||||||||||||||
2014 vs 2013. The increases in earnings before income taxes and net earnings attributable to Alleghany stockholders in 2014 from 2013 primarily reflect higher underwriting profits at our reinsurance and insurance segments.
2013 vs 2012. Earnings before income taxes increased in 2013 from 2012, whereas net earnings attributable to Alleghany stockholders decreased in 2013 from 2012. These variances primarily reflect the merger impacts discussed above, especially the gain on bargain purchase, which resulted in a significant increase in earnings before income taxes without a corresponding increase in income taxes. These variances also reflect substantially lower catastrophe losses in 2013.
Reinsurance Segment Underwriting Results
The reinsurance segment is comprised of TransRe’s property and casualty & other lines of business. TransRe also writes a modest amount of property and casualty insurance business, which is included in the reinsurance segment. For a more detailed description of our reinsurance segment, see Part I, Item 1, “Business—Segment Information—Reinsurance Segment” of this Form 10-K.
69
Table of Contents
The underwriting results of the reinsurance segment are presented below.
| Year Ended December 31, 2014 | Property | Casualty & other(1) |
Total | |||||||||
| (in millions, except ratios) | ||||||||||||
| Premiums written: |
||||||||||||
| Gross |
$ | 1,205.4 | $ | 2,394.7 | $ | 3,600.1 | ||||||
| Net |
1,073.4 | 2,336.7 | 3,410.1 | |||||||||
| Net premiums earned |
1,048.6 | 2,282.1 | 3,330.7 | |||||||||
|
|
|
|
|
|
|
|||||||
| Net loss and LAE: |
||||||||||||
| Current year (excluding catastrophe losses) |
449.5 | 1,595.3 | 2,044.8 | |||||||||
| Current year catastrophe losses |
46.8 | — | 46.8 | |||||||||
| Prior years |
(73.1 | ) | (109.3 | ) | (182.4 | ) | ||||||
|
|
|
|
|
|
|
|||||||
| Total net loss and LAE |
423.2 | 1,486.0 | 1,909.2 | |||||||||
| Commissions, brokerage and other underwriting expenses |
319.3 | 757.2 | 1,076.5 | |||||||||
|
|
|
|
|
|
|
|||||||
| Underwriting profit(2) |
$ | 306.1 | $ | 38.9 | $ | 345.0 | ||||||
|
|
|
|
|
|
|
|||||||
| Loss ratio(3): |
||||||||||||
| Current year (excluding catastrophe losses) |
42.9 | % | 69.9 | % | 61.4 | % | ||||||
| Current year catastrophe losses |
4.5 | % | 0.0 | % | 1.4 | % | ||||||
| Prior years |
-7.0 | % | -4.8 | % | -5.5 | % | ||||||
|
|
|
|
|
|
|
|||||||
| Total net loss and LAE |
40.4 | % | 65.1 | % | 57.3 | % | ||||||
| Expense ratio(4) |
30.5 | % | 33.2 | % | 32.3 | % | ||||||
|
|
|
|
|
|
|
|||||||
| Combined ratio(5) |
70.9 | % | 98.3 | % | 89.6 | % | ||||||
|
|
|
|
|
|
|
|||||||
| Year Ended December 31, 2013 | Property | Casualty & other(1) |
Total | |||||||||
| (in millions, except ratios) | ||||||||||||
| Premiums written: |
||||||||||||
| Gross |
$ | 1,129.9 | $ | 2,293.1 | $ | 3,423.0 | ||||||
| Net |
988.4 | 2,259.6 | 3,248.0 | |||||||||
| Net premiums earned |
989.2 | 2,289.5 | 3,278.7 | |||||||||
|
|
|
|
|
|
|
|||||||
| Net loss and LAE: |
||||||||||||
| Current year (excluding catastrophe losses) |
409.1 | 1,649.3 | 2,058.4 | |||||||||
| Current year catastrophe losses |
92.1 | — | 92.1 | |||||||||
| Prior years |
(184.7 | ) | (39.4 | ) | (224.1 | ) | ||||||
|
|
|
|
|
|
|
|||||||
| Total net loss and LAE |
316.5 | 1,609.9 | 1,926.4 | |||||||||
| Commissions, brokerage and other underwriting expenses |
293.3 | 725.0 | 1,018.3 | |||||||||
|
|
|
|
|
|
|
|||||||
| Underwriting profit (loss)(2) |
$ | 379.4 | $ | (45.4 | ) | $ | 334.0 | |||||
|
|
|
|
|
|
|
|||||||
| Loss ratio(3): |
||||||||||||
| Current year (excluding catastrophe losses) |
41.4 | % | 72.0 | % | 62.8 | % | ||||||
| Current year catastrophe losses |
9.3 | % | 0.0 | % | 2.8 | % | ||||||
| Prior years |
-18.7 | % | -1.7 | % | -6.8 | % | ||||||
|
|
|
|
|
|
|
|||||||
| Total net loss and LAE |
32.0 | % | 70.3 | % | 58.8 | % | ||||||
| Expense ratio(4) |
29.7 | % | 31.7 | % | 31.1 | % | ||||||
|
|
|
|
|
|
|
|||||||
| Combined ratio(5) |
61.7 | % | 102.0 | % | 89.9 | % | ||||||
|
|
|
|
|
|
|
|||||||
70
Table of Contents
| Year Ended December 31, 2012 | Property | Casualty & other(1) |
Total | |||||||||
| (in millions, except ratios) | ||||||||||||
| Premiums written: |
||||||||||||
| Gross |
$ | 966.2 | $ | 1,974.0 | $ | 2,940.2 | ||||||
| Net |
896.9 | 1,943.8 | 2,840.7 | |||||||||
| Net premiums earned |
900.9 | 2,015.0 | 2,915.9 | |||||||||
|
|
|
|
|
|
|
|||||||
| Net loss and LAE: |
||||||||||||
| Current year (excluding catastrophe losses) |
314.2 | 1,465.5 | 1,779.7 | |||||||||
| Current year catastrophe losses |
252.2 | 26.2 | 278.4 | |||||||||
| Prior years(6) |
— | — | — | |||||||||
|
|
|
|
|
|
|
|||||||
| Total net loss and LAE |
566.4 | 1,491.7 | 2,058.1 | |||||||||
| Commissions, brokerage and other underwriting expenses |
191.1 | 400.0 | 591.1 | |||||||||
|
|
|
|
|
|
|
|||||||
| Underwriting profit(2) |
$ | 143.4 | $ | 123.3 | $ | 266.7 | ||||||
|
|
|
|
|
|
|
|||||||
| Loss ratio(3): |
||||||||||||
| Current year (excluding catastrophe losses) |
34.9 | % | 72.7 | % | 61.0 | % | ||||||
| Current year catastrophe losses |
28.0 | % | 1.3 | % | 9.6 | % | ||||||
| Prior years |
0.0 | % | 0.0 | % | 0.0 | % | ||||||
|
|
|
|
|
|
|
|||||||
| Total net loss and LAE |
62.9 | % | 74.0 | % | 70.6 | % | ||||||
| Expense ratio(4) |
21.2 | % | 19.9 | % | 20.3 | % | ||||||
|
|
|
|
|
|
|
|||||||
| Combined ratio(5) |
84.1 | % | 93.9 | % | 90.9 | % | ||||||
|
|
|
|
|
|
|
|||||||
| (1) | Primarily consists of the following assumed reinsurance lines of business: directors’ and officers’ liability; errors and omissions liability; general liability; medical malpractice; ocean marine and aviation; auto liability; accident and health; surety; and credit. |
| (2) | Underwriting profit represents net premiums earned less net loss and LAE and commissions, brokerage and other underwriting expenses, all as determined in accordance with GAAP, and does not include net investment income, net realized capital gains, OTTI losses, gain on bargain purchase, other income, other operating expenses, corporate administration, amortization of intangible assets or interest expense. Underwriting profit is a non-GAAP financial measure and does not replace earnings before income taxes determined in accordance with GAAP as a measure of profitability. See “Comment on Non-GAAP Financial Measures” herein for additional detail on the presentation of our results of operations. |
| (3) | The loss ratio is derived by dividing the amount of net loss and LAE by net premiums earned, all as determined in accordance with GAAP. |
| (4) | The expense ratio is derived by dividing the amount of commissions, brokerage and other underwriting expenses by net premiums earned, all as determined in accordance with GAAP. |
| (5) | The combined ratio is the sum of the loss ratio and expense ratio, all as determined in accordance with GAAP. The combined ratio represents the percentage of each premium dollar a reinsurance or an insurance company has to spend on net loss and LAE, and commissions, brokerage and other underwriting expenses. |
| (6) | $56.6 million, $31.2 million and $87.8 million of favorable prior accident year development on loss and LAE reserves acquired in the merger for property, casualty & other and total, respectively, are included in current year net loss and LAE. |
71
Table of Contents
Reinsurance Segment: Premiums. The following table summarizes premiums for the reinsurance segment.
| Year Ended December 31, | Percent Change | |||||||||||||||||||
| 2014 | 2013 | 2012 | 2014 vs 2013 | 2013 vs 2012 | ||||||||||||||||
| (in millions) | ||||||||||||||||||||
| Property |
||||||||||||||||||||
| Premiums written: |
||||||||||||||||||||
| Gross |
$ | 1,205.4 | $ | 1,129.9 | $ | 966.2 | 6.7% | 16.9% | ||||||||||||
| Net |
1,073.4 | 988.4 | 896.9 | 8.6% | 10.2% | |||||||||||||||
| Net premiums earned |
1,048.6 | 989.2 | 900.9 | 6.0% | 9.8% | |||||||||||||||
| Casualty & other |
||||||||||||||||||||
| Premiums written: |
||||||||||||||||||||
| Gross |
$ | 2,394.7 | $ | 2,293.1 | $ | 1,974.0 | 4.4% | 16.2% | ||||||||||||
| Net |
2,336.7 | 2,259.6 | 1,943.8 | 3.4% | 16.2% | |||||||||||||||
| Net premiums earned |
2,282.1 | 2,289.5 | 2,015.0 | -0.3% | 13.6% | |||||||||||||||
| Total |
||||||||||||||||||||
| Premiums written: |
||||||||||||||||||||
| Gross |
$ | 3,600.1 | $ | 3,423.0 | $ | 2,940.2 | 5.2% | 16.4% | ||||||||||||
| Net |
3,410.1 | 3,248.0 | 2,840.7 | 5.0% | 14.3% | |||||||||||||||
| Net premiums earned |
3,330.7 | 3,278.7 | 2,915.9 | 1.6% | 12.4% | |||||||||||||||
Property. Gross premiums written increased 6.7 percent in 2014 from 2013, primarily reflecting the impact of certain expanded treaty participations with existing long-term clients, partially offset by reductions in pricing for property reinsurance contracts as the market became increasingly price competitive and the impact of changes in foreign currency rates. Excluding the impact of changes in foreign currency rates, gross premiums written increased 8.0 percent in 2014 from 2013. Net premiums earned in 2014 increased by 6.0 percent from 2013. The increase in net premiums earned reflects certain expanded treaty participations with existing long-term clients, partially offset by the impact of changes in foreign currency rates. Excluding the impact of changes in foreign currency rates, net premiums earned increased 7.5 percent in 2014 from 2013.
The increases in gross premiums written and net premiums earned in 2013 from 2012 primarily reflect the merger impacts discussed above, specifically related to the inclusion of operations from TransRe for the entire 2013 year, compared with the 300 day period subsequent to the TransRe Acquisition Date for 2012.
Absent the impact of the merger, gross premiums written and net premiums earned would have decreased in 2013 from 2012. The decrease in gross premiums written reflects an increasingly competitive reinsurance market, which expanded its capacity despite the lack of market need, as well as decisions made by TransRe in recent years to non-renew or reduce participation on certain potentially less profitable treaties and to shift certain business from proportional to potentially more profitable non-proportional exposure. The decrease in net premiums earned primarily reflects a decrease in gross premiums written in earlier quarters. In addition, the decrease in both gross premiums written and net premiums earned reflects the absence of significant assumed reinstatement premiums. $29.8 million of gross premiums written and $25.3 million of net premiums earned were recorded in 2012 related to Super Storm Sandy.
Casualty & other. The increase in gross premiums written in 2014 from 2013 primarily reflects increases in premiums written for the general liability, auto liability and guaranty lines of business, partially offset by decreases in the directors’ and officers’ liability, errors and omission liability and accident and health lines of business. These changes in premiums include the impact of new or expanded treaties, tempered by the impact of an increasingly competitive casualty reinsurance market and a decreasing amount of risk premium being ceded by insurers. Net premiums earned in 2014 approximated those in 2013, primarily reflecting a decrease in gross premiums written in the latter half of 2013 and an increase in ceded premiums earned, offset by the increase in gross premiums written in 2014.
72
Table of Contents
The increases in gross premiums written and net premiums earned in 2013 from 2012 primarily reflect the merger impacts discussed above, specifically related to the inclusion of operations from TransRe for the entire 2013 year, compared with the 300 day period subsequent to the TransRe Acquisition Date for 2012.
Absent the impact of the merger, gross premiums written and net premiums earned would have decreased in 2013 from 2012. The decrease in gross premiums written reflects an increasingly competitive reinsurance market and a decreasing amount of risk premium being ceded by insurers, as well as decisions made by TransRe in recent years to non-renew or reduce participation on certain potentially less profitable treaties and shift certain business from proportional to potentially more profitable non-proportional exposure. The decrease in net premiums earned primarily reflects a decrease in gross premiums written in recent quarters.
Reinsurance Segment: Net loss and LAE. The following table summarizes net loss and LAE for the reinsurance segment.
| Year Ended December 31, | Percent Change | |||||||||||||||||||
| 2014 | 2013 | 2012 | 2014 vs 2013 | 2013 vs 2012 | ||||||||||||||||
| Property |
(in millions, except ratios) | |||||||||||||||||||
| Net loss and LAE: |
||||||||||||||||||||
| Current year (excluding catastrophes) |
$ | 449.5 | $ | 409.1 | $ | 314.2 | 9.9% | 30.2% | ||||||||||||
| Current catastrophe losses |
46.8 | 92.1 | 252.2 | -49.2% | -63.5% | |||||||||||||||
| Prior years(1) |
(73.1 | ) | (184.7 | ) | — | -60.4% | — | |||||||||||||
|
|
|
|
|
|
|
|||||||||||||||
| $ | 423.2 | $ | 316.5 | $ | 566.4 | 33.7% | -44.1% | |||||||||||||
|
|
|
|
|
|
|
|||||||||||||||
| Net loss and LAE ratio: |
||||||||||||||||||||
| Current year (excluding catastrophes) |
42.9% | 41.4% | 34.9% | |||||||||||||||||
| Current catastrophe losses |
4.5% | 9.3% | 28.0% | |||||||||||||||||
| Prior years |
-7.0% | -18.7% | 0.0% | |||||||||||||||||
|
|
|
|
|
|
|
|||||||||||||||
| 40.4% | 32.0% | 62.9% | ||||||||||||||||||
|
|
|
|
|
|
|
|||||||||||||||
| Casualty & other |
||||||||||||||||||||
| Net loss and LAE: |
||||||||||||||||||||
| Current year (excluding catastrophes) |
$ | 1,595.3 | $ | 1,649.3 | $ | 1,465.5 | -3.3% | 12.5% | ||||||||||||
| Current catastrophe losses |
— | — | 26.2 | — | — | |||||||||||||||
| Prior years(1) |
(109.3 | ) | (39.4 | ) | — | 177.4% | — | |||||||||||||
|
|
|
|
|
|
|
|||||||||||||||
| $ | 1,486.0 | $ | 1,609.9 | $ | 1,491.7 | -7.7% | 7.9% | |||||||||||||
|
|
|
|
|
|
|
|||||||||||||||
| Net loss and LAE ratio: |
||||||||||||||||||||
| Current year (excluding catastrophes) |
69.9% | 72.0% | 72.7% | |||||||||||||||||
| Current catastrophe losses |
0.0% | 0.0% | 1.3% | |||||||||||||||||
| Prior years |
-4.8% | -1.7% | 0.0% | |||||||||||||||||
|
|
|
|
|
|
|
|||||||||||||||
| 65.1% | 70.3% | 74.0% | ||||||||||||||||||
|
|
|
|
|
|
|
|||||||||||||||
| Total |
||||||||||||||||||||
| Net loss and LAE: |
||||||||||||||||||||
| Current year (excluding catastrophes) |
$ | 2,044.8 | $ | 2,058.4 | $ | 1,779.7 | -0.7% | 15.7% | ||||||||||||
| Current catastrophe losses |
46.8 | 92.1 | 278.4 | -49.2% | -66.9% | |||||||||||||||
| Prior years(1) |
(182.4 | ) | (224.1 | ) | — | -18.6% | — | |||||||||||||
|
|
|
|
|
|
|
|||||||||||||||
| $ | 1,909.2 | $ | 1,926.4 | $ | 2,058.1 | -0.9% | -6.4% | |||||||||||||
| Net loss and LAE ratio: |
||||||||||||||||||||
| Current year (excluding catastrophes) |
61.4% | 62.8% | 61.0% | |||||||||||||||||
| Current catastrophe losses |
1.4% | 2.8% | 9.6% | |||||||||||||||||
| Prior years |
-5.5% | -6.8% | 0.0% | |||||||||||||||||
|
|
|
|
|
|
|
|||||||||||||||
| 57.3% | 58.8% | 70.6% | ||||||||||||||||||
|
|
|
|
|
|
|
|||||||||||||||
| (1) | $56.6 million, $31.2 million and $87.8 million of favorable prior accident year development on loss and LAE reserves acquired in the merger for property, casualty & other and total, respectively, are included in current year net loss and LAE in 2012. |
73
Table of Contents
Property. The increase in net loss and LAE in 2014 from 2013 primarily reflects less favorable prior accident year development on loss reserves and higher non-catastrophe losses incurred, partially offset by lower catastrophe losses. Catastrophe losses, net of reinsurance, were $46.8 million and $92.1 million in 2014 and 2013, respectively. Catastrophe losses for 2014 reflect losses from severe snowstorms across northeast Japan in February 2014 and from wind and hailstorm Ela, which struck Europe in June 2014. The $92.1 million of catastrophe losses in 2013 primarily reflect net losses from flooding in Germany in May 2013, flooding in Central Europe and Canada in June 2013, hurricanes in Mexico in September 2013 and hailstorms in Germany and Canada in July 2013.
The decrease in net loss and LAE in 2013 from 2012 primarily reflects a decrease in catastrophe losses and an increase in favorable prior accident year development on loss reserves, partially offset by the inclusion of operations from TransRe for the entire 2013 year, compared with the 300 day period subsequent to the TransRe Acquisition Date for 2012. Net loss and LAE includes catastrophe losses, net of reinsurance, of $92.1 million in 2013, compared with $252.2 million of catastrophe losses in 2012 related to Super Storm Sandy.
Net loss and LAE include (favorable) unfavorable prior accident year development on loss reserves as shown in the table below:
| Year Ended December 31, | ||||||||||||
| 2014 | 2013 | 2012(1) | ||||||||||
| (in millions) | ||||||||||||
| Catastrophe events |
$ | (17.3 | )(2) | $ | (109.3 | )(3) | $ | — | ||||
| Non-catastrophe |
(55.8 | )(4) | (75.4 | )(5) | — | |||||||
|
|
|
|
|
|
|
|||||||
| Total |
$ | (73.1 | ) | $ | (184.7 | ) | $ | — | ||||
|
|
|
|
|
|
|
|||||||
| (1) | $56.6 million of favorable prior accident year development on loss and LAE reserves acquired in the merger are included in current year net loss and LAE. |
| (2) | Includes favorable development of $1.6 million from Super Storm Sandy in 2012 and $15.7 million of net favorable development from other catastrophes. The $15.7 million primarily reflects favorable development from several catastrophes that occurred primarily in the 2013 and 2011 accident years, partially offset by unfavorable development from the New Zealand earthquake in 2010. |
| (3) | Includes favorable development of $73.7 million from Super Storm Sandy in 2012 and $35.6 million from other catastrophe losses, principally flooding that took place in Thailand in 2011 and the Tohoku earthquake in Japan in 2011, partially offset by unfavorable development from the New Zealand earthquake in 2010. |
| (4) | Reflects favorable development primarily related to the 2012 accident year and, to a lesser extent, the 2011 accident year. |
| (5) | Reflects favorable development primarily related to the 2011 and 2012 accident years. |
The favorable development in 2014 and 2013 reflects favorable loss emergence compared with loss emergence patterns assumed in earlier periods. The favorable development in 2014 did not impact assumptions used in estimating TransRe’s loss and LAE liabilities for business earned in 2014.
Casualty & other. The decrease in net loss and LAE in 2014 from 2013 primarily reflects more favorable prior accident year development on loss reserves in 2014 and lower losses incurred for the current accident year. The increase in net loss and LAE in 2013 from 2012 primarily reflects the inclusion of operations from TransRe for the entire 2013 year, compared with the 300 day period subsequent to the TransRe Acquisition Date for 2012, partially offset by a lower loss ratio in the current accident year including an absence of catastrophe losses in 2013, compared with $26.2 million of catastrophe losses, net of reinsurance, incurred in 2012 related to Super Storm Sandy.
Net loss and LAE in 2014, 2013 and 2012 include (favorable) unfavorable prior accident year development on loss reserves as shown in the table below:
| Year Ended December 31, | ||||||||||||
| 2014 | 2013 | 2012(1) | ||||||||||
| (in millions) | ||||||||||||
| The Malpractice Treaties(2) |
$ | (12.7 | ) | $ | (35.7 | ) | $ | — | ||||
| Other |
(96.6 | )(3) | (3.7 | )(4) | — | |||||||
|
|
|
|
|
|
|
|||||||
| Total |
$ | (109.3 | ) | $ | (39.4 | ) | $ | — | ||||
|
|
|
|
|
|
|
|||||||
74
Table of Contents
| (1) | $31.2 million of favorable development on loss and LAE reserves acquired in the merger are included in current year net loss and LAE. |
| (2) | Represents certain medical malpractice treaties pursuant to which the increased underwriting profits created by the favorable development are retained by the cedants, or the “Malpractice Treaties.” As a result, TransRe records an offsetting increase in profit commission expense incurred when such favorable development occurs. |
| (3) | Generally reflects favorable development in a variety of casualty & other lines of business primarily from the 2003 through 2007 and 2010 through 2011 accident years, partially offset by unfavorable development from the 2013 accident year and the 2002 and prior accident years. |
| (4) | Generally reflects favorable development in a variety of casualty & other lines of business. |
The favorable development in 2014 and 2013 reflects favorable loss emergence compared with loss emergence patterns assumed in earlier periods. The favorable development in 2014 did not impact assumptions used in estimating TransRe’s loss and LAE liabilities for business earned in 2014.
Reinsurance Segment: Commissions, brokerage and other underwriting expenses. The following table summarizes commissions, brokerage and other underwriting expenses for the reinsurance segment.
| Year Ended December 31, | Percent Change | |||||||||||||||||||
| 2014 | 2013 | 2012 | 2014 vs 2013 | 2013 vs 2012 | ||||||||||||||||
| (in millions, except ratios) | ||||||||||||||||||||
| Property |
||||||||||||||||||||
| Commissions, brokerage and other underwriting expenses |
$ | 319.3 | $ | 293.3 | $ | 191.1 | 8.9% | 53.5% | ||||||||||||
| Expense ratio |
30.5% | 29.7% | 21.2% | |||||||||||||||||
| Casualty & other |
||||||||||||||||||||
| Commissions, brokerage and other underwriting expenses |
$ | 757.2 | $ | 725.0 | $ | 400.0 | 4.4% | 81.3% | ||||||||||||
| Expense ratio |
33.2% | 31.7% | 19.9% | |||||||||||||||||
| Total |
||||||||||||||||||||
| Commissions, brokerage and other underwriting expenses |
$ | 1,076.5 | $ | 1,018.3 | $ | 591.1 | 5.7% | 72.3% | ||||||||||||
| Expense ratio |
32.3% | 31.1% | 20.3% | |||||||||||||||||
For both the property and the casualty & other lines of business, applying the acquisition method of accounting for the merger had a favorable impact on the expense ratio for 2012 because deferred acquisition costs were written off at the TransRe Acquisition Date. As of March 6, 2013, the application of the acquisition method of accounting no longer had a significant impact on the expense ratio. Excluding the impact of the application of the acquisition method of accounting, the estimated expense ratio for the reinsurance segment would have been approximately 29 percent for 2012.
Property. The increase in commissions, brokerage and other underwriting expenses in 2014 from 2013 primarily reflects higher employee-related costs and the lack of favorable impact arising from the acquisition method of accounting, which was present in part of 2013. The increase in commissions, brokerage and other underwriting expenses in 2013 from 2012 primarily reflects the diminished favorable impact arising from the acquisition method of accounting, as described above.
Casualty & other. The increase in commissions, brokerage and other underwriting expenses in 2014 from 2013 primarily reflects an increase in commission rates being demanded by cedants in 2014, partially offset by a decrease in profit commissions related to the Malpractice Treaties. The increase in commissions, brokerage and other underwriting expenses in 2014 from 2013 also reflects the absence of the favorable impact arising from the acquisition method of accounting, which was present in part of 2013. The increase in commissions, brokerage and other underwriting expenses in 2013 from 2012 primarily reflects the diminished favorable impact arising from the acquisition method of accounting, as explained above, and to a lesser extent, the $35.7 million of profit commission expense incurred related to the Malpractice Treaties, as described above.
75
Table of Contents
Reinsurance Segment: Underwriting profit. The following table summarizes our underwriting profit for the reinsurance segment.
| Year Ended December 31, | Percent Change | |||||||||||||||||||
| 2014 | 2013 | 2012 | 2014 vs 2013 | 2013 vs 2012 | ||||||||||||||||
| (in millions, except ratios) | ||||||||||||||||||||
| Property |
||||||||||||||||||||
| Underwriting profit |
$ | 306.1 | $ | 379.4 | $ | 143.4 | -19.3% | 164.6% | ||||||||||||
| Combined ratio |
70.9% | 61.7% | 84.1% | |||||||||||||||||
| Casualty & other |
||||||||||||||||||||
| Underwriting profit (loss) |
$ | 38.9 | $ | (45.4) | $ | 123.3 | -185.7% | -136.8% | ||||||||||||
| Combined ratio |
98.3% | 102.0% | 93.9% | |||||||||||||||||
| Total |
||||||||||||||||||||
| Underwriting profit |
$ | 345.0 | $ | 334.0 | $ | 266.7 | 3.3% | 25.2% | ||||||||||||
| Combined ratio |
89.6% | 89.9% | 90.9% | |||||||||||||||||
Property. The decrease in underwriting profit in 2014 from 2013 primarily reflects the increase in net loss and LAE and commissions, brokerage and other underwriting expenses, partially offset by an increase in net premiums earned, all as discussed above. The increase in underwriting profit in 2013 from 2012 primarily reflects an increase in net premiums earned and a decrease in net loss and LAE, partially offset by an increase in commissions, brokerage and other underwriting expenses, all as discussed above.
Casualty & other. The underwriting profit in 2014 compared with the underwriting loss in 2013 reflects a decrease in net loss and LAE, partially offset by a decrease in net premiums earned and an increase in commissions, brokerage and other underwriting expenses, all as discussed above. The underwriting loss in 2013 compared to an underwriting profit in 2012 reflects an increase in net loss and LAE and commissions, brokerage and other underwriting expenses, partially offset by an increase in net premiums earned, all as discussed above.
Insurance Segment Underwriting Results
The insurance segment is comprised of AIHL’s RSUI, CapSpecialty and PacificComp operating subsidiaries. RSUI also writes a modest amount of assumed reinsurance business, which is included in the insurance segment. For a more detailed description of our insurance segment, see Part I, Item 1, “Business—Segment Information—Insurance Segment” of this Form 10-K.
76
Table of Contents
The underwriting results of the insurance segment are presented below.
| Year Ended December 31, 2014 |
RSUI | CapSpecialty | PacificComp(1) | Total | ||||||||||||
| (in millions, except ratios) | ||||||||||||||||
| Premiums written: |
||||||||||||||||
| Gross |
$ | 1,242.1 | $ | 212.7 | $ | 70.5 | $1,525.3 | |||||||||
| Net |
825.5 | 192.4 | 69.5 | 1,087.4 | ||||||||||||
| Net premiums earned |
828.2 | 184.4 | 67.3 | 1,079.9 | ||||||||||||
|
|
|
|
|
|
|
|
|
|||||||||
| Net loss and LAE: |
||||||||||||||||
| Current year (excluding catastrophe losses) |
418.3 | 98.8 | 52.6 | 569.7 | ||||||||||||
| Current year catastrophe losses |
44.4 | 4.0 | — | 48.4 | ||||||||||||
| Prior years |
(35.4 | ) | 0.2 | 2.4 | (32.8 | ) | ||||||||||
|
|
|
|
|
|
|
|
|
|||||||||
| Total net loss and LAE |
427.3 | 103.0 | 55.0 | 585.3 | ||||||||||||
| Commissions, brokerage and other underwriting expenses |
220.8 | 92.0 | 32.0 | 344.8 | ||||||||||||
|
|
|
|
|
|
|
|
|
|||||||||
| Underwriting profit (loss)(2) |
$ | 180.1 | $ | (10.6 | ) | $ | (19.7 | ) | $ | 149.8 | ||||||
|
|
|
|
|
|
|
|
|
|||||||||
| Loss ratio(3): |
||||||||||||||||
| Current year (excluding catastrophe losses) |
50.5 | % | 53.6 | % | 78.2 | % | 52.8 | % | ||||||||
| Current year catastrophe losses |
5.4 | % | 2.2 | % | 0.0 | % | 4.5 | % | ||||||||
| Prior years |
-4.3 | % | 0.1 | % | 3.5 | % | -3.1 | % | ||||||||
|
|
|
|
|
|
|
|
|
|||||||||
| Total net loss and LAE |
51.6 | % | 55.9 | % | 81.7 | % | 54.2 | % | ||||||||
| Expense ratio(4) |
26.7 | % | 49.9 | % | 47.6 | % | 31.9 | % | ||||||||
|
|
|
|
|
|
|
|
|
|||||||||
| Combined ratio(5) |
78.3 | % | 105.8 | % | 129.3 | % | 86.1 | % | ||||||||
|
|
|
|
|
|
|
|
|
|||||||||
| Year Ended December 31, 2013 |
RSUI | CapSpecialty | PacificComp(1) | Total | ||||||||||||
| (in millions, except ratios) | ||||||||||||||||
| Premiums written: |
||||||||||||||||
| Gross |
$ | 1,261.6 | $ | 182.8 | $ | 42.0 | $1,486.4 | |||||||||
| Net |
827.2 | 171.4 | 40.8 | 1,039.4 | ||||||||||||
| Net premiums earned |
764.0 | 157.6 | 38.9 | 960.5 | ||||||||||||
|
|
|
|
|
|
|
|
|
|||||||||
| Net loss and LAE: |
||||||||||||||||
| Current year (excluding catastrophe losses) |
363.3 | 78.7 | 31.0 | 473.0 | ||||||||||||
| Current year catastrophe losses |
58.8 | — | — | 58.8 | ||||||||||||
| Prior years |
(17.9 | ) | 25.8 | 13.2 | 21.1 | |||||||||||
|
|
|
|
|
|
|
|
|
|||||||||
| Total net loss and LAE |
404.2 | 104.5 | 44.2 | 552.9 | ||||||||||||
| Commissions, brokerage and other underwriting expenses |
208.9 | 84.1 | 27.9 | 320.9 | ||||||||||||
|
|
|
|
|
|
|
|
|
|||||||||
| Underwriting profit (loss)(2) |
$ | 150.9 | $ | (31.0 | ) | $ | (33.2 | ) | $ 86.7 | |||||||
|
|
|
|
|
|
|
|
|
|||||||||
| Loss ratio(3): |
||||||||||||||||
| Current year (excluding catastrophe losses) |
47.5 | % | 49.9 | % | 79.7 | % | 49.3 | % | ||||||||
| Current year catastrophe losses |
7.7 | % | 0.0 | % | 0.0 | % | 6.1 | % | ||||||||
| Prior years |
-2.3 | % | 16.4 | % | 33.9 | % | 2.2 | % | ||||||||
|
|
|
|
|
|
|
|
|
|||||||||
| Total net loss and LAE |
52.9 | % | 66.3 | % | 113.6 | % | 57.6 | % | ||||||||
| Expense ratio(4) |
27.3 | % | 53.4 | % | 71.7 | % | 33.4 | % | ||||||||
|
|
|
|
|
|
|
|
|
|||||||||
| Combined ratio(5) |
80.2 | % | 119.7 | % | 185.3 | % | 91.0 | % | ||||||||
|
|
|
|
|
|
|
|
|
|||||||||
77
Table of Contents
| Year Ended December 31, 2012 |
RSUI | CapSpecialty | PacificComp(1) | Total | ||||||||||||
| (in millions, except ratios) | ||||||||||||||||
| Premiums written: |
||||||||||||||||
| Gross |
$ | 1,123.4 | $ | 158.1 | $ | 19.4 | $ | 1,300.9 | ||||||||
| Net |
715.1 | 149.1 | 19.0 | 883.2 | ||||||||||||
| Net premiums earned |
655.8 | 144.6 | 16.7 | 817.1 | ||||||||||||
|
|
|
|
|
|
|
|
|
|||||||||
| Net loss and LAE: |
||||||||||||||||
| Current year (excluding catastrophe losses) |
305.6 | 72.7 | 14.5 | 392.8 | ||||||||||||
| Current year catastrophe losses |
191.7 | — | — | 191.7 | ||||||||||||
| Prior years |
(31.1 | ) | 13.2 | 5.6 | (12.3 | ) | ||||||||||
|
|
|
|
|
|
|
|
|
|||||||||
| Total net loss and LAE |
466.2 | 85.9 | 20.1 | 572.2 | ||||||||||||
| Commissions, brokerage and other underwriting expenses |
184.3 | 79.2 | 27.8 | 291.3 | ||||||||||||
|
|
|
|
|
|
|
|
|
|||||||||
| Underwriting profit (loss)(2) |
$ | 5.3 | $ | (20.5 | ) | $ | (31.2 | ) | $ | (46.4 | ) | |||||
|
|
|
|
|
|
|
|
|
|||||||||
| Loss ratio(3): |
||||||||||||||||
| Current year (excluding catastrophe losses) |
46.6% | 50.3% | 86.7% | 48.1% | ||||||||||||
| Current year catastrophe losses |
29.2% | 0.0% | 0.0% | 23.4% | ||||||||||||
| Prior years |
-4.7% | 9.1% | 33.3% | -1.5% | ||||||||||||
|
|
|
|
|
|
|
|
|
|||||||||
| Total net loss and LAE |
71.1% | 59.4% | 120.0% | 70.0% | ||||||||||||
| Expense ratio(4) |
28.1% | 54.8% | 166.5% | 35.7% | ||||||||||||
|
|
|
|
|
|
|
|
|
|||||||||
| Combined ratio(5) |
99.2% | 114.2% | 286.5% | 105.7% | ||||||||||||
|
|
|
|
|
|
|
|
|
|||||||||
| (1) | Includes underwriting results of AIHL Re. |
| (2) | Underwriting profit represents net premiums earned less net loss and LAE and commissions, brokerage and other underwriting expenses, all as determined in accordance with GAAP, and does not include net investment income, net realized capital gains, OTTI losses, gain on bargain purchase, other income, other operating expenses, corporate administration, amortization of intangible assets or interest expense. Underwriting profit is a non-GAAP financial measure and does not replace earnings before income taxes determined in accordance with GAAP as a measure of profitability. See “Comment on Non-GAAP Financial Measures” herein for additional detail on the presentation of our results of operations. |
| (3) | The loss ratio is derived by dividing the amount of net loss and LAE by net premiums earned, all as determined in accordance with GAAP. |
| (4) | The expense ratio is derived by dividing the amount of commissions, brokerage and other underwriting expenses by net premiums earned, all as determined in accordance with GAAP. |
| (5) | The combined ratio is the sum of the loss ratio and expense ratio, all as determined in accordance with GAAP. The combined ratio represents the percentage of each premium dollar a reinsurance or an insurance company has to spend on net loss and LAE, and commissions, brokerage and other underwriting expenses. |
78
Table of Contents
Insurance Segment: Premiums. The following table summarizes premiums for the insurance segment.
| Year Ended December 31, | Percent Change | |||||||||||||||||||
| 2014 | 2013 | 2012 | 2014 vs 2013 | 2013 vs 2012 | ||||||||||||||||
| (in millions) | ||||||||||||||||||||
| RSUI |
||||||||||||||||||||
| Premiums written: |
||||||||||||||||||||
| Gross |
$ | 1,242.1 | $ | 1,261.6 | $ | 1,123.4 | -1.5 | % | 12.3 | % | ||||||||||
| Net |
825.5 | 827.2 | 715.1 | -0.2 | % | 15.7 | % | |||||||||||||
| Net premiums earned |
828.2 | 764.0 | 655.8 | 8.4 | % | 16.5 | % | |||||||||||||
| CapSpecialty |
||||||||||||||||||||
| Premiums written: |
||||||||||||||||||||
| Gross |
$ | 212.7 | $ | 182.8 | $ | 158.1 | 16.4 | % | 15.6 | % | ||||||||||
| Net |
192.4 | 171.4 | 149.1 | 12.3 | % | 15.0 | % | |||||||||||||
| Net premiums earned |
184.4 | 157.6 | 144.6 | 17.0 | % | 9.0 | % | |||||||||||||
| PacificComp |
||||||||||||||||||||
| Premiums written: |
||||||||||||||||||||
| Gross |
$ | 70.5 | $ | 42.0 | $ | 19.4 | 67.9 | % | 116.5 | % | ||||||||||
| Net |
69.5 | 40.8 | 19.0 | 70.3 | % | 114.7 | % | |||||||||||||
| Net premiums earned |
67.3 | 38.9 | 16.7 | 73.0 | % | 132.9 | % | |||||||||||||
| Total |
||||||||||||||||||||
| Premiums written: |
||||||||||||||||||||
| Gross |
$ | 1,525.3 | $ | 1,486.4 | $ | 1,300.9 | 2.6 | % | 14.3 | % | ||||||||||
| Net |
1,087.4 | 1,039.4 | 883.2 | 4.6 | % | 17.7 | % | |||||||||||||
| Net premiums earned |
1,079.9 | 960.5 | 817.1 | 12.4 | % | 17.5 | % | |||||||||||||
RSUI. The decrease in gross premiums written in 2014 from 2013 reflects declines in the property line of business due to an increase in competition and a decrease in rates, partially offset by generally favorable market conditions in most other lines of business, particularly for the binding authority and directors’ and officers’ liability lines of business. The increase in gross premiums written in 2013 from 2012 primarily reflects some improvements in market conditions in most lines of business, particularly for the umbrella, directors’ and officers’ liability, professional liability and binding authority lines of business, evidenced by favorable renewal retention rates and strong new business submissions. The increase in net premiums earned in 2014 from 2013 primarily reflects an increase in gross premiums written in early 2014 and late 2013 and, to a lesser extent, lower ceded premiums written due primarily to declines in the heavily-reinsured property line of business. The increase in net premiums earned in 2013 from 2012 primarily reflects an increase in gross premiums written.
CapSpecialty. The increase in gross premiums written in 2014 from 2013 reflects growth in the property and casualty lines of business, including strong growth in the professional lines of business. The increase in gross premiums written in 2013 from 2012 primarily reflects growth in the property and casualty lines of business and, to a lesser extent, the surety lines of business. Net premiums earned increased in 2014 from 2013 primarily reflecting an increase in gross premiums written, partially offset by higher ceded premiums earned arising from an increase in reinsurance coverage. Net premiums earned increased in 2013 from 2012 primarily reflecting an increase in gross premiums written.
PacificComp. The increases in gross premiums written and net premiums earned in 2014 from 2013 and in 2013 from 2012 primarily reflect PacificComp’s distribution initiatives and increased market acceptance of PacificComp’s product offerings.
79
Table of Contents
Insurance Segment: Net loss and LAE. The following table summarizes net loss and LAE for the insurance segment.
| Year Ended December 31, | Percent Change | |||||||||||||||||||
| 2014 | 2013 | 2012 | 2014 vs 2013 | 2013 vs 2012 | ||||||||||||||||
| (in millions, except ratios) | ||||||||||||||||||||
| RSUI |
||||||||||||||||||||
| Net loss and LAE: |
||||||||||||||||||||
| Current year (excluding catastrophes) |
$ | 418.3 | $ | 363.3 | $ | 305.6 | 15.1% | 18.9% | ||||||||||||
| Current catastrophe losses |
44.4 | 58.8 | 191.7 | -24.5% | -69.3% | |||||||||||||||
| Prior years |
(35.4 | ) | (17.9 | ) | (31.1 | ) | 97.8% | -42.4% | ||||||||||||
|
|
|
|
|
|
|
|||||||||||||||
| $ | 427.3 | $ | 404.2 | $ | 466.2 | 5.7% | -13.3% | |||||||||||||
|
|
|
|
|
|
|
|||||||||||||||
| Net loss and LAE ratio: |
||||||||||||||||||||
| Current year (excluding catastrophes) |
50.5 | % | 47.5 | % | 46.6 | % | ||||||||||||||
| Current catastrophe losses |
5.4 | % | 7.7 | % | 29.2 | % | ||||||||||||||
| Prior years |
-4.3 | % | -2.3 | % | -4.7 | % | ||||||||||||||
|
|
|
|
|
|
|
|||||||||||||||
| 51.6 | % | 52.9 | % | 71.1 | % | |||||||||||||||
|
|
|
|
|
|
|
|||||||||||||||
| CapSpecialty |
||||||||||||||||||||
| Net loss and LAE: |
||||||||||||||||||||
| Current year (excluding catastrophes) |
$ | 98.8 | $ | 78.7 | $ | 72.7 | 25.5% | 8.3% | ||||||||||||
| Current catastrophe losses(1) |
4.0 | — | — | — | — | |||||||||||||||
| Prior years |
0.2 | 25.8 | 13.2 | -99.2% | 95.5% | |||||||||||||||
|
|
|
|
|
|
|
|||||||||||||||
| $ | 103.0 | $ | 104.5 | $ | 85.9 | -1.4% | 21.7% | |||||||||||||
|
|
|
|
|
|
|
|||||||||||||||
| Net loss and LAE ratio: |
||||||||||||||||||||
| Current year (excluding catastrophes) |
53.6 | % | 49.9 | % | 50.3 | % | ||||||||||||||
| Current catastrophe losses |
2.2 | % | 0.0 | % | 0.0 | % | ||||||||||||||
| Prior years |
0.1 | % | 16.4 | % | 9.1 | % | ||||||||||||||
|
|
|
|
|
|
|
|||||||||||||||
| 55.9 | % | 66.3 | % | 59.4 | % | |||||||||||||||
|
|
|
|
|
|
|
|||||||||||||||
| PacificComp |
||||||||||||||||||||
| Net loss and LAE: |
||||||||||||||||||||
| Current year (excluding catastrophes) |
$ | 52.6 | $ | 31.0 | $ | 14.5 | 69.7% | 113.8% | ||||||||||||
| Current catastrophe losses |
— | — | — | — | — | |||||||||||||||
| Prior years |
2.4 | 13.2 | 5.6 | -81.8% | 135.7% | |||||||||||||||
|
|
|
|
|
|
|
|||||||||||||||
| $ | 55.0 | $ | 44.2 | $ | 20.1 | 24.4% | 119.9% | |||||||||||||
|
|
|
|
|
|
|
|||||||||||||||
| Net loss and LAE ratio: |
||||||||||||||||||||
| Current year (excluding catastrophes) |
78.2 | % | 79.7 | % | 86.7 | % | ||||||||||||||
| Current catastrophe losses |
0.0 | % | 0.0 | % | 0.0 | % | ||||||||||||||
| Prior years |
3.5 | % | 33.9 | % | 33.3 | % | ||||||||||||||
|
|
|
|
|
|
|
|||||||||||||||
| 81.7 | % | 113.6 | % | 120.0 | % | |||||||||||||||
|
|
|
|
|
|
|
|||||||||||||||
| Total |
||||||||||||||||||||
| Net loss and LAE: |
||||||||||||||||||||
| Current year (excluding catastrophes) |
$ | 569.7 | $ | 473.0 | $ | 392.8 | 20.4% | 20.4% | ||||||||||||
| Current catastrophe losses |
48.4 | 58.8 | 191.7 | -17.7% | -69.3% | |||||||||||||||
| Prior years |
(32.8 | ) | 21.1 | (12.3 | ) | -255.5% | -271.5% | |||||||||||||
|
|
|
|
|
|
|
|||||||||||||||
| $ | 585.3 | $ | 552.9 | $ | 572.2 | 5.9% | -3.4% | |||||||||||||
|
|
|
|
|
|
|
|||||||||||||||
| Net loss and LAE ratio: |
||||||||||||||||||||
| Current year (excluding catastrophes) |
52.8 | % | 49.3 | % | 48.1 | % | ||||||||||||||
| Current catastrophe losses |
4.5 | % | 6.1 | % | 23.4 | % | ||||||||||||||
| Prior years |
-3.1 | % | 2.2 | % | -1.5 | % | ||||||||||||||
|
|
|
|
|
|
|
|||||||||||||||
| 54.2 | % | 57.6 | % | 70.0 | % | |||||||||||||||
|
|
|
|
|
|
|
|||||||||||||||
| (1) | Alleghany commenced reporting catastrophe losses for CapSpecialty on April 1, 2014. |
80
Table of Contents
RSUI. The increase in net loss and LAE in 2014 from 2013 primarily reflects the impact of higher net premiums earned, partially offset by a more favorable prior accident year development on loss reserves and a decrease in catastrophe losses. The decrease in net loss and LAE in 2013 from 2012 primarily reflects lower catastrophe losses, net of reinsurance, partially offset by the impact of higher net premiums earned and less favorable prior accident year development on casualty loss reserves.
Catastrophe losses, net of reinsurance, were $44.4 million in 2014, $58.8 million in 2013 and $191.7 million in 2012. Catastrophe losses in 2014 primarily reflect the impact of nationwide severe winter weather in the U.S. in January and February and hail storms in the spring, summer and fall. Catastrophe losses in 2013 include flooding in Colorado in September and severe weather in the Midwestern U.S., including tornados in Oklahoma in May. Catastrophe losses in 2012 include $155.0 million of net losses from Super Storm Sandy in October. In addition, there were $6.2 million of ceded premiums related to Super Storm Sandy.
Net loss and LAE in 2014, 2013 and 2012 include (favorable) unfavorable prior accident year development on loss reserves as shown in the table below:
| Year Ended December 31, | ||||||||||||
| 2014 | 2013 | 2012 | ||||||||||
| (in millions) | ||||||||||||
| Casualty |
$ | (30.1 | )(1) | $ | (25.9 | )(2) | $ | (48.1 | )(3) | |||
| Property and other |
(5.3 | )(4) | 8.0 | (5) | 17.0 | (6) | ||||||
|
|
|
|
|
|
|
|||||||
| Total |
$ | (35.4 | ) | $ | (17.9 | ) | $ | (31.1 | ) | |||
|
|
|
|
|
|
|
|||||||
| (1) | Primarily reflects favorable development in the professional liability, general liability and umbrella/excess lines of business, and primarily related to the 2006 through 2010 accident years, partially offset by unfavorable development in the directors’ and officers’ liability line of business in the 2011 and 2012 accident years. |
| (2) | Primarily reflects favorable development in the umbrella/excess liability, professional liability lines of business, and primarily related to the 2005 through 2010 accident years. |
| (3) | Primarily reflects favorable development in the umbrella/excess liability, general liability, professional liability and directors’ and officers’ liability lines of business, and primarily related to the 2005 through 2008 accident years. |
| (4) | Primarily reflects favorable development on unallocated LAE reserves and prior year catastrophe reserves from recent accident years. |
| (5) | Includes $8.5 million of unfavorable development from Hurricane Katrina, which resulted from a significant claim that settled for more than previously estimated due to an adverse court ruling, partially offset by net favorable development with respect to other property reserves. |
| (6) | Includes $9.7 million of unfavorable development from Hurricane Ike in 2008. |
The favorable development in 2014, 2013 and 2012 reflects favorable loss emergence compared with loss emergence patterns assumed in earlier periods. Specifically relating to the favorable development in 2014, actual losses relating to prior accident years for such lines of business, which include both loss payments and case reserves, were lower than expected through December 31, 2014. The amount of lower actual losses than expected, expressed as a percentage of carried loss and LAE reserves at the beginning of the year, was 0.3 percent. The favorable development in 2014 did not impact assumptions used in estimating RSUI’s loss and LAE liabilities for business earned in 2014.
CapSpecialty. The decrease in net loss and LAE in 2014 from 2013 primarily reflects substantially less unfavorable development on loss reserves in 2014, partially offset by the impact of higher net premiums earned and higher property losses. Higher property losses in 2014 arose from fire and weather-related losses. The increase in net loss and LAE in 2013 from 2012 primarily reflects an increase in net unfavorable prior accident year development on loss reserves, primarily from a terminated program.
81
Table of Contents
Net loss and LAE in 2014, 2013 and 2012 include (favorable) unfavorable prior accident year development on loss reserves as shown in the table below:
| Year Ended December 31, | ||||||||||||
| 2014 | 2013 | 2012 | ||||||||||
| (in millions) | ||||||||||||
| Ongoing lines of business |
$ | 0.2 | $ | 10.4 | (2) | $ | (9.0 | )(3) | ||||
| Terminated Program(1) |
— | 19.4 | 22.2 | |||||||||
| Asbestos-related illness and environemntal impairment liability |
— | (4.0 | ) | — | ||||||||
|
|
|
|
|
|
|
|||||||
| Total |
$ | 0.2 | $ | 25.8 | $ | 13.2 | ||||||
|
|
|
|
|
|
|
|||||||
| (1) | Represents certain specialty classes of business written through a program administrator in connection with a terminated program related to the 2010 and 2009 accident years and reflects unfavorable loss emergence compared with loss emergence patterns assumed in earlier periods for such business. |
| (2) | Primarily reflects unfavorable development from workers’ compensation and certain other casualty lines of business, and related primarily to unfavorable loss emergence on a few individual claims, partially offset by favorable development on surety and property lines of business. |
| (3) | Primarily reflects favorable development in certain casualty and surety lines of business. |
The unfavorable development in 2013 and 2012 reflects unfavorable loss emergence compared with loss emergence patterns assumed in earlier periods.
PacificComp. The increases in net loss and LAE in 2014 from 2013 and in 2013 from 2012 primarily reflect the impact of higher net premiums earned. Net loss and LAE includes $2.4 million, $13.2 million and $5.6 million of unfavorable prior accident year development in 2014, 2013 and 2012, respectively. The unfavorable development in 2014, 2013 and 2012 related primarily to the 2009 and prior accident years, and reflects unfavorable loss emergence compared with loss emergence patterns assumed in earlier periods.
Insurance Segment: Commissions, brokerage and other underwriting expenses. The following table summarizes commissions, brokerage and other underwriting expenses for the insurance segment.
| Year Ended December 31, | Percent Change | |||||||||||||||||||
| 2014 | 2013 | 2012 | 2014 vs 2013 | 2013 vs 2012 | ||||||||||||||||
| (in millions, except ratios) | ||||||||||||||||||||
| RSUI |
||||||||||||||||||||
| Commissions, brokerage and other underwriting expenses |
$ | 220.8 | $ | 208.9 | $ | 184.3 | 5.7% | 13.3% | ||||||||||||
| Expense ratio |
26.7% | 27.3% | 28.1% | |||||||||||||||||
| CapSpecialty |
||||||||||||||||||||
| Commissions, brokerage and other underwriting expenses |
$ | 92.0 | $ | 84.1 | $ | 79.2 | 9.4% | 6.2% | ||||||||||||
| Expense ratio |
49.9% | 53.4% | 54.8% | |||||||||||||||||
| PacificComp |
||||||||||||||||||||
| Commissions, brokerage and other underwriting expenses |
$ | 32.0 | $ | 27.9 | $ | 27.8 | 14.7% | 0.4% | ||||||||||||
| Expense ratio |
47.6% | 71.7% | 166.5% | |||||||||||||||||
| Total |
||||||||||||||||||||
| Commissions, brokerage and other underwriting expenses |
$ | 344.8 | $ | 320.9 | $ | 291.3 | 7.4% | 10.2% | ||||||||||||
| Expense ratio |
31.9% | 33.4% | 35.7% | |||||||||||||||||
82
Table of Contents
RSUI, CapSpecialty and PacificComp. The increases in commissions, brokerage and other underwriting expenses for the insurance segment in 2014 from 2013, and in 2013 from 2012, is due primarily to the impact of higher net premiums earned.
Insurance Segment: Underwriting profit. The following table summarizes our underwriting profit for the insurance segment.
| Year Ended December 31, | Percent Change | |||||||||||||||||||
| 2014 | 2013 | 2012 | 2014 vs 2013 | 2013 vs 2012 | ||||||||||||||||
| (in millions, except ratios) | ||||||||||||||||||||
| RSUI |
||||||||||||||||||||
| Underwriting profit |
$ | 180.1 | $ | 150.9 | $ | 5.3 | 19.4% | 2,747.2% | ||||||||||||
| Combined ratio |
78.3% | 80.2% | 99.2% | |||||||||||||||||
| CapSpecialty |
||||||||||||||||||||
| Underwriting (loss) |
$ | (10.6 | ) | $ | (31.0) | $ | (20.5) | -65.8% | 51.2% | |||||||||||
| Combined ratio |
105.8 | % | 119.7% | 114.2% | ||||||||||||||||
| PacificComp |
||||||||||||||||||||
| Underwriting (loss) |
$ | (19.7 | ) | $ | (33.2) | $ | (31.2) | -40.7% | 6.4% | |||||||||||
| Combined ratio |
129.3 | % | 185.3% | 286.5% | ||||||||||||||||
| Total |
||||||||||||||||||||
| Underwriting profit (loss) |
$ | 149.8 | $ | 86.7 | $ | (46.4) | 72.8% | — | ||||||||||||
| Combined ratio |
86.1 | % | 91.0% | 105.7% | ||||||||||||||||
RSUI. The increase in RSUI’s underwriting profit in 2014 from 2013 reflects the impact of an increase in net premiums earned, partially offset by increases in net loss and LAE and commissions, brokerage and other underwriting expenses, all as discussed above. The increase in RSUI’s underwriting profit in 2013 from 2012 primarily reflects an increase in net premiums earned and a decrease in net loss and LAE, partially offset by an increase in commissions, brokerage and other underwriting expenses, all as discussed above.
CapSpecialty. The decrease in CapSpecialty’s underwriting loss in 2014 from 2013 reflects an increase in net premiums earned and a decrease in net loss and LAE, partially offset by an increase in commissions, brokerage and other underwriting expenses, all as discussed above. The increase in CapSpecialty’s underwriting loss in 2013 from 2012 primarily reflects an increase in loss and LAE, partially offset by an increase in net premiums earned, all as discussed above.
PacificComp. PacificComp reported underwriting losses in 2014, 2013 and 2012 primarily as a result of its ongoing expenses relative to comparatively low premiums earned and unfavorable prior accident year development on loss reserves. The decreases in underwriting losses in 2014 from 2013 is primarily due to less unfavorable prior accident year development on loss reserves and increases in net premiums earned, all as discussed above.
83
Table of Contents
Total Reinsurance and Insurance Segments’ Investment Results
Following is information relating to segment investment results.
| Year Ended December 31, | Percent Change | |||||||||||||||||||
| 2014 | 2013 | 2012 | 2014 vs 2013 | 2013 vs 2012 | ||||||||||||||||
| (in millions) | ||||||||||||||||||||
| Net investment income |
$ | 448.9 | $ | 415.2 | $ | 317.5 | 8.1 | % | 30.8 | % | ||||||||||
| Net realized capital gains |
230.0 | 197.7 | 117.9 | 16.3 | % | 67.7 | % | |||||||||||||
| Other than temporary impairment losses |
(36.3 | ) | (44.0 | ) | (2.9 | ) | -17.5 | % | 1417.2 | % | ||||||||||
Net Investment Income. The increase in net investment income for the reinsurance and insurance segments in 2014 from 2013 is due primarily to more favorable reinvestment rates at TransRe as well as an increased allocation of our debt securities portfolio to higher yielding securities, partially offset by the impact of changes in foreign currency exchange rates. The higher yielding securities relate primarily to an increased allocation to investment-grade and below investment-grade credit instruments managed through our investment management relationship with Ares.
The increase in net investment income for the reinsurance and insurance segments in 2013 from 2012 is due primarily to the inclusion of operations from TransRe for the entire 2013 year, compared with only 300 days subsequent to the TransRe Acquisition Date for 2012. Aside from the impact of the merger, the increase in net investment income reflects higher income from other invested assets, as well as higher interest and dividend income.
Approximate yields of the reinsurance and insurance segments’ debt securities for 2014, 2013 and 2012 are as follows:
| Year |
Average Investment(1) |
Pre-Tax Net Interest Income(2) |
After-Tax Net Interest Income(3) |
Effective Yield(4) | After-Tax Yield(5) | |||||||||||||||
| (in millions, except for percentages) | ||||||||||||||||||||
| 2014 |
$ | 14,591.2 | $ | 358.7 | $ | 293.5 | 2.5% | 2.0% | ||||||||||||
| 2013 |
14,917.7 | 327.8 | 282.1 | 2.2% | 1.9% | |||||||||||||||
| 2012 |
15,401.3 | 287.7 | 251.3 | 1.9% | 1.6% | |||||||||||||||
| (1) | Average of amortized cost of debt securities portfolio at beginning and end of period. With respect to the debt securities owned by TransRe, the beginning of the period is the TransRe Acquisition Date. |
| (2) | After investment expenses and excluding net realized gains and OTTI losses. |
| (3) | Pre-tax net interest income less income taxes. |
| (4) | Pre-tax net interest income for the period divided by average investments for the same period. |
| (5) | After-tax net interest income for the period divided by average investments for the same period. |
Net Realized Capital Gains. Net realized capital gains in 2014 generally reflect sales of equity securities. In addition, net realized capital gains include a realized capital gain of $34.0 million from the sales of long-dated U.S. Treasury Strip debt securities in April 2014, some additional realized capital gains taken on debt securities and a $9.4 million realized capital loss from the redemption of $300 million par value of the TransRe 5.75% senior notes due on December 14, 2015, or the “2015 Senior Notes.” Net realized capital gains in 2013 relate primarily to sales of equity securities. In addition, net realized capital gains in 2013 includes a realized capital loss of $5.0 million relating to a non-cash impairment charge for certain finite-lived intangible assets at CapSpecialty. Net realized capital gains in 2012 relate primarily to sales of equity securities in the energy sector, including a gain from the sale in January 2012 of shares of common stock of Exxon Mobil held at the insurance segment level.
Other Than Temporary Impairment Losses. OTTI losses in 2014 reflect $36.3 million of unrealized losses that were deemed to be other than temporary and, as such, were required to be charged against earnings. Upon the ultimate disposition of the securities for which OTTI losses have been recorded, a portion of the loss may be
84
Table of Contents
recoverable depending on market conditions at the time of disposition. Of the $36.3 million of OTTI losses incurred during 2014, $28.7 million relate to equity securities, primarily in the mining sector, and $7.6 million relate to debt securities, primarily in the energy sector. The determination that unrealized losses on such securities were other than temporary was primarily based on the severity of the decline in the fair value of equity securities relative to their cost as of the balance sheet date, and the fact that we lacked the intent to hold debt securities for a period of time sufficient to allow for an anticipated recovery.
OTTI losses in 2013 reflect $44.0 million of unrealized losses that were deemed to be other than temporary and, as such, were required to be charged against earnings. Of the $44.0 million of OTTI losses incurred during 2013, $42.6 million relate to equity securities, primarily in the chemical and energy sectors, and $1.4 million relate to debt securities. The determination that unrealized losses on such securities were other than temporary was primarily based on the duration of the decline in the fair value of such securities relative to their cost as of the balance sheet date.
OTTI losses in 2012 reflect $2.9 million of unrealized losses that were deemed to be other than temporary and, as such, were required to be charged against earnings. Of the $2.9 million incurred during 2012, $1.7 million relate to equity securities, primarily in the energy sector, and $1.2 million relate to debt securities. The determination that unrealized losses on such securities were other than temporary was primarily based on the duration of the decline in the fair value of such securities relative to their cost as of the balance sheet date.
After adjusting the cost basis of securities for the recognition of OTTI losses, the remaining gross unrealized investment losses for debt and equity securities as of December 31, 2014 were deemed to be temporary, based on, among other factors: (i) the duration of time and the relative magnitude to which the fair values of these securities had been below cost were not indicative of an OTTI loss (for example, no equity security was in a continuous unrealized loss position for 12 months or more as of December 31, 2014); (ii) the absence of compelling evidence that would cause us to call into question the financial condition or near-term business prospects of the issuers of the securities; and (iii) our ability and intent to hold the securities for a period of time sufficient to allow for any anticipated recovery.
See Note 4 to Notes to Consolidated Financial Statements set forth in Part II, Item 8, “Financial Statements and Supplementary Data” of this Form 10-K for additional detail on gross unrealized investment losses for debt and equity securities as of December 31, 2014.
Corporate Activities Operating Results
The operating results of corporate activities is presented below.
| Year Ended December 31, | ||||||||||||
| 2014 | 2013 | 2012 | ||||||||||
| (in millions) | ||||||||||||
| Net premiums earned |
$ | — | $ | — | $ | — | ||||||
| Net investment income |
11.0 | 50.5 | (4.5 | ) | ||||||||
| Net realized capital gains |
17.1 | 34.4 | 40.0 | |||||||||
| Other than temporary impairment losses |
— | — | — | |||||||||
| Gain on bargain purchase |
— | — | 494.9 | |||||||||
| Other income |
146.5 | 76.9 | 31.2 | |||||||||
|
|
|
|
|
|
|
|||||||
| Total revenues |
174.6 | 161.8 | 561.6 | |||||||||
|
|
|
|
|
|
|
|||||||
| Net loss and LAE |
— | — | — | |||||||||
| Commissions, brokerage and other underwriting expenses |
— | — | — | |||||||||
| Other operating expenses |
167.0 | 81.2 | 34.5 | |||||||||
| Corporate administration |
45.8 | 36.1 | 75.8 | |||||||||
| Amortization of intangible assets |
0.4 | 0.2 | — | |||||||||
| Interest expense |
43.2 | 37.4 | 27.6 | |||||||||
|
|
|
|
|
|
|
|||||||
| (Losses) earnings before income taxes |
$ | (81.8) | $ | 6.9 | $ | 423.7 | ||||||
|
|
|
|
|
|
|
|||||||
85
Table of Contents
In July 2014, ACC acquired a 30 percent equity interest in Jazwares, a toy and consumer electronics company, headquartered in Sunrise, Florida, for $60.3 million. Jazwares is accounted for under the equity-method of accounting and is included in corporate activities for segment reporting purposes. Corporate activities include the results of Bourn & Koch beginning April 26, 2012 and Kentucky Trailer beginning August 30, 2013.
Other income and Other operating expenses. The increases in other income and other operating expenses in 2014 from 2013 and 2013 from 2012 primarily reflect the acquisition of Kentucky Trailer on August 30, 2013 and Bourn & Koch on April 26, 2012 and, to a lesser extent, increased expenses at SORC.
Net investment income. The decreases in net investment income in 2014 from 2013 and 2013 from 2012 primarily relate to Homesite, which was sold on December 31, 2013. Net investment income for corporate activities for 2014, 2013 and 2012 was as follows:
| Year Ended December 31, | ||||||||||||
| 2014 | 2013 | 2012 | ||||||||||
| (in millions) | ||||||||||||
| Homesite |
$ | — | $ | 42.9 | $ | (6.9) | ||||||
| ORX |
(3.2) | (1.0) | (4.5) | |||||||||
| Interest, dividends and other - net(1) |
14.2 | 8.6 | 6.9 | |||||||||
|
|
|
|
|
|
|
|||||||
| Net investment income |
$ | 11.0 | $ | 50.5 | $ | (4.5) | ||||||
|
|
|
|
|
|
|
|||||||
| (1) | Includes our equity interest in Jazwares commencing July 2014. |
The Homesite results for 2013 primarily reflect favorable development on its loss and LAE reserves and favorable levels of weather-related claims. The Homesite losses in 2012 reflect the impact of increased homeowners insurance claims from severe weather during the year, and $13.2 million of losses representing our share of Homesite’s loss from Super Storm Sandy in October 2012, partially offset by the favorable impact of higher premium rates. The higher interest, dividends and other – net in 2014 from 2013, and in 2013 from 2012, primarily reflects higher income from other invested assets.
Net realized capital gains. Net realized capital gains in 2014 primarily reflect gains from the sale of equity securities. Net realized capital gains in 2013 primarily reflect the sale of Homesite on December 31, 2013, partially offset by sales of equity securities at a realized capital loss. Net realized capital gains in 2012 primarily reflect gains from the sale of shares of Exxon Mobil Corporation common stock held at the corporate-level in the first quarter of 2012.
Gain on bargain purchase. The gain on bargain purchase in 2012 reflects the merger impacts discussed above.
Corporate administration. The increase in corporate administration expense in 2014 from 2013 primarily reflects the absence of a one-time reduction in expenses from the freezing of pension benefits at the parent-level. On July 16, 2013, our Board of Directors decided to: (i) freeze the benefits associated with our unfunded, noncontributory defined benefit pension plan for parent-level executives, effective December 31, 2013; and (ii) terminate our two retiree health plans for parent-level executives and employees, effective September 30, 2013. As a result of these decisions, we recorded a pre-tax $8.8 million reduction to corporate administration expense in the third quarter of 2013.
The decrease in corporate administration expense in 2013 from 2012 primarily reflects the absence of Transaction Costs, which amounted to $33.8 million in 2012.
Interest expense. The increase in interest expense in 2014 from 2013 is due to the issuance of the 2044 Senior Notes (as defined on page 99 of this Form 10-K) on September 9, 2014. The increase in interest expense in 2013 from 2012 is due to the issuance of the 2022 Senior Notes (as defined on page 99 of this Form 10-K) on June 26, 2012.
86
Table of Contents
(Losses) Earnings before income taxes. The net losses before income taxes in 2014 compared with the earnings before income taxes in 2013 primarily reflect a decrease in net investment income and net realized capital gains, and an increase in other expenses, corporate administration expenses and interest expense, partially offset by an increase in other income, all as explained above. The decrease in earnings before income taxes in 2013 compared with 2012 primarily reflects the absence of a gain on bargain purchase in 2013, which was significant in 2012.
Reserve Review Process
Our reinsurance and insurance subsidiaries analyze, at least quarterly, liabilities for unpaid loss and LAE established in prior years and adjust their expected ultimate cost, where necessary, to reflect favorable or unfavorable development in loss experience and new information, including, for certain catastrophe events, revised industry estimates of the magnitude of a catastrophe. Adjustments to previously recorded liabilities for unpaid loss and LAE, both favorable and unfavorable, are reflected in our financial results in the periods in which these adjustments are made and are referred to as prior accident year loss reserve development. The following table presents the reserves established in connection with the loss and LAE of our reinsurance and insurance subsidiaries on a gross and net basis by line of business. These reserve amounts represent the accumulation of estimates of ultimate loss (including for IBNR) and LAE.
| As of December 31, 2014 | As of December 31, 2013 | As of December 31, 2012 | ||||||||||||||||||||||||||||||||||
| Gross Loss and LAE Reserves |
Reinsurance Recoverables on Unpaid Losses |
Net Loss and LAE Reserves |
Gross Loss and LAE Reserves |
Reinsurance Recoverables on Unpaid Losses |
Net Loss and LAE Reserves |
Gross Loss and LAE Reserves |
Reinsurance Recoverables on Unpaid Losses |
Net Loss and LAE Reserves |
||||||||||||||||||||||||||||
| (in millions) | ||||||||||||||||||||||||||||||||||||
| Reinsurance Segment |
||||||||||||||||||||||||||||||||||||
| Property |
$ | 992.3 | $ | (56.6 | ) | $ | 935.7 | $ | 1,109.4 | $ | (47.2 | ) | $ | 1,062.2 | $ | 1,383.9 | $ | (59.5 | ) | $ | 1,324.4 | |||||||||||||||
| Casualty & other(1) |
8,138.7 | (430.8 | ) | 7,707.9 | 8,363.7 | (406.9 | ) | 7,956.8 | 8,393.9 | (385.5 | ) | 8,008.4 | ||||||||||||||||||||||||
|
|
|
|
|
|
|
|
|
|
|
|
|
|
|
|
|
|
|
|
||||||||||||||||||
| 9,131.0 | (487.4 | ) | 8,643.6 | 9,473.1 | (454.1 | ) | 9,019.0 | 9,777.8 | (445.0 | ) | 9,332.8 | |||||||||||||||||||||||||
|
|
|
|
|
|
|
|
|
|
|
|
|
|
|
|
|
|
|
|
||||||||||||||||||
| Insurance Segment |
||||||||||||||||||||||||||||||||||||
| Property |
311.4 | (131.3 | ) | 180.1 | 384.9 | (176.3 | ) | 208.6 | 449.9 | (186.1 | ) | 263.8 | ||||||||||||||||||||||||
| Casualty(2) |
1,873.7 | (648.4 | ) | 1,225.3 | 1,827.5 | (648.9 | ) | 1,178.6 | 1,755.6 | (654.3 | ) | 1,101.3 | ||||||||||||||||||||||||
| Workers’ Compensation |
159.6 | (3.7 | ) | 155.9 | 156.4 | (3.8 | ) | 152.6 | 153.3 | (13.0 | ) | 140.3 | ||||||||||||||||||||||||
| All other(3) |
182.6 | (79.7 | ) | 102.9 | 165.5 | (73.9 | ) | 91.6 | 152.1 | (63.6 | ) | 88.5 | ||||||||||||||||||||||||
|
|
|
|
|
|
|
|
|
|
|
|
|
|
|
|
|
|
|
|
||||||||||||||||||
| 2,527.3 | (863.1 | ) | 1,664.2 | 2,534.3 | (902.9 | ) | 1,631.4 | 2,510.9 | (917.0 | ) | 1,593.9 | |||||||||||||||||||||||||
|
|
|
|
|
|
|
|
|
|
|
|
|
|
|
|
|
|
|
|
||||||||||||||||||
| Eliminations |
(61.1 | ) | 61.1 | — | (54.9 | ) | 54.9 | — | (48.9 | ) | 56.1 | 7.2 | ||||||||||||||||||||||||
|
|
|
|
|
|
|
|
|
|
|
|
|
|
|
|
|
|
|
|
||||||||||||||||||
| Total |
$ | 11,597.2 | $ | (1,289.4 | ) | $ | 10,307.8 | $ | 11,952.5 | $ | (1,302.1 | ) | $ | 10,650.4 | $ | 12,239.8 | $ | (1,305.9 | ) | $ | 10,933.9 | |||||||||||||||
|
|
|
|
|
|
|
|
|
|
|
|
|
|
|
|
|
|
|
|
||||||||||||||||||
| (1) | Primarily consists of the following reinsurance lines of business: directors’ and officers’ liability; errors and omissions liability; general liability; medical malpractice; ocean marine and aviation; auto liability; accident and health; surety; asbestos-related illness and environmental impairment liability; and credit. |
| (2) | Primarily consists of the following direct lines of business: umbrella/excess; directors’ and officers’ liability; professional liability; and general liability. |
| (3) | Primarily consists of commercial multi-peril and surety lines of business, as well as loss and LAE reserves for terminated lines of business and loss reserves acquired in connection with prior acquisitions for which the sellers provided loss reserve guarantees. |
Changes in Gross and Net Loss and LAE Reserves between December 31, 2014 and December 31, 2013. Gross and net loss and LAE reserves as of December 31, 2014 decreased from December 31, 2013, reflecting a decrease in our reinsurance segment loss and LAE reserves. The decrease in gross and net loss and LAE reserves in the reinsurance segment primarily reflects favorable prior accident year loss reserve development, loss payments including amounts related to catastrophe events occurring in prior years, and the impact of changes in foreign currency exchange rates.
Changes in Gross and Net Loss and LAE Reserves between December 31, 2013 and December 31, 2012. Gross and net loss and LAE reserves as of December 31, 2013 decreased from December 31, 2012, reflecting a decrease in our reinsurance segment loss and LAE reserves, partially offset by a slight increase in our insurance segment loss and LAE reserves. The decrease in gross and net loss and LAE reserves in the reinsurance segment primarily reflects
87
Table of Contents
favorable prior accident year development on loss reserves and payments related to catastrophe events occurring in prior years. The slight increase in gross and net loss and LAE reserves in the insurance segment primarily reflects the impact of higher net premiums earned in 2013, partially offset by the impact of property loss claims resulting from Super Storm Sandy paid by RSUI in 2013.
Reinsurance Recoverables
Our reinsurance and insurance subsidiaries reinsure portions of the risks they underwrite in order to reduce the effect of individual or aggregate exposure to losses, manage capacity, protect capital resources, reduce volatility in specific lines of business, improve risk-adjusted portfolio returns, and enable them to increase gross premium writings and risk capacity without requiring additional capital. Our reinsurance and insurance subsidiaries purchase reinsurance and retrocessional coverages from highly-rated third party reinsurers. If the assuming reinsurers are unable or unwilling to meet the obligations assumed under the applicable reinsurance agreements, our reinsurance and insurance subsidiaries would remain liable for such reinsurance portion not paid by these reinsurers. As such, funds, trust agreements and letters of credit are held to collateralize a portion of our reinsurance and insurance subsidiaries’ reinsurance recoverables, and our reinsurance and insurance subsidiaries reinsure portions of the risks they underwrite or assume with multiple reinsurance programs.
As of December 31, 2014, our reinsurance and insurance subsidiaries had total reinsurance recoverables of $1,361.1 million, consisting of $1,289.4 million of ceded outstanding loss and LAE and $71.7 million of recoverables on paid losses. See Part I, Item 1, “Business — Reinsurance Protection” of this Form 10-K for additional information on the reinsurance purchased by our reinsurance and insurance subsidiaries.
Information regarding concentration of our reinsurance recoverables and the ratings profile of our reinsurers as of December 31, 2014 is as follows:
| Reinsurer(1) |
Rating(2) | Amount | Percentage | |||||||
| (dollars in millions) | ||||||||||
| Swiss Reinsurance Company |
A+ (Superior) | $ | 150.5 | 11.1 | % | |||||
| American International Group, Inc. |
A (Excellent) | 143.9 | 10.6 | |||||||
| PartnerRe Ltd. |
A+ (Superior) | 110.3 | 8.1 | |||||||
| Syndicates at Lloyd’s of London |
A (Excellent) | 98.3 | 7.2 | |||||||
| Platinum Underwriters Holdings, Ltd. |
A (Excellent) | 93.9 | 6.9 | |||||||
| W.R. Berkley Corporation |
A+ (Superior) | 88.6 | 6.5 | |||||||
| Chubb Corporation |
A++ (Superior) | 64.9 | 4.8 | |||||||
| Ace Ltd |
A++ (Superior) | 52.8 | 3.9 | |||||||
| Allianz SE |
A+ (Superior) | 39.3 | 2.9 | |||||||
| Munich Reinsurance |
A+ (Superior) | 38.3 | 2.8 | |||||||
| All other reinsurers |
480.3 | 35.2 | ||||||||
|
|
|
|
|
|||||||
| Total reinsurance recoverables(3) |
$ | 1,361.1 | 100.0 | % | ||||||
|
|
|
|
|
|||||||
| Secured reinsurance recoverables(4) |
$ | 161.7 | 11.9 | % | ||||||
|
|
|
|
|
|||||||
| (1) | Reinsurance recoverables reflect amounts due from one or more reinsurance subsidiaries of the listed company. |
| (2) | Represents the A.M. Best Company, Inc. financial strength rating for the applicable reinsurance subsidiary or subsidiaries from which the reinsurance recoverable is due. |
| (3) | Approximately 96 percent of our reinsurance recoverables balance as of December 31, 2014 was due from reinsurers having an A.M. Best Company, Inc. financial strength rating of A (Excellent) or higher. |
| (4) | Represents reinsurance recoverables secured by funds held, trust agreements and letters of credit. |
We had no allowance for uncollectible reinsurance as of December 31, 2014.
88
Table of Contents
Critical Accounting Estimates
The preparation of financial statements in conformity with GAAP requires management to make estimates and assumptions about future events that directly affect our reported financial condition and operating performance. More specifically, these estimates and assumptions affect the reported amounts of assets and liabilities and disclosure of contingent assets and liabilities as of the date of the financial statements, as well as the reported amounts of revenues and expenses during the reporting period. We rely on historical experience and on various other assumptions that we believe to be reasonable under the circumstances to make judgments about the carrying value of assets and liabilities that are not readily apparent from other sources. Actual results may differ materially from reported results to the extent that estimates and assumptions prove to be inaccurate.
We believe our most critical accounting estimates are those with respect to the liability for unpaid loss and LAE reserves, fair value measurements of certain financial assets, OTTI losses on investments, goodwill and other intangible assets, and reinsurance premium revenues, as they require management’s most significant exercise of judgment on both a quantitative and qualitative basis. The accounting estimates that result require the use of assumptions about certain matters that are highly uncertain at the time of estimation. To the extent actual experience differs from the assumptions used, our financial condition, results of operations, and cash flows would be affected, possibly materially.
Unpaid Loss and LAE
Overview. The estimation of the liability for unpaid loss and LAE is inherently difficult and subjective, especially in view of changing legal and economic environments that impact the development of loss reserves, and therefore, quantitative techniques frequently have to be supplemented by subjective considerations and managerial judgment. In addition, trends that have affected development of liabilities in the past may not necessarily occur or affect liability development to the same degree in the future.
Each of our reinsurance and insurance subsidiaries establishes reserves on its balance sheet for unpaid loss and LAE related to its property and casualty reinsurance and insurance contracts. As of any balance sheet date, there are claims that have not yet been reported, and some claims may not be reported for many years after the date a loss occurs. As a result of this historical pattern, the liability for unpaid loss and LAE includes significant estimates for IBNR claims. Additionally, reported claims are in various stages of the settlement process. Each claim is settled individually based upon its merits, and certain claims may take years to settle, especially if legal action is involved. As a result, the liabilities for unpaid loss and LAE include significant judgments, assumptions and estimates made by management relating to the actual ultimate losses that will arise from the claims. Due to the inherent uncertainties in the process of establishing these liabilities, the actual ultimate loss from a claim is likely to differ, perhaps materially, from the liability initially recorded.
As noted above, as of any balance sheet date, not all claims that have occurred have been reported to us, and if reported may not have been settled. The time period between the occurrence of a loss and the time it is settled is referred to as the “claim tail.” In general, actuarial judgments for shorter-tailed lines of business generally have much less of an effect on the determination of the loss reserve amount than when those same judgments are made regarding longer-tailed lines of business. Reported losses for the shorter-tailed classes, such as property and certain marine, aviation and energy classes, generally reach the ultimate level of incurred losses in a relatively short period of time. Rather than having to rely on actuarial assumptions for many accident years, these assumptions are generally only relevant for the more recent accident years. Therefore, these assumptions tend to be less critical and the reserves calculated pursuant to these assumptions are subject to less variability for the shorter-tailed lines of business.
For short-tail lines, loss reserves consist primarily of reserves for reported claims. The process of recording quarterly and annual liabilities for unpaid loss and LAE for short-tail lines is primarily focused on maintaining an appropriate reserve level for reported claims and IBNR. Specifically, we assess the reserve adequacy of IBNR in light of such factors as the current levels of reserves for reported claims and expectations with respect to reporting lags, catastrophe events, historical data, legal developments, and economic conditions, including the effects of inflation.
89
Table of Contents
Standard actuarial methodologies employed to estimate ultimate losses incorporate the inherent lag from the time claims occur to when they are reported to an insurer and, if applicable, to when an insurer reports the claims to a reinsurer. Certain actuarial methodologies may be more appropriate than others in instances where this lag may not be consistent from period to period. Consequently, additional actuarial judgment is employed in the selection of methodologies to best incorporate the potential impact of this situation.
Our insurance operating subsidiaries provide coverage on both a claims-made and occurrence basis. Claims-made policies generally require that claims occur and be reported during the coverage period of the policy. Occurrence policies allow claims which occur during a policy’s coverage period to be reported after the coverage period, and as a result, these claims can have a very long claim tail, occasionally extending for decades. Casualty claims can have a very long claim tail, in certain situations extending for many years. In addition, casualty claims are more susceptible to litigation and the legal environment and can be significantly affected by changing contract interpretations, all of which contribute to extending the claim tail. For long-tail casualty lines of business, estimating the ultimate liabilities for unpaid loss and LAE is a more complex process and depends on a number of factors, including the line and volume of the business involved. For these reasons, our insurance operating subsidiaries will generally use actuarial projections in setting reserves for all casualty lines of business.
While the reserving process is difficult for insurance business, the inherent uncertainties of estimating loss reserves are even greater for reinsurance business, due primarily to the longer-tailed nature of much of the reinsurance business, the diversity of development patterns among different types of reinsurance contracts, the necessary reliance on the ceding companies for information regarding reported claims and differing reserving practices among ceding companies, which can be subject to change without notice. TransRe writes a significant amount of non-proportional assumed casualty reinsurance as well as proportional assumed reinsurance of excess liability business for classes such as medical malpractice, directors’ and officers’ liability, errors and omissions liability and general liability. Claims from such classes can exhibit greater volatility over time than most other classes due to their low frequency, high severity nature and loss cost trends that are more difficult to predict.
The estimation of unpaid loss and LAE for our reinsurance operations is principally based on reports and individual case estimates received from ceding companies. Data received from cedants is audited periodically by TransRe’s claims and underwriting personnel, to help ensure that reported data is supported by proper documentation and conforms to contract terms, and is analyzed, as appropriate, by its underwriting and actuarial personnel. Such analysis often includes a detailed review of reported data to assess the underwriting results of assumed reinsurance and to explain any significant departures from expected performance. Over time, reported loss information is ultimately corroborated when the underlying claims are paid.
In addition, the estimation of unpaid loss and LAE, including IBNR, for our reinsurance operations also takes into account assumptions with respect to many factors that will affect ultimate loss costs but are not yet known. The process by which actual carried reserves are determined considers not only actuarial estimates but a myriad of other factors. Such factors, both internal and external, which contribute to the variability and unpredictability of loss costs, include trends relating to jury awards, social trends, medical inflation, worldwide economic conditions, tort reforms, court interpretations of coverages, the regulatory environment, underlying policy pricing, terms and conditions and claims handling, among others. In addition, information gathered through underwriting and claims audits is also considered. We assess the reasonableness of our unpaid loss and LAE for our reinsurance operations using various actuarial methodologies, principally the paid development method, the reported loss development method and the Bornhuetter-Ferguson method as described below.
In conformity with GAAP, our reinsurance and insurance subsidiaries are not permitted to establish reserves for catastrophe losses that have not occurred. Therefore, losses related to a significant catastrophe, or accumulation of catastrophes, in any reporting period could have a material adverse effect on our results of operations and financial condition during that period.
We believe that the reserves for unpaid loss and LAE established by our reinsurance and insurance subsidiaries are adequate as of December 31, 2014; however, additional reserves, which could have a material impact upon our financial condition, results of operations, and cash flows, may be necessary in the future.
90
Table of Contents
Methodologies and Assumptions. Our reinsurance and insurance subsidiaries use a variety of techniques that employ significant judgments and assumptions to establish the liabilities for unpaid loss and LAE recorded at the balance sheet date. These techniques include detailed statistical analyses of past claims reporting, settlement activity, claims frequency, internal loss experience, changes in pricing or coverages and severity data when sufficient information exists to lend statistical credibility to the analyses. More subjective techniques are used when statistical data is insufficient or unavailable. These liabilities also reflect implicit or explicit assumptions regarding the potential effects of future inflation, judicial decisions, changes in laws and recent trends in such factors, as well as a number of actuarial assumptions that vary across our reinsurance and insurance subsidiaries and across lines of business. This data is analyzed by line of business, coverage, accident year or underwriting year and reinsurance contract type, as appropriate.
Our loss reserve review processes use actuarial methods that vary by operating subsidiary and line of business and produce point estimates for each class of business. The actuarial methods used include the following methods:
| • | Reported Loss Development Method: a reported loss development pattern is calculated based on historical loss development data, and this pattern is then used to project the latest evaluation of cumulative reported losses for each accident year or underwriting year, as appropriate, to ultimate levels; |
| • | Paid Development Method: a paid loss development pattern is calculated based on historical paid loss development data, and this pattern is then used to project the latest evaluation of cumulative paid losses for each accident year or underwriting year, as appropriate, to ultimate levels; |
| • | Expected Loss Ratio Method: expected loss ratios are applied to premiums earned, based on historical company experience, or historical insurance industry results when company experience is deemed not to be sufficient; and |
| • | Bornhuetter-Ferguson Method: the results from the Expected Loss Ratio Method are essentially blended with either the Reported Loss Development Method or the Paid Development Method. |
The primary actuarial assumptions used by our reinsurance and insurance subsidiaries include the following:
| • | Expected loss ratios represent management’s expectation of losses, in relation to earned premium, at the time business is written, before any actual claims experience has emerged. This expectation is a significant determinant of the estimate of loss reserves for recently written business where there is little paid or incurred loss data to consider. Expected loss ratios are generally derived from historical loss ratios adjusted for the impact of rate changes, loss cost trends and known changes in the type of risks underwritten. For certain longer-tailed reinsurance business that are typically lower frequency, high severity classes, expected loss ratios are often used for the last several accident years or underwriting years, as appropriate. |
| • | Rate of loss cost inflation (or deflation) represents management’s expectation of the inflation associated with the costs we may incur in the future to settle claims. Expected loss cost inflation is particularly important for longer-tailed classes. |
| • | Reported and paid loss emergence patterns represent management’s expectation of how losses will be reported and ultimately paid in the future based on the historical emergence patterns of reported and paid losses and are derived from past experience of our operating subsidiaries, modified for current trends. These emergence patterns are used to project current reported or paid loss amounts to their ultimate settlement value. |
In the absence of sufficiently credible internally-derived historical information, each of the above actuarial assumptions may also incorporate data from the insurance or reinsurance industries as a whole, or peer companies writing substantially similar coverages. Data from external sources may be used to set expectations, as well as assumptions regarding loss frequency or severity relative to an exposure unit or claim, among other actuarial parameters. Assumptions regarding the application or composition of peer group or industry reserving parameters require substantial judgment.
91
Table of Contents
Loss Frequency and Severity. Loss frequency and severity are measures of loss activity that are considered in determining the key assumptions described above. Loss frequency is a measure of the number of claims per unit of insured exposure, and loss severity is a measure of the average size of claims. Factors affecting loss frequency include the effectiveness of loss controls and safety programs and changes in economic conditions or weather patterns. Factors affecting loss severity include changes in policy limits, retentions, rate of inflation and judicial interpretations. Another factor affecting estimates of loss frequency and severity is the loss reporting lag, which is the period of time between the occurrence of a loss and the date the loss is reported to our reinsurance or insurance operating subsidiary. The length of the loss reporting lag affects their ability to accurately predict loss frequency (loss frequencies are more predictable for lines with short reporting lags), as well as the amount of reserves needed for IBNR. If the actual level of loss frequency and severity is higher or lower than expected, the ultimate losses will be different than management’s estimates. A small percentage change in an estimate can result in a material effect on our reported earnings. The following table reflects the impact of changes, which could be favorable or unfavorable, in frequency and severity on our loss estimates for claims occurring in 2014:
| Frequency | ||||||||||||
| Severity |
1.0% | 5.0% | 10.0% | |||||||||
| (in millions) | ||||||||||||
| 1% |
$ | 54.5 | $ | 163.9 | $ | 300.8 | ||||||
| 5% |
163.9 | 277.7 | 420.0 | |||||||||
| 10% |
300.8 | 420.0 | 569.0 | |||||||||
Our net reserves for loss and LAE of $10.3 billion as of December 31, 2014 relate to multiple accident years. Therefore, the impact of changes in frequency or severity for more than one accident year could be higher or lower than the amounts reflected above. We believe the above analysis provides a reasonable benchmark for sensitivity as we believe it is within historical variation for our reserves. Currently, none of the scenarios is believed to be more likely than the other. See Note 1(k) and Note 6 to Notes to Consolidated Financial Statements set forth in Part II, Item 8, “Financial Statements and Supplementary Data” of this Form 10-K for additional information on our loss and LAE.
92
Table of Contents
Prior Year Development. Our reinsurance and insurance subsidiaries continually evaluate the potential for changes, both positive and negative, in their estimates of their loss and LAE liabilities and use the results of these evaluations to adjust both recorded liabilities and underwriting criteria. With respect to liabilities for unpaid loss and LAE established in prior years, these liabilities are periodically analyzed and their expected ultimate cost adjusted, where necessary, to reflect favorable or unfavorable development in loss experience and new information, including, for certain catastrophe events, revised industry estimates of the magnitude of a catastrophe. Adjustments to previously recorded liabilities for unpaid loss and LAE, both favorable and unfavorable, are reflected in our financial results in the periods in which these adjustments are made and are referred to as prior accident year reserve development. We adjusted our prior year loss and LAE reserve estimates during 2014, 2013 and 2012 based on current information that differed from previous assumptions made at the time such loss and LAE reserves were previously estimated. The (favorable) unfavorable prior accident year development on loss reserves for 2014, 2013 and 2012 is summarized as follows:
| Year Ended December 31, | ||||||||||||
| 2014 | 2013 | 2012(1) | ||||||||||
| (in millions) | ||||||||||||
| Reinsurance Segment: |
||||||||||||
| Property: |
||||||||||||
| Catastrophe events |
$ | (17.3 | )(2) | $ | (109.3 | )(3) | $ | — | ||||
| Non-catastrophe |
(55.8 | )(4) | (75.4 | )(5) | — | |||||||
|
|
|
|
|
|
|
|||||||
| Total property |
(73.1 | ) | (184.7 | ) | — | |||||||
|
|
|
|
|
|
|
|||||||
| Casualty & other: |
||||||||||||
| The Malpractice Treaties(6) |
(12.7 | ) | (35.7 | ) | — | |||||||
| Other |
(96.6 | )(7) | (3.7 | )(8) | — | |||||||
|
|
|
|
|
|
|
|||||||
| Total Casualty & other |
(109.3 | ) | (39.4 | ) | — | |||||||
|
|
|
|
|
|
|
|||||||
| Total Reinsurance Segment |
(182.4 | ) | (224.1 | ) | — | |||||||
|
|
|
|
|
|
|
|||||||
| Insurance Segment: |
||||||||||||
| RSUI: |
||||||||||||
| Casualty |
(30.1 | )(9) | (25.9 | )(10) | (48.1 | )(11) | ||||||
| Property and other |
(5.3 | )(12) | 8.0 | (13) | 17.0 | (14) | ||||||
|
|
|
|
|
|
|
|||||||
| Total RSUI |
(35.4 | ) | (17.9 | ) | (31.1 | ) | ||||||
|
|
|
|
|
|
|
|||||||
| CapSpecialty: |
||||||||||||
| Ongoing lines of business |
0.2 | 10.4 | (15) | (9.0 | )(16) | |||||||
| Terminated Program(17) |
— | 19.4 | 22.2 | |||||||||
| Asbestos-related illness and environmental impairment liability |
— | (4.0 | ) | — | ||||||||
|
|
|
|
|
|
|
|||||||
| Total CapSpecialty |
0.2 | 25.8 | 13.2 | |||||||||
|
|
|
|
|
|
|
|||||||
| PacificComp(18) |
2.4 | 13.2 | 5.6 | |||||||||
|
|
|
|
|
|
|
|||||||
| Total incurred related to prior years |
$ | (215.2 | ) | $ | (203.0 | ) | $ | (12.3 | ) | |||
|
|
|
|
|
|
|
|||||||
| (1) | $87.8 million of favorable prior accident year development on loss and LAE reserves acquired in the merger are included in current year net loss and LAE for the reinsurance segment. |
| (2) | Includes favorable development of $1.6 million from Super Storm Sandy in 2012 and $15.7 million of net favorable development from other catastrophes. The $15.7 million primarily reflects favorable development from several catastrophes that occurred primarily in the 2013 and 2011 accident years, partially offset by unfavorable development from the New Zealand earthquake in 2010. |
| (3) | Includes favorable development of $73.7 million from Super Storm Sandy in 2012 and $35.6 million of favorable development from other catastrophe losses, principally flooding that took place in Thailand in 2011 and the Tohoku earthquake in Japan in 2011, partially offset by unfavorable development from the New Zealand earthquake in 2010. |
| (4) | Reflects favorable development primarily related to the 2012 accident year and, to a lesser extent, the 2011 accident year. |
| (5) | Reflects favorable development primarily related to the 2011 and 2012 accident years. |
| (6) | Represents certain medical malpractice treaties pursuant to which the increased underwriting profits created by the favorable development are retained by the cedants. As a result, TransRe records an offsetting increase in profit commission expense incurred when such favorable development occurs. |
93
Table of Contents
| (7) | Generally reflects favorable development in a variety of casualty & other lines of business primarily from the 2003 through 2007 and 2010 through 2011 accident years, partially offset by unfavorable development from the 2013 accident year and the 2002 and prior accident years. |
| (8) | Generally reflects favorable development in a variety of casualty & other lines of business. |
| (9) | Primarily reflects favorable development in the professional liability, general liability and umbrella/excess lines of business, and primarily related to the 2006 through 2010 accident years. |
| (10) | Primarily reflects favorable development in the umbrella/excess liability, professional liability lines of business, and primarily related to the 2005 through 2010 accident years. |
| (11) | Primarily reflects favorable development in the umbrella/excess liability, general liability, professional liability and directors’ and officers’ liability lines of business, and primarily related to the 2005 through 2008 accident years. |
| (12) | Primarily reflects favorable development on unallocated LAE reserves and prior year catastrophe reserves from recent accident years. |
| (13) | Includes $8.5 million of unfavorable development from Hurricane Katrina, which resulted from a significant claim that settled for more than previously estimated due to an adverse court ruling, partially offset by net favorable development with respect to other property reserves. |
| (14) | Includes $9.7 million of unfavorable development from Hurricane Ike in 2008. |
| (15) | Primarily reflects unfavorable development from workers’ compensation and certain other casualty lines of business, and related primarily to unfavorable loss emergence on a few individual claims, partially offset by favorable development on surety lines of business. |
| (16) | Primarily reflects favorable development in certain casualty and surety lines of business. |
| (17) | Represents certain specialty classes of business written through a program administrator in connection with a terminated program related to the 2010 and 2009 accident years and reflects unfavorable loss emergence compared with loss emergence patterns assumed in earlier periods for such business. |
| (18) | The unfavorable development in 2014, 2013 and 2012 related primarily to the 2009 and prior accident years. |
Asbestos-Related Illness and Environmental Impairment Reserves. Loss and LAE include amounts for risks relating to asbestos-related illness and environmental impairment. The reserves carried for such claims, including the IBNR portion, are based upon known facts and current law at the respective balance sheet dates. However, significant uncertainty exists in determining the amount of ultimate liability for asbestos-related illness and environmental impairment losses, particularly for those occurring in 1985 and prior, which represents the majority of TransRe’s asbestos-related illness and environmental impairment reserves. This uncertainty is due to inconsistent and changing court resolutions and judicial interpretations with respect to underlying policy intent and coverage and uncertainties as to the allocation of responsibility for resultant damages, among other reasons. Further, possible future changes in statutes, laws, regulations, theories of liability and other factors could have a material effect on these liabilities and, accordingly, future earnings. Although we are unable at this time to determine whether additional reserves, which could have a material adverse effect upon our results of operations, may be necessary in the future, we believe that our asbestos-related illness and environmental impairment reserves are adequate as of December 31, 2014. See Note 12(d) to Notes to Consolidated Financial Statements set forth in Part II, Item 8, “Financial Statements and Supplementary Data” and pages 35 and 36 of this Form 10-K for additional information on loss and LAE for risks relating to asbestos-related illness and environmental impairment.
Reinsurance. Our reinsurance and insurance subsidiaries reinsure portions of the risks they underwrite in order to reduce the effect of individual or aggregate exposure to losses, manage capacity, protect capital resources, reduce volatility in specific lines of business, improve risk-adjusted portfolio returns and enable them to increase gross premium writings and risk capacity for other business without requiring additional capital. Our reinsurance and insurance subsidiaries purchase reinsurance and retrocessional coverages from highly-rated third party reinsurers. If the assuming reinsurers are unable or unwilling to meet the obligations assumed under the applicable reinsurance agreements, our reinsurance and insurance subsidiaries would remain liable for such amounts not paid by their reinsurers. Recoverables recorded with respect to claims ceded to reinsurers under reinsurance contracts are predicated in large part on the estimates for unpaid losses and, therefore, are also subject to a significant degree of uncertainty. In addition to the factors cited above, reinsurance recoverables may prove uncollectible if a reinsurer is unable or unwilling to perform under a contract. Reinsurance purchased by our reinsurance and insurance subsidiaries does not relieve them of their obligations to their own policyholders or cedants. Additional information regarding the use of, and risks related to, the use of reinsurance by our reinsurance and insurance subsidiaries can be found on pages 36 through 38 and page 50 of this Form 10-K. Also see Note 1(f) and Note 5 to Notes to Consolidated Financial Statements set forth in Part II, Item 8, “Financial Statements and Supplementary Data” of this Form 10-K for additional information on our reinsurance recoverables.
94
Table of Contents
Fair Value Measurement of Certain Financial Assets
Fair value is defined as the price that would be received upon the sale of an asset or paid to transfer a liability in an orderly transaction between willing, able and knowledgeable market participants at the measurement date. Fair value measurements are not adjusted for transaction costs. In addition, a three-tiered hierarchy for inputs is used in management’s determination of fair value of financial instruments that emphasizes the use of observable inputs over the use of unobservable inputs by requiring that the observable inputs be used when available. Observable inputs are market participant assumptions based on market data obtained from sources independent of the reporting entity. Unobservable inputs are the reporting entity’s own assumptions about market participant assumptions based on the best information available under the circumstances. In assessing the appropriateness of using observable inputs in making our fair value determinations, we consider whether the market for a particular security is “active” or not based on all the relevant facts and circumstances. A market may be considered to be inactive if there are relatively few recent transactions or if there is a significant decrease in market volume. Furthermore, we consider whether observable transactions are “orderly” or not. We do not consider a transaction to be orderly if there is evidence of a forced liquidation or other distressed condition, and as such, little or no weight is given to that transaction as an indicator of fair value.
A three-tiered hierarchy for inputs is used in management’s determination of fair value of financial instruments that emphasizes the use of observable inputs over the use of unobservable inputs by requiring that the observable inputs be used when available. Assets classified as Level 3 principally include certain residential mortgage-backed securities, or “RMBS,” commercial mortgage-backed securities, or “CMBS,” other asset-backed securities, partnership investments and non-marketable equity investments. The valuation of Level 3 assets requires the greatest degree of judgment, as these valuations are based on techniques that use significant inputs that are unobservable. These measurements may be made under circumstances in which there is little, if any, market activity for the asset. Our assessment of the significance of a particular input to the fair value measurement in its entirety requires judgment. In making the assessment, we consider factors specific to the asset. Some Level 3 valuations are based entirely on non-binding broker quotes. These securities consist primarily of mortgage-backed and asset-backed securities where reliable pool and loan level collateral information cannot be reasonably obtained.
Mortgage-backed and asset-backed securities are initially valued at the transaction price. Subsequently, we use widely accepted valuation practices that produce a fair value measurement by comparison to transactions in similarly structured instruments, use of discounted cash flows, or option adjusted spread analyses. Unobservable inputs, significant to the measurement and valuation of mortgage-backed and asset-backed securities, include assumptions about prepayment speed and collateral performance, including default, delinquency and loss severity rates. Significant changes to any one of these inputs, or combination of inputs, could significantly change the fair value measurement for these securities.
Fair values for partnership and non-marketable equity investments are initially valued at the transaction price. Subsequently, fair value is based on the performance of the portfolio of investments or results of operations of the investee. Significant improvements or disruptions in the financial markets may result in directionally similar or opposite changes to the portfolio of the investee, depending on how management of the investee has correlated the portfolio of investments to the market. Also, any changes made by the investee to the investment strategy of the non-marketable equity investments could result in significant changes to fair value that have a positive or negative correlation to the performance observed in the equity markets. For those investments whose performance is based on the results of operations within a specific industry, significant events impacting that industry could materially impact fair value. Also, decisions and changes to strategy made by management of the investee could result in positive or negative outcomes, which could significantly impact the results of operations of the investee and subsequently fair value.
See Notes 1(b), 1(c), 3 and 4 to Notes to Consolidated Financial Statements set forth in Part II, Item 8, “Financial Statements and Supplementary Data” of this Form 10-K for additional information on our investments and fair value.
95
Table of Contents
Investment Impairment
The determination that an investment has incurred an OTTI loss in value requires the judgment of management and consideration of the fundamental condition of the issuer, its near-term business prospects and all the relevant facts and circumstances.
We hold our equity and debt securities as available-for-sale, or “AFS,” and as such, these securities are recorded at fair value. We continually monitor the difference between cost and the estimated fair value of our investments, which involves uncertainty as to whether declines in value are temporary in nature. The analysis of any individual security’s decline in value is performed in its functional currency. If the decline of a particular investment is deemed temporary, we record the decline as an unrealized loss in stockholders’ equity. If the decline is deemed to be other than temporary, we write our cost-basis or amortized cost-basis down to the fair value of the investment and record an OTTI loss on our statement of earnings. In addition, any portion of such decline related to debt securities that is believed to arise from factors other than credit is recorded as a component of other comprehensive income rather than charged against earnings.
Management’s assessment of equity securities initially involves an evaluation of all securities that are in an unrealized loss position, regardless of the duration or severity of the loss, as of the applicable balance sheet date. Such initial review consists primarily of assessing whether: (i) there has been a negative credit or news event with respect to the issuer that could indicate the existence of an OTTI; and (ii) we have the ability and intent to hold an equity security for a period of time sufficient to allow for an anticipated recovery (generally considered to be one year from the balance sheet date).
To the extent that an equity security in an unrealized loss position is not impaired based on the initial review described above, we then further evaluate such equity security and deem it to be other than temporarily impaired if it has been in an unrealized loss position for 12 months or more or if its unrealized loss position is greater than 50 percent of its cost, absent compelling evidence to the contrary.
We then evaluate those equity securities where the unrealized loss is 20 percent or more of cost as of the balance sheet date or which have been in an unrealized loss position continuously for six months or more preceding the balance sheet date. This evaluation takes into account quantitative and qualitative factors in determining whether such securities are other than temporarily impaired including: (i) market valuation metrics associated with the equity security (such as dividend yield and price-to-earnings ratio); (ii) current views on the equity security, as expressed by either our internal stock analysts and / or by third party stock analysts or rating agencies; and (iii) credit or news events associated with a specific issuer, such as negative news releases and rating agency downgrades with respect to the issuer of the investment.
Debt securities in an unrealized loss position are evaluated for OTTI if they meet any of the following criteria: (i) they are trading at a 20 percent discount to amortized cost for an extended period of time (nine consecutive months or longer); (ii) there has been a negative credit or news event with respect to the issuer that could indicate the existence of an OTTI; or (iii) we intend to sell or it is more likely than not that we will sell the debt security before recovery of its amortized cost basis.
If we intend to sell or it is more likely than not that we will sell a debt security before recovery of its amortized cost basis, the total amount of the unrealized loss position is recognized as an OTTI loss in earnings. To the extent that a debt security that is in an unrealized loss position is not impaired based on the preceding, we will consider a debt security to be impaired when we believe it to be probable that we will not be able to collect the entire amortized cost basis. For debt securities in an unrealized loss position as of the end of each quarter, we develop a best estimate of the present value of expected cash flows. If the results of the cash flow analysis indicate we will not recover the full amount of its amortized cost basis in the debt security, we record an OTTI loss in earnings equal to the difference between the present value of expected cash flows and the amortized cost basis of the debt security. If applicable, the difference between the total unrealized loss position on the debt security and the OTTI loss recognized in earnings is the non-credit related portion and is recorded as a component of other comprehensive income.
In developing the cash flow analyses for debt securities, we consider various factors for the different categories of debt securities. For municipal bonds, we take into account the taxing power of the issuer, source of
96
Table of Contents
revenue, credit risk and credit enhancements and pre-refunding. For mortgage and asset-backed securities, we discount our best estimate of future cash flows at an effective rate equal to the original effective yield of the security or, in the case of floating rate securities, at the current coupon. Our models include assumptions about prepayment speeds, default and delinquency rates and underlying collateral (if any), as well as credit ratings, credit enhancements and other observable market data. For corporate bonds, we review business prospects, credit ratings and available information from asset managers and rating agencies for individual securities.
We may ultimately record a realized loss after having originally concluded that the decline in value was temporary. Risks and uncertainties are inherent in the methodology we use to assess other than temporary declines in value. Risks and uncertainties could include, but are not limited to, incorrect assumptions about financial condition, liquidity or future prospects, inadequacy of any underlying collateral, and unfavorable changes in economic conditions or social trends, interest rates or credit ratings.
See Note 1(b) and Note 4(e) to Notes to Consolidated Financial Statements set forth in Part II, Item 8, “Financial Statements and Supplementary Data” of this Form 10-K for additional information on our investments and investment impairments.
Goodwill and Other Intangible Assets
Goodwill and other intangible assets, net of amortization, are recorded as a consequence of business acquisitions. Goodwill represents the excess, if any, of the amount paid to acquire subsidiaries and other businesses over the fair value of their net assets as of the date of acquisition. Other intangible assets are recorded at their fair value as of the acquisition date. A significant amount of judgment is needed to determine the fair values as of the date of acquisition of other intangible assets and the net assets acquired in a business acquisition. The determination of the fair value of other intangible assets and net assets often involves the use of valuation models and other estimates, which involve many assumptions and variables and are inherently subjective. Other intangible assets that are not deemed to have an indefinite useful life are amortized over their estimated useful lives. Goodwill and intangible assets that have an indefinite useful life are not subject to amortization.
Goodwill and other intangible assets deemed to have an indefinite useful life are tested annually in the fourth quarter of every year for impairment. Goodwill and other intangible assets are also tested whenever events and changes in circumstances suggest that the carrying amount may not be recoverable. A significant amount of judgment is required in performing goodwill and other intangible asset impairment tests. These tests may include estimating the fair value of our operating subsidiaries and other intangible assets. If it is determined that an asset has been impaired, the asset is written down by the amount of the impairment, with a corresponding charge to net earnings. Subsequent reversal of any impairment charge is not permitted.
With respect to goodwill, a qualitative assessment is first made to determine whether it is necessary to perform quantitative testing. This initial assessment includes, among other factors, consideration of: (i) past, current and projected future earnings and equity; (ii) recent trends and market conditions; and (iii) valuation metrics involving similar companies that are publicly-traded and acquisitions of similar companies, if available. If this initial qualitative assessment indicates that the fair value of an operating subsidiary of ours may be less than its respective carrying amount, a second step is taken, involving a comparison between the estimated fair values of our operating subsidiary with its respective carrying amount including goodwill. Under GAAP, fair value refers to the amount for which the entire operating subsidiary may be bought or sold. The methods for estimating operating subsidiary values include asset and liability fair values and other valuation techniques, such as discounted cash flows and multiples of earnings or revenues. All of these methods involve significant estimates and assumptions. If the carrying value exceeds estimated fair value, there is an indication of potential impairment, and a third step is performed to measure the amount of impairment. The third step involves calculating an implied fair value of goodwill by measuring the excess of the estimated fair value of the operating subsidiary over the aggregate estimated fair values of the individual assets less liabilities. If the carrying value of goodwill exceeds the implied fair value of goodwill, an impairment charge is recorded for the excess.
Our consolidated balance sheet as of December 31, 2014 includes goodwill of $111.9 million related primarily to RSUI, CapSpecialty, Bourn & Koch and Kentucky Trailer, and intangible assets, net of amortization,
97
Table of Contents
of $133.4 million related primarily to TransRe, RSUI, CapSpecialty, Bourn & Koch and Kentucky Trailer. See Note 1(i) and Note 2 to Notes to Consolidated Financial Statements set forth in Part II, Item 8, “Financial Statements and Supplementary Data” of this Form 10-K for additional information on our goodwill and other intangible assets.
Reinsurance Premium Revenues
We must make certain judgments in the determination of assumed reinsurance premiums written and earned. For pro rata contracts, premiums written and earned are generally based on reports received from ceding companies. For excess-of-loss contracts, premiums are generally recorded as written based on contract terms and are earned ratably over the periods the related coverages are provided. Unearned premiums and ceded unearned premiums represent the portion of gross premiums written and ceded premiums written, respectively, relating to the unexpired periods of such coverages. The relationship between net premiums written and net premiums earned will, therefore, generally vary depending on the volume and inception dates of the business assumed and ceded and the mix of such business between pro rata and excess-of-loss reinsurance.
Premiums written and earned, along with related costs, for which data have not been reported by the ceding companies, are estimated based on historical patterns and other relevant information. Such estimates of premiums earned are considered when establishing the IBNR portion of loss reserves. The differences between these estimates and actual data subsequently reported, which may be material as a result of the diversity of cedants and reporting practices and the inherent difficulty in estimating premium inflows, among other factors, are recorded in the period when actual data become available and such differences may materially affect our results of operations.
In addition to the policies described above which contain critical accounting estimates, our other accounting policies are described in Note 1 to Notes to Consolidated Financial Statements set forth in Part II, Item 8, “Financial Statements and Supplementary Data” of this Form 10-K. The accounting policies described in Note 1 require us to make estimates and assumptions that affect the reported amounts of assets, liabilities, revenues and expenses, and related disclosure of contingent assets and liabilities that do not meet the level of materiality required for a determination that the accounting policy includes critical accounting estimates. On an ongoing basis, we evaluate our estimates, including those related to the value of deferred acquisition costs, incentive compensation, income taxes, pension benefits and contingencies and litigation. Our estimates are based on historical experience and on various other assumptions that are believed to be reasonable under the circumstances. Our actual results may differ from these estimates under different assumptions or conditions.
Financial Condition
Parent Level
General. In general, we follow a policy of maintaining a relatively liquid financial condition at our unrestricted holding companies. This policy has permitted us to expand our operations through internal growth at our subsidiaries and through acquisitions of, or substantial investments in, operating companies. As of December 31, 2014, we held total marketable securities and cash of $1,032.0 million, compared with $840.0 million as of December 31, 2013. The increase in 2014 primarily reflects the receipt of dividends from RSUI and TransRe, partially offset by repurchases of shares of our common stock and capital contributions to subsidiaries. The $1,032.0 million is comprised of $284.2 million at the parent company, $538.1 million at AIHL and $209.7 million at the TransRe holding company. In addition, we held non-marketable investments at our unrestricted holding companies totaling $466.9 million (see “Investments in certain other invested assets” herein for additional detail). We believe that we have and will have adequate internally generated funds, cash resources and unused credit facilities to provide for the currently foreseeable needs of our business, and we had no material commitments for capital expenditures as of December 31, 2014.
Stockholders’ equity attributable to Alleghany stockholders was approximately $7.5 billion as of December 31, 2014, compared with approximately $6.9 billion as of December 31, 2013. The increase in stockholders’ equity in 2014 primarily reflects net earnings and an increase in unrealized appreciation on our debt securities portfolio, partially offset by repurchases of our common stock and, to a lesser extent, the impact
98
Table of Contents
of changes in foreign currency exchange rates. The increase in unrealized appreciation on our debt securities portfolio was due to a modest decrease in long-term interest rates that occurred in 2014. As of December 31, 2014, we had 16,054,323 shares of our common stock outstanding, compared with 16,766,192 shares of our common stock outstanding as of December 31, 2013.
Debt. On September 9, 2014, we completed a public offering of $300.0 million aggregate principal amount of our 4.90% senior notes due on September 15, 2044, or the “2044 Senior Notes.” The 2044 Senior Notes are unsecured and unsubordinated general obligations of Alleghany. Interest on the 2044 Senior Notes is payable semi-annually on March 15 and September 15 of each year. The terms of the 2044 Senior Notes permit redemption prior to their maturity. The indenture under which the 2044 Senior Notes were issued contains covenants that impose conditions on our ability to create liens on, or engage in sales of, the capital stock of AIHL, TransRe or RSUI. The 2044 Senior Notes were issued at approximately 99.3 percent of par, resulting in proceeds after underwriting discount, commissions and other expenses of $294.3 million, and an effective yield of approximately 5.0 percent. Approximately $3.6 million of underwriting discount, commissions and other expenses were recorded as deferred charges, which are amortized over the life of the 2044 Senior Notes.
On October 15, 2014, TransRe redeemed $300.0 million aggregate principal amount of its 2015 Senior Notes for $324.4 million, consisting of the $300.0 million aggregate principal amount redeemed, $18.6 million of redemption premium and $5.8 million of accrued and unpaid interest to the date of redemption. Of the $324.4 million redemption amount, $297.3 million was funded by a capital contribution from Alleghany primarily using the $294.3 million of net proceeds from Alleghany’s issuance of the 2044 Senior Notes. As a result of this early extinguishment of debt, TransRe recorded a realized loss, before tax, of $9.4 million in 2014.
On June 26, 2012, we completed a public offering of $400.0 million aggregate principal amount of our 4.95% senior notes due on June 27, 2022, or the “2022 Senior Notes.” The 2022 Senior Notes are unsecured and unsubordinated general obligations of Alleghany. Interest on the 2022 Senior Notes is payable semi-annually on June 27 and December 27 of each year. The terms of the 2022 Senior Notes permit redemption prior to their maturity. The indenture under which the 2022 Senior Notes were issued contains covenants that impose conditions on our ability to create liens on, or engage in sales of, the capital stock of AIHL, TransRe or RSUI. The 2022 Senior Notes were issued at approximately 99.9 percent of par, resulting in proceeds after underwriting discount, commissions and other expenses of $396.0 million, and an effective yield of approximately 5.05 percent. Approximately $3.6 million of underwriting discount, commissions and other expenses were recorded as deferred charges, which are amortized over the life of the 2022 Senior Notes.
On September 20, 2010, we completed a public offering of $300.0 million aggregate principal amount of our 5.625% senior notes due on September 15, 2020, or the “2020 Senior Notes.” The 2020 Senior Notes are unsecured and unsubordinated general obligations of Alleghany. Interest on the 2020 Senior Notes is payable semi-annually on March 15 and September 15 of each year. The terms of the 2020 Senior Notes permit redemption prior to their maturity. The indenture under which the 2020 Senior Notes were issued contains covenants that impose conditions on our ability to create liens on, or engage in sales of, the capital stock of AIHL, TransRe or RSUI. The 2020 Senior Notes were issued at approximately 99.6 percent of par, resulting in proceeds after underwriting discount, commissions and other expenses of $298.9 million, and an effective yield of approximately 5.67 percent. Approximately $2.8 million of underwriting discount, commissions and other expenses were recorded as deferred charges, which are amortized over the life of the 2020 Senior Notes.
Credit Agreement. On October 15, 2013, we entered into a four-year credit agreement, or the “Credit Agreement” which provides for an unsecured credit facility in an aggregate principal amount of up to $200.0 million. The Credit Agreement is scheduled to terminate on October 15, 2017, unless terminated at an earlier date. Borrowings under the Credit Agreement will be available for working capital and general corporate purposes.
Alternate Base Rate Borrowings under the Credit Agreement bear interest at (x) the greatest of (a) the administrative agent’s prime rate, (b) the federal funds effective rate plus 0.5 percent, or (c) an adjusted London Interbank Offering Rate, or “Adjusted LIBO Rate,” for a one month interest period on such day plus 1 percent,
99
Table of Contents
plus (y) an applicable margin. Eurodollar Borrowings under the Credit Agreement bear interest at the Adjusted LIBO Rate for the interest period in effect plus an applicable margin. The Credit Agreement requires that all loans be repaid in full no later than October 15, 2017. The Credit Agreement requires us to pay a commitment fee each quarter in a range of between 0.125 and 0.30 percent per annum, based upon our credit ratings, on the daily unused amount of the commitments.
The Credit Agreement contains representations, warranties and covenants customary for bank loan facilities of this nature. In this regard, the Credit Agreement requires us to, among other things, (x) maintain consolidated net worth of not less than the sum of (i) $4,223.9 million plus (ii) 50 percent of our cumulative consolidated net earnings in each fiscal quarter thereafter (if positive) commencing on September 30, 2013, and (y) maintain a ratio of consolidated total indebtedness to consolidated capital as of the end of each fiscal quarter of not greater than 0.35 to 1.0. Additionally, the Credit Agreement contains various negative covenants with which we must comply, including, but not limited to, limitations respecting: the creation of liens on any property or asset; the incurrence of indebtedness; mergers, consolidations, liquidations and dissolutions; change of business; sales of assets; transactions with affiliates; anti-terrorism laws and foreign asset control regulations and other provisions customary in similar types of agreements.
In addition, at any time when a default has occurred and is continuing or would result therefrom, the Credit Agreement proscribes our ability to declare or pay, or permit certain of our subsidiaries to declare or pay, any dividend on, or make any payment on account of, or set apart assets for a sinking or other analogous fund for, the purchase, redemption, defeasance, retirement or acquisition of, any of our stock or the stock of any such subsidiary.
If an Event of Default occurs under the Credit Agreement, then, to the extent permitted in the Credit Agreement, the lenders may direct the administrative agent to, or the administrative agent may, with the consent of lenders holding more than 50 percent of the aggregate outstanding principal amount of the loans, as applicable, terminate the commitments, accelerate the repayment of any outstanding loans and exercise all rights and remedies available to such lenders under the Credit Agreement and applicable law. In the case of an Event of Default that exists due to the occurrence of certain involuntary or voluntary bankruptcy, insolvency or reorganization events of ours, the commitments will automatically terminate and the repayment of any outstanding loans shall be automatically accelerated.
There were no borrowings under the Credit Agreement since its inception through December 31, 2014.
Dividends from Subsidiaries. As of December 31, 2014, approximately $6.3 billion of our total equity of $7.5 billion was unavailable for dividends or advances to us from our subsidiaries. The remaining $1.2 billion was available for dividends or advances to us from our subsidiaries, or was retained at the Alleghany parent level, and as such, was available to pay dividends to Alleghany’s stockholders as of December 31, 2014.
The ability of our reinsurance and insurance subsidiaries to pay dividends or other distributions is subject to the laws and regulations applicable to each subsidiary, as well as each subsidiary’s need to maintain capital requirements adequate to maintain its operations and financial strength ratings issued by independent rating agencies.
In the United States, our reinsurance and insurance subsidiaries are subject to insurance laws and regulations that restrict the amount and timing of dividends they may pay without the prior approval of regulatory authorities. Under the insurance holding company laws and regulations, our reinsurance and insurance subsidiaries may not pay an “extraordinary” dividend or distribution, or pay a dividend except out of earned surplus, without the approval of state insurance regulators. In general, an “extraordinary” dividend or distribution is defined as a dividend or distribution that, together with other dividends and distributions made within the preceding 12 months, exceeds the greater (or, in some jurisdictions, the lesser) of (i) 10 percent of the insurer’s statutory surplus as of the end of the prior calendar year, and (ii) the adjusted statutory net investment income during the prior calendar year.
TransRe’s operations are also regulated in various foreign jurisdictions with respect to currency, amount and type of security deposits, amount and type of reserves and amount and type of local investment. Regulations
governing constitution of technical reserves and remittance balances in some countries may hinder remittance of
100
Table of Contents
profits and repatriation of assets. International operations and assets held abroad may also be adversely affected by political and other developments in foreign countries, including possible tax changes, nationalization and changes in regulatory policy, as well as by consequences of hostilities and unrest. The risks of such occurrences and their overall effect upon TransRe vary from country to country and cannot easily be predicted.
A summary of dividends paid to Alleghany by its reinsurance and insurance subsidiaries in 2014, 2013 and 2012 follows:
| \ | Year Ended December 31, | |||||||||||
| 2014 | 2013 | 2012 | ||||||||||
| (in millions) | ||||||||||||
| TransRe(1) |
$ | 300.0 | $ | 150.0 | $ | — | ||||||
| RSUI |
225.0 | 100.0 | — | |||||||||
| CapSpecialty |
— | 15.0 | 15.0 | |||||||||
|
|
|
|
|
|
|
|||||||
| Total |
$ | 525.0 | $ | 265.0 | $ | 15.0 | ||||||
|
|
|
|
|
|
|
|||||||
| (1) | In 2014, TRC paid dividends of $400.0 million to TransRe, of which $300.0 million was in turn paid to Alleghany. In 2013, TRC paid dividends of $200.0 million to TransRe, of which $150.0 million was in turn paid to Alleghany. |
As of December 31, 2014, a maximum amount of $78.6 million was payable by TRC without prior approval of the New York State Department of Financial Services and a maximum amount of $9.7 million was payable by RSUI without prior approval of the applicable regulatory authorities. The maximum amount of ordinary annual dividends payable by our reinsurance and insurance subsidiaries in 2015 without prior regulatory approval is $635.0 million, consisting of $478.6 million from TRC and $156.4 million from RSUI, respectively, subject to certain timing restrictions based on dividend patterns over the preceding twelve months.
Common Stock Repurchases. In October 2012, our Board of Directors authorized a program to repurchase shares of our common stock, at such times and at prices as management determines advisable, up to an aggregate of $300.0 million, or the “2012 Repurchase Program.” In July 2014, our Board of Directors authorized, upon the completion of the 2012 Repurchase Program, the repurchase of additional shares of common stock, at such times and at prices as management may determine advisable, up to an aggregate of $350.0 million, or the “2014 Repurchase Program.” As of December 31, 2014, we completed the 2012 Repurchase Program, and we had repurchased approximately $58.6 million of shares under the 2014 Repurchase Program.
Pursuant to the Alleghany Board of Directors authorizations, we repurchased shares of our common stock in 2014, 2013 and 2012 as follows:
| Years Ended December 31, | ||||||||||||
| 2014 | 2013 | 2012 | ||||||||||
| Shares repurchased |
732,391 | 113,160 | 53,346 | |||||||||
| Cost of shares repurchased (in millions) |
$ | 300.5 | $ | 40.4 | $ | 17.8 | ||||||
| Average price per share repurchased |
$ | 410.27 | $ | 356.92 | $ | 333.08 | ||||||
Dividends. From 1987 through 2011, we declared stock dividends in lieu of cash dividends every year except 1998, when our wholly-owned subsidiary, Chicago Title Corporation, was spun off to our stockholders. Our Board of Directors determined not to declare a dividend, cash or stock, for 2012 through 2014.
Capital Contributions. From time to time, we make capital contributions to our subsidiaries. In 2014, we made a $297.3 million capital contribution to TransRe to redeem $300 million par value of the 2015 Senior Notes, as described above. In 2014, we also made capital contributions to ACC to: (i) make $96.6 million of capital contributions to SORC; (ii) exercise an option to increase its ownership in Kentucky Trailer by $15.0 million; and (iii) make a $60.3 million investment in Jazwares. In 2013, we made a $14.7 million capital
101
Table of Contents
contribution to AIHL Re to provide capital to support an intercompany reinsurance contract between AIHL Re and PCIC. In 2013, we made $40.7 million of capital contributions to ACC to make capital contributions to SORC and to make an investment in Kentucky Trailer of $24.9 million. In 2012, we made a $15.0 million capital contribution to PacificComp to provide additional capital support. In 2012, we also made capital contributions to ACC to make an investment in Bourn & Koch of $47.0 million, and to make capital contributions to SORC of $16.2 million. We expect that we will continue to make capital contributions to our subsidiaries from time to time in the future for similar or other purposes.
Contractual Obligations. We have certain obligations to make future payments under contracts and credit-related financial instruments and commitments. As of December 31, 2014, certain long-term aggregate contractual obligations and credit-related financial commitments were as follows:
| Contractual Obligations |
Total | Within 1 Year | More than 1 Year but Within 3 Years |
More than 3 Years but Within 5 Years |
More than 5 years | |||||||||||||||
| (in millions) | ||||||||||||||||||||
| Loss and LAE |
$ | 11,579.2 | $ | 2,786.8 | $ | 3,496.3 | $ | 1,947.4 | $ | 3,348.7 | ||||||||||
| Senior Notes and related interest(1) |
3,129.1 | 467.7 | 158.8 | 158.8 | 2,343.8 | |||||||||||||||
| Operating lease obligations |
279.8 | 34.8 | 57.9 | 51.5 | 135.6 | |||||||||||||||
| Investments(2) |
171.5 | 73.3 | 49.1 | 49.1 | — | |||||||||||||||
| Other long-term liabilities(3) |
317.4 | 81.9 | 107.8 | 31.0 | 96.7 | |||||||||||||||
|
|
|
|
|
|
|
|
|
|
|
|||||||||||
| Total |
$ | 15,477.0 | $ | 3,444.5 | $ | 3,869.9 | $ | 2,237.8 | $ | 5,924.8 | ||||||||||
|
|
|
|
|
|
|
|
|
|
|
|||||||||||
| (1) | “Senior Notes” refers to: (i) the “Alleghany Senior Notes,” consisting of the 2020 Senior Notes, the 2022 Senior Notes and the 2044 Senior Notes; and (ii) the “TransRe Senior Notes,” consisting of the 2015 Senior Notes and TransRe’s 8.00% senior notes due on November 30, 2039. See Note 8 to Notes to Consolidated Financial Statements set forth in Part II, Item 8, “Financial Statements and Supplementary Data” of this Form 10-K for further details on the Senior Notes. |
| (2) | Primarily reflect capital commitments to investment partnerships. |
| (3) | Primarily reflect employee pension obligations, certain retired executive pension obligations and obligations under certain incentive compensation plans. |
Our reinsurance and insurance subsidiaries have obligations to make certain payments for loss and LAE pursuant to insurance policies and reinsurance contracts they issue. These future payments are reflected as reserves on our consolidated financial statements. With respect to loss and LAE, there is typically no minimum contractual commitment associated with insurance policies and reinsurance contracts, and the timing and ultimate amount of actual claims related to these reserves is uncertain.
Investments in Certain Other Invested Assets. In December 2012, TransRe obtained an ownership interest in Pillar Capital Holdings Limited, or “Pillar Holdings,” a Bermuda-based insurance asset manager focused on collateralized reinsurance and catastrophe insurance-linked securities. Additionally, TransRe invested $175.0 million and AIHL invested $25.0 million in limited partnership funds managed by Pillar Holdings, or the “Funds.” The objective of the Funds is to create portfolios with attractive risk-reward characteristics and low correlation with other asset classes, using the extensive reinsurance and capital market experience of the principals of Pillar Holdings. We have concluded that both Pillar Holdings and the Funds, which we collectively refer to as the “Pillar Investments,” represent variable interest entities and that we are not the primary beneficiary, as we do not have the ability to direct the activities that most significantly impact each entity’s economic performance. Therefore, the Pillar Investments are not consolidated and are accounted for under the equity method of accounting. Our potential maximum loss in the Pillar Investments is limited to our cumulative investment. As of December 31, 2014, our carrying value in the Pillar Investments, as determined under the equity method of accounting, was $235.2 million, which is reported in other invested assets on our consolidated balance sheets.
In July 2013, AIHL invested $250.0 million in Ares, an asset manager, in exchange for a 6.25 percent equity stake in Ares, with an agreement to engage Ares to manage up to $1.0 billion in certain investment
102
Table of Contents
half of these interests may be converted beginning at the end of a one-year waiting period, and the remaining half may be converted beginning at the end of a two-year waiting period. Until our limited partner interests convert into Ares common units, we classify our investment in Ares as a component of other invested assets, and we account for our investment using the equity method of accounting. As of December 31, 2014, AIHL’s carrying value in Ares was $231.7 million, which is net of returns of capital received from Ares.
Subsidiaries
Financial strength is also a high priority of our subsidiaries, whose assets stand behind their financial commitments to their customers and vendors. We believe that our subsidiaries have and will have adequate internally generated funds, cash resources, and unused credit facilities to provide for the currently foreseeable needs of their businesses. Our subsidiaries had no material commitments for capital expenditures as of December 31, 2014.
The obligations and cash outflow of our reinsurance and insurance subsidiaries include claim settlements, commission expenses, administrative expenses, purchases of investments, and interest and principal payments on the 2015 Senior Notes and TransRe’s 8.00% senior notes due on November 30, 2039. In addition to premium collections, cash inflow is obtained from interest and dividend income and maturities and sales of investments. Because cash inflow from premiums is received in advance of cash outflow required to settle claims, our reinsurance and insurance operating units accumulate funds which they invest pending the need for liquidity. As the cash needs of a reinsurance or an insurance company can be unpredictable due to the uncertainty of the claims settlement process, the portfolios of our reinsurance and insurance subsidiaries consist primarily of debt securities and short-term investments to ensure the availability of funds and maintain a sufficient amount of liquid securities.
Of our non-insurance operating subsidiaries, SORC has largely depended on Alleghany to support its growth. From formation in 2011 through December 31, 2014, we have invested $155.7 million in SORC. In April 2014, SORC obtained a $250.0 million secured bank credit facility. As of December 31, 2014, SORC had $6.8 million of borrowings under the facility, representing its borrowing capacity as of December 31, 2014. In addition, Kentucky Trailer had $29.2 million of borrowings as of December 31, 2014 related to a mortgage loan and borrowings under its available credit facility. None of these liabilities are guaranteed by Alleghany or ACC, and they are classified as a component of other liabilities on our consolidated balance sheets.
103
Table of Contents
Consolidated Investment Holdings
Investment Strategy and Holdings. Our investment strategy seeks to preserve principal and maintain liquidity while trying to maximize our risk-adjusted, after-tax rate of return. Our investment decisions are guided mainly by the nature and timing of expected liability payouts, management’s forecast of cash flows and the possibility of unexpected cash demands, for example, to satisfy claims due to catastrophe losses. Our consolidated investment portfolio currently consists mainly of highly rated and liquid debt and equity securities listed on national securities exchanges. The overall debt securities portfolio credit quality is measured using the lowest rating of the Standard & Poor’s Ratings Services, Moody’s Investors Service Inc. or Fitch Ratings. In this regard, the overall weighted-average credit quality rating of our debt securities portfolio as of December 31, 2014 and 2013 was AA-. Although many of our debt securities, which consist predominantly of municipal bonds, are insured by third party financial guaranty insurance companies, the impact of such insurance was not significant to the debt securities credit quality rating as of December 31, 2014. As of December 31, 2014, the ratings of our debt securities portfolio were as follows:
| Ratings as of December 31, 2014 | ||||||||||||||||||||||||
| AAA /Aaa | AA / Aa | A | BBB / Baa | Below BBB / Baa or Not-Rated(1) |
Total | |||||||||||||||||||
| (dollars in millions) | ||||||||||||||||||||||||
| U.S. Government obligations |
$ | — | $ | 541.1 | $ | — | $ | — | $ | — | $ | 541.1 | ||||||||||||
| Municipal bonds |
808.9 | 3,340.7 | 1,042.9 | 3.9 | 1.1 | 5,197.5 | ||||||||||||||||||
| Foreign government obligations |
453.7 | 256.4 | 182.2 | 8.1 | — | 900.4 | ||||||||||||||||||
| U.S. corporate bonds |
17.8 | 200.3 | 532.6 | 931.6 | 472.5 | 2,154.8 | ||||||||||||||||||
| Foreign corporate bonds |
154.1 | 317.7 | 696.9 | 246.2 | 88.8 | 1,503.7 | ||||||||||||||||||
| Mortgage and asset-backed securities: |
||||||||||||||||||||||||
| RMBS |
31.2 | 1,599.9 | 0.2 | 1.9 | 22.7 | 1,655.9 | ||||||||||||||||||
| CMBS |
415.1 | 380.4 | 237.2 | 86.5 | 6.1 | 1,125.3 | ||||||||||||||||||
| Other asset-backed securities |
949.6 | 102.8 | 151.2 | 314.0 | 2.3 | 1,519.9 | ||||||||||||||||||
|
|
|
|
|
|
|
|
|
|
|
|
|
|||||||||||||
| Total debt securities |
$ | 2,830.4 | $ | 6,739.3 | $ | 2,843.2 | $ | 1,592.2 | $ | 593.5 | $ | 14,598.6 | ||||||||||||
|
|
|
|
|
|
|
|
|
|
|
|
|
|||||||||||||
| Percentage of debt securities |
19.4% | 46.1% | 19.5% | 10.9% | 4.1% | 100.0% | ||||||||||||||||||
|
|
|
|
|
|
|
|
|
|
|
|
|
|||||||||||||
| (1) | Consists of $200.2 million of securities rated BB / Ba, $291.7 million of securities rated B, $63.0 million of securities rated CCC, $10.9 million of securities rated CC, $4.7 million of securities rates below CC and $23.0 million of not-rated securities. |
Our debt securities portfolio has been designed to enable management to react to investment opportunities created by changing interest rates, prepayments, tax and credit considerations or other factors, or to circumstances that could result in a mismatch between the desired duration of debt securities and the duration of liabilities, and, as such, is classified as AFS.
Effective duration measures a portfolio’s sensitivity to changes in interest rates. In this regard, as of December 31, 2014, our debt securities portfolio had an effective duration of approximately 3.9 years compared with 4.5 years as of December 31, 2013. The decline in duration in 2014 primarily reflects the sales of long-dated U.S. Treasury Strip debt securities in April 2014. As of December 31, 2014, approximately $3.9 billion, or 26.7 percent, of our debt securities portfolio represented securities with maturities of five years or less. See Note 4(b) to Notes to Consolidated Financial Statements set forth in Part II, Item 8, “Financial Statements and Supplementary Data” of this Form 10-K for additional detail on the contractual maturities of our consolidated debt securities portfolio. We may modestly increase the proportion of our debt securities portfolio held in securities with maturities of more than five years should the yields of these securities provide, in our judgment, sufficient compensation for their increased risk. We do not believe that this strategy would reduce our ability to meet ongoing claim payments or to respond to significant catastrophe losses.
In the event paid losses accelerate beyond the ability of our reinsurance and insurance subsidiaries to fund these paid losses from current cash balances, current operating cash flow, dividend and interest receipts and security maturities, we would need to liquidate a portion of our investment portfolio, make capital contributions to our reinsurance and
104
Table of Contents
insurance subsidiaries, and / or arrange for financing. Strains on liquidity could result from: (i) the occurrence of several significant catastrophe events in a relatively short period of time; (ii) the sale of investments into a depressed marketplace to fund these paid losses; (iii) the uncollectibility of reinsurance recoverables on these paid losses; (iv) the significant decrease in the value of collateral supporting reinsurance recoverables; or (v) a significant reduction in our net premium collections.
We may, from time to time, make significant investments in the common stock of a public company, subject to limitations imposed by applicable regulations.
On a consolidated basis, our invested assets decreased to approximately $18.8 billion as of December 31, 2014 from approximately $19.0 billion as of December 31, 2013, primarily reflecting the impact of repurchases of our common stock, changes in foreign currency exchange rates on our foreign currency-denominated securities and an increase in cash balances, partially offset by the impact of an increase in unrealized appreciation on our debt securities portfolio, due to a modest decrease in longer-term interest rates that occurred in 2014.
Fair Value. The carrying values and estimated fair values of our consolidated financial instruments as of December 31, 2014 and 2013 were as follows:
| December 31, 2014 | December 31, 2013 | |||||||||||||||
| Carrying Value | Fair Value | Carrying Value | Fair Value | |||||||||||||
| (in millions) | ||||||||||||||||
| Assets |
||||||||||||||||
| Investments (excluding equity method investments)(1) |
$ | 18,153.8 | $ | 18,153.8 | $ | 18,632.2 | $ | 18,632.2 | ||||||||
| Liabilities |
||||||||||||||||
| Senior Notes(2) |
$ | 1,767.1 | $ | 1,948.6 | $ | 1,794.4 | $ | 1,887.7 | ||||||||
| (1) | This table includes AFS investments (debt and equity securities as well as partnership and non-marketable equity investments carried at fair value that are included in other invested assets). This table excludes investments accounted for using the equity method and certain loans receivable that are carried at cost, all of which are included in other invested assets. The fair value of short-term investments approximates amortized cost. The fair value of all other categories of investments is discussed below. |
| (2) | See Note 8 to Notes to Consolidated Financial Statements set forth in Part II, Item 8, “Financial Statements and Supplementary Data” of this Form 10-K for additional information on the Senior Notes. |
Fair value is defined as the price that would be received upon the sale of an asset or paid to transfer a liability in an orderly transaction between willing, able and knowledgeable market participants at the measurement date. Fair value measurements are not adjusted for transaction costs. In addition, a three-tiered hierarchy for inputs is used in management’s determination of fair value of financial instruments that emphasizes the use of observable inputs over the use of unobservable inputs by requiring that the observable inputs be used when available. Observable inputs are market participant assumptions based on market data obtained from sources independent of the reporting entity. Unobservable inputs are the reporting entity’s own assumptions about market participant assumptions based on the best information available under the circumstances. In assessing the appropriateness of using observable inputs in making our fair value determinations, we consider whether the market for a particular security is “active” or not based on all the relevant facts and circumstances. A market may be considered to be inactive if there are relatively few recent transactions or if there is a significant decrease in market volume. Furthermore, we consider whether observable transactions are “orderly” or not. We do not consider a transaction to be orderly if there is evidence of a forced liquidation or other distressed condition, and as such, little or no weight is given to that transaction as an indicator of fair value.
Although we are responsible for the determination of the fair value of our financial assets and the supporting methodologies and assumptions, we employ third party valuation service providers to gather, analyze and interpret market information and derive fair values based upon relevant methodologies and assumptions for individual instruments. When those providers are unable to obtain sufficient market observable information upon
105
Table of Contents
which to estimate the fair value for a particular security, fair value is determined either by requesting a quote, which is generally non-binding, from brokers who are knowledgeable about these securities or by employing widely accepted internal valuation models.
Valuation service providers typically obtain data about market transactions and other key valuation model inputs from multiple sources and, through the use of widely accepted internal valuation models, provide a single fair value measurement for individual securities for which a fair value has been requested under the terms of service agreements. The inputs used by the valuation service providers include, but are not limited to, market prices from recently completed transactions and transactions of comparable securities, interest rate yield curves, credit spreads, currency rates and other market observable information, as applicable. The valuation models take into account, among other things, market observable information as of the measurement date as well as the specific attributes of the security being valued including its term, interest rate, credit rating, industry sector and, when applicable, collateral quality and other issue or issuer specific information. When market transactions or other market observable data is limited, the extent to which judgment is applied in determining fair value is greatly increased.
The three-tiered hierarchy used in management’s determination of fair value is broken down into three levels based on the reliability of inputs as follows:
| • | Level 1: Valuations are based on unadjusted quoted prices in active markets that we have the ability to access for identical, unrestricted assets and do not involve any meaningful degree of judgment. An active market is defined as a market where transactions for the financial instrument occur with sufficient frequency and volume to provide pricing information on an ongoing basis. Our Level 1 assets include publicly traded common stocks and mutual funds (which are included on the balance sheet in equity securities) where our valuations are based on quoted market prices. |
| • | Level 2: Valuations are based on direct and indirect observable inputs other than quoted market prices included in Level 1. Level 2 inputs include quoted prices for similar assets in active markets and inputs other than quoted prices that are observable for the asset, such as the terms of the security and market-based inputs. Terms of the security include coupon, maturity date and any special provisions that may, for example, enable the investor, at its election, to redeem the security prior to its scheduled maturity date. Market-based inputs include interest rates and yield curves that are observable at commonly quoted intervals and current credit rating(s) of the security. Level 2 assets generally include short-term investments and most debt securities. Our Level 2 liabilities consist of the senior notes. |
| • | Level 3: Valuations are based on techniques that use significant inputs that are unobservable. The valuation of Level 3 assets requires the greatest degree of judgment. These measurements may be made under circumstances in which there is little, if any, market activity for the asset. Our assessment of the significance of a particular input to the fair value measurement in its entirety requires judgment. In making the assessment, we consider factors specific to the asset. In certain cases, the inputs used to measure fair value may fall into different levels of the fair value hierarchy. In such cases, the level in the fair value hierarchy within which the fair value measurement is classified is determined based on the lowest level input that is significant to the fair value measurement in its entirety. Some Level 3 valuations are based entirely on non-binding broker quotes. These securities consist primarily of mortgage-backed and asset-backed securities where reliable pool and loan level collateral information cannot be reasonably obtained. Assets classified as Level 3 principally include certain RMBS, CMBS, other asset-backed securities (primarily, collateralized loan obligations), partnership investments and non-marketable equity investments. See Note 1(c) to Notes to Consolidated Financial Statements set forth in Part II, Item 8, “Financial Statements and Supplementary Data” of this Form 10-K for our accounting policy on fair value. |
We employ specific control processes to determine the reasonableness of the fair values of our financial assets and liabilities. Our processes are designed to ensure that the values received or internally estimated are accurately recorded and that the data inputs and the valuation techniques used are appropriate, consistently applied and that the assumptions are reasonable and consistent with the objective of determining fair value. We
106
Table of Contents
assess the reasonableness of individual security values received from valuation service providers through various analytical techniques. In addition, we validate the reasonableness of fair values by comparing information obtained from our valuation service providers to other third party valuation sources for selected securities. We also validate prices obtained from brokers for selected securities through reviews by those who have relevant expertise and who are independent of those charged with executing investing transactions.
In addition to such procedures, we review the reasonableness of our classification of securities within the three-tiered hierarchy to ensure that the classification is consistent with GAAP.
The estimated fair values of our financial instruments measured at fair value and the level of the fair value hierarchy of inputs used as of December 31, 2014 and 2013 were as follows:
| Level 1 | Level 2 | Level 3 | Total | |||||||||||||
| (in millions) | ||||||||||||||||
| As of December 31, 2014 |
||||||||||||||||
| Equity securities: |
||||||||||||||||
| Common stock |
$ | 2,805.3 | $ | 10.2 | $ | — | $ | 2,815.5 | ||||||||
| Preferred stock |
— | — | — | — | ||||||||||||
|
|
|
|
|
|
|
|
|
|||||||||
| Total equity securities |
2,805.3 | 10.2 | — | 2,815.5 | ||||||||||||
|
|
|
|
|
|
|
|
|
|||||||||
| Debt securities: |
||||||||||||||||
| U.S. Government obligations |
— | 541.1 | — | 541.1 | ||||||||||||
| Municipal bonds |
— | 5,197.5 | — | 5,197.5 | ||||||||||||
| Foreign government obligations |
— | 900.4 | — | 900.4 | ||||||||||||
| U.S. corporate bonds |
— | 2,118.1 | 36.7 | 2,154.8 | ||||||||||||
| Foreign corporate bonds |
— | 1,497.7 | 6.0 | 1,503.7 | ||||||||||||
| Mortgage and asset-backed securities: |
||||||||||||||||
| RMBS(1) |
— | 1,637.7 | 18.2 | 1,655.9 | ||||||||||||
| CMBS |
— | 1,102.0 | 23.3 | 1,125.3 | ||||||||||||
| Other asset-backed securities(2) |
— | 586.8 | 933.1 | 1,519.9 | ||||||||||||
|
|
|
|
|
|
|
|
|
|||||||||
| Total debt securities |
— | 13,581.3 | 1,017.3 | 14,598.6 | ||||||||||||
| Short-term investments |
— | 715.6 | — | 715.6 | ||||||||||||
| Other invested assets(3) |
— | — | 24.1 | 24.1 | ||||||||||||
|
|
|
|
|
|
|
|
|
|||||||||
| Total investments (excluding equity method investments) |
$ | 2,805.3 | $ | 14,307.1 | $ | 1,041.4 | $ | 18,153.8 | ||||||||
|
|
|
|
|
|
|
|
|
|||||||||
| Senior Notes |
$ | — | $ | 1,948.6 | $ | — | $ | 1,948.6 | ||||||||
|
|
|
|
|
|
|
|
|
|||||||||
107
Table of Contents
strategies. In May 2014, Ares completed an initial public offering of its common units. Upon completion of the initial public offering, our equity investment in Ares converted to limited partner interests in certain Ares subsidiaries that are convertible into an aggregate 5.9 percent interest in Ares common units. At our discretion,
| Level 1 | Level 2 | Level 3 | Total | |||||||||||||
| (in millions) | ||||||||||||||||
| As of December 31, 2013 |
||||||||||||||||
| Equity securities: |
||||||||||||||||
| Common stock |
$ | 2,229.4 | $ | — | $ | — | $ | 2,229.4 | ||||||||
| Preferred stock |
— | — | — | — | ||||||||||||
|
|
|
|
|
|
|
|
|
|||||||||
| Total equity securities |
2,229.4 | — | — | 2,229.4 | ||||||||||||
|
|
|
|
|
|
|
|
|
|||||||||
| Debt securities: |
||||||||||||||||
| U.S. Government obligations |
— | 955.0 | — | 955.0 | ||||||||||||
| Municipal bonds |
— | 5,590.1 | — | 5,590.1 | ||||||||||||
| Foreign government obligations |
— | 975.4 | — | 975.4 | ||||||||||||
| U.S. corporate bonds |
— | 2,285.4 | 27.5 | 2,312.9 | ||||||||||||
| Foreign corporate bonds |
— | 1,830.7 | 1.0 | 1,831.7 | ||||||||||||
| Mortgage and asset-backed securities: |
||||||||||||||||
| RMBS(1) |
— | 1,469.0 | 78.8 | 1,547.8 | ||||||||||||
| CMBS |
— | 824.8 | 60.8 | 885.6 | ||||||||||||
| Other asset-backed securities(2) |
— | 446.0 | 258.4 | 704.4 | ||||||||||||
|
|
|
|
|
|
|
|
|
|||||||||
| Total debt securities |
— | 14,376.4 | 426.5 | 14,802.9 | ||||||||||||
| Short-term investments |
— | 1,317.9 | — | 1,317.9 | ||||||||||||
| Other invested assets(3) |
— | — | 282.0 | 282.0 | ||||||||||||
|
|
|
|
|
|
|
|
|
|||||||||
| Total investments (excluding equity method investments) |
$ | 2,229.4 | $ | 15,694.3 | $ | 708.5 | $ | 18,632.2 | ||||||||
|
|
|
|
|
|
|
|
|
|||||||||
| Senior Notes |
$ | — | $ | 1,887.7 | $ | — | $ | 1,887.7 | ||||||||
|
|
|
|
|
|
|
|
|
|||||||||
| (1) | Primarily includes government agency pass-through securities guaranteed by a government agency or government sponsored enterprise, among other types of RMBS. |
| (2) | Includes $900.7 million and $237.9 million of collateralized loan obligations as of December 31, 2014 and December 31, 2013, respectively. |
| (3) | Includes partnership and non-marketable equity investments accounted for on an AFS basis, and excludes investments accounted for using the equity method and certain loans receivable that are carried at cost. |
Municipal Bonds. The following table provides the fair value of our municipal bonds as of December 31, 2014, categorized by state and revenue source. Special revenue bonds are debt securities for which the payment of principal and interest is available solely from the cash flows of the related projects. As issuers of revenue bonds do not have the ability to draw from tax revenues or levy taxes to fund obligations, revenue bonds may carry a greater risk of default than general obligation bonds.
| Special Revenue | ||||||||||||||||||||||||||||||||||||||||||||
| State | Education | Hospital | Housing | Lease Revenue |
Special Tax |
Transit | Utilities | All Other Sources |
Total Special Revenue |
Total General Obligation |
Total Fair Value |
|||||||||||||||||||||||||||||||||
| (in millions) | ||||||||||||||||||||||||||||||||||||||||||||
| New York |
$ | 19.8 | $ | — | $ | 0.5 | $ | — | $ | 69.4 | $ | 175.0 | $ | 96.0 | $ | 105.7 | $ | 466.4 | $ | 17.5 | $ | 483.9 | ||||||||||||||||||||||
| Texas |
38.3 | — | — | — | 42.9 | 69.2 | 53.6 | — | 204.0 | 215.5 | 419.5 | |||||||||||||||||||||||||||||||||
| California |
23.8 | 43.7 | — | 22.6 | — | 53.4 | 76.4 | 7.5 | 227.4 | 122.4 | 349.8 | |||||||||||||||||||||||||||||||||
| Massachusetts |
21.1 | 24.6 | 3.6 | — | 34.0 | 50.4 | 1.9 | 6.5 | 142.1 | 131.0 | 273.1 | |||||||||||||||||||||||||||||||||
| North Carolina |
21.5 | 17.8 | 5.4 | — | — | 0.6 | 26.0 | 20.1 | 91.4 | 111.2 | 202.6 | |||||||||||||||||||||||||||||||||
| Illinois |
14.9 | 31.8 | 1.7 | — | 15.1 | 36.2 | 11.8 | — | 111.5 | 44.8 | 156.3 | |||||||||||||||||||||||||||||||||
| Ohio |
46.8 | 5.3 | 0.3 | 0.7 | — | 1.7 | 74.9 | — | 129.7 | 25.6 | 155.3 | |||||||||||||||||||||||||||||||||
| Missouri |
4.7 | 77.5 | 3.2 | — | — | 10.0 | 44.5 | 7.3 | 147.2 | 6.4 | 153.6 | |||||||||||||||||||||||||||||||||
| Florida |
— | 0.3 | 1.3 | 44.7 | 10.3 | 46.2 | 6.1 | 2.8 | 111.7 | 21.9 | 133.6 | |||||||||||||||||||||||||||||||||
| Colorado |
23.6 | 10.8 | — | 10.1 | 6.1 | 28.5 | 14.5 | — | 93.6 | 38.1 | 131.7 | |||||||||||||||||||||||||||||||||
| All other states |
157.0 | 41.2 | 71.4 | 133.8 | 165.8 | 264.5 | 233.2 | 148.2 | 1,215.1 | 417.8 | 1,632.9 | |||||||||||||||||||||||||||||||||
|
|
|
|
|
|
|
|
|
|
|
|
|
|
|
|
|
|
|
|
|
|
|
|||||||||||||||||||||||
| Total |
$ | 371.5 | $ | 253.0 | $ | 87.4 | $ | 211.9 | $ | 343.6 | $ | 735.7 | $ | 638.9 | $ | 298.1 | $ | 2,940.1 | $ | 1,152.2 | 4,092.3 | |||||||||||||||||||||||
|
|
|
|
|
|
|
|
|
|
|
|
|
|
|
|
|
|
|
|
|
|||||||||||||||||||||||||
| Total advance refunded / escrowed maturity bonds |
|
1,105.2 | ||||||||||||||||||||||||||||||||||||||||||
|
|
|
|||||||||||||||||||||||||||||||||||||||||||
| Total municipal bonds |
|
$ | 5,197.5 | |||||||||||||||||||||||||||||||||||||||||
|
|
|
|||||||||||||||||||||||||||||||||||||||||||
108
Table of Contents
Catastrophe Exposure
The business of our reinsurance and insurance subsidiaries exposes them to losses from various catastrophe events. In a catastrophe event, losses from many insureds across multiple lines of business may result directly or indirectly from such single occurrence. Our reinsurance and insurance subsidiaries take certain measures to mitigate the impact of catastrophe events through various means including considering catastrophe risks in their underwriting and pricing decisions, purchasing reinsurance, monitoring and modeling accumulated exposures and managing exposure in key geographic zones and product lines that are prone to catastrophe events.
Natural disasters such as hurricanes, other windstorms, earthquakes and other catastrophes have the potential to materially and adversely affect our operating results. Other risks, such as an outbreak of a pandemic disease, a major terrorist event, the bankruptcy of a major company or a marine and / or aviation disaster, could also have a material adverse effect on our business and operating results.
We evaluate catastrophe events and assess the probability of occurrence and magnitude through the use of industry recognized models and other techniques. We supplement these models by judgmentally interpreting and adjusting when appropriate the modeled output and by periodically monitoring the exposure risks of our operations. There is no single standard methodology to project possible losses from catastrophe exposures. Further, there are no industry standard assumptions used in projecting these losses, and the form and quality of the data obtained, including data obtained from insureds and ceding companies, and used in these models are not uniformly compatible with the data requirements of all models. Therefore, the use of different methodologies and assumptions could materially change the projected losses. Finally, these modeled losses may not be comparable with estimates made by other companies.
Although the analytical tools used to estimate catastrophe exposure are useful in both pricing and monitoring catastrophe risk, the estimates derived by use of these techniques are inherently uncertain and do not reflect our maximum exposures to these events. Although the models are frequently updated, these projections are nevertheless inherently imprecise. It is highly likely that our losses will vary, perhaps materially, from these estimates.
Projections of potential catastrophe losses are typically expressed in terms of the probable maximum loss, or “PML.” We define PML as our anticipated maximum loss (taking into account contract limits) caused by a single catastrophe event at a specified estimated return period affecting a broad contiguous area. These modeled losses are estimated based upon contracts in force at January 1, 2015 for TransRe, December 1, 2014 for RSUI and August 7, 2014 for PacificComp. Modeled results also reflect losses arising from certain of our invested assets that have specific catastrophe exposures.
The following is an overview of such modeled PMLs from property, engineering, marine and energy exposures and the associated natural perils that we deem most significant. The estimated amount of these modeled losses are presented for both a 100 year return period (having a likelihood of being exceeded in any single year of 1.0 percent), and a 250 year return period (having a likelihood of being exceeded in any single year of 0.4 percent), and are presented in two ways: (i) gross catastrophe losses; and (ii) after-tax net catastrophe costs (that is, gross losses, net of reinsurance, net reinstatement premiums and taxes). The reduction for reinsurance assumes that all reinsurers fulfill their obligations in accordance with contract terms.
| 100 Year Return Period | 250 Year Return Period | |||||||||||||||
| Gross Loss (before tax) |
Net Loss (after tax) |
Gross Loss (before tax) |
Net Loss (after tax) |
|||||||||||||
| (in billions) | ||||||||||||||||
| Florida, Wind |
$ | 1.2 | $ | 0.5 | $ | 1.7 | $ | 0.6 | ||||||||
| California, Earthquake |
1.0 | 0.4 | 1.6 | 0.6 | ||||||||||||
| Northeast U.S., Wind |
0.8 | 0.3 | 1.6 | 0.6 | ||||||||||||
| Gulf Coast, Wind |
0.8 | 0.3 | 1.4 | 0.5 | ||||||||||||
| Europe, Wind |
0.7 | 0.2 | 0.9 | 0.4 | ||||||||||||
| Japan, Earthquake |
0.5 | 0.2 | 0.7 | 0.3 | ||||||||||||
| Japan, Wind |
0.4 | 0.2 | 0.5 | 0.2 | ||||||||||||
109
Table of Contents
“Florida, Wind” has the highest modeled after-tax net catastrophe costs for both a 100 and 250 year return period. These costs would represent approximately 6 percent and 9 percent, respectively, of stockholders’ equity attributable to Alleghany as of December 31, 2014. If multiple severe catastrophe events occur in any one year, or a single catastrophe event affects more than one geographic area, the potential economic cost to us could be materially higher than any one of the amounts shown above.
There is much uncertainty and imprecision in the compilation of these estimates at many stages in the process. Moreover, the makeup of our in-force business is constantly changing as new business is added and existing contracts terminate or expire, including contracts for reinsurance coverage purchased by us. In addition, these estimates take into account what we believe to be the most likely accumulation of territories, but there can be no assurance that we have captured every possible scenario in our analysis. As a result of these factors, among others, there can be no assurance that we will not experience after-tax net catastrophe costs from individual events that will exceed these estimates by a material amount. There also can be no assurance that we will not experience catastrophe events more frequently than the modeled probabilities would suggest. In any given year, catastrophe events could have a material adverse effect on our financial condition, results of operations, cash flows and liquidity.
Recent Accounting Standards
Future Application of Accounting Standards.
In April 2014, the FASB issued guidance that changed the criteria for reporting discontinued operations. Under the new guidance, only disposals that represent a strategic shift in operations qualify as discontinued operations. In addition, the new guidance requires expanded disclosures about discontinued operations. This guidance is effective in the first quarter of 2015. We will adopt this guidance in the first quarter of 2015, and we do not currently believe that the implementation will have an impact on our results of operations and financial condition.
In May 2014, the FASB, together with the International Accounting Standards Board, issued guidance on the recognition of revenue from contracts with customers. Under the new guidance, revenue is recognized as the transfer of goods and services to customers takes place, and in amounts that reflect the payment or payments that are expected to be received from the customers for those goods and services. The new guidance also requires new disclosures about revenue. Insurance- and reinsurance-related revenues are not impacted by this guidance. This guidance is effective in the first quarter of 2017 for public entities, with earlier adoption not permitted. We will adopt this guidance in the first quarter of 2017, and we do not currently believe that the implementation will have a material impact on its results of operations and financial condition.
Item 7A. Quantitative and Qualitative Disclosures about Market Risk.
Market risk is the risk of loss from adverse changes in market prices and rates. The primary market risk related to our debt securities is the risk of loss associated with adverse changes in interest rates. We also invest in equity securities which are subject to fluctuations in market value. We hold our equity securities and debt securities as AFS. Any changes in the fair value in these securities, net of tax, would be recorded as a component of other comprehensive income. However, if a decline in fair value relative to cost is believed to be other than temporary, a loss is generally recorded on our statement of earnings. In addition, significant portions of our assets (principally investments) and liabilities (principally loss and LAE reserves and unearned premiums) are exposed to changes in foreign currency exchange rates. The net change in the carrying value of assets and liabilities denominated in foreign currencies is generally recorded as a component of other comprehensive income.
The sensitivity analyses presented below provide only a limited, point-in-time view of the market risk of our financial instruments. The actual impact of changes in market interest rates, equity market prices and foreign currency exchange rates may differ significantly from those shown in these sensitivity analyses. The sensitivity analyses are further limited because they do not consider any actions we could take in response to actual and / or anticipated changes in equity market prices, market interest rates, or foreign currency exchange rates. In addition, these sensitivity analyses do not provide weight to risks relating to market issues such as liquidity and the credit worthiness of investments.
110
Table of Contents
Interest Rate Risk
The primary market risk for our and our subsidiaries’ debt securities is interest rate risk at the time of refinancing. We monitor the interest rate environment to evaluate reinvestment and refinancing opportunities. We generally do not use derivatives to manage market and interest rate risks. The table below presents sensitivity analyses as of December 31, 2014 of our (i) consolidated debt securities and (ii) Senior Notes, which are sensitive to changes in interest rates. Sensitivity analysis is defined as the measurement of potential change in future earnings, fair values, or cash flows of market sensitive instruments resulting from one or more selected hypothetical changes in interest rates over a selected time period. In the sensitivity analysis model below, we use a +/- 300 basis point range of change in interest rates to measure the hypothetical change in fair value of the financial instruments included in the analysis. The change in fair value is determined by calculating hypothetical December 31, 2014 ending prices based on yields adjusted to reflect a +/- 300 basis point range of change in interest rates, comparing these hypothetical ending prices to actual ending prices, and multiplying the difference by the par outstanding. The selected hypothetical changes in interest rates do not reflect what could be the potential best or worst case scenarios.
| Interest Rate Shifts |
-300 | -200 | -100 | 0 | 100 | 200 | 300 | |||||||||||||||||||||
| (dollars in millions) | ||||||||||||||||||||||||||||
| Assets: |
||||||||||||||||||||||||||||
| Debt securities, fair value |
$ | 15,459.9 | $ | 15,397.0 | $ | 15,086.2 | $ | 14,598.6 | $ | 14,029.3 | $ | 13,470.1 | $ | 12,935.7 | ||||||||||||||
| Estimated change in fair value |
$ | 861.3 | $ | 798.4 | $ | 487.6 | $ | — | $ | (569.3 | ) | $ | (1,128.5 | ) | $ | (1,662.9 | ) | |||||||||||
| Liabilities: |
|
|
|
|
|
|
|
|
|
|
|
|
|
|
|
|
|
|
|
|
| |||||||
| Senior Notes, fair value |
$ | 2,548.3 | $ | 2,312.4 | $ | 2,115.7 | $ | 1,948.6 | $ | 1,806.3 | $ | 1,684.4 | $ | 1,579.2 | ||||||||||||||
| Estimated change in fair value |
$ | 599.7 | $ | 363.8 | $ | 167.1 | $ | — | $ | (142.3 | ) | $ | (264.2 | ) | $ | (369.4 | ) | |||||||||||
Equity Risk
Our equity securities are subject to fluctuations in market value. The table below summarizes our equity market price risk and reflects the effect of a hypothetical increase or decrease in market prices as of December 31, 2014 on the estimated fair value of our consolidated equity securities portfolio. The selected hypothetical price changes do not reflect what could be the potential best or worst case scenarios.
| As of December 31, 2014 | ||||||
| (dollars in millions) | ||||||
| Estimated Fair Value |
Hypothetical Price Change |
Estimated Fair Value After Hypothetical Change in Price |
Hypothetical Percentage Increase (Decrease) in Stockholders’ Equity | |||
| $2,815.5 | 20% Increase | $3,378.6 | 4.9% | |||
| 20% Decrease | $2,252.4 | -4.9% | ||||
In addition to debt and equity securities, we invest in several partnerships which are subject to fluctuations in market value. Our partnership investments are included in other invested assets and are accounted for as AFS or using the equity method, and had a carrying value of $303.1 million as of December 31, 2014.
111
Table of Contents
Foreign Currency Exchange Rate Risk
Foreign currency exchange rate risk is the potential change in value arising from changes in foreign currency exchange rates. Our reinsurance operations located in foreign countries maintain some or all of their capital in their local currency, and conduct business in their local currency, as well as the currencies of the other countries in which they operate. The table below summarizes our foreign currency exchange rate risk and shows the effect of a hypothetical increase or decrease in foreign currency exchange rates against the U.S. dollar as of December 31, 2014 on the estimated net carrying value of our foreign currency denominated assets, net of our foreign currency denominated liabilities. The selected hypothetical changes do not reflect what could be the potential best or worst case scenarios.
| As of December 31, 2014 | ||||||
| (dollars in millions) | ||||||
| Estimated |
Hypothetical Price Change |
Estimated Fair Value After Hypothetical Change in Price |
Hypothetical Percentage Increase (Decrease) in Stockholders’ Equity | |||
| $341.8(1) |
20% Increase | $410.2 | 0.6% | |||
| 20% Decrease | $273.4 | -0.6% | ||||
| (1) | Denotes a net asset position as of December 31, 2014. |
112
Table of Contents
Item 8. Financial Statements and Supplementary Data.
Index to Consolidated Financial Statements
Alleghany Corporation and Subsidiaries
| Description |
Page | |||
| 114 | ||||
| 115 | ||||
| Consolidated Statements of Earnings and Comprehensive Income |
116 | |||
| 117 | ||||
| 118 | ||||
| 119 | ||||
| 161 | ||||
113
Table of Contents
REPORT OF INDEPENDENT REGISTERED PUBLIC ACCOUNTING FIRM
The Board of Directors and Stockholders
Alleghany Corporation:
We have audited the accompanying consolidated balance sheets of Alleghany Corporation and subsidiaries (the “Company”) as of December 31, 2014 and 2013, and the related consolidated statements of earnings and comprehensive income, changes in stockholders’ equity and cash flows for each of the three years in the period ended December 31, 2014. These financial statements are the responsibility of the Company’s management. Our responsibility is to express an opinion on these financial statements based on our audits.
We conducted our audits in accordance with the standards of the Public Company Accounting Oversight Board (United States). Those standards require that we plan and perform the audit to obtain reasonable assurance about whether the financial statements are free of material misstatement. An audit also includes examining, on a test basis, evidence supporting the amounts and disclosures in the financial statements. An audit also includes assessing the accounting principles used and significant estimates made by management, as well as evaluating the overall financial statement presentation. We believe that our audits provide a reasonable basis for our opinion.
In our opinion, the financial statements referred to above present fairly, in all material respects, the consolidated financial position of Alleghany Corporation and subsidiaries at December 31, 2014 and 2013, and the consolidated results of their operations and their cash flows for each of the three years in the period ended December 31, 2014, in conformity with U.S. generally accepted accounting principles.
We also have audited, in accordance with the standards of the Public Company Accounting Oversight Board (United States), Alleghany Corporation and subsidiaries’ internal control over financial reporting as of December 31, 2014, based on criteria established in Internal Control-Integrated Framework issued by the Committee of Sponsoring Organizations of the Treadway Commission (2013 framework) and our report dated February 24, 2015 expressed an unqualified opinion thereon.
/s/ Ernst & Young LLP
New York, New York
February 24, 2015
114
Table of Contents
ALLEGHANY CORPORATION AND SUBSIDIARIES
Consolidated Balance Sheets
| December 31, | ||||||||
| 2014 | 2013 | |||||||
| (in thousands, except share amounts) | ||||||||
| Assets |
||||||||
| Investments: |
||||||||
| Available-for-sale securities at fair value: |
||||||||
| Equity securities (cost: 2014 – $2,366,035; 2013 – $1,804,698) |
$ | 2,815,484 | $ | 2,229,453 | ||||
| Debt securities (amortized cost: 2014 – $14,364,430; 2013 – $14,875,750) |
14,598,641 | 14,802,890 | ||||||
| Short-term investments |
715,553 | 1,317,895 | ||||||
|
|
|
|
|
|||||
| 18,129,678 | 18,350,238 | |||||||
| Other invested assets |
705,665 | 641,924 | ||||||
|
|
|
|
|
|||||
| Total investments |
18,835,343 | 18,992,162 | ||||||
| Cash |
605,259 | 498,315 | ||||||
| Accrued investment income |
136,511 | 146,381 | ||||||
| Premium balances receivable |
683,848 | 675,255 | ||||||
| Reinsurance recoverables |
1,361,083 | 1,363,707 | ||||||
| Ceded unearned premiums |
184,435 | 173,148 | ||||||
| Deferred acquisition costs |
353,169 | 334,740 | ||||||
| Property and equipment at cost, net of accumulated depreciation and amortization |
88,910 | 58,974 | ||||||
| Goodwill |
111,904 | 99,747 | ||||||
| Intangible assets, net of amortization |
133,378 | 127,284 | ||||||
| Current taxes receivable |
91,202 | 13,049 | ||||||
| Net deferred tax assets |
389,597 | 469,787 | ||||||
| Other assets |
514,797 | 408,539 | ||||||
|
|
|
|
|
|||||
| Total assets |
$ | 23,489,436 | $ | 23,361,088 | ||||
|
|
|
|
|
|||||
| Liabilities and Stockholders’ Equity |
||||||||
| Loss and loss adjustment expenses |
$ | 11,597,216 | $ | 11,952,541 | ||||
| Unearned premiums |
1,834,184 | 1,765,550 | ||||||
| Senior Notes |
1,767,125 | 1,794,407 | ||||||
| Reinsurance payable |
79,100 | 90,562 | ||||||
| Other liabilities |
729,767 | 810,507 | ||||||
|
|
|
|
|
|||||
| Total liabilities |
16,007,392 | 16,413,567 | ||||||
|
|
|
|
|
|||||
| Common stock (shares authorized: 2014 and 2013 – 22,000,000; shares issued: 2014 and 2013 – 17,459,961) |
17,460 | 17,460 | ||||||
| Contributed capital |
3,610,717 | 3,613,151 | ||||||
| Accumulated other comprehensive income |
353,584 | 186,930 | ||||||
| Treasury stock, at cost (2014 – 1,405,638 shares; 2013 – 693,769 shares) |
(507,699) | (213,911) | ||||||
| Retained earnings |
3,999,366 | 3,320,127 | ||||||
|
|
|
|
|
|||||
| Total stockholders’ equity attributable to Alleghany stockholders |
7,473,428 | 6,923,757 | ||||||
| Noncontrolling interest |
8,616 | 23,764 | ||||||
|
|
|
|
|
|||||
| Total stockholders’ equity |
7,482,044 | 6,947,521 | ||||||
|
|
|
|
|
|||||
| Total liabilities and stockholders’ equity |
$ | 23,489,436 | $ | 23,361,088 | ||||
|
|
|
|
|
|||||
See accompanying Notes to Consolidated Financial Statements.
115
Table of Contents
ALLEGHANY CORPORATION AND SUBSIDIARIES
Consolidated Statements of Earnings and Comprehensive Income
| Year Ended December 31, | ||||||||||||
| 2014 | 2013 | 2012 | ||||||||||
| (in thousands, except per share amounts) | ||||||||||||
| Revenues |
||||||||||||
| Net premiums earned |
$ | 4,410,647 | $ | 4,239,216 | $ | 3,733,005 | ||||||
| Net investment income |
459,876 | 465,664 | 312,998 | |||||||||
| Net realized capital gains |
247,058 | 232,119 | 157,879 | |||||||||
| Other than temporary impairment losses |
(36,294) | (44,047) | (2,907) | |||||||||
| Gain on bargain purchase |
— | — | 494,940 | |||||||||
| Other income |
150,522 | 78,702 | 57,297 | |||||||||
|
|
|
|
|
|
|
|||||||
| Total revenues |
5,231,809 | 4,971,654 | 4,753,212 | |||||||||
|
|
|
|
|
|
|
|||||||
| Costs and Expenses |
||||||||||||
| Net loss and loss adjustment expenses |
2,494,565 | 2,479,353 | 2,630,170 | |||||||||
| Commissions, brokerage and other underwriting expenses |
1,421,306 | 1,339,191 | 882,502 | |||||||||
| Other operating expenses |
252,673 | 164,859 | 123,700 | |||||||||
| Corporate administration |
47,054 | 36,111 | 75,842 | |||||||||
| Amortization of intangible assets |
(5,750) | 10,164 | 253,298 | |||||||||
| Interest expense |
90,052 | 86,740 | 68,424 | |||||||||
|
|
|
|
|
|
|
|||||||
| Total costs and expenses |
4,299,900 | 4,116,418 | 4,033,936 | |||||||||
|
|
|
|
|
|
|
|||||||
| Earnings before income taxes |
931,909 | 855,236 | 719,276 | |||||||||
| Income taxes |
251,777 | 225,882 | 17,032 | |||||||||
|
|
|
|
|
|
|
|||||||
| Net earnings |
680,132 | 629,354 | 702,244 | |||||||||
| Net earnings attributable to noncontrolling interest |
893 | 933 | — | |||||||||
|
|
|
|
|
|
|
|||||||
| Net earnings attributable to Alleghany stockholders |
$ | 679,239 | $ | 628,421 | $ | 702,244 | ||||||
|
|
|
|
|
|
|
|||||||
| Net earnings |
$ | 680,132 | $ | 629,354 | $ | 702,244 | ||||||
| Other comprehensive income: |
||||||||||||
| Change in unrealized gains, net of deferred taxes of $193,881, $37,791 and $112,301 for 2014, 2013 and 2012, respectively |
360,065 | 70,183 | 208,560 | |||||||||
| Less: reclassification for net realized capital gains and other than temporary impairment losses, net of taxes of ($77,042), ($51,209) and ($54,240) for 2014, 2013 and 2012, respectively |
(143,077) | (95,102) | (100,732) | |||||||||
| Change in unrealized currency translation adjustment, net of deferred taxes of ($21,464), ($19,323) and ($7,200) for 2014, 2013 and 2012, respectively |
(39,861) | (35,886) | (13,371) | |||||||||
| Retirement plans |
(10,473) | (2,773) | 520 | |||||||||
|
|
|
|
|
|
|
|||||||
| Comprehensive income |
846,786 | 565,776 | 797,221 | |||||||||
| Comprehensive income attributable to noncontrolling interest |
893 | 933 | — | |||||||||
|
|
|
|
|
|
|
|||||||
| Comprehensive income attributable to Alleghany stockholders |
$ | 845,893 | $ | 564,843 | $ | 797,221 | ||||||
|
|
|
|
|
|
|
|||||||
| Basic earnings per share attributable to Alleghany stockholders |
$ | 41.40 | $ | 37.44 | $ | 45.48 | ||||||
| Diluted earnings per share attributable to Alleghany stockholders |
41.40 | 37.44 | 45.48 | |||||||||
See accompanying Notes to Consolidated Financial Statements.
116
Table of Contents
ALLEGHANY CORPORATION AND SUBSIDIARIES
Consolidated Statements of Changes in Stockholders’ Equity
| Three Years Ended December 31, 2014 | ||||||||||||||||||||||||||||||||
| Common Stock |
Contributed Capital |
Accumulated Other Comprehensive Income |
Treasury Stock |
Retained Earnings |
Total Stockholders’ Equity Attributable to Alleghany Shareholders |
Non- controlling Interest |
Total Stockholders’ Equity |
|||||||||||||||||||||||||
| (in thousands, except share amounts) | ||||||||||||||||||||||||||||||||
| Balance as of December 31, 2011 (9,117,787 shares of common stock issued; 566,141 in treasury) |
$ | 9,118 | $ | 938,037 | $ | 155,532 | $(167,319 | ) | $ | 1,990,309 | $ | 2,925,677 | $ | — | $ | 2,925,677 | ||||||||||||||||
| Add (deduct): |
||||||||||||||||||||||||||||||||
| Net earnings |
— | — | — | — | 702,244 | 702,244 | — | 702,244 | ||||||||||||||||||||||||
| Other comprehensive income (loss), net of tax: |
||||||||||||||||||||||||||||||||
| Retirement plans |
— | — | 520 | — | — | 520 | — | 520 | ||||||||||||||||||||||||
| Change in unrealized appreciation of investments, net |
— | — | 107,828 | — | — | 107,828 | — | 107,828 | ||||||||||||||||||||||||
| Change in unrealized currency translation adjustment, net |
— | — | (13,371 | ) | — | — | (13,371 | ) | — | (13,371 | ) | |||||||||||||||||||||
|
|
|
|
|
|
|
|
|
|
|
|
|
|
|
|
|
|||||||||||||||||
| Comprehensive income |
— | — | 94,977 | — | 702,244 | 797,221 | — | 797,221 | ||||||||||||||||||||||||
|
|
|
|
|
|
|
|
|
|
|
|
|
|
|
|
|
|||||||||||||||||
| Dividends paid |
— | — | — | — | — | — | — | — | ||||||||||||||||||||||||
| Treasury stock repurchase |
— | — | — | (17,768 | ) | — | (17,768 | ) | — | (17,768 | ) | |||||||||||||||||||||
| Stock issuance in connection with acquisitions |
8,361 | 2,688,048 | — | — | — | 2,696,409 | — | 2,696,409 | ||||||||||||||||||||||||
| Other, net |
— | (6,173 | ) | (1 | ) | 9,269 | (847 | ) | 2,248 | — | 2,248 | |||||||||||||||||||||
|
|
|
|
|
|
|
|
|
|
|
|
|
|
|
|
|
|||||||||||||||||
| Balance as of December 31, 2012 (17,478,746 shares of common stock issued; 588,123 in treasury) |
17,479 | 3,619,912 | 250,508 | (175,818 | ) | 2,691,706 | 6,403,787 | — | 6,403,787 | |||||||||||||||||||||||
| Add (deduct): |
||||||||||||||||||||||||||||||||
| Net earnings |
— | — | — | — | 628,421 | 628,421 | 933 | 629,354 | ||||||||||||||||||||||||
| Other comprehensive income (loss), net of tax: |
||||||||||||||||||||||||||||||||
| Retirement plans |
— | — | (2,773 | ) | — | — | (2,773 | ) | — | (2,773 | ) | |||||||||||||||||||||
| Change in unrealized appreciation of investments, net |
— | — | (24,919 | ) | — | — | (24,919 | ) | — | (24,919 | ) | |||||||||||||||||||||
| Change in unrealized currency translation adjustment, net |
— | — | (35,886 | ) | — | — | (35,886 | ) | — | (35,886 | ) | |||||||||||||||||||||
|
|
|
|
|
|
|
|
|
|
|
|
|
|
|
|
|
|||||||||||||||||
| Comprehensive income |
— | — | (63,578 | ) | — | 628,421 | 564,843 | 933 | 565,776 | |||||||||||||||||||||||
|
|
|
|
|
|
|
|
|
|
|
|
|
|
|
|
|
|||||||||||||||||
| Dividends paid |
— | — | — | — | — | — | — | — | ||||||||||||||||||||||||
| Treasury stock repurchase |
— | — | — | (40,389 | ) | — | (40,389 | ) | — | (40,389 | ) | |||||||||||||||||||||
| Other, net |
(19 | ) | (6,761 | ) | — | 2,296 | — | (4,484 | ) | 22,831 | 18,347 | |||||||||||||||||||||
|
|
|
|
|
|
|
|
|
|
|
|
|
|
|
|
|
|||||||||||||||||
| Balance as of December 31, 2013 (17,459,961 shares of common stock issued; 693,769 in treasury) |
17,460 | 3,613,151 | 186,930 | (213,911 | ) | 3,320,127 | 6,923,757 | 23,764 | 6,947,521 | |||||||||||||||||||||||
| Add (deduct): |
||||||||||||||||||||||||||||||||
| Net earnings |
— | — | — | — | 679,239 | 679,239 | 893 | 680,132 | ||||||||||||||||||||||||
| Other comprehensive income (loss), net of tax: |
||||||||||||||||||||||||||||||||
| Retirement plans |
— | — | (10,473 | ) | — | — | (10,473 | ) | — | (10,473 | ) | |||||||||||||||||||||
| Change in unrealized appreciation of investments, net |
— | — | 216,988 | — | — | 216,988 | — | 216,988 | ||||||||||||||||||||||||
| Change in unrealized currency translation adjustment, net |
— | — | (39,861 | ) | — | — | (39,861 | ) | — | (39,861 | ) | |||||||||||||||||||||
|
|
|
|
|
|
|
|
|
|
|
|
|
|
|
|
|
|||||||||||||||||
| Comprehensive income |
— | — | 166,654 | — | 679,239 | 845,893 | 893 | 846,786 | ||||||||||||||||||||||||
|
|
|
|
|
|
|
|
|
|
|
|
|
|
|
|
|
|||||||||||||||||
| Dividends paid |
— | — | — | — | — | — | — | — | ||||||||||||||||||||||||
| Treasury stock repurchase |
— | — | — | (300,478 | ) | — | (300,478 | ) | — | (300,478 | ) | |||||||||||||||||||||
| Other, net |
— | (2,434 | ) | — | 6,690 | — | 4,256 | (16,041 | ) | (11,785 | ) | |||||||||||||||||||||
|
|
|
|
|
|
|
|
|
|
|
|
|
|
|
|
|
|||||||||||||||||
| Balance as of December 31, 2014 (17,459,961 shares of common stock issued; 1,405,638 in treasury) |
$ | 17,460 | $ | 3,610,717 | $ | 353,584 | $ | (507,699 | ) | $ | 3,999,366 | $ | 7,473,428 | $ | 8,616 | $ | 7,482,044 | |||||||||||||||
|
|
|
|
|
|
|
|
|
|
|
|
|
|
|
|
|
|||||||||||||||||
See accompanying Notes to Consolidated Financial Statements.
117
Table of Contents
ALLEGHANY CORPORATION AND SUBSIDIARIES
Consolidated Statements of Cash Flows
| Year Ended December 31, | ||||||||||||
| 2014 | 2013 | 2012 | ||||||||||
| (in thousands) | ||||||||||||
| Cash flows from operating activities |
||||||||||||
| Net earnings |
$ | 680,132 | $ | 629,354 | $ | 702,244 | ||||||
| Adjustments to reconcile net earnings to net cash provided by (used in) operating activities: |
||||||||||||
| Depreciation and amortization |
178,949 | 246,598 | 464,857 | |||||||||
| Net realized capital (gains) losses |
(247,058 | ) | (232,119 | ) | (157,879 | ) | ||||||
| Other than temporary impairment losses |
36,294 | 44,047 | 2,907 | |||||||||
| (Increase) decrease in reinsurance recoverables, net of reinsurance payable |
(8,838 | ) | 7,800 | (19,918 | ) | |||||||
| (Increase) decrease in premium balances receivable |
(8,593 | ) | (90,060 | ) | 238,039 | |||||||
| (Increase) decrease in ceded unearned premiums |
(11,287 | ) | (18,168 | ) | (5,081 | ) | ||||||
| (Increase) decrease in deferred acquisition costs |
(18,429 | ) | (31,225 | ) | (232,933 | ) | ||||||
| Increase (decrease) in unearned premiums |
68,634 | 60,208 | (4,770 | ) | ||||||||
| Increase (decrease) in loss and loss adjustment expenses |
(355,325 | ) | (287,225 | ) | 376,375 | |||||||
| Change in unrealized foreign exchange losses (gains) |
172,856 | (40,563 | ) | (84,806 | ) | |||||||
| Gain on bargain purchase |
— | — | (494,940 | ) | ||||||||
| Other, net |
(114,556 | ) | 295,213 | (288,241 | ) | |||||||
|
|
|
|
|
|
|
|||||||
| Net adjustments |
(307,353 | ) | (45,494 | ) | (206,390 | ) | ||||||
|
|
|
|
|
|
|
|||||||
| Net cash provided by (used in) operating activities |
372,779 | 583,860 | 495,854 | |||||||||
|
|
|
|
|
|
|
|||||||
| Cash flows from investing activities |
||||||||||||
| Purchases of debt securities |
(6,783,116 | ) | (7,763,841 | ) | (4,031,564 | ) | ||||||
| Purchases of equity securities |
(1,521,201 | ) | (2,381,558 | ) | (1,150,646 | ) | ||||||
| Sales of debt securities |
5,558,948 | 6,497,356 | 2,217,405 | |||||||||
| Maturities and redemptions of debt securities |
1,437,988 | 1,761,164 | 1,610,273 | |||||||||
| Sales of equity securities |
1,043,181 | 2,134,242 | 782,184 | |||||||||
| Net (purchase) sale in short-term investments |
624,209 | (943,260 | ) | 867,261 | ||||||||
| Purchases of property and equipment |
(43,681 | ) | (17,427 | ) | (8,123 | ) | ||||||
| Purchases of subsidiary, net of cash acquired |
(8,203 | ) | — | (436,502 | ) | |||||||
| Other, net |
(257,090 | ) | 92,770 | (163,948 | ) | |||||||
|
|
|
|
|
|
|
|||||||
| Net cash provided by (used in) investing activities |
51,035 | (620,554 | ) | (313,660 | ) | |||||||
|
|
|
|
|
|
|
|||||||
| Cash flows from financing activities |
||||||||||||
| Proceeds from issuance of Senior Notes |
297,942 | — | 399,592 | |||||||||
| Debt issue costs paid |
(3,625 | ) | — | (3,470 | ) | |||||||
| Treasury stock acquisitions |
(300,478 | ) | (40,389 | ) | (17,768 | ) | ||||||
| Repayments of Senior Notes |
(318,588 | ) | — | — | ||||||||
| Other, net |
22,674 | (30,217 | ) | 9,574 | ||||||||
|
|
|
|
|
|
|
|||||||
| Net cash (used in) provided by financing activities |
(302,075 | ) | (70,606 | ) | 387,928 | |||||||
|
|
|
|
|
|
|
|||||||
| Effect of exchange rate changes on cash |
(14,795 | ) | (43,909 | ) | (5,347 | ) | ||||||
|
|
|
|
|
|
|
|||||||
| Net increase (decrease) in cash |
106,944 | (151,209 | ) | 564,775 | ||||||||
| Cash at beginning of period |
498,315 | 649,524 | 84,749 | |||||||||
|
|
|
|
|
|
|
|||||||
| Cash at end of period |
$ | 605,259 | $ | 498,315 | $ | 649,524 | ||||||
|
|
|
|
|
|
|
|||||||
| Supplemental disclosures of cash flow information |
||||||||||||
| Cash paid during the period for: |
||||||||||||
| Interest paid |
$ | 100,977 | $ | 103,302 | $ | 93,183 | ||||||
| Income taxes paid (refunds received) |
335,050 | 75,738 | 116,565 | |||||||||
See accompanying Notes to Consolidated Financial Statements.
118
Table of Contents
ALLEGHANY CORPORATION AND SUBSIDIARIES
Notes to Consolidated Financial Statements
1. Summary of Significant Accounting Principles
(a) Principles of Financial Statement Presentation
Alleghany Corporation (“Alleghany”), a Delaware corporation, owns and manages certain operating subsidiaries and investments, anchored by a core position in property and casualty reinsurance and insurance. Alleghany was initially incorporated in 1929, was subsequently incorporated in 1984 under the laws of the State of Delaware, and in December 1986, it succeeded to the business of its parent company, Alleghany Corporation. Through its wholly-owned subsidiary Alleghany Insurance Holdings LLC (“AIHL”) and its subsidiaries, Alleghany is engaged in the property and casualty insurance business. AIHL’s insurance operations are principally conducted by its subsidiaries RSUI Group, Inc. (“RSUI”), CapSpecialty, Inc. (“CapSpecialty”) and Pacific Compensation Corporation (“PacificComp”). CapSpecialty, formerly known as Capitol Transamerica Corporation, has been a subsidiary of AIHL since January 2002, RSUI has been a subsidiary of AIHL since July 2003, and PacificComp has been a subsidiary of AIHL since July 2007. AIHL Re LLC (“AIHL Re”) has been a wholly-owned subsidiary of Alleghany since its formation in May 2006. AIHL Re is a captive reinsurance company which provides reinsurance to Alleghany’s insurance operating subsidiaries and affiliates. On March 6, 2012 (the “TransRe Acquisition Date”), Alleghany consummated a merger transaction (the “merger”) with Transatlantic Holdings, Inc. (“TransRe”), at which time TransRe became one of Alleghany’s wholly-owned subsidiaries and Alleghany’s reinsurance operations commenced. Alleghany’s public equity investments, including those held by TransRe’s and AIHL’s operating subsidiaries, are managed primarily by Alleghany’s wholly-owned subsidiary Roundwood Asset Management LLC (“Roundwood”).
Although Alleghany’s primary sources of revenues and earnings are its reinsurance and insurance operations and investments, Alleghany also manages, sources, executes and monitors certain private capital investments primarily through its wholly-owned subsidiary Alleghany Capital Corporation (“ACC”). ACC’s private capital investments are included in corporate activities for segment reporting purposes and include: (i) Stranded Oil Resources Corporation (“SORC”), an exploration and production company focused on enhanced oil recovery, headquartered in Austin, Texas; (ii) Bourn & Koch, Inc. (“Bourn & Koch”), a manufacturer and remanufacturer/retrofitter of precision machine tools and supplier of replacement parts, headquartered in Rockford, Illinois; (iii) R.C. Tway Company, LLC (“Kentucky Trailer”), a manufacturer of custom trailers and truck bodies for the moving and storage industry and other markets, headquartered in Louisville, Kentucky; (iv) an approximately 40 percent equity interest in ORX Exploration, Inc. (“ORX”), a regional oil and gas exploration and production company, headquartered in New Orleans, Louisiana; and (v) a 30 percent equity interest in Jazwares, LLC (“Jazwares”), a toy and consumer electronics company, headquartered in Sunrise, Florida, which interest was acquired on July 31, 2014 for $60.3 million. ORX and Jazwares are accounted for under the equity-method of accounting. In addition, Alleghany owns and manages properties in the Sacramento, California region through its wholly-owned subsidiary Alleghany Properties Holdings LLC (“Alleghany Properties”).
Alleghany owned a minority stake in Homesite Group Incorporated (“Homesite”), a national, full-service, mono-line provider of homeowners insurance, until its sale to American Family Insurance Company, a Wisconsin-based mutual insurance company, on December 31, 2013.
Unless the context otherwise requires, references to “Alleghany” include Alleghany together with its subsidiaries.
The accompanying consolidated financial statements include the results of Alleghany and its wholly-owned and majority-owned subsidiaries and have been prepared in accordance with accounting principles generally accepted in the United States (“GAAP”). All significant inter-company balances and transactions have been eliminated in consolidation. The results of TransRe are included in Alleghany’s consolidated financial statements beginning from the TransRe Acquisition Date, except with respect to “Supplemental Pro Forma Information” included in Note 2(e). In addition, the results of Bourn & Koch have been included in Alleghany’s consolidated
119
Table of Contents
results beginning April 26, 2012 and the results of Kentucky Trailer have been included in Alleghany’s consolidated results beginning August 30, 2013, the date of ACC’s initial investment in Kentucky Trailer.
The portion of stockholders’ equity, net earnings and accumulated other comprehensive income that is not attributable to Alleghany stockholders is presented on the Consolidated Balance Sheets, the Consolidated Statements of Earnings and Comprehensive Income and the Consolidated Statements of Changes in Stockholders’ Equity as noncontrolling interest. Bourn & Koch and Kentucky Trailer each have approximately 20 percent noncontrolling interests outstanding during 2014.
The preparation of financial statements in conformity with GAAP requires management to make estimates and assumptions. These estimates and assumptions affect the reported amounts of assets and liabilities and disclosure of contingent assets and liabilities as of the date of the financial statements, as well as the reported amounts of revenues and expenses during the reporting period. Alleghany relies on historical experience and on various other assumptions that it believes to be reasonable under the circumstances to make judgments about the carrying value of assets and liabilities that are not readily apparent from other sources. Actual results may differ materially from those reported results to the extent that those estimates and assumptions prove to be inaccurate. Changes in estimates are reflected in the consolidated statement of earnings and comprehensive income in the period in which the change is made.
(b) Investments
Investments consist of debt securities, equity securities, short-term investments and other invested assets. Alleghany considers all of its marketable equity securities, debt securities and short-term investments as available-for-sale (“AFS”). Debt securities consist of securities with an initial fixed maturity of more than one year. Debt securities typically take the form of bonds. Equity securities generally consist of securities that represent ownership interests in an enterprise. Equity securities typically take the form of common stock. Mutual funds are also classified as equity securities, including funds that invest mostly in debt securities. Short-term investments include commercial paper, certificates of deposit, money market instruments and any fixed maturity investment with an initial maturity of one year or less.
AFS securities are recorded at fair value. Unrealized gains and losses during the year, net of the related tax effect applicable to AFS securities, as well as partnership investments that Alleghany accounts for as AFS, are excluded from earnings and reflected in comprehensive income, and the cumulative effect is reported as a separate component of stockholders’ equity until realized. If a decline in fair value is deemed to be other than temporary, the investment is written down to its fair value and the amount of the write-down is recorded as an other than temporary impairment (“OTTI”) loss on the statement of earnings. In addition, any portion of such decline related to debt securities that is believed to arise from factors other than credit is recorded as a component of other comprehensive income rather than against earnings.
Other invested assets include invested assets not identified above, primarily related to: (i) equity investments in operating companies where Alleghany has significant influence; (ii) partnership investments (including hedge funds and private equity funds); (iii) loans receivable; and (iv) non-marketable equity investments. Equity investments in operating companies where Alleghany has significant influence (an aggregate common stock position held at or above 20 percent is presumed to convey significant influence) are accounted for using the equity method. Partnership investments are accounted for as either AFS, or using the equity method where Alleghany has significant influence. Loans receivable are carried at unpaid principal balance. Non-marketable equity investments are accounted for as AFS securities.
Net realized gains and losses on investments are determined in accordance with the specific identification method.
Net investment income consists primarily of: (i) interest income from debt securities, short-term investments and cash, including any premium amortization or discount accretion; (ii) dividend income from equity securities; and (iii) investment income from other invested assets, which generally includes distributions when receivable and earnings from investments accounted for under the equity method; less expenses related to investments. Interest income is accrued when earned. Premiums and discounts arising from the purchase of
120
Table of Contents
certain debt securities are treated as a yield adjustment over the estimated useful life of the securities, adjusted for anticipated prepayments using the retrospective interest method. Under this method, the effective yield on a security is estimated. Such estimates are based on the prepayment terms of the security, past actual cash flows, and assumptions as to future expected cash flow. The future cash flow assumptions consider various prepayment assumptions based on historical experience, as well as current market conditions. Periodically, the effective yield is re-estimated to reflect actual prepayments and updated future cash flow assumptions. Upon a re-estimation, a security’s book value is restated at the most recently calculated effective yield, assuming that yield had been in effect since the security was purchased. This treatment results in an increase or decrease to net investment income (accretion of premium or amortization of discount) at the new measurement date.
See Note 4 for additional information regarding investments.
(c) Fair value
Fair value is defined as the price that would be received upon the sale of an asset or paid to transfer a liability in an orderly transaction between willing, able and knowledgeable market participants at the measurement date. Fair value measurements are not adjusted for transaction costs. In addition, a three-tiered hierarchy for inputs is used in management’s determination of fair value of financial instruments that emphasizes the use of observable inputs over the use of unobservable inputs by requiring that the observable inputs be used when available. Observable inputs are market participant assumptions based on market data obtained from sources independent of the reporting entity. Unobservable inputs are the reporting entity’s own assumptions about market participant assumptions based on the best information available under the circumstances. In assessing the appropriateness of using observable inputs in making its fair value determinations, Alleghany considers whether the market for a particular security is “active” or not based on all the relevant facts and circumstances. A market may be considered to be inactive if there are relatively few recent transactions or if there is a significant decrease in market volume. Furthermore, Alleghany considers whether observable transactions are “orderly” or not. Alleghany does not consider a transaction to be orderly if there is evidence of a forced liquidation or other distressed condition, and as such, little or no weight is given to that transaction as an indicator of fair value.
Although Alleghany is responsible for the determination of the fair value of the financial assets and the supporting methodologies and assumptions, it employs third party valuation service providers to gather, analyze and interpret market information and derive fair values based upon relevant methodologies and assumptions for individual instruments. When those providers are unable to obtain sufficient market observable information upon which to estimate the fair value for a particular security, fair value is determined either by requesting a quote, which is generally non-binding, from brokers who are knowledgeable about these securities or by employing widely accepted internal valuation models.
Valuation service providers typically obtain data about market transactions and other key valuation model inputs from multiple sources and, through the use of widely accepted internal valuation models, provide a single fair value measurement for individual securities for which a fair value has been requested under the terms of service agreements. The inputs used by the valuation service providers include, but are not limited to, market prices from recently completed transactions and transactions of comparable securities, interest rate yield curves, credit spreads, currency rates and other market observable information, as applicable. The valuation models take into account, among other things, market observable information as of the measurement date as well as the specific attributes of the security being valued including its term, interest rate, credit rating, industry sector and, when applicable, collateral quality and other issue or issuer specific information. When market transactions or other market observable data is limited, the extent to which judgment is applied in determining fair value is greatly increased.
The three-tiered hierarchy used in management’s determination of fair value is broken down into three levels based on the reliability of inputs as follows:
| • | Level 1: Valuations are based on unadjusted quoted prices in active markets that Alleghany has the ability to access for identical, unrestricted assets and do not involve any meaningful degree of |
121
Table of Contents
| judgment. An active market is defined as a market where transactions for the financial instrument occur with sufficient frequency and volume to provide pricing information on an ongoing basis. Alleghany’s Level 1 assets include publicly traded common stocks and mutual funds (which are included on the balance sheet in equity securities) where Alleghany’s valuations are based on quoted market prices. |
| • | Level 2: Valuations are based on direct and indirect observable inputs other than quoted market prices included in Level 1. Level 2 inputs include quoted prices for similar assets in active markets and inputs other than quoted prices that are observable for the asset, such as the terms of the security and market-based inputs. Terms of the security include coupon, maturity date and any special provisions that may, for example, enable the investor, at its election, to redeem the security prior to its scheduled maturity date. Market-based inputs include interest rates and yield curves that are observable at commonly quoted intervals and current credit rating(s) of the security. Level 2 assets generally include short-term investments and most debt securities. Alleghany’s Level 2 liabilities consist of the senior notes. |
| • | Level 3: Valuations are based on techniques that use significant inputs that are unobservable. The valuation of Level 3 assets requires the greatest degree of judgment. These measurements may be made under circumstances in which there is little, if any, market activity for the asset. Alleghany’s assessment of the significance of a particular input to the fair value measurement in its entirety requires judgment. In making the assessment, Alleghany considers factors specific to the asset. In certain cases, the inputs used to measure fair value may fall into different levels of the fair value hierarchy. In such cases, the level in the fair value hierarchy within which the fair value measurement is classified is determined based on the lowest level input that is significant to the fair value measurement in its entirety. Some Level 3 valuations are based entirely on non-binding broker quotes. These securities consist primarily of mortgage-backed and asset-backed securities where reliable pool and loan level collateral information cannot be reasonably obtained. Assets classified as Level 3 principally include certain residential mortgage-backed securities (“RMBS”), commercial mortgage-backed securities (“CMBS”), other asset-backed securities (primarily, collateralized loan obligations), partnership investments and non-marketable equity investments. |
Mortgage-backed and asset-backed securities are initially valued at the transaction price. Subsequently, Alleghany uses widely accepted valuation practices that produce a fair value measurement by comparison to transactions in similarly structured instruments, use of discounted cash flows or option adjusted spread analyses. Unobservable inputs, significant to the measurement and valuation of mortgage-backed and asset-backed securities, include assumptions about prepayment speed and collateral performance, including default, delinquency and loss severity rates. Significant changes to any one of these inputs, or combination of inputs, could significantly change the fair value measurement for these securities.
The impact of prepayment speeds on fair value is dependent on a number of variables including whether the securities were purchased at a premium or discount. A decrease in interest rates generally increases the assumed rate of prepayments, and an increase in interest rates generally decreases the assumed speed of prepayments. Increased prepayments increase the yield on securities purchased at a discount, and reduce the yield on securities purchased at a premium. In a decreasing prepayment environment, yields on securities purchased at a discount are reduced but are increased for securities purchased at a premium. Changes in default assumptions on underlying collateral are generally accompanied by directionally similar changes in other collateral performance factors, but generally result in a directionally opposite change in prepayment assumptions.
Fair values for partnership and non-marketable equity investments are initially valued at the transaction price. Subsequently, fair value is based on the performance of the portfolio of investments or results of operations of the investee, as derived from their financial statements. Significant improvements or disruptions in the financial markets may result in directionally similar or opposite changes to the portfolio of the investee, depending on how management of the investee
122
Table of Contents
has correlated the portfolio of investments to the market. Also, any changes made by the investee to the investment strategy of the non-marketable equity investments could result in significant changes to fair value that have a positive or negative correlation to the performance observed in the equity markets. For those investments whose performance is based on the results of operations within a specific industry, significant events impacting that industry could materially impact fair value. Also, decisions and changes to strategy made by management of the investee could result in positive or negative outcomes, which could significantly impact the results of operations of the investee and subsequently fair value.
Alleghany employs specific control processes to determine the reasonableness of the fair values of its financial assets and liabilities. Alleghany’s processes are designed to ensure that the values received or internally estimated are accurately recorded and that the data inputs and the valuation techniques used are appropriate, consistently applied, and that the assumptions are reasonable and consistent with the objective of determining fair value. Alleghany assesses the reasonableness of individual security values received from valuation service providers through various analytical techniques. In addition, Alleghany validates the reasonableness of fair values by comparing information obtained from Alleghany’s valuation service providers to other third party valuation sources for selected securities. Alleghany also validates prices obtained from brokers for selected securities through reviews by those who have relevant expertise and who are independent of those charged with executing investing transactions.
In addition to such procedures, Alleghany reviews the reasonableness of its classification of securities within the three-tiered hierarchy to ensure that the classification is consistent with GAAP.
See Note 3 for additional information regarding fair value.
(d) Cash
Cash includes all deposit balances with a bank that are available for immediate withdrawal, whether interest-bearing or non-interest bearing.
(e) Premiums and Unearned Premiums
Premiums are recognized as revenue on a pro rata basis over the term of an insurance policy. Assumed reinsurance premiums written and earned are based on reports received from ceding companies for pro rata treaty contracts and are generally recorded as written based on contract terms for excess-of-loss treaty contracts. Premiums are earned ratably over the terms of the related coverages.
Unearned premiums and ceded unearned premiums represent the portion of gross premiums written and ceded premiums written, respectively, relating to the unexpired terms of such coverages. Assumed reinsurance premiums written and earned, along with related costs, for which data has not been reported by the ceding companies, are estimated based on historical patterns and other relevant information. These estimates may change when actual data for such estimated items becomes available.
Premium balances receivable are reported net of an allowance for estimated uncollectible premium amounts. Such allowance is based upon an ongoing review of amounts outstanding, length of collection periods, the creditworthiness of the insured and other relevant factors. Amounts deemed to be uncollectible are written off against the allowance.
(f) Reinsurance Ceded
Reinsurance is used to mitigate the exposure to losses, manage capacity and protect capital resources. Reinsuring loss exposures does not relieve a ceding entity from its obligations to policyholders and cedants. Reinsurance recoverables (including amounts related to claims incurred but not reported) and ceded unearned premiums are reported as assets. To minimize exposure to losses from a reinsurer’s inability to pay, the financial condition of such reinsurer is evaluated initially upon placement of the reinsurance and periodically thereafter. In addition to considering the financial condition of a reinsurer, the collectability of the reinsurance recoverables is
123
Table of Contents
evaluated (and where appropriate, whether an allowance for estimated uncollectible reinsurance recoverables is to be established) based upon a number of other factors. Such factors include the amounts outstanding, length of collection periods, disputes, any collateral or letters of credit held and other relevant factors. To the extent that an allowance for uncollectible reinsurance recoverable is established, amounts deemed to be uncollectible are written off against the allowance for estimated uncollectible reinsurance recoverables. Alleghany currently has no allowance for uncollectible reinsurance recoverables.
See Note 5 for additional information on reinsurance ceded.
Ceded premiums written are recorded in accordance with the applicable terms of the various reinsurance contracts and ceded premiums earned are charged against revenue over the period of the various reinsurance contracts. This also generally applies to reinstatement premiums paid to a reinsurer, which arise when contractually-specified ceded loss triggers have been breached. Ceded commissions reduce commissions, brokerage and other underwriting expenses and ceded losses incurred reduce net loss and loss adjustment expense (“LAE”) incurred over the applicable periods of the various reinsurance contracts with third party reinsurers. If premiums or commissions are subject to adjustment (for example, retrospectively-rated or experience-rated), the estimated ultimate premium or commission is recognized over the period of the contract.
Amounts recoverable from reinsurers are estimated in a manner consistent with the claim liability associated with the reinsured business and consistent with the terms of the underlying reinsurance contract.
(g) Deferred Acquisition Costs
Acquisition costs related to unearned premiums that vary with, and are directly related to, the production of such premiums are deferred. Furthermore, such deferred costs: (i) represent only incremental, direct costs associated with the successful acquisition of a new or renewal insurance or reinsurance contract; (ii) are essential to the contract transaction; (iii) would not have been incurred had the contract transaction not occurred; and (iv) are related directly to the acquisition activities involving underwriting, policy issuance and processing. Acquisition costs principally relate to commissions. To a lesser extent, acquisition costs can include premium taxes and certain qualifying underwriting expenses. For insurance policies written, acquisition costs are generally incurred directly, and include commissions, premium taxes and certain qualifying underwriting expenses. For reinsurance contracts written, acquisition costs are generally incurred through brokerage commissions and indirectly through ceding commissions, which are deferred. Deferred acquisition costs are amortized to expense as the related premiums are earned, generally over a period of one year. Deferred acquisition costs are reviewed at least annually to determine their recoverability from future income, including investment income. If any such costs are determined not to be recoverable they are charged to expense.
Anticipated net loss and LAE and estimated remaining costs of servicing the contracts are considered when evaluating recoverability of deferred acquisition costs.
(h) Property and Equipment
Property and equipment is carried at cost, net of accumulated depreciation and amortization. Depreciation of buildings and equipment is principally calculated using the straight-line method over the estimated useful life of the respective assets. Estimated useful lives for such assets range from three to 20 years. Amortization of leasehold improvements is principally calculated using the straight-line method over the estimated useful life of the leasehold improvement or the life of the lease, whichever is less. Rental expense on operating leases is recorded on a straight-line basis over the term of the lease, regardless of the timing of actual lease payments.
(i) Goodwill and Other Intangible Assets
Goodwill and other intangible assets, net of amortization, are recorded as a consequence of business acquisitions. Goodwill represents the excess, if any, of the amount paid to acquire subsidiaries and other businesses over the fair value of their net assets as of the date of acquisition. Other intangible assets are recorded at their fair value as of the acquisition date. A significant amount of judgment is needed to determine the fair values as of the date of acquisition of other intangible assets and the net assets acquired in a business acquisition.
124
Table of Contents
The determination of the fair value of other intangible assets and net assets often involves the use of valuation models and other estimates, which involve many assumptions and variables and are inherently subjective. Other intangible assets that are not deemed to have an indefinite useful life are amortized over their estimated useful lives. Goodwill and those intangible assets that have an indefinite useful life are not subject to amortization.
Goodwill and other intangible assets deemed to have an indefinite useful life are tested annually in the fourth quarter of every year for impairment. Goodwill and other intangible assets are also tested whenever events and changes in circumstances suggest that the carrying amount may not be recoverable. A significant amount of judgment is required in performing goodwill and other intangible asset impairment tests. These tests may include estimating the fair value of Alleghany’s operating subsidiaries and other intangible assets. If it is determined that an asset has been impaired, the asset is written down by the amount of the impairment, with a corresponding charge to net earnings. Subsequent reversal of any impairment charge is not permitted.
With respect to goodwill, a qualitative assessment is first made to determine whether it is necessary to perform quantitative testing. This initial assessment includes, among other factors, consideration of: (i) past, current and projected future earnings and equity; (ii) recent trends and market conditions; and (iii) valuation metrics involving similar companies that are publicly-traded and acquisitions of similar companies, if available. If this initial qualitative assessment indicates that the fair value of an operating subsidiary may be less than its respective carrying amount, a second step is taken, involving a comparison between the estimated fair values of the operating subsidiary with its respective carrying amount including goodwill. Under GAAP, fair value refers to the amount for which the entire operating subsidiary may be bought or sold. The methods for estimating operating subsidiary values include asset and liability fair values and other valuation techniques, such as discounted cash flows and multiples of earnings or revenues. All of these methods involve significant estimates and assumptions. If the carrying value exceeds estimated fair value, there is an indication of potential impairment, and a third step is performed to measure the amount of impairment. The third step involves calculating an implied fair value of goodwill by measuring the excess of the estimated fair value of the operating subsidiary over the aggregate estimated fair values of the individual assets less liabilities. If the carrying value of goodwill exceeds the implied fair value of goodwill, an impairment charge is recorded for the excess.
See Note 2 for additional information on goodwill and other intangible assets.
(j) Income Taxes
Alleghany files a consolidated federal income tax return with its subsidiaries. Following the TransRe Acquisition Date, Alleghany’s consolidated federal income tax return includes as part of its taxable income those items of income of non-U.S. subsidiaries that are subject to U.S. income tax currently, pursuant to Subpart F income rules of the Internal Revenue Code. Deferred tax assets and liabilities are recognized for the future tax consequences attributable to differences between the financial statement carrying amount of existing assets and liabilities and their respective tax bases and operating loss and tax credit carry-forwards. Deferred tax assets and liabilities are measured using enacted tax rates expected to apply to taxable income in the years in which those temporary differences are expected to be recovered or settled. The effect on deferred tax assets and liabilities of a change in tax rates is recognized in income in the period that includes the enactment date. Current tax liabilities or assets are recognized for the estimated taxes payable or refundable on tax returns for the current year.
A valuation allowance is provided when it is more likely than not that some portion of the deferred tax assets will not be realized. This determination is based upon a review of all available evidence, both positive and negative, including Alleghany’s earnings history, the timing, character and amount of future earnings potential, the reversal of taxable temporary differences and the tax planning strategies available.
See Note 9 for additional information on income taxes.
(k) Loss Reserves
The reserves for loss and LAE represent management’s best estimate of the ultimate cost of all reported and unreported losses incurred through the balance sheet date.
125
Table of Contents
The reserves for loss and LAE include but are not limited to: (i) reports and individual case estimates received from ceding companies with respect to assumed reinsurance business; (ii) the accumulation of individual estimates for claims reported with respect to direct insurance business; (iii) estimates for incurred but not reported claims based on past experience, modified for current trends and industry data; and (iv) estimates of expenses for investigating and settling claims based on past experience. The methods used to determine such estimates and to establish the resulting reserves are continually reviewed and updated. Any adjustments are reflected in current income. Net loss and LAE incurred consists of the estimated ultimate cost of settling claims incurred within the reporting period (net of related reinsurance recoverable), including IBNR claims, plus changes in estimates of prior period losses.
The process of estimating these reserves is inherently difficult and involves a considerable degree of judgment, especially in view of changing legal and economic environments that impact the development of loss reserves. Therefore, quantitative techniques have to be supplemented by subjective considerations and managerial judgment. In addition, trends that have affected development of liabilities in the past may not necessarily occur or affect liability development to the same degree in the future.
While the reserving process is difficult for the insurance business, the inherent uncertainties of estimating loss reserves are even greater for the reinsurance business, due primarily to the longer-term nature of much of the reinsurance business, the diversity of development patterns among different types of reinsurance contracts, the necessary reliance on the ceding companies for information regarding reported claims, and differing reserving practices among ceding companies, which may change without notice. TransRe writes a significant amount of non-proportional assumed casualty reinsurance as well as proportional assumed reinsurance of excess liability business for classes such as medical malpractice, directors’ and officers’ liability, errors and omissions liability and general liability. Claims from such classes can exhibit greater volatility over time than most other classes due to their low frequency, high severity nature and loss cost trends that are more difficult to predict. Net loss and LAE also include amounts for risks relating to asbestos-related illness and environmental impairment.
See Notes 6 and 12(d) for additional information on loss reserves.
(l) Earnings Per Share of Common Stock Attributable to Alleghany Stockholders
Basic earnings per share of common stock is based on the average number of shares of common stock, par value $1.00 per share, of Alleghany (“Common Stock”) outstanding during the period, retroactively adjusted for stock dividends where applicable. Diluted earnings per share of Common Stock are based on those shares used to calculate basic earnings per share of Common Stock plus the dilutive effect of stock-based compensation awards, retroactively adjusted for stock dividends where applicable.
See Note 11 for additional information on earnings per share.
(m) Stock-Based Compensation Plans
The cost resulting from all stock-based compensation transactions is recognized in the financial statements, with fair value as the measurement objective in accounting for stock-based compensation arrangements. The fair value-based measurement method applies in accounting for stock-based compensation transactions with employees. Non-employee directors are treated as employees for accounting purposes.
(n) Senior Notes
Debt consists of senior notes issued by Alleghany (the “Alleghany Senior Notes”) and senior notes issued by TransRe (the “TransRe Senior Notes,” and collectively with the Alleghany Senior Notes, the “Senior Notes”). The Senior Notes are carried at unpaid principal balance including any unamortized premium or discount.
See Note 8 for additional information on the Senior Notes.
126
Table of Contents
(o) Currency Translation
Assets and liabilities denominated in foreign currencies are translated into U.S. dollars at period-end exchange rates. Income and expense accounts are translated at average exchange rates for the year. The resulting unrealized currency translation gain or loss for functional currencies is recorded, net of tax, in accumulated other comprehensive income, a component of stockholders’ equity.
Transaction gains and losses on assets and liabilities denominated in foreign currencies are recorded as a component of net realized capital gains during the period in which they occur.
(p) Reclassification
Certain prior year amounts have been reclassified to conform to the 2014 presentation of the financial statements.
(q) Recent Accounting Standards
Future Application of Accounting Standards
In April 2014, the Financial Accounting Standards Board (the “FASB”) issued guidance that changed the criteria for reporting discontinued operations. Under the new guidance, only disposals that represent a strategic shift in operations qualify as discontinued operations. In addition, the new guidance requires expanded disclosures about discontinued operations. This guidance is effective in the first quarter of 2015. Alleghany will adopt this guidance in the first quarter of 2015, and Alleghany does not currently believe that the implementation will have an impact on its results of operations and financial condition.
In May 2014, the FASB, together with the International Accounting Standards Board, issued guidance on the recognition of revenue from contracts with customers. Under the new guidance, revenue is recognized as the transfer of goods and services to customers takes place, and in amounts that reflect the payment or payments that are expected to be received from the customers for those goods and services. The new guidance also requires new disclosures about revenue. Insurance- and reinsurance-related revenues are not impacted by this guidance. This guidance is effective in the first quarter of 2017 for public entities, with earlier adoption not permitted. Alleghany will adopt this guidance in the first quarter of 2017, and Alleghany does not currently believe that the implementation will have a material impact on its results of operations and financial condition.
2. Merger with TransRe
(a) Overview
On November 20, 2011, Alleghany entered into an Agreement and Plan of Merger (the “Merger Agreement”) with its wholly-owned subsidiary Shoreline Merger Sub, LLC (subsequently converted into a corporation) (“Merger Sub”), and Transatlantic Holdings, Inc. (“Old TransRe”). On the TransRe Acquisition Date, Old TransRe was merged with and into Merger Sub, which was renamed “Transatlantic Holdings, Inc.,” and became a wholly-owned subsidiary of Alleghany.
Pursuant to the terms of the Merger Agreement, on the TransRe Acquisition Date, stockholders of Old TransRe were entitled to receive, in exchange for each share of Old TransRe common stock held, either shares of Common Stock or cash consideration with a value equal to approximately $61.14 (the “Per Share Consideration”), which was the sum of (i) 0.145 multiplied by the average of the closing sales prices on the New York Stock Exchange for Common Stock during the five trading days ending the day before the TransRe Acquisition Date (the “Average Closing Price”) and (ii) $14.22, as more fully described in the Merger Agreement. In total, Alleghany paid to the stockholders of Old TransRe consideration of approximately $3.5 billion, consisting of cash consideration of $816.0 million and stock consideration of 8,360,959 shares of Common Stock. The stock consideration was tax free to Old TransRe stockholders.
Following the TransRe Acquisition Date, the Alleghany Board of Directors consisted of all 11 members from its pre-merger Board of Directors and three additional members (the “Continuing Directors”) who had served on the Board of Directors of Old TransRe.
127
Table of Contents
Alleghany incurred due diligence, legal, investment banking and other merger-related costs (“Transaction Costs”) of $33.8 million in 2012, including $18.0 million payable to Alleghany’s investment bankers, in connection with the merger. Transaction Costs are reported as a component of corporate administration expense.
The merger was accounted for using the acquisition method of accounting. Based on the relative voting interests of Alleghany stockholders (approximately 51 percent) and Old TransRe stockholders (approximately 49 percent) in Alleghany post-merger, the composition of Alleghany’s Board of Directors and senior management after the merger and other factors, it was determined that Alleghany was the acquiring entity for accounting purposes. Under the acquisition method of accounting, the assets, liabilities and commitments of TransRe were adjusted to their fair values on the TransRe Acquisition Date. Significant judgment was required to arrive at estimates of fair values.
The excess of the fair value of the net assets acquired over the purchase price was recorded as a gain on bargain purchase of $494.9 million and is shown as a separate component of revenues in the statement of earnings for 2012. The gain on bargain purchase determination is consistent with the fact that prior to the merger, Old TransRe’s shares of common stock, similar to shares of certain other reinsurance and insurance companies, traded at a discount to book value per common share.
(b) Purchase Price
Alleghany’s total purchase price for Old TransRe as of the TransRe Acquisition Date is calculated in accordance with GAAP as follows (in millions, except per share amounts):
| Shares of Old TransRe common stock outstanding as of the TransRe Acquisition Date |
57.6 | |||||||
| Multiplied by per share exchange ratio of 0.145 shares of Common Stock per share of Old TransRe common stock |
0.145 | |||||||
|
|
|
|||||||
| Shares of Common Stock issued |
8.4 | |||||||
| Multiplied by the Acquisition Date closing price per share of Common Stock(1) |
$ | 322.50 | ||||||
|
|
|
|||||||
| Portion of purchase price based on shares of Common Stock issued |
$ | 2,696.4 | ||||||
| Shares of Old TransRe common stock outstanding as of the TransRe Acquisition Date |
57.6 | |||||||
| Adjustment to Old TransRe common stock(2) |
(0.2 | ) | ||||||
|
|
|
|||||||
| Old TransRe common stock, as adjusted |
57.4 | |||||||
| Multiplied by cash price per share component |
$ | 14.22 | ||||||
|
|
|
|||||||
| Portion of purchase price based on cash consideration |
816.0 | |||||||
|
|
|
|||||||
| Total purchase price |
$ | 3,512.4 | ||||||
|
|
|
|||||||
| (1) | As noted previously, the Merger Agreement determined aggregate consideration paid based on the Average Closing Price. For GAAP purposes, the purchase price is determined based on the closing price of the Common Stock as of the TransRe Acquisition Date. |
| (2) | The $816.0 million cash consideration was fixed as of the date of the Merger Agreement, predicated on the 57.4 million shares of common stock of Old TransRe outstanding at that date multiplied by $14.22 per share. Therefore, the additional 0.2 million of Old TransRe shares outstanding as of the TransRe Acquisition Date do not cause the cash consideration to increase and are adjusted for in this presentation. |
128
Table of Contents
(c) Fair Value of Net Assets Acquired and Gain on Bargain Purchase
The total fair value of net assets acquired and the gain on bargain purchase as of the TransRe Acquisition Date are calculated as follows (in millions):
| Net book value of net assets acquired prior to fair value adjustments |
$ | 4,062.7 | ||
| Adjustments for fair value, by applicable balance sheet caption: |
||||
| Assets: |
||||
| Deferred acquisition costs |
(250.7 | ) | ||
| Intangible assets |
323.5 | |||
| Net deferred tax assets |
21.5 | |||
| All other assets |
(25.3 | ) | ||
| Liabilities: |
||||
| TransRe Senior Notes |
(124.4 | ) | ||
|
|
|
|||
| Fair value of net assets acquired |
4,007.3 | |||
| Less purchase price |
(3,512.4 | ) | ||
|
|
|
|||
| Gain on bargain purchase (before all Transaction Costs) |
$ | 494.9 | ||
|
|
|
Pursuant to the terms of the Merger Agreement, each outstanding stock option to acquire Old TransRe common stock was converted into the right to receive a cash payment based on its Black-Scholes value on the TransRe Acquisition Date based on assumptions set forth in the Merger Agreement. As of the TransRe Acquisition Date, the value of the Old TransRe stock options was determined to be $11.1 million, which was paid in March 2012.
Pursuant to the terms of the Merger Agreement, each outstanding Old TransRe restricted stock unit (including performance-based Old TransRe restricted stock units) held by current or former employees or non-employee directors of Old TransRe was converted into the right to receive a cash payment in an amount equal to the Per Share Consideration, with the same terms and conditions as were applicable under such restricted stock unit prior to its conversion, that was: (i) deemed notionally invested in the equity of TransRe, referred to as “book value units;” (ii) with respect to the Continuing Directors, deemed notionally invested in Common Stock; or (iii) maintained in a cash account while continuing to vest on the existing vesting schedule. As of the TransRe Acquisition Date, the value of the Old TransRe restricted stock units was determined to be $49.5 million, none of which remain outstanding as of December 31, 2014.
Prior to the TransRe Acquisition Date, Old TransRe established a liability for its stock option and restricted stock awards that was previously accounted for as equity, and this liability is reflected in the net book value of net assets acquired prior to fair value adjustments.
An explanation of the adjustments for fair value is as follows:
| • | Deferred acquisition costs — Elimination of TransRe’s deferred acquisition costs asset. |
| • | Intangible assets — Establish fair value of intangible assets related to TransRe (see below for additional detail). |
| • | Net deferred tax assets — Adjustment to deferred tax assets, net, related to fair value adjustments. See Note 9 for additional information on net deferred tax assets. |
| • | All other assets — Elimination of TransRe’s carried goodwill, deferred debt issuance costs, allowance for doubtful accounts and the recording of fair value adjustments to other asset categories. |
| • | TransRe Senior Notes — Adjustments of the TransRe Senior Notes to their estimated fair value based on prevailing interest rates and other factors as of the TransRe Acquisition Date. See Note 8(b) for additional information on the TransRe Senior Notes. |
129
Table of Contents
The net intangible assets (liabilities) included in “intangible assets” in the table above consist of the following:
| Amount | Economic Useful Life | |||||
| (in millions) | ||||||
| Value of business in-force |
$ | 291.4 | One Year | |||
| Loss and LAE reserves |
(98.8 | ) | 15 years | |||
| State and foreign insurance licenses |
19.0 | Indefinite | ||||
| Trade name |
50.0 | Indefinite | ||||
| Renewal rights |
44.0 | 14 years | ||||
| Leases |
(28.1 | ) | 10 years | |||
| Gain contingency on dispute previously in arbitration |
36.0 | As settled | ||||
| Internally-developed software |
10.0 | 2.5 years | ||||
|
|
|
|||||
| Net intangible assets, before amortization, as of the TransRe Acquisition Date |
$ | 323.5 | ||||
|
|
|
|||||
An explanation of the intangible assets and related future amortization is as follows:
| • | Value of business in-force — Intangible asset resulting from the adjustment of unearned premiums to the estimated fair value of profit within TransRe’s unearned premiums as of the TransRe Acquisition Date, adjusted for a risk factor. This will be amortized as the contracts for business in-force as of the TransRe Acquisition Date expire. |
| • | Loss and LAE reserves — Adjustment resulting from the difference between the estimated fair value and the historical carrying value of TransRe’s unpaid loss and LAE, net of related reinsurance recoverable, as of the TransRe Acquisition Date. The estimated fair value consists of the present value of the net loss reserves plus a risk premium. This will be amortized over the estimated payout pattern of net reserves as of the TransRe Acquisition Date. |
| • | State and foreign insurance licenses — Addition of the estimated fair value of identifiable intangible assets resulting from the merger arising from the ability to write reinsurance in all 50 U.S. states and the District of Columbia and various foreign jurisdictions. |
| • | Trade name — Addition of the estimated fair value of identifiable intangible assets resulting from the merger arising from trade names and trademarks used by TransRe in conducting its business worldwide. |
| • | Renewal rights — Addition of the estimated fair value of identifiable intangible assets resulting from the merger arising from renewal rights. This will be amortized over the net earnings pattern of renewed reinsurance contracts, estimated as of the TransRe Acquisition Date. |
| • | Leases — Adjustment resulting from the difference between the estimated fair value of TransRe’s operating leases for its office space and its operating lease commitments, as of the TransRe Acquisition Date. This will be amortized on a straight-line basis over the future remaining terms of the operating leases as of the TransRe Acquisition Date. |
| • | Gain contingency on dispute previously in arbitration — Estimated minimum recovery, net of estimated legal costs, from a dispute between TransRe and American International Group, Inc. (“AIG”) previously in arbitration, which was subsequently settled in the third quarter of 2012. See Note 12(a) for additional information on the AIG dispute previously in arbitration. |
| • | Internally-developed software — Addition of the estimated fair value of identifiable intangible assets resulting from the merger arising from internally-developed software. This will be amortized on a straight-line basis over its economic useful life. |
130
Table of Contents
(d) Financial Results
The following information summarizes the results of TransRe from the TransRe Acquisition Date to December 31, 2012 that have been included within Alleghany’s Consolidated Statements of Earnings and Comprehensive Income:
| For the Period from March 6, 2012 to December 31, 2012 |
||||
| (in millions) | ||||
| Revenues |
||||
| Net premiums earned |
$ | 2,915.9 | ||
| Net investment income |
222.0 | |||
| Net realized capital gains |
10.3 | |||
| Other than temporary impairment losses |
— | |||
| Gain on bargain purchase |
— | |||
| Other income |
25.5 | |||
|
|
|
|||
| Total revenues |
3,173.7 | |||
|
|
|
|||
| Costs and Expenses |
||||
| Net loss and loss adjustment expenses |
2,058.1 | |||
| Commissions, brokerage and other underwriting expenses |
591.1 | |||
| Other operating expenses |
67.9 | |||
| Corporate administration |
— | |||
| Amortization of intangible assets |
249.9 | |||
| Interest expense |
40.5 | |||
|
|
|
|||
| Total costs and expenses |
3,007.5 | |||
|
|
|
|||
| Earnings before income taxes |
166.2 | |||
| Income taxes |
2.4 | |||
|
|
|
|||
| Net earnings |
$ | 163.8 | ||
|
|
|
|||
(e) Supplemental Pro Forma Information
TransRe’s results have been included in Alleghany’s Consolidated Financial Statements starting from the TransRe Acquisition Date. The following pro forma financial information for the year ended December 31, 2012 is presented for informational purposes only and is not necessarily indicative of the results that would have occurred had the merger been consummated at the beginning of 2012. Significant assumptions used to determine pro forma results include amortization of intangible assets related to the merger and the assumption that Alleghany’s acquisition of TransRe occurred on January 1, 2012 (the “Pro Forma TransRe Acquisition Date”). Transaction Costs and gain on bargain purchase that are included in Alleghany’s financial statements have not been included in the unaudited pro forma consolidated information. The table presents unaudited pro forma consolidated information for the year ended December 31, 2012:
| Pro Forma for the Year Ended 2012 |
||||
| (in millions, except per share data) |
||||
| Total revenues(1) |
$ | 5,043.4 | ||
| Net earnings (losses)(1)(2) |
270.0 | |||
| Basic earnings per share attributable to Alleghany stockholders |
$ | 17.48 | ||
| (1) | Among other adjustments, reflects an increase in amortization expense on TransRe’s AFS debt securities resulting from the adjustment of amortized cost to their fair value as of the Pro Forma TransRe Acquisition Date. Such adjustment reduced the net investment income of TransRe. |
131
Table of Contents
| (2) | Among other adjustments, reflects adjustments to amortization expense on the TransRe Senior Notes resulting from the adjustment to their fair value as of the Pro Forma TransRe Acquisition Date. Such adjustment reduced the interest expense of TransRe. See Note 8(b) for additional information on the TransRe Senior Notes. Also reflects adjustments to amortization expense associated with intangible assets arising from the merger. |
The pro forma results include TransRe’s pre-tax catastrophe losses, net of reinsurance and reinstatement premiums, of $304.4 million in 2012. Of the $304.4 million of catastrophe losses incurred in 2012, $53.7 million was incurred by Old TransRe prior to the TransRe Acquisition Date and is not included in Alleghany’s GAAP net earnings for 2012. In addition, TransRe recorded pre-tax losses and LAE of $19.0 million in 2012 related to the capsizing of the luxury liner, Costa Concordia, off the coast of Italy, of which $15.8 million was incurred by Old TransRe prior to the TransRe Acquisition Date and is not included in Alleghany’s GAAP net earnings for 2012.
The pro forma results include RSUI’s pre-tax catastrophe losses, net of reinsurance and reinstatement premiums, of $197.9 million in 2012.
(f) Goodwill and Intangible Assets
The amount of goodwill and intangible assets, net of accumulated amortization expense, reported on Alleghany’s consolidated balance sheets as of December 31, 2014 and 2013 is as follows:
| December 31, 2014 | December 31, 2013 | |||||||||||||||||||||||
| Gross Carrying Value |
Accumulated Amortization |
Net Carrying Value(1) |
Gross Carrying Value |
Accumulated Amortization |
Net Carrying Value(1) |
|||||||||||||||||||
| (in millions) | ||||||||||||||||||||||||
| Insurance Segment(2) - Goodwill |
$ | 49.0 | $ | — | $ | 49.0 | $ | 49.0 | $ | — | $ | 49.0 | ||||||||||||
| Insurance Segment - Intangible assets: |
||||||||||||||||||||||||
| Agency relationships |
17.9 | 8.2 | 9.7 | 17.9 | 7.5 | 10.4 | ||||||||||||||||||
| State insurance licenses |
25.8 | — | 25.8 | 25.8 | — | 25.8 | ||||||||||||||||||
| Trade name |
35.5 | — | 35.5 | 35.5 | — | 35.5 | ||||||||||||||||||
| Brokerage and reinsurance relationships |
33.8 | 25.9 | 7.9 | 33.8 | 23.7 | 10.1 | ||||||||||||||||||
| Renewal rights |
24.2 | 24.0 | 0.2 | 24.2 | 23.9 | 0.3 | ||||||||||||||||||
| Other |
4.1 | 4.1 | — | 4.1 | 4.1 | — | ||||||||||||||||||
|
|
|
|
|
|
|
|
|
|
|
|
|
|||||||||||||
| Total insurance segment intangibles |
141.3 | 62.2 | 79.1 | 141.3 | 59.2 | 82.1 | ||||||||||||||||||
|
|
|
|
|
|
|
|
|
|
|
|
|
|||||||||||||
| Total insurance segment goodwill and other intangibles |
$ | 190.3 | $ | 62.2 | $ | 128.1 | $ | 190.3 | $ | 59.2 | $ | 131.1 | ||||||||||||
|
|
|
|
|
|
|
|
|
|
|
|
|
|||||||||||||
| Reinsurance Segment(2) - Intangible assets: |
||||||||||||||||||||||||
| Value of business in-force |
$ | 291.4 | $ | 291.4 | $ | — | $ | 291.4 | $ | 290.5 | $ | 0.9 | ||||||||||||
| Loss and LAE reserves |
(98.8 | ) | (55.4 | ) | (43.4 | ) | (98.8 | ) | (41.3 | ) | (57.5 | ) | ||||||||||||
| State and foreign insurance licenses |
19.0 | — | 19.0 | 19.0 | — | 19.0 | ||||||||||||||||||
| Trade name |
50.0 | — | 50.0 | 50.0 | — | 50.0 | ||||||||||||||||||
| Renewal rights |
44.0 | 9.2 | 34.8 | 44.0 | 5.2 | 38.8 | ||||||||||||||||||
| Leases |
(28.1 | ) | (8.0 | ) | (20.1 | ) | (28.1 | ) | (5.2 | ) | (22.9 | ) | ||||||||||||
| Internally-developed software |
10.0 | 10.0 | — | 10.0 | 7.3 | 2.7 | ||||||||||||||||||
|
|
|
|
|
|
|
|
|
|
|
|
|
|||||||||||||
| Total reinsurance segment intangibles |
$ | 287.5 | $ | 247.2 | $ | 40.3 | $ | 287.5 | $ | 256.5 | $ | 31.0 | ||||||||||||
|
|
|
|
|
|
|
|
|
|
|
|
|
|||||||||||||
132
Table of Contents
| December 31, 2014 | December 31, 2013 | |||||||||||||||||||||||
| Gross Carrying Value |
Accumulated Amortization |
Net Carrying Value(1) |
Gross Carrying Value |
Accumulated Amortization |
Net Carrying Value(1) |
|||||||||||||||||||
| (in millions) | ||||||||||||||||||||||||
| Corporate Activities(2)(3) - Goodwill |
$ | 62.9 | $ | — | $ | 62.9 | $ | 50.7 | $ | — | $ | 50.7 | ||||||||||||
| Corporate Activities(3) - Intangible assets: |
||||||||||||||||||||||||
| Trade name |
11.0 | — | 11.0 | 11.0 | — | 11.0 | ||||||||||||||||||
| Other |
3.6 | 0.6 | 3.0 | 3.4 | 0.2 | 3.2 | ||||||||||||||||||
|
|
|
|
|
|
|
|
|
|
|
|
|
|||||||||||||
| Total corporate activities intangibles |
14.6 | 0.6 | 14.0 | 14.4 | 0.2 | 14.2 | ||||||||||||||||||
|
|
|
|
|
|
|
|
|
|
|
|
|
|||||||||||||
| Total corporate activities goodwill and other intangibles |
$ | 77.5 | $ | 0.6 | $ | 76.9 | $ | 65.1 | $ | 0.2 | $ | 64.9 | ||||||||||||
|
|
|
|
|
|
|
|
|
|
|
|
|
|||||||||||||
| Alleghany consolidated goodwill and other intangibles |
$ | 555.3 | $ | 310.0 | $ | 245.3 | $ | 542.9 | $ | 315.9 | $ | 227.0 | ||||||||||||
|
|
|
|
|
|
|
|
|
|
|
|
|
|||||||||||||
| (1) | Goodwill and intangible assets have been reduced by amounts written-down in prior periods. The 2013 insurance segment intangible assets reflect a $5.0 million non-cash impairment charge recorded in 2013 for certain finite-lived intangible assets at CapSpecialty. |
| (2) | See Note 13 for additional information on Alleghany’s segments of business. |
| (3) | Primarily represents goodwill and other intangible assets related to the acquisition of Bourn & Koch on April 26, 2012, which was purchased for $55.0 million, including estimated contingent consideration of $8.0 million based on future profitability, and to the acquisition of a controlling equity interest in Kentucky Trailer on August 30, 2013 for $24.9 million. On January 2, 2014, for an additional investment of $15.0 million, Alleghany exercised its option to increase its common equity interest in Kentucky Trailer to 80 percent, and to increase its preferred equity interest by $1.6 million to $15.9 million. Also includes minor acquisitions made by ACC’s subsidiaries. |
The economic useful lives of intangible assets are as follows: agency relationships — 15 years; state and foreign insurance licenses — indefinite; trade names — indefinite; brokerage and reinsurance relationships — 15 years; renewal rights — between five and 14 years; value of business-in-force — one year; loss and LAE reserves — 15 years; leases — 10 years; and internally developed software — 2.5 years.
3. Fair Value of Financial Instruments
The carrying values and estimated fair values of Alleghany’s consolidated financial instruments as of December 31, 2014 and 2013 were as follows:
| December 31, 2014 | December 31, 2013 | |||||||||||||||
| Carrying Value |
Fair Value | Carrying Value |
Fair Value | |||||||||||||
| (in millions) | ||||||||||||||||
| Assets |
||||||||||||||||
| Investments (excluding equity method investments)(1) |
$ | 18,153.8 | $ | 18,153.8 | $ | 18,632.2 | $ | 18,632.2 | ||||||||
| Liabilities |
||||||||||||||||
| Senior Notes(2) |
$ | 1,767.1 | $ | 1,948.6 | $ | 1,794.4 | $ | 1,887.7 | ||||||||
| (1) | This table includes AFS investments (debt and equity securities as well as partnership and non-marketable equity investments carried at fair value that are included in other invested assets). This table excludes investments accounted for using the equity method and certain loans receivable that are carried at cost, all of which are included in other invested assets. The fair value of short-term investments approximates amortized cost. The fair value of all other categories of investments is discussed in Note 1(c). |
| (2) | See Note 8 for additional information on the Senior Notes. |
133
Table of Contents
Alleghany’s financial instruments measured at fair value and the level of the fair value hierarchy of inputs used as of December 31, 2014 and 2013 were as follows:
| Level 1 | Level 2 | Level 3 | Total | |||||||||||||
| (in millions) | ||||||||||||||||
| As of December 31, 2014 |
||||||||||||||||
| Equity securities: |
||||||||||||||||
| Common stock |
$ | 2,805.3 | $ | 10.2 | $ | — | $ | 2,815.5 | ||||||||
| Preferred stock |
— | — | — | — | ||||||||||||
|
|
|
|
|
|
|
|
|
|||||||||
| Total equity securities |
2,805.3 | 10.2 | — | 2,815.5 | ||||||||||||
|
|
|
|
|
|
|
|
|
|||||||||
| Debt securities: |
||||||||||||||||
| U.S. Government obligations |
— | 541.1 | — | 541.1 | ||||||||||||
| Municipal bonds |
— | 5,197.5 | — | 5,197.5 | ||||||||||||
| Foreign government obligations |
— | 900.4 | — | 900.4 | ||||||||||||
| U.S. corporate bonds |
— | 2,118.1 | 36.7 | 2,154.8 | ||||||||||||
| Foreign corporate bonds |
— | 1,497.7 | 6.0 | 1,503.7 | ||||||||||||
| Mortgage and asset-backed securities: |
||||||||||||||||
| RMBS(1) |
— | 1,637.7 | 18.2 | 1,655.9 | ||||||||||||
| CMBS |
— | 1,102.0 | 23.3 | 1,125.3 | ||||||||||||
| Other asset-backed securities(2) |
— | 586.8 | 933.1 | 1,519.9 | ||||||||||||
|
|
|
|
|
|
|
|
|
|||||||||
| Total debt securities |
— | 13,581.3 | 1,017.3 | 14,598.6 | ||||||||||||
| Short-term investments |
— | 715.6 | — | 715.6 | ||||||||||||
| Other invested assets(3) |
— | — | 24.1 | 24.1 | ||||||||||||
|
|
|
|
|
|
|
|
|
|||||||||
| Total investments (excluding equity method investments) |
$ | 2,805.3 | $ | 14,307.1 | $ | 1,041.4 | $ | 18,153.8 | ||||||||
|
|
|
|
|
|
|
|
|
|||||||||
| Senior Notes |
$ | — | $ | 1,948.6 | $ | — | $ | 1,948.6 | ||||||||
|
|
|
|
|
|
|
|
|
|||||||||
| Level 1 | Level 2 | Level 3 | Total | |||||||||||||
| (in millions) | ||||||||||||||||
| As of December 31, 2013 |
||||||||||||||||
| Equity securities: |
||||||||||||||||
| Common stock |
$ | 2,229.4 | $ | — | $ | — | $ | 2,229.4 | ||||||||
| Preferred stock |
— | — | — | — | ||||||||||||
|
|
|
|
|
|
|
|
|
|||||||||
| Total equity securities |
2,229.4 | — | — | 2,229.4 | ||||||||||||
|
|
|
|
|
|
|
|
|
|||||||||
| Debt securities: |
||||||||||||||||
| U.S. Government obligations |
— | 955.0 | — | 955.0 | ||||||||||||
| Municipal bonds |
— | 5,590.1 | — | 5,590.1 | ||||||||||||
| Foreign government obligations |
— | 975.4 | — | 975.4 | ||||||||||||
| U.S. corporate bonds |
— | 2,285.4 | 27.5 | 2,312.9 | ||||||||||||
| Foreign corporate bonds |
— | 1,830.7 | 1.0 | 1,831.7 | ||||||||||||
| Mortgage and asset-backed securities: |
||||||||||||||||
| RMBS(1) |
— | 1,469.0 | 78.8 | 1,547.8 | ||||||||||||
| CMBS |
— | 824.8 | 60.8 | 885.6 | ||||||||||||
| Other asset-backed securities(2) |
— | 446.0 | 258.4 | 704.4 | ||||||||||||
|
|
|
|
|
|
|
|
|
|||||||||
| Total debt securities |
— | 14,376.4 | 426.5 | 14,802.9 | ||||||||||||
| Short-term investments |
— | 1,317.9 | — | 1,317.9 | ||||||||||||
| Other invested assets(3) |
— | — | 282.0 | 282.0 | ||||||||||||
|
|
|
|
|
|
|
|
|
|||||||||
| Total investments (excluding equity method investments) |
$ | 2,229.4 | $ | 15,694.3 | $ | 708.5 | $ | 18,632.2 | ||||||||
|
|
|
|
|
|
|
|
|
|||||||||
| Senior Notes |
$ | — | $ | 1,887.7 | $ | — | $ | 1,887.7 | ||||||||
|
|
|
|
|
|
|
|
|
|||||||||
134
Table of Contents
| (1) | Primarily includes government agency pass-through securities guaranteed by a government agency or government sponsored enterprise, among other types of RMBS. |
| (2) | Includes $900.7 million and $237.9 million of collateralized loan obligations as of December 31, 2014 and 2013, respectively. |
| (3) | Includes partnership and non-marketable equity investments accounted for on an AFS basis, and excludes investments accounted for using the equity method and certain loans receivable that are carried at cost. |
In 2014, there were transfers of $253.8 million of invested assets out of Level 3. Of the $253.8 million, $232.9 million related to a conversion of an equity interest held by AIHL in the second quarter of 2014. As further described in Note 4(h), AIHL’s investment in Ares Management LLC (“Ares”) converted to limited partner interests in certain Ares subsidiaries during the second quarter of 2014, at which time the investment ceased to qualify as a financial instrument measured at fair value. No gain or loss was recognized upon the conversion. The remaining transfers of $20.9 million of invested assets out of Level 3 were principally due to an increase in observable inputs related to the valuation of such assets.
In 2014, there were transfers of $58.4 million of debt securities into Level 3 that were principally due to a decrease in observable inputs related to the valuation of such securities. Of the $58.4 million, $29.1 million related to other asset-backed securities (specifically, collateralized loan obligations), $23.2 million related to U.S. corporate bonds and $6.1 million related to foreign corporate bonds. There were no other transfers between Levels 1, 2 or 3 in 2014.
In 2013, there was a transfer of $100.0 million of other invested assets out of Level 3 into common stocks in Level 1 as a previously non-marketable equity investment purchased in early 2013 became publicly traded in an active market that Alleghany has the ability to access. In addition, there was a transfer of $173.1 million of primarily other asset-backed securities out of Level 2 into Level 3 that was principally due to a decrease in observable inputs related to the valuation of such securities. There were no other transfers between Levels 1, 2 or 3 in 2013.
The following tables present reconciliations of the changes during 2014 and 2013 in Level 3 assets measured at fair value:
| Debt Securities | ||||||||||||||||||||||||||||
| Mortgage and asset-backed | ||||||||||||||||||||||||||||
| Year Ended December 31, 2014 |
U.S. Corporate Bonds |
Foreign Corporate Bonds |
RMBS | CMBS | Other Asset- backed Securities |
Other Invested Assets(1) |
Total | |||||||||||||||||||||
| (in millions) | ||||||||||||||||||||||||||||
| Balance as of January 1, 2014 |
$ | 27.5 | $ | 1.0 | $ | 78.8 | $ | 60.8 | $ | 258.4 | $ | 282.0 | $ | 708.5 | ||||||||||||||
| Net realized/unrealized gains (losses)included in: |
||||||||||||||||||||||||||||
| Net earnings(2) |
(0.9 | ) | — | 20.8 | (0.4 | ) | 0.4 | 0.3 | 20.2 | |||||||||||||||||||
| Other comprehensive income |
— | (0.1 | ) | (13.3 | ) | (1.2 | ) | (12.4 | ) | 1.3 | (25.7 | ) | ||||||||||||||||
| Purchases |
22.5 | 2.7 | — | 14.4 | 749.7 | 4.5 | 793.8 | |||||||||||||||||||||
| Sales |
(12.9 | ) | (1.2 | ) | (58.2 | ) | (8.3 | ) | (79.3 | ) | (4.9 | ) | (164.8 | ) | ||||||||||||||
| Issuances |
— | — | — | — | — | — | — | |||||||||||||||||||||
| Settlements |
(8.0 | ) | (1.5 | ) | (9.9 | ) | (42.0 | ) | (12.8 | ) | (21.0 | ) | (95.2 | ) | ||||||||||||||
| Transfers into |
23.2 | 6.1 | — | — | 29.1 | — | 58.4 | |||||||||||||||||||||
| Transfers out of |
(14.7 | ) | (1.0 | ) | — | — | — | (238.1 | ) | (253.8 | ) | |||||||||||||||||
|
|
|
|
|
|
|
|
|
|
|
|
|
|
|
|||||||||||||||
| Balance as of December 31, 2014 |
$ | 36.7 | $ | 6.0 | $ | 18.2 | $ | 23.3 | $ | 933.1 | $ | 24.1 | $ | 1,041.4 | ||||||||||||||
|
|
|
|
|
|
|
|
|
|
|
|
|
|
|
|||||||||||||||
135
Table of Contents
| Debt Securities | ||||||||||||||||||||||||||||
| Mortgage and asset-backed | ||||||||||||||||||||||||||||
| Year Ended December 31, 2013 |
U.S. Corporate Bonds |
Foreign Corporate Bonds |
RMBS | CMBS | Other Asset- backed Securities |
Other Invested Assets(1) |
Total | |||||||||||||||||||||
| (in millions) | ||||||||||||||||||||||||||||
| Balance as of January 1, 2013 |
$ | 30.4 | $ | — | $ | 59.6 | $ | 76.1 | $ | 5.9 | $ | 42.3 | $ | 214.3 | ||||||||||||||
| Net realized/unrealized gains (losses) |
||||||||||||||||||||||||||||
| Net earnings(2) |
0.3 | — | 2.9 | 0.1 | 0.2 | 0.3 | 3.8 | |||||||||||||||||||||
| Other comprehensive income |
(0.5 | ) | — | 5.7 | (0.4 | ) | (0.5 | ) | 4.3 | 8.6 | ||||||||||||||||||
| Purchases(3) |
22.9 | 1.0 | — | 22.9 | 103.3 | 350.0 | 500.1 | |||||||||||||||||||||
| Sales |
(23.8 | ) | — | — | (21.4 | ) | — | — | (45.2 | ) | ||||||||||||||||||
| Issuances |
— | — | — | — | — | — | — | |||||||||||||||||||||
| Settlements |
(1.8 | ) | — | (10.7 | ) | (16.6 | ) | (2.2 | ) | (14.9 | ) | (46.2 | ) | |||||||||||||||
| Transfers into |
— | — | 21.3 | 0.1 | 151.7 | — | 173.1 | |||||||||||||||||||||
| Transfers out of |
— | — | — | — | — | (100.0 | ) | (100.0 | ) | |||||||||||||||||||
|
|
|
|
|
|
|
|
|
|
|
|
|
|
|
|||||||||||||||
| Balance as of December 31, 2013 |
$ | 27.5 | $ | 1.0 | $ | 78.8 | $ | 60.8 | $ | 258.4 | $ | 282.0 | $ | 708.5 | ||||||||||||||
|
|
|
|
|
|
|
|
|
|
|
|
|
|
|
|||||||||||||||
| (1) | Includes partnership and non-marketable equity investments accounted for on an AFS basis. |
| (2) | There were no OTTI losses recorded in net earnings related to Level 3 instruments still held as of December 31, 2014 and 2013. |
| (3) | For 2013, $250.0 million of other invested assets is due to an investment in Ares. See Note 4(h) for a more detailed description of this investment. |
Net unrealized losses related to Level 3 investments as of December 31, 2014 and 2013 were not material.
See Note 1(c) for Alleghany’s accounting policy on fair value.
136
Table of Contents
4. Investments
(a) Unrealized Gains and Losses
The amortized cost or cost and the fair value of AFS securities as of December 31, 2014 and 2013 are summarized as follows:
| Amortized Cost or Cost |
Gross Unrealized Gains |
Gross Unrealized Losses |
Fair Value | |||||||||||||
| (in millions) | ||||||||||||||||
| As of December 31, 2014 |
||||||||||||||||
| Equity securities: |
||||||||||||||||
| Common stock |
$ | 2,366.0 | $ | 530.3 | $ | (80.8 | ) | $ | 2,815.5 | |||||||
| Preferred stock |
— | — | — | — | ||||||||||||
|
|
|
|
|
|
|
|
|
|||||||||
| Total equity securities |
2,366.0 | 530.3 | (80.8 | ) | 2,815.5 | |||||||||||
|
|
|
|
|
|
|
|
|
|||||||||
| Debt securities: |
||||||||||||||||
| U.S. Government obligations |
541.2 | 3.4 | (3.5 | ) | 541.1 | |||||||||||
| Municipal bonds |
5,067.3 | 139.3 | (9.1 | ) | 5,197.5 | |||||||||||
| Foreign government obligations |
876.7 | 23.7 | — | 900.4 | ||||||||||||
| U.S. corporate bonds |
2,136.5 | 39.5 | (21.2 | ) | 2,154.8 | |||||||||||
| Foreign corporate bonds |
1,460.5 | 47.7 | (4.5 | ) | 1,503.7 | |||||||||||
| Mortgage and asset-backed securities: |
||||||||||||||||
| RMBS |
1,646.9 | 20.7 | (11.7 | ) | 1,655.9 | |||||||||||
| CMBS |
1,104.2 | 22.5 | (1.4 | ) | 1,125.3 | |||||||||||
| Other asset-backed securities(1) |
1,531.2 | 2.2 | (13.5 | ) | 1,519.9 | |||||||||||
|
|
|
|
|
|
|
|
|
|||||||||
| Total debt securities |
14,364.5 | 299.0 | (64.9 | ) | 14,598.6 | |||||||||||
| Short-term investments |
715.6 | — | — | 715.6 | ||||||||||||
|
|
|
|
|
|
|
|
|
|||||||||
| Total |
$ | 17,446.1 | $ | 829.3 | $ | (145.7 | ) | $ | 18,129.7 | |||||||
|
|
|
|
|
|
|
|
|
|||||||||
| Amortized Cost or Cost |
Gross Unrealized Gains |
Gross Unrealized Losses |
Fair Value | |||||||||||||
| (in millions) | ||||||||||||||||
| As of December 31, 2013 |
||||||||||||||||
| Equity securities: |
||||||||||||||||
| Common stock |
$ | 1,804.7 | $ | 426.6 | $ | (1.9 | ) | $ | 2,229.4 | |||||||
| Preferred stock |
— | — | — | — | ||||||||||||
|
|
|
|
|
|
|
|
|
|||||||||
| Total equity securities |
1,804.7 | 426.6 | (1.9 | ) | 2,229.4 | |||||||||||
|
|
|
|
|
|
|
|
|
|||||||||
| Debt securities: |
||||||||||||||||
| U.S. Government obligations |
982.1 | 3.0 | (30.1 | ) | 955.0 | |||||||||||
| Municipal bonds |
5,650.5 | 51.7 | (112.1 | ) | 5,590.1 | |||||||||||
| Foreign government obligations |
979.3 | 4.6 | (8.5 | ) | 975.4 | |||||||||||
| U.S. corporate bonds |
2,307.2 | 29.4 | (23.7 | ) | 2,312.9 | |||||||||||
| Foreign corporate bonds |
1,810.6 | 27.0 | (5.9 | ) | 1,831.7 | |||||||||||
| Mortgage and asset-backed securities: |
||||||||||||||||
| RMBS |
1,559.5 | 36.1 | (47.8 | ) | 1,547.8 | |||||||||||
| CMBS |
881.6 | 12.8 | (8.8 | ) | 885.6 | |||||||||||
| Other asset-backed securities(1) |
705.0 | 1.7 | (2.3 | ) | 704.4 | |||||||||||
|
|
|
|
|
|
|
|
|
|||||||||
| Total debt securities |
14,875.8 | 166.3 | (239.2 | ) | 14,802.9 | |||||||||||
| Short-term investments |
1,317.9 | — | — | 1,317.9 | ||||||||||||
|
|
|
|
|
|
|
|
|
|||||||||
| Total |
$ | 17,998.4 | $ | 592.9 | $ | (241.1 | ) | $ | 18,350.2 | |||||||
|
|
|
|
|
|
|
|
|
|||||||||
| (1) | Includes $900.7 million and $237.9 million of collateralized loan obligations as of December 31, 2014 and 2013, respectively. |
137
Table of Contents
(b) Contractual Maturity
The amortized cost and estimated fair value of debt securities as of December 31, 2014 by contractual maturity are shown below. Expected maturities will differ from contractual maturities because borrowers may have the right to call or prepay obligations with or without call or prepayment penalties.
| Amortized Cost or Cost |
Fair Value | |||||||
| (in millions) | ||||||||
| Short-term investments due in one year or less |
$ | 715.6 | $ | 715.6 | ||||
|
|
|
|
|
|||||
| Mortgage and asset-backed securities(1) |
4,282.3 | 4,301.1 | ||||||
| Debt securities with maturity dates: |
||||||||
| One year or less |
584.7 | 587.9 | ||||||
| Over one through five years |
3,279.1 | 3,314.6 | ||||||
| Over five through ten years |
2,960.5 | 3,034.5 | ||||||
| Over ten years |
3,257.9 | 3,360.5 | ||||||
|
|
|
|
|
|||||
| Total debt securities |
14,364.5 | 14,598.6 | ||||||
|
|
|
|
|
|||||
| Equity securities |
2,366.0 | 2,815.5 | ||||||
|
|
|
|
|
|||||
| Total |
$ | 17,446.1 | $ | 18,129.7 | ||||
|
|
|
|
|
|||||
| (1) | Mortgage and asset-backed securities by their nature do not generally have single maturity dates. |
(c) Net Investment Income
Net investment income for 2014, 2013 and 2012 was as follows:
| Year Ended December 31, | ||||||||||||
| 2014 | 2013 | 2012 | ||||||||||
| (in millions) | ||||||||||||
| Interest income |
$ | 384.4 | $ | 348.0 | $ | 306.1 | ||||||
| Dividend income |
63.0 | 59.6 | 24.9 | |||||||||
| Investment expenses |
(28.8 | ) | (20.3 | ) | (16.8 | ) | ||||||
| Equity in results of Pillar Investments(1) |
22.0 | 27.2 | — | |||||||||
| Equity in results of Ares(1) |
8.6 | 9.1 | — | |||||||||
| Equity in results of Homesite(2) |
— | 42.9 | (6.9 | ) | ||||||||
| Equity in results of ORX |
(3.2 | ) | (1.0 | ) | (4.5 | ) | ||||||
| Other investment results |
13.9 | 0.2 | 10.2 | |||||||||
|
|
|
|
|
|
|
|||||||
| Total |
$ | 459.9 | $ | 465.7 | $ | 313.0 | ||||||
|
|
|
|
|
|
|
|||||||
| (1) | See Note 4(h) for discussion of the Pillar Investments and the investment in Ares as defined in Note 4(h). |
| (2) | Homesite was sold on December 31, 2013. |
As of December 31, 2014, non-income producing invested assets were insignificant.
(d) Realized Gains and Losses
The proceeds from sales of AFS securities were $6.6 billion, $8.6 billion and $3.0 billion in 2014, 2013 and 2012, respectively.
Realized capital gains and losses in 2014, 2013 and 2012 generally reflect sales of equity securities. In addition, net realized capital gains in 2014 also include a realized capital gain of $34.0 million from the sales of long-dated U.S. Treasury Strip debt securities in April 2014, some additional realized capital gains taken on debt securities and a $9.4 million realized capital loss on the early redemption of $300 million par value of TransRe’s 5.75% senior notes due on December 14, 2015 (the “2015 Senior Notes”). See Note 8(b) for additional information on the early redemption of the 2015 Senior Notes. Realized capital gains for 2013 included a $46.8
138
Table of Contents
million gain on the sale of Homesite, and a $5.0 million non-cash impairment charge related to certain finite-lived intangible assets at CapSpecialty. Realized capital gains for 2012 included $63.1 million of capital gains from the sales of shares of common stock of Exxon Mobil Corporation in January 2012.
The amount of gross realized capital gains and gross realized capital losses in 2014, 2013 and 2012 were as follows:
| Year Ended December 31, | ||||||||||||
| 2014 | 2013 | 2012 | ||||||||||
| (in millions) | ||||||||||||
| Gross realized capital gains |
$ | 301.1 | $ | 315.1 | $ | 171.9 | ||||||
| Gross realized capital losses |
(54.0 | ) | (83.0 | ) | (14.0 | ) | ||||||
|
|
|
|
|
|
|
|||||||
| Net realized capital gains |
$ | 247.1 | $ | 232.1 | $ | 157.9 | ||||||
|
|
|
|
|
|
|
|||||||
Gross realized loss amounts exclude OTTI losses, as discussed below.
(e) OTTI losses
Alleghany holds its equity and debt securities as AFS, and as such, these securities are recorded at fair value. Alleghany continually monitors the difference between cost and the estimated fair value of its investments, which involves uncertainty as to whether declines in value are temporary in nature. The analysis of any individual security’s decline in value is performed in its functional currency. If the decline of a particular investment is deemed temporary, Alleghany records the decline as an unrealized loss in stockholders’ equity. If the decline is deemed to be other than temporary, Alleghany writes its cost-basis or amortized cost-basis down to the fair value of the investment and records an OTTI loss on its statement of earnings. In addition, any portion of such decline related to debt securities that is believed to arise from factors other than credit is recorded as a component of other comprehensive income rather than charged against earnings.
Management’s assessment of equity securities initially involves an evaluation of all securities that are in an unrealized loss position, regardless of the duration or severity of the loss, as of the applicable balance sheet date. Such initial review consists primarily of assessing whether: (i) there has been a negative credit or news event with respect to the issuer that could indicate the existence of an OTTI; and (ii) Alleghany has the ability and intent to hold an equity security for a period of time sufficient to allow for an anticipated recovery (generally considered to be one year from the balance sheet date).
To the extent that an equity security in an unrealized loss position is not impaired based on the initial review described above, Alleghany then further evaluates such equity security and deems it to be other than temporarily impaired if it has been in an unrealized loss position for 12 months or more or if its unrealized loss position is greater than 50 percent of its cost, absent compelling evidence to the contrary.
Alleghany then evaluates those equity securities where the unrealized loss is 20 percent or more of cost as of the balance sheet date or which have been in an unrealized loss position continuously for six months or more preceding the balance sheet date. This evaluation takes into account quantitative and qualitative factors in determining whether such securities are other than temporarily impaired including: (i) market valuation metrics associated with the equity security (such as dividend yield and price-to-earnings ratio); (ii) current views on the equity security, as expressed by either Alleghany’s internal stock analysts and / or by third party stock analysts or rating agencies; and (iii) credit or news events associated with a specific issuer, such as negative news releases and rating agency downgrades with respect to the issuer of the investment.
Debt securities in an unrealized loss position are evaluated for OTTI if they meet any of the following criteria: (i) they are trading at a 20 percent discount to amortized cost for an extended period of time (nine consecutive months or longer); (ii) there has been a negative credit or news event with respect to the issuer that could indicate the existence of an OTTI; or (iii) Alleghany intends to sell, or it is more likely than not that Alleghany will sell, the debt security before recovery of its amortized cost basis.
If Alleghany intends to sell, or it is more likely than not that Alleghany will sell, a debt security before recovery of its amortized cost basis, the total amount of the unrealized loss position is recognized as an OTTI
139
Table of Contents
loss in earnings. To the extent that a debt security that is in an unrealized loss position is not impaired based on the preceding, Alleghany will consider a debt security to be impaired when it believes it to be probable that Alleghany will not be able to collect the entire amortized cost basis. For debt securities in an unrealized loss position as of the end of each quarter, Alleghany develops a best estimate of the present value of expected cash flows. If the results of the cash flow analysis indicate Alleghany will not recover the full amount of its amortized cost basis in the debt security, Alleghany records an OTTI loss in earnings equal to the difference between the present value of expected cash flows and the amortized cost basis of the debt security. If applicable, the difference between the total unrealized loss position on the debt security and the OTTI loss recognized in earnings is the non-credit related portion and is recorded as a component of other comprehensive income.
In developing the cash flow analyses for debt securities, Alleghany considers various factors for the different categories of debt securities. For municipal bonds, Alleghany takes into account the taxing power of the issuer, source of revenue, credit risk and credit enhancements and pre-refunding. For mortgage and asset-backed securities, Alleghany discounts its best estimate of future cash flows at an effective rate equal to the original effective yield of the security or, in the case of floating rate securities, at the current coupon. Alleghany’s models include assumptions about prepayment speeds, default and delinquency rates and underlying collateral (if any), as well as credit ratings, credit enhancements and other observable market data. For corporate bonds, Alleghany reviews business prospects, credit ratings and available information from asset managers and rating agencies for individual securities.
OTTI losses in 2014 reflect $36.3 million of unrealized losses that were deemed to be other than temporary and, as such, were required to be charged against earnings. Upon the ultimate disposition of the securities for which OTTI losses have been recorded, a portion of the loss may be recoverable depending on market conditions at the time of disposition. Of the $36.3 million of OTTI losses incurred during 2014, $28.7 million relate to equity securities, primarily in the mining sector, and $7.6 million relate to debt securities, primarily in the energy sector. The determination that unrealized losses on such securities were other than temporary was primarily based on the severity of the decline in the fair value of equity securities relative to their cost as of the balance sheet date, and the fact that Alleghany lacked the intent to hold debt securities for a period of time sufficient to allow for an anticipated recovery.
OTTI losses in 2013 reflect $44.0 million of unrealized losses that were deemed to be other than temporary and, as such, were required to be charged against earnings. Of the $44.0 million of OTTI losses incurred during 2013, $42.6 million relate to equity securities, primarily in the chemical and energy sectors, and $1.4 million relate to debt securities. The determination that unrealized losses on such securities were other than temporary was primarily based on the duration of the decline in the fair value of such securities relative to their cost as of the balance sheet date.
OTTI losses in 2012 reflect $2.9 million of unrealized losses that were deemed to be other than temporary and, as such, were required to be charged against earnings. Of the $2.9 million of OTTI losses incurred during 2012, $1.7 million relate to equity securities, primarily in the energy sector, and $1.2 million relate to debt securities. The determination that unrealized losses on such securities were other than temporary was primarily based on the duration of the decline in the fair value of such security relative to their cost as of the balance sheet date.
After adjusting the cost basis of securities for the recognition of OTTI losses, the remaining gross unrealized investment losses for debt and equity securities as of December 31, 2014 were deemed to be temporary, based on, among other factors: (i) the duration of time and the relative magnitude to which the fair value of these investments had been below cost were not indicative of an OTTI loss (for example, no equity security was in a continuous unrealized loss position for 12 months or more as of December 31, 2014); (ii) the absence of compelling evidence that would cause Alleghany to call into question the financial condition or near-term business prospects of the issuer of the investment; and (iii) Alleghany’s ability and intent to hold the investment for a period of time sufficient to allow for any anticipated recovery.
Alleghany may ultimately record a realized loss after having originally concluded that the decline in value was temporary. Risks and uncertainties are inherent in the methodology Alleghany uses to assess other than temporary declines in value. Risks and uncertainties could include, but are not limited to, incorrect assumptions about financial condition, liquidity or future prospects, inadequacy of any underlying collateral, and unfavorable changes in economic conditions or social trends, interest rates or credit ratings.
140
Table of Contents
(f) Aging of Gross Unrealized Losses
As of December 31, 2014 and 2013, gross unrealized losses and related fair values for equity securities and debt securities, grouped by duration of time in a continuous unrealized loss position, were as follows:
| Less Than 12 Months | 12 Months or More | Total | ||||||||||||||||||||||
| Fair Value | Gross Unrealized Losses |
Fair Value | Gross Unrealized Losses |
Fair Value | Gross Unrealized Losses |
|||||||||||||||||||
| (in millions) | ||||||||||||||||||||||||
| As of December 31, 2014 |
||||||||||||||||||||||||
| Equity securities: |
||||||||||||||||||||||||
| Common stock |
$ | 514.4 | $ | 80.8 | $ | — | $ | — | $ | 514.4 | $ | 80.8 | ||||||||||||
| Preferred stock |
— | — | — | — | — | — | ||||||||||||||||||
|
|
|
|
|
|
|
|
|
|
|
|
|
|||||||||||||
| Total equity securities |
514.4 | 80.8 | — | — | 514.4 | 80.8 | ||||||||||||||||||
|
|
|
|
|
|
|
|
|
|
|
|
|
|||||||||||||
| Debt securities: |
||||||||||||||||||||||||
| U.S. Government obligations |
270.5 | 3.1 | 16.3 | 0.4 | 286.8 | 3.5 | ||||||||||||||||||
| Municipal bonds |
105.2 | 0.8 | 372.0 | 8.3 | 477.2 | 9.1 | ||||||||||||||||||
| Foreign government obligations |
6.1 | — | 5.7 | — | 11.8 | — | ||||||||||||||||||
| U.S. corporate bonds |
574.7 | 17.2 | 150.7 | 4.0 | 725.4 | 21.2 | ||||||||||||||||||
| Foreign corporate bonds |
133.4 | 4.1 | 26.2 | 0.4 | 159.6 | 4.5 | ||||||||||||||||||
| Mortgage and asset-backed securities: |
||||||||||||||||||||||||
| RMBS |
187.9 | 0.5 | 586.4 | 11.2 | 774.3 | 11.7 | ||||||||||||||||||
| CMBS |
176.5 | 0.7 | 60.9 | 0.7 | 237.4 | 1.4 | ||||||||||||||||||
| Other asset-backed securities |
1,041.1 | 12.7 | 175.3 | 0.8 | 1,216.4 | 13.5 | ||||||||||||||||||
|
|
|
|
|
|
|
|
|
|
|
|
|
|||||||||||||
| Total debt securities |
2,495.4 | 39.1 | 1,393.5 | 25.8 | 3,888.9 | 64.9 | ||||||||||||||||||
|
|
|
|
|
|
|
|
|
|
|
|
|
|||||||||||||
| Total temporarily impaired securities |
$ | 3,009.8 | $ | 119.9 | $ | 1,393.5 | $ | 25.8 | $ | 4,403.3 | $ | 145.7 | ||||||||||||
|
|
|
|
|
|
|
|
|
|
|
|
|
|||||||||||||
| Less Than 12 Months | 12 Months or More | Total | ||||||||||||||||||||||
| Fair Value | Gross Unrealized Losses |
Fair Value | Gross Unrealized Losses |
Fair Value | Gross Unrealized Losses |
|||||||||||||||||||
| (in millions) | ||||||||||||||||||||||||
| As of December 31, 2013 |
||||||||||||||||||||||||
| Equity securities: |
||||||||||||||||||||||||
| Common stock |
$ | 148.7 | $ | 1.9 | $ | — | $ | — | $ | 148.7 | $ | 1.9 | ||||||||||||
| Preferred stock |
— | — | — | — | — | — | ||||||||||||||||||
|
|
|
|
|
|
|
|
|
|
|
|
|
|||||||||||||
| Total equity securities |
148.7 | 1.9 | — | — | 148.7 | 1.9 | ||||||||||||||||||
|
|
|
|
|
|
|
|
|
|
|
|
|
|||||||||||||
| Debt securities: |
||||||||||||||||||||||||
| U.S. Government obligations |
698.9 | 29.6 | 4.8 | 0.5 | 703.7 | 30.1 | ||||||||||||||||||
| Municipal bonds |
2,426.2 | 105.2 | 117.8 | 6.9 | 2,544.0 | 112.1 | ||||||||||||||||||
| Foreign government obligations |
625.6 | 8.2 | 8.8 | 0.3 | 634.4 | 8.5 | ||||||||||||||||||
| U.S. corporate bonds |
920.0 | 21.1 | 34.2 | 2.6 | 954.2 | 23.7 | ||||||||||||||||||
| Foreign corporate bonds |
528.3 | 5.8 | 4.9 | 0.1 | 533.2 | 5.9 | ||||||||||||||||||
| Mortgage and asset-backed securities: |
||||||||||||||||||||||||
| RMBS |
779.4 | 30.7 | 267.9 | 17.1 | 1,047.3 | 47.8 | ||||||||||||||||||
| CMBS |
375.2 | 8.5 | 16.9 | 0.3 | 392.1 | 8.8 | ||||||||||||||||||
| Other asset-backed securities |
461.0 | 2.3 | — | — | 461.0 | 2.3 | ||||||||||||||||||
|
|
|
|
|
|
|
|
|
|
|
|
|
|||||||||||||
| Total debt securities |
6,814.6 | 211.4 | 455.3 | 27.8 | 7,269.9 | 239.2 | ||||||||||||||||||
|
|
|
|
|
|
|
|
|
|
|
|
|
|||||||||||||
| Total temporarily impaired securities |
$ | 6,963.3 | $ | 213.3 | $ | 455.3 | $ | 27.8 | $ | 7,418.6 | $ | 241.1 | ||||||||||||
|
|
|
|
|
|
|
|
|
|
|
|
|
|||||||||||||
141
Table of Contents
As of December 31, 2014, Alleghany held a total of 662 debt securities and equity securities that were in an unrealized loss position, of which 169 securities, all debt securities, were in an unrealized loss position continuously for 12 months or more. The unrealized losses associated with the 169 debt securities consisted primarily of losses related to RMBS and municipal bonds.
As of December 31, 2014, the vast majority of Alleghany’s debt securities were rated investment grade, with approximately 4.1 percent of debt securities having issuer credit ratings that were below investment grade or not rated.
(g) Statutory Deposits
Investments with fair values of approximately $1.2 billion as of December 31, 2014, the substantial majority of which were debt securities and equity securities, were deposited with governmental authorities as required by law.
(h) Investments in Certain Other Invested Assets
In December 2012, TransRe obtained an ownership interest in Pillar Capital Holdings Limited (“Pillar Holdings”), a Bermuda-based insurance asset manager focused on collateralized reinsurance and catastrophe insurance-linked securities. Additionally, TransRe invested $175.0 million and AIHL invested $25.0 million in limited partnership funds managed by Pillar Holdings (the “Funds”). The objective of the Funds is to create portfolios with attractive risk-reward characteristics and low correlation with other asset classes, using the extensive reinsurance and capital market experience of the principals of Pillar Holdings. Alleghany has concluded that both Pillar Holdings and the Funds (collectively, the “Pillar Investments”) represent variable interest entities and that Alleghany is not the primary beneficiary, as it does not have the ability to direct the activities that most significantly impact each entity’s economic performance. Therefore, the Pillar Investments are not consolidated and are accounted for under the equity method of accounting. Alleghany’s potential maximum loss in the Pillar Investments is limited to its cumulative investment. As of December 31, 2014, Alleghany’s carrying value in the Pillar Investments, as determined under the equity method of accounting, was $235.2 million, which is reported in other invested assets on Alleghany’s consolidated balance sheets.
In July 2013, AIHL invested $250.0 million in Ares, an asset manager, in exchange for a 6.25 percent equity stake in Ares, with an agreement to engage Ares to manage up to $1.0 billion in certain investment strategies. In May 2014, Ares completed an initial public offering of its common units. Upon completion of the initial public offering, Alleghany’s equity investment in Ares converted to limited partner interests in certain Ares subsidiaries that are convertible into an aggregate 5.9 percent interest in Ares common units. At Alleghany’s discretion, half of these interests may be converted beginning at the end of a one-year waiting period, and the remaining half may be converted beginning at the end of a two-year waiting period. Until Alleghany’s limited partner interests convert into Ares common units, Alleghany classifies its investment in Ares as a component of other invested assets, and accounts for its investment using the equity method of accounting. As of December 31, 2014, AIHL’s carrying value in Ares was $231.7 million, which is net of returns of capital received from Ares.
5. Reinsurance Ceded
(a) Overview
Alleghany’s reinsurance and insurance subsidiaries reinsure portions of the risks they underwrite in order to reduce the effect of individual or aggregate exposure to losses, manage capacity, protect capital resources, reduce volatility in specific lines of business, improve risk-adjusted portfolio returns, and enable them to increase gross premium writings and risk capacity without requiring additional capital. Alleghany’s reinsurance and insurance subsidiaries purchase reinsurance and retrocessional coverages from highly-rated third party reinsurers. If the assuming reinsurers are unable or unwilling to meet the obligations assumed under the applicable reinsurance agreements, Alleghany’s reinsurance and insurance subsidiaries would remain liable for such reinsurance portion not paid by these reinsurers. As such, funds, trust agreements and letters of credit are held to
142
Table of Contents
collateralize a portion of Alleghany’s reinsurance and insurance subsidiaries’ reinsurance recoverables, and Alleghany’s reinsurance and insurance subsidiaries reinsure portions of the risks they underwrite or assume with multiple reinsurance programs.
(b) Reinsurance Recoverables
Amounts recoverable from reinsurers are recognized in a manner consistent with the claims liabilities associated with the reinsurance placement and presented on the balance sheet as reinsurance recoverables. Such balances as of December 31, 2014 and 2013 consist of the following:
| As of December 31, | ||||||||
| 2014 | 2013 | |||||||
| (in millions) | ||||||||
| Reinsurance recoverables on paid losses |
$ | 71.7 | $ | 61.6 | ||||
| Ceded outstanding loss and LAE |
1,289.4 | 1,302.1 | ||||||
|
|
|
|
|
|||||
| Total reinsurance recoverables |
$ | 1,361.1 | $ | 1,363.7 | ||||
|
|
|
|
|
|||||
Information regarding concentration of Alleghany’s reinsurance recoverables and the ratings profile of its reinsurers as of December 31, 2014 is as follows:
| Reinsurer(1) |
Rating(2) |
Amount | Percentage | |||||||
| (dollars in millions) | ||||||||||
| Swiss Reinsurance Company |
A+ (Superior) | $ | 150.5 | 11.1 | % | |||||
| American International Group, Inc. |
A (Excellent) | 143.9 | 10.6 | |||||||
| PartnerRe Ltd. |
A+ (Superior) | 110.3 | 8.1 | |||||||
| Syndicates at Lloyd’s of London |
A (Excellent) | 98.3 | 7.2 | |||||||
| Platinum Underwriters Holdings, Ltd. |
A (Excellent) | 93.9 | 6.9 | |||||||
| W.R. Berkley Corporation |
A+ (Superior) | 88.6 | 6.5 | |||||||
| Chubb Corporation |
A++ (Superior) | 64.9 | 4.8 | |||||||
| Ace Ltd. |
A++ (Superior) | 52.8 | 3.9 | |||||||
| Allianz SE |
A+ (Superior) | 39.3 | 2.9 | |||||||
| Munich Reinsurance |
A+ (Superior) | 38.3 | 2.8 | |||||||
| All other reinsurers |
480.3 | 35.2 | ||||||||
|
|
|
|
|
|||||||
| Total reinsurance recoverables(3) |
$ | 1,361.1 | 100.0 | % | ||||||
|
|
|
|
|
|||||||
| Secured reinsurance recoverables(4) |
$ | 161.7 | 11.9 | % | ||||||
|
|
|
|
|
|||||||
| (1) | Reinsurance recoverables reflect amounts due from one or more reinsurance subsidiaries of the listed company. |
| (2) | Represents the A.M. Best Company, Inc. financial strength rating for the applicable reinsurance subsidiary or subsidiaries from which the reinsurance recoverable is due. |
| (3) | Approximately 96 percent of Alleghany’s reinsurance recoverables balance as of December 31, 2014 was due from reinsurers having an A.M. Best Company, Inc. financial strength rating of A (Excellent) or higher. |
| (4) | Represents reinsurance recoverables secured by funds held, trust agreements and letters of credit. |
Alleghany had no allowance for uncollectible reinsurance as of December 31, 2014 and 2013.
Reinsured loss and LAE ceded included in Alleghany’s consolidated statements of earnings were $250.3 million, $263.0 million and $290.4 million for 2014, 2013 and 2012, respectively.
143
Table of Contents
(c) Premiums written and earned
The following table indicates property and casualty premiums written and earned for 2014, 2013 and 2012:
| Year Ended December 31, | ||||||||||||
| 2014 | 2013 | 2012 | ||||||||||
| (in millions) | ||||||||||||
| Gross premiums written – direct |
$ | 1,529.4 | $ | 1,474.5 | $ | 1,231.4 | ||||||
| Gross premiums written – assumed(1) |
3,567.2 | 3,411.8 | 2,991.5 | |||||||||
| Ceded premiums written(1) |
(599.1 | ) | (598.9 | ) | (499.0 | ) | ||||||
|
|
|
|
|
|
|
|||||||
| Net premiums written |
$ | 4,497.5 | $ | 4,287.4 | $ | 3,723.9 | ||||||
|
|
|
|
|
|
|
|||||||
| Gross premiums earned – direct |
$ | 1,517.0 | $ | 1,372.2 | $ | 1,161.5 | ||||||
| Gross premiums earned – assumed(1) |
3,540.5 | 3,459.6 | 3,093.5 | |||||||||
| Ceded premiums earned(1) |
(646.9 | ) | (592.6 | ) | (522.0 | ) | ||||||
|
|
|
|
|
|
|
|||||||
| Net premiums earned |
$ | 4,410.6 | $ | 4,239.2 | $ | 3,733.0 | ||||||
|
|
|
|
|
|
|
|||||||
| (1) | Include TransRe amounts starting from the TransRe Acquisition Date. |
(d) Significant Reinsurance Contracts
Alleghany’s reinsurance and insurance subsidiaries reinsure portions of the risks they underwrite or assume with multiple reinsurance programs. A discussion of the more significant programs follows.
RSUI reinsures its property lines of business through a program consisting of surplus share treaties, facultative placements, per risk, and catastrophe excess-of-loss treaties. RSUI’s catastrophe reinsurance program (which covers catastrophe risks including, among others, windstorms and earthquakes) and property per risk reinsurance program run on an annual basis from May 1 to the following April 30 and thus expired on April 30, 2014.
RSUI placed its catastrophe reinsurance program for the 2014 to 2015 period on May 1, 2014. The new catastrophe reinsurance program provides coverage in three layers for $600.0 million of losses in excess of a $200.0 million net retention after application of the surplus share treaties and facultative reinsurance. The first layer provides coverage for $300.0 million of losses, subject to a 5.0 percent co-participation by RSUI, in excess of $200.0 million, the second layer provides coverage for $100.0 million of losses in excess of $500.0 million, with no co-participation by RSUI, and the third layer provides coverage for $200.0 million of losses in excess of $600.0 million, with no co-participation by RSUI. In addition, RSUI’s property per risk reinsurance program for the 2014 to 2015 period provides RSUI with coverage for $90.0 million of losses, subject to a 10.0 percent co-participation by RSUI, in excess of a $10.0 million net retention per risk after application of the surplus share treaties and facultative reinsurance.
(e) Significant Intercompany Reinsurance Contracts
In the second quarter of 2013, AIHL Re and PacificComp’s wholly-owned subsidiary Pacific Compensation Insurance Company (“PCIC”), entered into an intercompany reinsurance contract, effective January 1, 2013, pursuant to which AIHL Re provides PCIC with coverage for adverse development on net loss and allocated loss adjustment expenses in excess of PCIC’s carried reserves at December 31, 2012 and accident year stop-loss coverage for any net losses and allocated loss adjustment expenses in excess of 75.0 percent of net premiums earned for PCIC for accident years 2013, 2014 and 2015. AIHL Re’s commitments also are intended to cover the statutory collateral requirements at PCIC, if and when necessary. AIHL Re’s obligations are subject to an aggregate limit of $100.0 million. In connection with such intercompany reinsurance agreement, Alleghany and AIHL Re entered into a contract whereby Alleghany will guarantee the recoverable balances owed to PCIC from AIHL Re up to $100.0 million. Subsequent to the entry into the above agreements, A.M. Best Company, Inc. upgraded PCIC’s rating to A- (Excellent) from B++ (Good). The above agreements had no impact on Alleghany’s consolidated results of operations and financial condition. From a segment reporting perspective, the financial results of AIHL Re, which are substantially attributable to its intercompany contract with PCIC, have been included in the results of PacificComp, with all intercompany balances eliminated.
144
Table of Contents
6. Liability for Loss and LAE
Activity in liability for loss and LAE in 2014, 2013 and 2012 is summarized as follows:
| Year Ended December 31, | ||||||||||||
| 2014 | 2013 | 2012 | ||||||||||
| (in millions) | ||||||||||||
| Reserves, beginning of period |
$ | 11,952.5 | $ | 12,239.8 | $ | 2,313.0 | ||||||
| Less: reinsurance recoverables(1) |
1,302.1 | 1,305.9 | 831.8 | |||||||||
|
|
|
|
|
|
|
|||||||
| Net reserves, beginning of period |
10,650.4 | 10,933.9 | 1,481.2 | |||||||||
|
|
|
|
|
|
|
|||||||
| Reserves acquired(2) |
56.9 | - | 9,156.1 | |||||||||
|
|
|
|
|
|
|
|||||||
| Incurred loss, net of reinsurance, related to: |
||||||||||||
| Current year(3) |
2,709.7 | 2,682.3 | 2,642.6 | |||||||||
| Prior years |
(215.2 | ) | (203.0 | ) | (12.3 | ) | ||||||
|
|
|
|
|
|
|
|||||||
| Total incurred loss and LAE, net of reinsurance |
2,494.5 | 2,479.3 | 2,630.3 | |||||||||
|
|
|
|
|
|
|
|||||||
| Paid loss, net of reinsurance, related to: |
||||||||||||
| Current year |
520.8 | 518.5 | 1,950.5 | |||||||||
| Prior years |
2,178.1 | 2,236.8 | 369.5 | |||||||||
|
|
|
|
|
|
|
|||||||
| Total paid loss and LAE, net of reinsurance |
2,698.9 | 2,755.3 | 2,320.0 | |||||||||
|
|
|
|
|
|
|
|||||||
| Foreign exchange effect |
(195.1 | ) | (7.5 | ) | (13.7 | ) | ||||||
|
|
|
|
|
|
|
|||||||
| Net reserves, end of period |
10,307.8 | 10,650.4 | 10,933.9 | |||||||||
| Plus: reinsurance recoverables(1) |
1,289.4 | 1,302.1 | 1,305.9 | |||||||||
|
|
|
|
|
|
|
|||||||
| Reserves, end of period |
$ | 11,597.2 | $ | 11,952.5 | $ | 12,239.8 | ||||||
|
|
|
|
|
|
|
|||||||
| (1) | Reinsurance recoverables in this table include only ceded loss and LAE reserves. |
| (2) | For 2014, represents reserves acquired in connection with a loss portfolio transfer transaction. For 2012, represents the carrying value of TransRe’s net reserves acquired in the merger. TransRe’s gross loss and LAE reserves and ceded loss and LAE reserves as of the TransRe Acquisition Date were $9,627.8 million and $471.7 million, respectively. |
| (3) | 2012 includes amounts from TransRe from the TransRe Acquisition Date through December 31, 2012, including $87.8 million of favorable prior accident year development on loss and LAE reserves acquired. |
Gross loss and LAE reserves as of December 31, 2014 decreased from December 31, 2013, reflecting a decrease in the reinsurance segment loss and LAE reserves. The decrease in gross loss and LAE reserves in the reinsurance segment primarily reflects favorable prior accident year loss reserve development, loss payments including amounts related to catastrophe events occurring in prior years, and the impact of changes in foreign currency exchange rates.
Gross loss and LAE reserves as of December 31, 2013 decreased from December 31, 2012, reflecting a decrease in the reinsurance segment loss and LAE reserves, partially offset by a slight increase in the insurance segment loss and LAE reserves. The decrease in gross loss and LAE reserves in the reinsurance segment primarily reflects favorable prior accident year development on loss reserves and payments related to catastrophe events occurring in prior years. The slight increase in gross loss and LAE reserves in the insurance segment primarily reflects the impact of higher net premiums earned in 2013, partially offset by the impact of property loss claims resulting from Super Storm Sandy paid by RSUI in 2013.
145
Table of Contents
The (favorable) unfavorable prior accident year development on loss reserves for 2014, 2013 and 2012 is summarized as follows:
| Year Ended December 31, | ||||||||||||
| 2014 | 2013 | 2012(1) | ||||||||||
| (in millions) | ||||||||||||
| Reinsurance Segment: |
||||||||||||
| Property: |
||||||||||||
| Catastrophe events |
$ | (17.3 | )(2) | $ | (109.3 | )(3) | $ | — | ||||
| Non-catastrophe |
(55.8 | )(4) | (75.4 | )(5) | — | |||||||
|
|
|
|
|
|
|
|||||||
| Total property |
(73.1 | ) | (184.7 | ) | — | |||||||
|
|
|
|
|
|
|
|||||||
| Casualty & other: |
||||||||||||
| The Malpractice Treaties(6) |
(12.7 | ) | (35.7 | ) | — | |||||||
| Other |
(96.6 | )(7) | (3.7 | )(8) | — | |||||||
|
|
|
|
|
|
|
|||||||
| Total Casualty & other |
(109.3 | ) | (39.4 | ) | — | |||||||
|
|
|
|
|
|
|
|||||||
| Total Reinsurance Segment |
(182.4 | ) | (224.1 | ) | — | |||||||
|
|
|
|
|
|
|
|||||||
| Insurance Segment: |
||||||||||||
| RSUI: |
||||||||||||
| Casualty |
(30.1 | )(9) | (25.9 | )(10) | (48.1 | )(11) | ||||||
| Property and other |
(5.3 | )(12) | 8.0 | (13) | 17.0 | (14) | ||||||
|
|
|
|
|
|
|
|||||||
| Total RSUI |
(35.4 | ) | (17.9 | ) | (31.1 | ) | ||||||
|
|
|
|
|
|
|
|||||||
| CapSpecialty: |
||||||||||||
| Ongoing lines of business |
0.2 | 10.4 | (15) | (9.0 | )(16) | |||||||
| Terminated Program(17) |
— | 19.4 | 22.2 | |||||||||
| Asbestos-related illness and environmental impairment liability |
— | (4.0 | ) | — | ||||||||
|
|
|
|
|
|
|
|||||||
| Total CapSpecialty |
0.2 | 25.8 | 13.2 | |||||||||
|
|
|
|
|
|
|
|||||||
| PacificComp(18) |
2.4 | 13.2 | 5.6 | |||||||||
|
|
|
|
|
|
|
|||||||
| Total incurred related to prior years |
$ | (215.2 | ) | $ | (203.0 | ) | $ | (12.3 | ) | |||
|
|
|
|
|
|
|
|||||||
| (1) | $87.8 million of favorable prior accident year development on loss and LAE reserves acquired in the merger are included in current year net loss and LAE for the reinsurance segment. |
| (2) | Includes favorable development of $1.6 million from Super Storm Sandy in 2012 and $15.7 million of net favorable development from other catastrophes. The $15.7 million primarily reflects favorable development from several catastrophes that occurred primarily in the 2013 and 2011 accident years, partially offset by unfavorable development from the New Zealand earthquake in 2010. |
| (3) | Includes favorable development of $73.7 million from Super Storm Sandy in 2012 and $35.6 million from other catastrophe losses, principally flooding that took place in Thailand in 2011 and the Tohoku earthquake in Japan in 2011, partially offset by unfavorable development from the New Zealand earthquake in 2010. |
| (4) | Reflects favorable development primarily related to the 2012 accident year and, to a lesser extent, the 2011 accident year. |
| (5) | Reflects favorable development primarily related to the 2011 and 2012 accident years. |
| (6) | Represents certain medical malpractice treaties pursuant to which the increased underwriting profits created by the favorable development are retained by the cedants. As a result, TransRe records an offsetting increase in profit commission expense incurred when such favorable development occurs. |
| (7) | Generally reflects favorable development in a variety of casualty & other lines of business primarily from the 2003 through 2007 and 2010 through 2011 accident years, partially offset by unfavorable development from the 2013 accident year and the 2002 and prior accident years. |
| (8) | Generally reflects favorable development in a variety of casualty & other lines of business. |
| (9) | Primarily reflects favorable development in the professional liability, general liability and umbrella/excess lines of business, and primarily related to the 2006 through 2010 accident years. |
| (10) | Primarily reflects favorable development in the umbrella/excess liability, professional liability lines of business, and primarily related to the 2005 through 2010 accident years. |
| (11) | Primarily reflects favorable development in the umbrella/excess liability, general liability, professional liability and directors’ and officers’ liability lines of business, and primarily related to the 2005 through 2008 accident years. |
146
Table of Contents
| (12) | Primarily reflects favorable development on unallocated LAE reserves and prior year catastrophe reserves from recent accident years. |
| (13) | Includes $8.5 million of unfavorable development from Hurricane Katrina, which resulted from a significant claim that settled for more than previously estimated due to an adverse court ruling, partially offset by net favorable development with respect to other property reserves. |
| (14) | Includes $9.7 million of unfavorable development from Hurricane Ike in 2008. |
| (15) | Primarily reflects unfavorable development from workers’ compensation and certain other casualty lines of business, and related primarily to unfavorable loss emergence on a few individual claims, partially offset by favorable development on surety lines of business. |
| (16) | Primarily reflects favorable development in certain casualty and surety lines of business. |
| (17) | Represents certain specialty classes of business written through a program administrator in connection with a terminated program related to the 2010 and 2009 accident years and reflects unfavorable loss emergence compared with loss emergence patterns assumed in earlier periods for such business. |
| (18) | The unfavorable development in 2014, 2013 and 2012 related primarily to the 2009 and prior accident years. |
7. Credit Agreement
On October 15, 2013, Alleghany entered into a four-year credit agreement (the “Credit Agreement”) which provides for an unsecured credit facility in an aggregate principal amount of up to $200.0 million. The Credit Agreement is scheduled to terminate on October 15, 2017, unless terminated at an earlier date. Borrowings under the Credit Agreement will be available for working capital and general corporate purposes.
Borrowings under the Credit Agreement bear a floating rate of interest based in part on Alleghany’s credit rating, among other factors. The Credit Agreement requires that all loans be repaid in full no later than October 15, 2017. The Credit Agreement also requires Alleghany to pay a commitment fee each quarter in a range of between 0.125 and 0.30 percent per annum, based upon Alleghany’s credit rating, on the daily unused amount of the commitments. The Credit Agreement contains representations, warranties and covenants customary for bank loan facilities of this nature. There were no borrowings under the Credit Agreement from its inception through December 31, 2014.
8. Senior Notes
(a) Alleghany Senior Notes
On September 9, 2014, Alleghany completed a public offering of $300.0 million aggregate principal amount of its 4.90% senior notes due on September 15, 2044 (the “2044 Senior Notes”). The 2044 Senior Notes are unsecured and unsubordinated general obligations of Alleghany. Interest on the 2044 Senior Notes is payable semi-annually on March 15 and September 15 of each year. The terms of the 2044 Senior Notes permit redemption prior to their maturity. The indenture under which the 2044 Senior Notes were issued contains covenants that impose conditions on Alleghany’s ability to create liens on, or engage in sales of, the capital stock of AIHL, TransRe or RSUI. The 2044 Senior Notes were issued at approximately 99.3 percent of par, resulting in proceeds after underwriting discount, commissions and other expenses of $294.3 million, and an effective yield of approximately 5.0 percent. Approximately $3.6 million of underwriting discount, commissions and other expenses were recorded as deferred charges, which are amortized over the life of the 2044 Senior Notes.
On June 26, 2012, Alleghany completed a public offering of $400.0 million aggregate principal amount of its 4.95% senior notes due on June 27, 2022 (the “2022 Senior Notes”). The 2022 Senior Notes are unsecured and unsubordinated general obligations of Alleghany. Interest on the 2022 Senior Notes is payable semi-annually on June 27 and December 27 of each year. The terms of the 2022 Senior Notes permit redemption prior to their maturity. The indenture under which the 2022 Senior Notes were issued contains covenants that impose conditions on Alleghany’s ability to create liens on, or engage in sales of, the capital stock of AIHL, TransRe or RSUI. The 2022 Senior Notes were issued at approximately 99.9 percent of par, resulting in proceeds after underwriting discount, commissions and other expenses of $396.0 million, and an effective yield of approximately 5.05 percent. Approximately $3.6 million of underwriting discount, commissions and other expenses were recorded as deferred charges, which are amortized over the life of the 2022 Senior Notes.
On September 20, 2010, Alleghany completed a public offering of $300.0 million aggregate principal amount of its 5.625% senior notes due on September 15, 2020 (the “2020 Senior Notes”). The 2020 Senior Notes are unsecured and unsubordinated general obligations of Alleghany. Interest on the 2020 Senior Notes is payable
147
Table of Contents
semi-annually on March 15 and September 15 of each year. The terms of the 2020 Senior Notes permit redemption prior to their maturity. The indenture under which the 2020 Senior Notes were issued contains covenants that impose conditions on Alleghany’s ability to create liens on, or engage in sales of, the capital stock of AIHL or RSUI. The 2020 Senior Notes were issued at approximately 99.6 percent of par, resulting in proceeds after underwriting discount, commissions and other expenses of $298.9 million, and an effective yield of approximately 5.67 percent. Approximately $2.8 million of underwriting discount, commissions and other expenses were recorded as deferred charges, which are amortized over the life of the 2020 Senior Notes.
(b) TransRe Senior Notes
On December 14, 2005, TransRe completed a public offering of $750.0 million aggregate principal amount of its 2015 Senior Notes. Prior to the TransRe Acquisition Date, a portion of the 2015 Senior Notes was repurchased by Old TransRe. On October 15, 2014, TransRe redeemed $300.0 million aggregate principal amount of the 2015 Senior Notes for $324.4 million, consisting of the $300.0 million aggregate principal amount redeemed, $18.6 million of redemption premium and $5.8 million of accrued and unpaid interest to the date of redemption. Of the $324.4 million redemption amount, $297.3 million was funded by a capital contribution from Alleghany primarily using the $294.3 million of net proceeds from Alleghany’s issuance of the 2044 Senior Notes. As a result of this early extinguishment of debt, TransRe recorded a realized loss, before tax, of $9.4 million in 2014. As of December 31, 2014, the outstanding principal amount of the 2015 Senior Notes was $367.0 million.
On November 23, 2009, TransRe completed a public offering of $350.0 million aggregate principal amount of its 8.00% senior notes due on November 30, 2039 (the “2039 Senior Notes”). The TransRe Senior Notes, consisting of the 2015 Senior Notes and the 2039 Senior Notes, are unsecured and unsubordinated general obligations of TransRe and are not guaranteed by Alleghany. Interest on each issuance of TransRe Senior Notes is payable semi-annually. The terms of the TransRe Senior Notes permit redemption prior to their maturity. The indentures under which the TransRe Senior Notes were issued contain covenants that impose conditions on TransRe’s ability to create liens on, or engage in sales of, the capital stock of certain of its subsidiaries, including Transatlantic Reinsurance Company, TransRe Zurich Ltd. or Fair American Insurance and Reinsurance Company. As of the TransRe Acquisition Date, the TransRe Senior Notes were recorded at their estimated fair value of $1.1 billion, and resulted in an effective yield of approximately 3.0 percent for the 2015 Senior Notes and 6.9 percent for the 2039 Senior Notes. See Note 2 for additional information on TransRe and Note 3 for fair value information.
9. Income Taxes
Income tax expense (benefit) consists of the following:
| Federal | State | Foreign | Total | |||||||||||||
| (in millions) | ||||||||||||||||
| Year ended December 31, 2014 |
||||||||||||||||
| Current |
$ | 115.4 | $ | 4.9 | $ | 118.2 | $ | 238.5 | ||||||||
| Deferred |
12.9 | 0.4 | — | 13.3 | ||||||||||||
|
|
|
|
|
|
|
|
|
|||||||||
| $ | 128.3 | $ | 5.3 | $ | 118.2 | $ | 251.8 | |||||||||
|
|
|
|
|
|
|
|
|
|||||||||
| Year ended December 31, 2013 |
||||||||||||||||
| Current |
$ | 68.4 | $ | 4.6 | $ | 62.7 | $ | 135.7 | ||||||||
| Deferred |
90.4 | (0.2 | ) | — | 90.2 | |||||||||||
|
|
|
|
|
|
|
|
|
|||||||||
| $ | 158.8 | $ | 4.4 | $ | 62.7 | $ | 225.9 | |||||||||
|
|
|
|
|
|
|
|
|
|||||||||
| Year ended December 31, 2012 |
||||||||||||||||
| Current |
$ | 107.8 | $ | 1.2 | $ | 0.4 | $ | 109.4 | ||||||||
| Deferred |
(92.9 | ) | 0.6 | — | (92.3 | ) | ||||||||||
|
|
|
|
|
|
|
|
|
|||||||||
| $ | 14.9 | $ | 1.8 | $ | 0.4 | $ | 17.1 | |||||||||
|
|
|
|
|
|
|
|
|
|||||||||
148
Table of Contents
The difference between the federal income tax rate and the effective income tax rate is as follows:
| Year Ended December 31, | ||||||||||||
| 2014 | 2013 | 2012 | ||||||||||
| Federal income tax rate |
35.0 | % | 35.0 | % | 35.0 | % | ||||||
| Foreign tax credit and other adjustments |
— | (0.5 | ) | — | ||||||||
| Income subject to dividends-received deduction |
(1.3 | ) | (0.9 | ) | (0.5 | ) | ||||||
| Tax-exempt interest |
(6.5 | ) | (8.1 | ) | (8.9 | ) | ||||||
| State taxes, net of federal tax benefit |
0.4 | 0.3 | 0.1 | |||||||||
| Non-taxable gain on bargain purchase |
— | — | (24.1 | ) | ||||||||
| Non-deductible transaction costs |
— | — | 1.0 | |||||||||
| Prior period adjustment |
0.1 | 0.6 | — | |||||||||
| Other, net |
(0.7 | ) | — | (0.2 | ) | |||||||
|
|
|
|
|
|
|
|||||||
| Effective tax rate |
27.0 | % | 26.4 | % | 2.4 | % | ||||||
|
|
|
|
|
|
|
|||||||
The slightly higher effective tax rate in 2014 compared to 2013 primarily reflects higher taxable income in 2014 relative to a fairly steady level of tax-exempt interest income arising from municipal bond securities.
The higher effective tax rate in 2013 primarily reflects the absence of a gain on bargain purchase, which had a significant impact in 2012. The gain on bargain purchase resulted in a significant increase in earnings before income taxes without a corresponding increase in income taxes. The impact of the gain on bargain purchase on the effective tax rate in 2012 was partially offset by the impact of certain non-deductible Transaction Costs in 2012, which resulted in losses before income taxes without a corresponding decrease in income taxes.
The tax effects of temporary differences that give rise to the deferred tax assets and deferred tax liabilities as of December 31, 2014 and 2013 are as follows:
| As of December 31, | ||||||||
| 2014 | 2013 | |||||||
| (in millions) | ||||||||
| Deferred tax assets: |
||||||||
| Loss and LAE reserves |
$ | 288.9 | $ | 334.1 | ||||
| Minimum tax credit carry forward |
146.3 | 144.4 | ||||||
| Compensation accruals |
149.6 | 131.5 | ||||||
| Unearned premiums |
116.6 | 112.3 | ||||||
| OTTI losses |
20.8 | 12.2 | ||||||
| Foreign tax credit carry forward |
8.4 | — | ||||||
| State net operating loss carry forward |
16.6 | 15.8 | ||||||
| Other |
139.9 | 102.7 | ||||||
|
|
|
|
|
|||||
| Gross deferred tax assets before valuation allowance |
887.1 | 853.0 | ||||||
| Valuation allowance |
(16.6) | (15.8) | ||||||
|
|
|
|
|
|||||
| Gross deferred tax assets |
870.5 | 837.2 | ||||||
|
|
|
|
|
|||||
| Deferred tax liabilities: |
||||||||
| Net unrealized gains on investments |
239.1 | 123.4 | ||||||
| Deferred acquisition costs |
123.6 | 117.2 | ||||||
| Purchase accounting adjustments |
60.1 | 67.9 | ||||||
| Foreign tax credit carry forward |
— | 9.3 | ||||||
| Other |
58.1 | 49.6 | ||||||
|
|
|
|
|
|||||
| Gross deferred tax liabilities |
480.9 | 367.4 | ||||||
|
|
|
|
|
|||||
| Net deferred tax assets |
$ | 389.6 | $ | 469.8 | ||||
|
|
|
|
|
|||||
149
Table of Contents
A valuation allowance is provided against deferred tax assets when, in the opinion of management, it is more likely than not that a portion of the deferred tax asset will not be realized. Alleghany has recognized $16.6 million of deferred tax assets for certain state net operating and capital loss carryovers. A valuation allowance of $16.6 million has been established against these deferred tax assets as Alleghany does not currently anticipate it will generate sufficient income in these states to absorb such loss carryovers.
The Internal Revenue Code provides for limits on the utilization of certain tax benefits following a corporate ownership change. Upon the closing of the merger, TransRe was subject to an annual limitation on its ability to use its foreign tax credit carryforwards and its minimum tax credit carryforwards. The total amount of foreign tax credit carryforwards and minimum tax credit carryforwards that were available prior to the merger are not diminished by this provision. The limitation provides for an annual limit on the amount of the carryforwards that can be used each year. The unused carryovers are available to be used in subsequent years, subject to the annual limitation. The annual limitation is estimated at approximately $42.7 million.
Alleghany’s income tax returns are not currently under examination by the Internal Revenue Service. TransRe’s income tax returns, which all relate to periods prior to the merger with Alleghany, are currently under examination by the Internal Revenue Service. The following table lists the tax years of Alleghany and TransRe tax returns that remain subject to examination by major tax jurisdictions as of December 31, 2014:
| Major Tax Jurisdiction |
Open Tax Years | |
| Australia |
2009-2013 | |
| Canada |
2010-2013 | |
| France |
2009-2013 | |
| Germany |
2009-2013 | |
| Japan |
2010-2013 | |
| Switzerland |
2013 | |
| U.K |
2013 | |
| U.S. |
2007-2013 |
Alleghany filed amended Federal income tax returns and applied for Federal income tax refunds for the tax years 2007 to 2012 related to TransRe’s foreign taxes. To the extent a requested amended return relates to a tax year where the statute of limitations has expired, the filing of the amended return will cause that tax year to re-open.
Alleghany believes that, as of December 31, 2014, it had no material uncertain tax positions. Interest and penalties relating to unrecognized tax expenses (benefits) are recognized in income tax expense, when applicable. There was no liability for interest or penalties accrued for uncertain tax positions as of December 31, 2014.
10. Stockholders’ Equity
(a) Common Stock Repurchases
In October 2012, the Alleghany Board of Directors authorized a program to repurchase shares of Common Stock, at such times and at prices as management determines advisable, up to an aggregate of $300.0 million (the “2012 Repurchase Program”). In July 2014, the Alleghany Board of Directors authorized, upon the completion of the 2012 Repurchase Program, the repurchase of additional shares of Common Stock, at such times and at prices as management may determine advisable, up to an aggregate of $350.0 million (the “2014 Repurchase Program”). As of December 31, 2014, Alleghany completed the 2012 Repurchase Program, and had repurchased approximately $58.6 million of shares under the 2014 Repurchase Program.
Pursuant to the Alleghany Board of Directors authorizations, Alleghany repurchased shares of Common Stock in 2014, 2013 and 2012 as follows:
| Year Ended December 31, | ||||||||||||
| 2014 | 2013 | 2012 | ||||||||||
| Shares repurchased |
732,391 | 113,160 | 53,346 | |||||||||
| Cost of shares repurchased (in millions) |
$ | 300.5 | $ | 40.4 | $ | 17.8 | ||||||
| Average price per share repurchased |
$ | 410.27 | $ | 356.92 | $ | 333.08 | ||||||
150
Table of Contents
(b) Accumulated Other Comprehensive Income
The following table presents a reconciliation of the changes during 2014 and 2013 in accumulated other comprehensive income attributable to Alleghany stockholders:
| Unrealized Appreciation of Investments |
Unrealized Currency Translation Adjustment |
Retirement Plans |
Total | |||||||||||||
| (in millions) | ||||||||||||||||
| Balance as of January 1, 2014 |
$ | 238.4 | $ | (49.3) | $ | (2.2) | $ | 186.9 | ||||||||
| Other comprehensive income, net of tax: |
||||||||||||||||
| Other comprehensive income before reclassifications |
360.1 | (39.9) | (10.4) | 309.8 | ||||||||||||
| Reclassifications from accumulated other comprehensive income |
(143.1) | — | — | (143.1) | ||||||||||||
|
|
|
|
|
|
|
|
|
|||||||||
| Total |
217.0 | (39.9) | (10.4) | 166.7 | ||||||||||||
|
|
|
|
|
|
|
|
|
|||||||||
| Balance as of December 31, 2014 |
$ | 455.4 | $ | (89.2) | $ | (12.6) | $ | 353.6 | ||||||||
|
|
|
|
|
|
|
|
|
|||||||||
| Unrealized Appreciation of Investments |
Unrealized Currency Translation Adjustment |
Retirement Plans |
Total | |||||||||||||
| (in millions) | ||||||||||||||||
| Balance as of January 1, 2013 |
$ | 263.3 | $ | (13.4) | $ | 0.6 | $ | 250.5 | ||||||||
| Other comprehensive income, net of tax: |
||||||||||||||||
| Other comprehensive income before reclassifications |
70.2 | (35.9) | (2.8) | 31.5 | ||||||||||||
| Reclassifications from accumulated other comprehensive income |
(95.1) | — | — | (95.1) | ||||||||||||
|
|
|
|
|
|
|
|
|
|||||||||
| Total |
(24.9) | (35.9) | (2.8) | (63.6) | ||||||||||||
|
|
|
|
|
|
|
|
|
|||||||||
| Balance as of December 31, 2013 |
$ | 238.4 | $ | (49.3) | $ | (2.2) | $ | 186.9 | ||||||||
|
|
|
|
|
|
|
|
|
|||||||||
Reclassifications out of accumulated other comprehensive income attributable to Alleghany stockholders during 2014 and 2013 were as follows:
| Year Ended December 31, | ||||||||||
| Accumulated Other Comprehensive Income Component |
Line in Consolidated Statement of Earnings | 2014 | 2013 | |||||||
| (in millions) | ||||||||||
| Unrealized appreciation of investments: |
Net realized capital gains(1) |
$ | 256.5 | $ | 190.3 | |||||
| Other than temporary impairment losses |
(36.3) | (44.0) | ||||||||
| Income taxes |
(77.1) | (51.2) | ||||||||
|
|
|
|
|
|||||||
| Total reclassifications: |
Net earnings | $ | 143.1 | $ | 95.1 | |||||
|
|
|
|
|
|||||||
| (1) | For 2014, excludes a $9.4 million realized capital loss on the early redemption of the 2015 Senior Notes (see Note 8(b) for additional information). For 2013, excludes a $46.8 million realized capital gain related to the sale of Homesite, and a $5.0 million realized capital loss related to a non-cash impairment charge related to certain finite-lived intangible assets at CapSpecialty. |
(c) Regulations and Dividend Restrictions
As of December 31, 2014, approximately $6.3 billion of Alleghany’s total equity of $7.5 billion was unavailable for dividends or advances to Alleghany from its subsidiaries. The remaining $1.2 billion was available for dividends or advances to Alleghany from its subsidiaries, or was retained at the Alleghany parent-level, and as such, was available to pay dividends to Alleghany’s stockholders as of December 31, 2014.
Alleghany’s reinsurance and insurance subsidiaries are subject to various regulatory restrictions that limit the maximum amount of dividends available to be paid by them without prior approval of insurance regulatory authorities. The operating subsidiaries of TransRe and RSUI have the ability to pay dividends without prior regulatory approval in 2015.
151
Table of Contents
In 2014, TRC paid dividends of $400.0 million to TransRe, of which $300.0 million was in turn paid to Alleghany. In 2013, TRC paid dividends of $200.0 million to TransRe, of which $150.0 million was in turn paid to Alleghany. TransRe’s operating subsidiaries could pay additional dividends without regulatory approval based on statutory surplus. As of December 31, 2014, a maximum of $78.6 million was available for dividends without prior approval of the New York State Department of Financial Services. The maximum is calculated based on 10 percent of statutory surplus less dividends paid in the prior twelve months and is recalculated on a rolling basis throughout the year.
TransRe’s operations are regulated in various jurisdictions with respect to currency, amount and type of security deposits, amount and type of reserves and amount and type of local investment. Regulations governing constitution of technical reserves and remittance balances in some countries may hinder remittance of profits and repatriation of assets. International operations and assets held abroad may be adversely affected by political and other developments in foreign countries, including possible tax changes, nationalization and changes in regulatory policy, as well as by consequences of hostilities and unrest. The risks of such occurrences and their overall effect upon TransRe vary from country to country and cannot easily be predicted.
A summary of dividends paid to AIHL by its operating subsidiaries in 2014, 2013 and 2012 follows:
| Year Ended December 31, | ||||||||||||
| 2014 | 2013 | 2012 | ||||||||||
| (in millions) | ||||||||||||
| RSUI |
$ | 225.0 | $ | 100.0 | $ | — | ||||||
| CapSpecialty |
— | 15.0 | 15.0 | |||||||||
|
|
|
|
|
|
|
|||||||
| Total |
$ | 225.0 | $ | 115.0 | $ | 15.0 | ||||||
|
|
|
|
|
|
|
|||||||
AIHL’s insurance operating subsidiaries could also pay additional dividends without regulatory approval based on statutory surplus. As of December 31, 2014, of the aggregate total equity of AIHL’s operating subsidiaries of $2.0 billion, a maximum of $9.7 million was available for dividends without prior approval of the applicable regulatory authorities. The maximum for each entity is calculated based on the applicable statute, and in the case of RSUI’s insurance operating subsidiaries, which accounts for the majority of dividend capacity for AIHL, is calculated based on 10 percent of statutory surplus less dividends paid in the prior twelve months and is recalculated on a rolling basis throughout the year.
The statutory net income of Alleghany’s reinsurance and insurance subsidiaries was $786.5 million and $836.9 million for the years ended December 31, 2014 and 2013, respectively. As of December 31, 2014 and 2013, the combined statutory capital and surplus of Alleghany’s reinsurance and insurance subsidiaries was $6.6 billion and $6.5 billion, respectively. As of December 31, 2014, the amount of statutory capital and surplus necessary to satisfy regulatory requirements was not significant in relation to actual statutory capital and surplus.
152
Table of Contents
11. Earnings Per Share of Common Stock
The following is a reconciliation of the earnings and share data used in the basic and diluted earnings per share computations for 2014, 2013 and 2012:
| Year Ended December 31, | ||||||||||||
| 2014 | 2013 | 2012 | ||||||||||
| (in millions, except share amounts) | ||||||||||||
| Net earnings available to Alleghany stockholders |
$ | 679.2 | $ | 628.4 | $ | 702.2 | ||||||
| Effect of dilutive securities |
— | — | — | |||||||||
|
|
|
|
|
|
|
|||||||
| Income available to common stockholders for diluted earnings per share |
$ | 679.2 | $ | 628.4 | $ | 702.2 | ||||||
|
|
|
|
|
|
|
|||||||
| Weighted average common shares outstanding applicable to basic earnings per share |
16,405,388 | 16,786,608 | 15,441,578 | |||||||||
| Effect of dilutive securities |
— | — | — | |||||||||
|
|
|
|
|
|
|
|||||||
| Adjusted weighted average common shares outstanding applicable to diluted earnings per share |
16,405,388 | 16,786,608 | 15,441,578 | |||||||||
|
|
|
|
|
|
|
|||||||
72,528, 73,072 and 57,981 contingently issuable shares were potentially available during 2014, 2013 and 2012, respectively, but were not included in the computations of diluted earnings per share because the impact was anti-dilutive to the earnings per share calculation.
12. Commitments and Contingencies
(a) Legal Proceedings
Certain of Alleghany’s subsidiaries are parties to pending litigation and claims in connection with the ordinary course of their businesses. Each such subsidiary makes provisions for estimated losses to be incurred in such litigation and claims, including legal costs. In the opinion of management, such provisions are adequate.
Settlement by TransRe with AIG
On January 26, 2012, TransRe reached an agreement with AIG to settle and mediate a dispute previously in arbitration, which arose as a result of losses claimed by TransRe from its participation in a securities lending program administered and managed by AIG. On July 20, 2012, in accordance with the agreement between the parties, a mediator awarded TransRe a settlement payment of $75.0 million with respect to the securities lending claim. In connection with its accounting for the acquisition of TransRe, Alleghany established an asset of $36.0 million, representing an estimate based on the minimum recovery previously agreed to by the parties, net of estimated legal costs. A pre-tax net benefit of $23.5 million resulting from this settlement was recorded as other income in 2012, representing the portion of the settlement payment above such minimum recovery, net of additional estimated legal costs.
(b) Indemnification Obligations
On July 14, 2005 (the “Closing Date”), Alleghany completed the sale of its world-wide industrial minerals business, World Minerals, Inc. (“World Minerals”), to Imerys USA, Inc. (the “Purchaser”), a wholly-owned subsidiary of Imerys, S.A., pursuant to a Stock Purchase Agreement, dated as of May 19, 2005, by and among the Purchaser, Imerys, S.A. and Alleghany (the “Stock Purchase Agreement”). Pursuant to the Stock Purchase Agreement, Alleghany undertook certain indemnification obligations, including a general indemnification for breaches of representations and warranties set forth in the Stock Purchase Agreement, and a special indemnification (the “Products Liability Indemnification”) related to products liability claims arising from events that occurred during pre-closing periods, including the period of Alleghany ownership (the “Alleghany Period”). Under the terms of the Stock Purchase Agreement, with respect to products liability claims arising in respect of events occurring during the period prior to the Alleghany Period, Alleghany will provide indemnification at a rate of 100.0 percent for the first $100.0 million of losses arising from such claims, and at a rate of 50.0 percent
153
Table of Contents
for the next $100.0 million of such losses, so that Alleghany’s maximum indemnification obligation in respect of products liability claims relating to such period of time is $150.0 million. This indemnification obligation will expire on July 31, 2016. With respect to the Alleghany Period, based on its historical experience and other analyses, in July 2005, Alleghany established a $0.6 million reserve in connection with the Products Liability Indemnification for the Alleghany Period. Such reserve was approximately $0.1 million as of both December 31, 2014 and 2013. The Stock Purchase Agreement provides that Alleghany has no responsibility for products liability claims arising in respect of events occurring after the Closing Date, and that any products liability claims involving both pre-closing and post-closing periods will be apportioned on an equitable basis.
(c) Leases
Alleghany and its subsidiaries lease certain facilities, furniture and equipment under long-term lease agreements. In addition, certain land, office space and equipment are leased under non-cancelable operating leases that expire at various dates through 2029. Rent expense was $33.8 million, $28.8 million and $21.2 million in 2014, 2013 and 2012, respectively. The aggregate minimum payments under operating leases with initial or remaining terms of more than one year as of December 31, 2014 were as follows:
| Year |
Aggregate Minimum Lease Payments |
|||
| (in millions) | ||||
| 2015 |
$ | 34.8 | ||
| 2016 |
30.4 | |||
| 2017 |
27.5 | |||
| 2018 |
26.6 | |||
| 2019 |
24.9 | |||
| 2020 and thereafter |
135.7 | |||
(d) Asbestos-Related Illness and Environmental Impairment Exposure
Loss and LAE include amounts for risks relating to asbestos-related illness and environmental impairment. As of December 31, 2014 and 2013, such gross and net reserves were as follows:
| December 31, 2014 | December 31, 2013 | |||||||||||||||
| Gross | Net | Gross | Net | |||||||||||||
| (in millions) | ||||||||||||||||
| TransRe |
$ | 593.5 | $ | 438.3 | $ | 583.8 | $ | 431.9 | ||||||||
| CapSpecialty |
9.2 | 9.1 | 10.4 | 10.3 | ||||||||||||
|
|
|
|
|
|
|
|
|
|||||||||
| Total |
$ | 602.7 | $ | 447.4 | $ | 594.2 | $ | 442.2 | ||||||||
|
|
|
|
|
|
|
|
|
|||||||||
The reserves carried for such claims, including the incurred but not reported portion, are based upon known facts and current law at the respective balance sheet dates. However, significant uncertainty exists in determining the amount of ultimate liability for asbestos-related illness and environmental impairment losses, particularly for those occurring in 1985 and prior, which represents the majority of TransRe’s asbestos-related illness and environmental impairment reserves. This uncertainty is due to inconsistent and changing court resolutions and judicial interpretations with respect to underlying policy intent and coverage and uncertainties as to the allocation of responsibility for resultant damages, among other reasons. Further, possible future changes in statutes, laws, regulations, theories of liability and other factors could have a material effect on these liabilities and, accordingly, future earnings.
13. Segments of Business
(a) Overview
Alleghany’s segments are reported in a manner consistent with the way management evaluates the businesses. As such, Alleghany classifies its business into two reportable segments – reinsurance and insurance. In addition, reinsurance and insurance underwriting activities are evaluated separately from investment and corporate activities. Net realized capital gains and OTTI losses are not considered relevant in evaluating investment performance on an annual basis. Segment accounting policies are described in Note 1.
154
Table of Contents
The reinsurance segment consists of property and casualty reinsurance operations conducted by TransRe’s reinsurance operating subsidiaries and is further reported by major product lines – property and casualty & other. TransRe provides property and casualty reinsurance to insurers and reinsurers through brokers and on a direct basis to ceding companies. TransRe also writes a modest amount of insurance business, which is included in the reinsurance segment. Approximately half of the premiums earned by TransRe’s operations are generated by offices located in Canada, Europe, Asia, Australia, Africa and those serving Latin America and the Caribbean. Although the majority of the premiums earned by these offices typically relate to the regions where they are located, a significant portion may be derived from other regions of the world, including the U.S. In addition, although a significant portion of the assets and liabilities of these foreign offices generally relate to the countries where ceding companies and reinsurers are located, most investments are located in the country of domicile of these offices.
The insurance segment consists of property and casualty insurance operations conducted in the U.S. by AIHL through its insurance operating subsidiaries RSUI, CapSpecialty and PacificComp. RSUI also writes a modest amount of assumed reinsurance business, which is included in the insurance segment.
The primary components of corporate activities are Alleghany Properties, SORC, Alleghany’s investments in Homesite (prior to its sale on December 31, 2013) and ORX and other activities at the parent level. Beginning April 26, 2012, August 30, 2013 and July 31, 2014, corporate activities also includes the operating results of Bourn & Koch, Kentucky Trailer and Alleghany’s investment in Jazwares, respectively.
In addition, corporate activities include interest expense associated with the Alleghany Senior Notes, whereas interest expense associated with the TransRe Senior Notes is included in “Total Segments.”
(b) Results
Segment results for Alleghany’s two reportable segments and for corporate activities for 2014, 2013 and 2012 (which include TransRe from the TransRe Acquisition Date through December 31, 2012) are shown in the tables below:
| Reinsurance Segment | Insurance Segment | |||||||||||||||||||||||||||||||||||||||
| Year Ended |
Property | Casualty & other(1) |
Total | RSUI | Cap Specialty |
Pacific Comp(2) |
Total | Total Segments |
Corporate Activities(3) |
Consolidated | ||||||||||||||||||||||||||||||
| (in millions) | ||||||||||||||||||||||||||||||||||||||||
| Gross premiums written |
$ | 1,205.4 | $ | 2,394.7 | $ | 3,600.1 | $ | 1,242.1 | $ | 212.7 | $ | 70.5 | $ | 1,525.3 | $ | 5,125.4 | $ | (28.8 | ) | $ | 5,096.6 | |||||||||||||||||||
| Net premiums written |
1,073.4 | 2,336.7 | 3,410.1 | 825.5 | 192.4 | 69.5 | 1,087.4 | 4,497.5 | — | 4,497.5 | ||||||||||||||||||||||||||||||
| Net premiums earned |
1,048.6 | 2,282.1 | 3,330.7 | 828.2 | 184.4 | 67.3 | 1,079.9 | 4,410.6 | — | 4,410.6 | ||||||||||||||||||||||||||||||
| Net loss and LAE |
423.2 | 1,486.0 | 1,909.2 | 427.3 | 103.0 | 55.0 | 585.3 | 2,494.5 | — | 2,494.5 | ||||||||||||||||||||||||||||||
| Commissions, brokerage and other underwriting expenses(4) |
319.3 | 757.2 | 1,076.5 | 220.8 | 92.0 | 32.0 | 344.8 | 1,421.3 | — | 1,421.3 | ||||||||||||||||||||||||||||||
|
|
|
|
|
|
|
|
|
|
|
|
|
|
|
|
|
|
|
|
|
|||||||||||||||||||||
| Underwriting profit (loss)(5) |
$ | 306.1 | $ | 38.9 | $ | 345.0 | $ | 180.1 | $ | (10.6 | ) | $ | (19.7 | ) | $ | 149.8 | 494.8 | — | 494.8 | |||||||||||||||||||||
|
|
|
|
|
|
|
|
|
|
|
|
|
|
|
|||||||||||||||||||||||||||
| Net investment income |
|
448.9 | 11.0 | 459.9 | ||||||||||||||||||||||||||||||||||||
| Net realized capital gains |
|
230.0 | 17.1 | 247.1 | ||||||||||||||||||||||||||||||||||||
| Other than temporary impairment losses |
|
(36.3 | ) | — | (36.3 | ) | ||||||||||||||||||||||||||||||||||
| Gain on bargain purchase |
|
— | — | — | ||||||||||||||||||||||||||||||||||||
| Other income |
|
4.0 | 146.5 | 150.5 | ||||||||||||||||||||||||||||||||||||
| Other operating expenses |
|
85.7 | 167.0 | 252.7 | ||||||||||||||||||||||||||||||||||||
| Corporate administration |
|
1.3 | 45.8 | 47.1 | ||||||||||||||||||||||||||||||||||||
| Amortization of intangible assets |
|
(6.1 | ) | 0.4 | (5.7 | ) | ||||||||||||||||||||||||||||||||||
| Interest expense |
|
46.8 | 43.2 | 90.0 | ||||||||||||||||||||||||||||||||||||
|
|
|
|
|
|
|
|||||||||||||||||||||||||||||||||||
| Earnings (losses) before income taxes |
|
$ | 1,013.7 | $ | (81.8 | ) | $ | 931.9 | ||||||||||||||||||||||||||||||||
|
|
|
|
|
|
|
|||||||||||||||||||||||||||||||||||
155
Table of Contents
| Reinsurance Segment | Insurance Segment | |||||||||||||||||||||||||||||||||||||||
| Year Ended December 31, 2013 |
Property | Casualty & other(1) |
Total | RSUI | Cap Specialty |
Pacific Comp(2) |
Total | Total Segments |
Corporate Activities(3) |
Consolidated | ||||||||||||||||||||||||||||||
| (in millions) | ||||||||||||||||||||||||||||||||||||||||
| Gross premiums written |
$ | 1,129.9 | $ | 2,293.1 | $ | 3,423.0 | $ | 1,261.6 | $ | 182.8 | $ | 42.0 | $ | 1,486.4 | $ | 4,909.4 | $ | (23.1 | ) | $ | 4,886.3 | |||||||||||||||||||
| Net premiums written |
988.4 | 2,259.6 | 3,248.0 | 827.2 | 171.4 | 40.8 | 1,039.4 | 4,287.4 | — | 4,287.4 | ||||||||||||||||||||||||||||||
| Net premiums earned |
989.2 | 2,289.5 | 3,278.7 | 764.0 | 157.6 | 38.9 | 960.5 | 4,239.2 | — | 4,239.2 | ||||||||||||||||||||||||||||||
| Net loss and LAE |
316.5 | 1,609.9 | 1,926.4 | 404.2 | 104.5 | 44.2 | 552.9 | 2,479.3 | — | 2,479.3 | ||||||||||||||||||||||||||||||
| Commissions, brokerage and other underwriting expenses(4) |
293.3 | 725.0 | 1,018.3 | 208.9 | 84.1 | 27.9 | 320.9 | 1,339.2 | — | 1,339.2 | ||||||||||||||||||||||||||||||
|
|
|
|
|
|
|
|
|
|
|
|
|
|
|
|
|
|
|
|
|
|||||||||||||||||||||
| Underwriting profit (loss)(5) |
$ | 379.4 | $ | (45.4 | ) | $ | 334.0 | $ | 150.9 | $ | (31.0 | ) | $ | (33.2 | ) | $ | 86.7 | 420.7 | — | 420.7 | ||||||||||||||||||||
|
|
|
|
|
|
|
|
|
|
|
|
|
|
|
|||||||||||||||||||||||||||
| Net investment income |
|
415.2 | 50.5 | 465.7 | ||||||||||||||||||||||||||||||||||||
| Net realized capital gains |
|
197.7 | 34.4 | 232.1 | ||||||||||||||||||||||||||||||||||||
| Other than temporary impairment losses |
|
(44.0 | ) | — | (44.0 | ) | ||||||||||||||||||||||||||||||||||
| Gain on bargain purchase |
|
— | — | — | ||||||||||||||||||||||||||||||||||||
| Other income |
|
1.8 | 76.9 | 78.7 | ||||||||||||||||||||||||||||||||||||
| Other operating expenses |
|
83.7 | 81.2 | 164.9 | ||||||||||||||||||||||||||||||||||||
| Corporate administration |
|
— | 36.1 | 36.1 | ||||||||||||||||||||||||||||||||||||
| Amortization of intangible assets |
|
10.0 | 0.2 | 10.2 | ||||||||||||||||||||||||||||||||||||
| Interest expense |
|
49.4 | 37.4 | 86.8 | ||||||||||||||||||||||||||||||||||||
|
|
|
|
|
|
|
|||||||||||||||||||||||||||||||||||
| Earnings before income taxes |
|
$ | 848.3 | $ | 6.9 | $ | 855.2 | |||||||||||||||||||||||||||||||||
|
|
|
|
|
|
|
|||||||||||||||||||||||||||||||||||
| Reinsurance Segment | Insurance Segment | |||||||||||||||||||||||||||||||||||||||
| Year Ended December 31, |
Property | Casualty & other(1) |
Total | RSUI | Cap Specialty |
Pacific Comp(2) |
Total | Total Segments |
Corporate Activities(3) |
Consolidated | ||||||||||||||||||||||||||||||
| (in millions) | ||||||||||||||||||||||||||||||||||||||||
| Gross premiums written |
$ | 966.2 | $ | 1,974.0 | $ | 2,940.2 | $ | 1,123.4 | $ | 158.1 | $ | 19.4 | $ | 1,300.9 | $ | 4,241.1 | $ | (18.2 | ) | $ | 4,222.9 | |||||||||||||||||||
| Net premiums written |
896.9 | 1,943.8 | 2,840.7 | 715.1 | 149.1 | 19.0 | 883.2 | 3,723.9 | — | 3,723.9 | ||||||||||||||||||||||||||||||
| Net premiums earned |
900.9 | 2,015.0 | 2,915.9 | 655.8 | 144.6 | 16.7 | 817.1 | 3,733.0 | — | 3,733.0 | ||||||||||||||||||||||||||||||
| Net loss and LAE |
566.4 | 1,491.7 | 2,058.1 | 466.2 | 85.9 | 20.1 | 572.2 | 2,630.3 | — | 2,630.3 | ||||||||||||||||||||||||||||||
| Commissions, brokerage and other underwriting expenses(4) |
191.1 | 400.0 | 591.1 | 184.3 | 79.2 | 27.8 | 291.3 | 882.4 | — | 882.4 | ||||||||||||||||||||||||||||||
|
|
|
|
|
|
|
|
|
|
|
|
|
|
|
|
|
|
|
|
|
|||||||||||||||||||||
| Underwriting profit (loss)(5) |
$ | 143.4 | $ | 123.3 | $ | 266.7 | $ | 5.3 | $ | (20.5 | ) | $ | (31.2 | ) | $ | (46.4 | ) | 220.3 | — | 220.3 | ||||||||||||||||||||
|
|
|
|
|
|
|
|
|
|
|
|
|
|
|
|||||||||||||||||||||||||||
| Net investment income |
|
317.5 | (4.5 | ) | 313.0 | |||||||||||||||||||||||||||||||||||
| Net realized capital gains |
|
117.9 | 40.0 | 157.9 | ||||||||||||||||||||||||||||||||||||
| Other than temporary impairment losses |
|
(2.9 | ) | — | (2.9 | ) | ||||||||||||||||||||||||||||||||||
| Gain on bargain purchase |
|
— | 494.9 | 494.9 | ||||||||||||||||||||||||||||||||||||
| Other income |
|
26.1 | 31.2 | 57.3 | ||||||||||||||||||||||||||||||||||||
| Other operating expenses |
|
89.2 | 34.5 | 123.7 | ||||||||||||||||||||||||||||||||||||
| Corporate administration |
|
— | 75.8 | 75.8 | ||||||||||||||||||||||||||||||||||||
| Amortization of intangible assets |
|
253.3 | — | 253.3 | ||||||||||||||||||||||||||||||||||||
| Interest expense |
|
40.8 | 27.6 | 68.4 | ||||||||||||||||||||||||||||||||||||
|
|
|
|
|
|
|
|||||||||||||||||||||||||||||||||||
| Earnings before income taxes |
|
$ | 295.6 | $ | 423.7 | $ | 719.3 | |||||||||||||||||||||||||||||||||
|
|
|
|
|
|
|
|||||||||||||||||||||||||||||||||||
| (1) | Primarily consists of the following assumed reinsurance lines of business: directors’ and officers’ liability; errors and omissions liability; general liability; medical malpractice; ocean marine and aviation; auto liability; accident and health; surety; and credit. |
| (2) | Includes underwriting results of AIHL Re. |
156
Table of Contents
| (3) | Includes elimination of minor reinsurance activity between segments. |
| (4) | Includes amortization associated with deferred acquisition costs of $1,042.0 million, $973.5 million and $578.1 million for the years ended December 31, 2014, 2013 and 2012, respectively. |
| (5) | Underwriting profit represents net premiums earned less net loss and LAE and commissions, brokerage and other underwriting expenses, all as determined in accordance with GAAP, and does not include net investment income, net realized capital gains, OTTI losses, gain on bargain purchase, other income, other operating expenses, corporate administration, amortization of intangible assets or interest expense. Underwriting profit does not replace earnings before income taxes determined in accordance with GAAP as a measure of profitability. Rather, Alleghany believes that underwriting profit enhances the understanding of its segments’ operating results by highlighting net earnings attributable to their underwriting performance. Earnings before income taxes (a GAAP measure) may show a profit despite an underlying underwriting loss. Where underwriting losses persist over extended periods, a reinsurance or an insurance company’s ability to continue as an ongoing concern may be at risk. Therefore, Alleghany views underwriting profit as an important measure in the overall evaluation of performance. |
(c) Foreign operations
Information associated with Alleghany’s foreign operations, which relates to its reinsurance segment, is as follows:
| • | Foreign gross premiums written in 2014, 2013 and from the TransRe Acquisition Date through December 31, 2012 were approximately $1.7 billion, $1.6 billion and $1.5 billion, respectively. |
| • | Foreign net premiums earned in 2014, 2013 and from the TransRe Acquisition Date through December 31, 2012 were approximately $1.5 billion, $1.6 billion and $1.4 billion, respectively. The foreign country in which Alleghany generates the largest amount of premium revenues is the U.K. Net premiums earned by operations in the U.K. in 2014, 2013 and from the TransRe Acquisition Date through December 31, 2012 were $654.8 million, $661.2 million and $562.9 million, respectively. |
(d) Identifiable assets and equity
As of December 31, 2014, the identifiable assets of the reinsurance segment, insurance segment and corporate activities were $16.3 billion, $6.4 billion and $0.8 billion, respectively, of which cash and invested assets represented $14.3 billion, $4.8 billion and $0.3 billion, respectively. As of December 31, 2014, Alleghany’s equity attributable to the reinsurance segment, insurance segment and corporate activities was $5.1 billion, $2.8 billion and ($0.4) billion, respectively.
Included in corporate activities is debt associated with ACC’s operating subsidiaries. In this regard, SORC had $6.8 million of borrowings as of December 31, 2014, representing its borrowing capacity as of December 31, 2014 pursuant to a secured $250.0 million bank credit facility that was obtained in April 2014. In addition, Kentucky Trailer had $29.2 million of borrowings as of December 31, 2014 related to a mortgage loan and borrowings under its available credit facility. None of these liabilities are guaranteed by Alleghany or ACC, and they are classified as a component of other liabilities.
(e) Concentration
Three large international brokers accounted for approximately 29 percent, 22 percent and 11 percent in 2014, approximately 27 percent, 22 percent and 11 percent in 2013 and approximately 26 percent, 21 percent and 12 percent from the TransRe Acquisition Date through December 31, 2012, of gross premiums written in the reinsurance segment.
14. Long-Term Compensation Plans
(a) Parent-Level
As of December 31, 2014, Alleghany had long-term compensation plans for parent-level employees and directors. Parent-level, long-term compensation plans to current employees do not include stock options but consist only of restricted stock awards, including restricted stock units and performance share awards. Parent-level, long-term compensation payments to non-employee directors consist of annual awards of restricted stock and restricted stock units.
157
Table of Contents
Amounts recognized as compensation expense in the consolidated statements of earnings and comprehensive income with respect to long-term compensation awards under plans for parent-level employees and directors were $21.2 million, $18.7 million and $19.4 million in 2014, 2013 and 2012, respectively. The amount of related income tax benefit recognized as income in the consolidated statements of earnings and comprehensive income with respect to these plans was $7.4 million, $6.5 million and $6.8 million in 2014, 2013 and 2012, respectively. In 2014, 2013 and 2012, $4.5 million, $6.4 million and $4.9 million of Common Stock at fair market value, respectively, and $7.6 million, $16.3 million and $5.3 million of cash, respectively, was paid by Alleghany under these plans for parent-level employees and directors. As noted above, as of December 31, 2014 and December 31, 2013, all outstanding awards were accounted for under the fair-value-based method of accounting.
A summary of the parent-level, long-term compensation plans is as follows:
Director Restricted Stock Plans
The automatic annual grant to each non-employee director consists of either restricted stock or restricted stock units, at the director’s election. Awards granted to non-employee directors were not material to Alleghany’s results of operations, financial condition or cash flows for the three years ended December 31, 2014.
Alleghany Long-Term Incentive Plans
In February 2012, Alleghany adopted the 2012 Long-Term Incentive Plan (the “2012 LTIP”), which was approved by Alleghany stockholders in April 2012. Awards under the 2012 LTIP may include, but are not limited to, cash and / or shares of Common Stock, rights to receive cash and / or shares of Common Stock and options to purchase shares of Common Stock, including options intended to qualify as incentive stock options under the Internal Revenue Code, and options not intended to so qualify. Under the 2012 LTIP, the following types of awards were outstanding as of December 31, 2014:
| • | Performance Share Awards — Participants are entitled, at the end of a four-year award period, to a maximum amount equal to the value of one and one-half shares of Common Stock for each performance share issued to them based on market value on the payment date. Payouts are made provided defined levels of performance are achieved. Expenses are recorded based on changes in the fair value of the awards. The fair value is calculated based primarily on: the value of Common Stock as of the balance sheet date; the degree to which performance targets specified in the 2012 LTIP have been achieved; and the time elapsed with respect to each award period. |
| • | Restricted Share Awards — From time to time, Alleghany has awarded to certain management employees restricted shares or restricted stock units of Common Stock. These awards entitle the participants to a specified maximum amount equal to the value of one share of Common Stock for each restricted share issued to them based on the market value on the grant date, subject to certain conditions. The expense is recognized ratably over the performance period, which can be extended under certain circumstances. |
(b) TransRe Book Value Unit Plan and Mid-Term Incentive Plan
TransRe has a Book Value Unit Plan and a Mid-Term Incentive Plan (collectively, the “TransRe Plans”) for the purpose of providing incentives to key employees of TransRe. Under the TransRe Plans, book value units (“BVUs”) and mid-term incentive plan (“MTIP”) awards are issued. BVUs and MTIP awards may only be settled in cash. The fair value of each BVU is calculated as stockholder’s equity of TransRe, adjusted for certain capital transactions, divided by the adjusted number of BVUs outstanding. Pursuant to the terms of the Merger Agreement, certain Old TransRe restricted stock units held by current or former employees were converted into BVUs. BVUs have vesting dates of up to approximately the fourth anniversary of the date of grant, with converted Old TransRe restricted stock units retaining their pre-conversion vesting dates. The fair value of MTIP awards is calculated based on underwriting results compared to specified targets. MTIP awards have vesting dates of approximately the second anniversary of the date of grant. The BVUs and MTIP awards contain certain restrictions, relating to, among other things, forfeiture in the event of termination of employment and
158
Table of Contents
transferability. In 2014, 2013 and 2012, TransRe recorded $55.3 million, $52.2 million and $63.9 million, respectively, in compensation expense and a deferred tax benefit of $19.4 million, $18.3 million and $22.4 million, respectively, related to the TransRe Plans.
(c) RSUI Restricted Share Plan
RSUI has a Restricted Stock Unit Plan (the “RSUI Plan”) for the purpose of providing equity-like incentives to key employees of RSUI. Under the RSUI Plan, restricted stock units (“units”) are issued. Additional units, defined as the “Deferred Equity Pool,” were issued in 2014, 2013 and 2012 and may be created in the future if certain financial performance measures are met. Units may only be settled in cash. The fair value of each unit is calculated as stockholder’s equity of RSUI, adjusted for certain capital transactions and accumulated compensation expense recognized under the RSUI Plan, divided by the sum of RSUI common stock outstanding and the original units available under the RSUI Plan. The units vest on the fourth anniversary of the date of grant and contain certain restrictions, relating to, among other things, forfeiture in the event of termination of employment and transferability. In 2014, 2013 and 2012, RSUI recorded $28.2 million, $27.9 million and $21.0 million, respectively, in compensation expense related to the RSUI Plan. During the same periods, a deferred tax benefit of $9.9 million, $9.8 million and $7.4 million, respectively, related to the compensation expense was recorded.
(d) Other Subsidiary Plans
Long-term incentive plans exist at certain other subsidiaries for the purpose of providing equity-like incentives to key employees. The awards under such plans were not material to Alleghany’s results of operations, financial condition or cash flows for the three years ended December 31, 2014.
15. Employee Retirement Benefit Plans
(a) Overview
Alleghany and certain of its subsidiaries provide a variety of retirement benefits. Alleghany provides supplemental retirement benefits through deferred compensation programs and profit sharing plans for certain of its parent-level officers and employees. In addition, Alleghany’s subsidiaries sponsor both qualified, defined contribution retirement plans for substantially all employees, including executives, and non-qualified plans only for executives, some of which provide for voluntary salary reduction contributions by employees and matching contributions by each respective subsidiary, subject to specified limitations.
Alleghany has endorsement split-dollar life insurance policies for its parent-level officers that are effective during employment, as well as retirement. Premiums are paid by Alleghany, and death benefits are split between Alleghany and the beneficiaries of the officers. Death benefits for current employees that inure to the beneficiaries are generally equal to four times the annual salary at the time of an officer’s death. After retirement, death benefits that inure to the beneficiaries are generally equal to the annual salary of the officer as of the date of retirement.
In addition, Alleghany has defined benefit pension and, prior to September 30, 2013, retiree health plans for parent-level employees, and TransRe has, and Kentucky Trailer had, defined benefit pensions plans for certain of its employees, as further described below.
These employee retirement plans are not material to Alleghany’s results of operations, financial condition or cash flows for the three years ended December 31, 2014.
(b) Parent-Level
Alleghany has an unfunded, noncontributory defined benefit pension plan for parent-level executives and a funded, noncontributory defined benefit pension plan for parent-level employees. Prior to September 30, 2013, Alleghany also had two unfunded retiree health plans, one for parent-level executives and one for parent-level employees. On July 16, 2013, the Alleghany Board of Directors decided to: (i) freeze the benefits associated with the unfunded, noncontributory defined benefit pension plan for parent-level executives, effective December 31,
159
Table of Contents
2013; and (ii) terminate both retiree health plans, effective September 30, 2013. The funded, noncontributory defined benefit pension plan for parent-level employees is unaffected. As a result of these decisions, Alleghany recorded a pre-tax $8.8 million reduction to corporate administration expense in 2013.
The projected benefit obligations of the defined benefit pension plans as of December 31, 2014 and 2013 was $28.0 million and $21.6 million, respectively, and the related fair value of plan assets was $2.5 million and $2.4 million, respectively.
(c) TransRe
TransRe has an unfunded, noncontributory defined benefit plan and a funded noncontributory defined benefit plan for certain of its employees in the U.S. Benefits under TransRe’s defined benefit plans were frozen as of December 31, 2009. As of December 31, 2014 and 2013, the projected benefit obligation was $66.2 million and $49.8 million, respectively, and the related fair value of plan assets was $49.2 million and $42.4 million, respectively.
(d) Kentucky Trailer
Kentucky Trailer had a funded, noncontributory defined benefit plan for certain of its employees, prior to its termination and pay-out in August 2014. Benefits under Kentucky Trailer’s defined benefit plans were frozen in 2005. As of December 31, 2013, the projected benefit obligation was $5.6 million, and the related fair value of plan assets was $4.7 million.
16. Quarterly Results of Operations (unaudited)
Selected quarterly financial data for 2014 and 2013 are presented below:
| Quarter Ended | ||||||||||||||||
| March 31 | June 30 | September 30 | December 31 | |||||||||||||
| (in millions, except per share data) | ||||||||||||||||
| 2014 |
||||||||||||||||
| Revenues |
$ | 1,286.6 | $ | 1,291.2 | $ | 1,351.9 | $ | 1,302.1 | ||||||||
| Net earnings(1) |
204.9 | 149.0 | 186.3 | 139.1 | ||||||||||||
| Basic earnings per share of Common Stock(1)(2) |
12.28 | 9.06 | 11.40 | 8.61 | ||||||||||||
| 2013 |
||||||||||||||||
| Revenues |
$ | 1,223.6 | $ | 1,196.2 | $ | 1,189.5 | $ | 1,362.5 | ||||||||
| Net earnings(1) |
196.3 | 113.7 | 113.2 | 205.3 | ||||||||||||
| Basic earnings per share of Common Stock(1)(2) |
11.67 | 6.78 | 6.75 | 12.24 | ||||||||||||
| (1) | Attributable to Alleghany stockholders. |
| (2) | Earnings per share by quarter may not equal the amount for the full year due to the timing of repurchases of Common Stock, as well as rounding. |
160
Table of Contents
REPORT OF INDEPENDENT REGISTERED PUBLIC ACCOUNTING FIRM
The Board of Directors and Stockholders
Alleghany Corporation:
We have audited Alleghany Corporation and subsidiaries’ internal control over financial reporting as of December 31, 2014, based on criteria established in Internal Control—Integrated Framework issued by the Committee of Sponsoring Organizations of the Treadway Commission (2013 framework) (the COSO criteria). Alleghany Corporation and subsidiaries’ management is responsible for maintaining effective internal control over financial reporting, and for its assessment of the effectiveness of internal control over financial reporting included in the accompanying Management’s Annual Report on Internal Control Over Financial Reporting. Our responsibility is to express an opinion on the company’s internal control over financial reporting based on our audit.
We conducted our audit in accordance with the standards of the Public Company Accounting Oversight Board (United States). Those standards require that we plan and perform the audit to obtain reasonable assurance about whether effective internal control over financial reporting was maintained in all material respects. Our audit included obtaining an understanding of internal control over financial reporting, assessing the risk that a material weakness exists, testing and evaluating the design and operating effectiveness of internal control based on the assessed risk, and performing such other procedures as we considered necessary in the circumstances. We believe that our audit provides a reasonable basis for our opinion.
A company’s internal control over financial reporting is a process designed to provide reasonable assurance regarding the reliability of financial reporting and the preparation of financial statements for external purposes in accordance with generally accepted accounting principles. A company’s internal control over financial reporting includes those policies and procedures that (1) pertain to the maintenance of records that, in reasonable detail, accurately and fairly reflect the transactions and dispositions of the assets of the company; (2) provide reasonable assurance that transactions are recorded as necessary to permit preparation of financial statements in accordance with generally accepted accounting principles, and that receipts and expenditures of the company are being made only in accordance with authorizations of management and directors of the company; and (3) provide reasonable assurance regarding prevention or timely detection of unauthorized acquisition, use, or disposition of the company’s assets that could have a material effect on the financial statements.
Because of its inherent limitations, internal control over financial reporting may not prevent or detect misstatements. Also, projections of any evaluation of effectiveness to future periods are subject to the risk that controls may become inadequate because of changes in conditions, or that the degree of compliance with the policies or procedures may deteriorate.
In our opinion, Alleghany Corporation and subsidiaries maintained, in all material respects, effective internal control over financial reporting as of December 31, 2014, based on the COSO criteria.
We also have audited, in accordance with the standards of the Public Company Accounting Oversight Board (United States), the consolidated balance sheets of Alleghany Corporation and subsidiaries as of December 31, 2014 and 2013, and the related consolidated statements of earnings and comprehensive income, changes in stockholders’ equity, and cash flows for each of the three years in the period ended December 31, 2014 of Alleghany Corporation and subsidiaries and our report dated February 24, 2015 expressed an unqualified opinion thereon.
/s/ Ernst & Young LLP
New York, New York
February 24, 2015
161
Table of Contents
Item 9. Changes in and Disagreements with Accountants on Accounting and Financial Disclosure.
None.
Item 9A. Controls and Procedures.
Disclosure Controls and Procedures
We carried out an evaluation, under the supervision and with the participation of our management, including our chief executive officer, or “CEO,” and our chief financial officer, or “CFO,” of the effectiveness of the design and operation of our disclosure controls and procedures as of the end of the period covered by this Form 10-K pursuant to Rule 13a-15(e) or 15d-15(e) promulgated under the Exchange Act. Based on that evaluation, our management, including our CEO and CFO, concluded that our disclosure controls and procedures were effective as of that date to provide reasonable assurance that information required to be disclosed by us in reports that we file or submit under the Exchange Act is (i) recorded, processed, summarized, and timely reported as specified in the SEC’s rules and forms and (ii) accumulated and communicated to our management, including our CEO and CFO, as appropriate to allow for timely decisions regarding required disclosure. Our disclosure controls and procedures were designed to provide such assurance; however, we note that the design of any system of controls is based in part upon certain assumptions about the likelihood of future events, and we cannot assure you that any design will succeed in achieving its stated goals under all potential future conditions, regardless of how remote.
Management’s Annual Report on Internal Control Over Financial Reporting
Our management is responsible for establishing and maintaining adequate internal control over financial reporting, as defined in Rules 13a-15(f) and 15d-15(f) under the Exchange Act. Our internal control system was designed to provide reasonable assurance to our management and Board of Directors regarding the preparation and fair presentation of financial statements for external purposes.
We carried out an evaluation, under the supervision and with the participation of our management, including our CEO and CFO, of the effectiveness of our internal control over financial reporting based on the framework in Internal Control-Integrated Framework issued by the Committee of Sponsoring Organizations of the Treadway Commission (2013 framework). Based on that evaluation, our management, including our CEO and CFO, concluded that, as of December 31, 2014, our internal control over financial reporting was effective. Our independent registered public accounting firm that audited the consolidated financial statements included in this Form 10-K, Ernst & Young LLP, has issued an attestation report on the effectiveness of our internal control over financial reporting which appears in Part II, Item 8, “Financial Statements and Supplementary Data” on page 161 of this Form 10-K. We note that all internal control systems, no matter how well designed, have inherent limitations. Therefore, even those systems determined to be effective can provide only reasonable assurance with respect to financial statement preparation and presentation.
Changes in Internal Control Over Financial Reporting
No changes occurred during the quarter ended December 31, 2014 in our internal control over financial reporting that have materially affected, or are reasonably likely to materially affect, our internal control over financial reporting.
None.
162
Table of Contents
Item 10. Directors, Executive Officers and Corporate Governance.
The information required by this Item 10 is included under the captions “Corporate Governance — Board of Directors,” “Corporate Governance — Committees of the Board of Directors,” “Corporate Governance — Codes of Ethics,” “Securities Ownership of Directors and Executive Officers — Section 16(a) Beneficial Ownership Reporting Compliance,” “Proposal 1. Election of Directors,” and “Executive Officers” in our Proxy Statement, filed or to be filed in connection with our Annual Meeting of Stockholders to be held on April 24, 2015, or our “2015 Proxy Statement,” which information is incorporated herein by reference.
Item 11. Executive Compensation.
The information required by this Item 11 is included under the captions “Proposal 1. Election of Directors — Compensation of Directors,” “Compensation Committee Report,” “Compensation Discussion and Analysis,” and “Executive Compensation” in our 2015 Proxy Statement, which information is incorporated herein by reference.
Item 12. Security Ownership of Certain Beneficial Owners and Management and Related Stockholder Matters.
The information required by this Item 12 is included under the captions “Principal Stockholders,” “Securities Ownership of Directors and Executive Officers,” and “Equity Compensation Plan Information” in our 2015 Proxy Statement, which information is incorporated herein by reference.
Item 13. Certain Relationships and Related Transactions, and Director Independence.
The information required by this Item 13 is included under the captions “Corporate Governance — Director Independence,” and “Corporate Governance — Related Party Transactions” in our 2015 Proxy Statement, which information is incorporated herein by reference.
Item 14. Principal Accountant Fees and Services.
The information required by this Item 14 is included under the caption “Proposal 4. Ratification of Selection of Independent Registered Public Accounting Firm for Fiscal 2015” in our 2015 Proxy Statement, which information is incorporated herein by reference.
163
Table of Contents
Item 15. Exhibits and Financial Statement Schedules.
(a) 1. Financial Statements.
Our consolidated financial statements, together with the reports thereon of Ernst & Young LLP, our independent registered public accounting firm for the years ended December 31, 2014, 2013 and 2012, are set forth on pages 113 through 161 of this Form 10-K.
2. Financial Statement Schedules.
The Index to Financial Statements Schedules and the schedules relating to our consolidated financial statements, together with the reports thereon of Ernst & Young LLP, our independent registered public accounting firm for the years ended December 31, 2014, 2013 and 2012, are set forth on pages 167 through 177 of this Form 10-K.
3. Exhibits.
See the Exhibit Index beginning on page 178 of this Form 10-K for a description of the exhibits filed as part of, or incorporated by reference in, this Form 10-K.
164
Table of Contents
SIGNATURES
Pursuant to the requirements of Section 13 or 15(d) of the Securities Exchange Act of 1934, the registrant has duly caused this report to be signed on its behalf by the undersigned thereunto duly authorized.
| ALLEGHANY CORPORATION (Registrant) | ||||||
| Date: February 24, 2015 | By: | /s/ WESTON M. HICKS | ||
| Weston M. Hicks | ||||
| President | ||||
Pursuant to the requirements of the Securities Exchange Act of 1934, this report has been signed below by the following persons on behalf of the registrant and in the capacities and on the dates indicated.
| Date: February 24, 2015 | By: | /s/ REX D. ADAMS | ||
| Rex D. Adams | ||||
| Director | ||||
| Date: February 24, 2015 | By: | /s/ JERRY G. BORRELLI | ||
| Jerry G. Borrelli | ||||
| Vice President (principal accounting officer) | ||||
| Date: February 24, 2015 | By: | /s/ STEPHEN P. BRADLEY | ||
| Stephen P. Bradley | ||||
| Director | ||||
| Date: February 24, 2015 | By: | /s/ KAREN BRENNER | ||
| Karen Brenner | ||||
| Director | ||||
| Date: February 24, 2015 | By: | /s/ IAN H. CHIPPENDALE | ||
| Ian H. Chippendale | ||||
| Director | ||||
| Date: February 24, 2015 | By: | /s/ JOHN G. FOOS | ||
| John G. Foos | ||||
| Director | ||||
| Date: February 24, 2015 | By: | /s/ WESTON M. HICKS | ||
| Weston M. Hicks | ||||
| President and Director (principal executive officer) | ||||
| Date: February 24, 2015 | By: | /s/ THOMAS S. JOHNSON | ||
| Thomas S. Johnson | ||||
| Director | ||||
165
Table of Contents
| Date: February 24, 2015 | By: | /s/ JEFFERSON W. KIRBY | ||
| Jefferson W. Kirby | ||||
| Chairman of the Board and Director | ||||
| Date: February 24, 2015 | By: | /s/ WILLIAM K. LAVIN | ||
| William K. Lavin | ||||
| Director | ||||
| Date: February 24, 2015 | By: | /s/ PHILLIP M. MARTINEAU | ||
| Phillip M. Martineau | ||||
| Director | ||||
| Date: February 24, 2015 | By: | /s/ JOHN L. SENNOTT, JR. | ||
| John L. Sennott, Jr. | ||||
| Senior Vice President (principal financial officer) | ||||
| Date: February 24, 2015 | By: | /s/ RAYMOND L.M. WONG | ||
| Raymond L.M. Wong | ||||
| Director | ||||
166
Table of Contents
Alleghany Corporation and Subsidiaries
Index to Financial Statement Schedules
| Description |
Page | |
| 168 | ||
| Schedule I Summary of Investments — Other Than Investments in Related Parties |
169 | |
| 170 | ||
| 174 | ||
| 175 | ||
| 176 | ||
| Schedule VI Supplemental Information Concerning Insurance Operations |
177 |
167
Table of Contents
REPORT OF INDEPENDENT REGISTERED PUBLIC ACCOUNTING FIRM
The Board of Directors and Stockholders
Alleghany Corporation:
We have audited the consolidated financial statements of Alleghany Corporation and subsidiaries (the “Company”) as of December 31, 2014 and 2013, and for each of the three years in the period ended December 31, 2014, and have issued our report thereon dated February 24, 2015 (included elsewhere in this Annual Report on Form 10-K). Our audits also included the financial statement schedules listed in the accompanying Index to the financial statement schedules of this Form 10-K. These schedules are the responsibility of the Company’s management. Our responsibility is to express an opinion on these schedules based on our audits.
In our opinion, the financial statement schedules referred to above, when considered in relation to the basic financial statements taken as a whole, present fairly in all material respects the information set forth therein.
/s/ Ernst & Young LLP
New York, New York
February 24, 2015
168
Table of Contents
Schedule I – Summary of Investments – Other Than Investments in Related Parties
ALLEGHANY CORPORATION AND SUBSIDIARIES
December 31, 2014
| Type of Investment |
Cost | Fair Value | Amount at which shown in the Balance Sheet |
|||||||||
| ( in millions) | ||||||||||||
| Fixed maturities: |
||||||||||||
| Bonds: |
||||||||||||
| U.S. Government obligations |
$ | 541.2 | $ | 541.1 | $ | 541.1 | ||||||
| Municipal bonds |
5,067.3 | 5,197.5 | 5,197.5 | |||||||||
| Foreign government obligations |
876.7 | 900.4 | 900.4 | |||||||||
| U.S. corporate bonds |
2,136.5 | 2,154.8 | 2,154.8 | |||||||||
| Foreign corporate bonds |
1,460.5 | 1,503.7 | 1,503.7 | |||||||||
| Mortgage and asset-backed securities: |
||||||||||||
| RMBS |
1,646.9 | 1,655.9 | 1,655.9 | |||||||||
| CMBS |
1,104.2 | 1,125.3 | 1,125.3 | |||||||||
| Other asset-backed securities |
1,531.2 | 1,519.9 | 1,519.9 | |||||||||
|
|
|
|
|
|
|
|||||||
| Fixed maturities |
14,364.5 | 14,598.6 | 14,598.6 | |||||||||
|
|
|
|
|
|
|
|||||||
| Equity securities: |
||||||||||||
| Common stocks: |
||||||||||||
| Public utilities |
— | — | — | |||||||||
| Banks, trust and insurance companies |
197.8 | 242.2 | 242.2 | |||||||||
| Industrial, miscellaneous and all other |
2,168.2 | 2,573.3 | 2,573.3 | |||||||||
| Nonredeemable preferred stocks |
— | — | — | |||||||||
|
|
|
|
|
|
|
|||||||
| Equity securities |
2,366.0 | 2,815.5 | 2,815.5 | |||||||||
|
|
|
|
|
|
|
|||||||
| Other invested assets |
705.6 | 705.6 | 705.6 | |||||||||
| Short-term investments |
715.6 | 715.6 | 715.6 | |||||||||
|
|
|
|
|
|
|
|||||||
| Total investments |
$ | 18,151.7 | $ | 18,835.3 | $ | 18,835.3 | ||||||
|
|
|
|
|
|
|
|||||||
169
Table of Contents
Schedule II – Condensed Financial Information of Registrant
Condensed Balance Sheets
ALLEGHANY CORPORATION
December 31, 2014 and 2013
| 2014 | 2013 | |||||||
| (in thousands) | ||||||||
| Assets |
||||||||
| Equity securities (cost: 2014 – $47,387; 2013 – $23,576) |
$ | 49,432 | $ | 44,536 | ||||
| Debt securities (amortized cost: 2014 – $70,282; 2013 – $70,758) |
71,262 | 68,731 | ||||||
| Short-term investments |
152,943 | 78,101 | ||||||
| Cash |
10,535 | 17,356 | ||||||
| Property and equipment at cost, net of accumulated depreciation and amortization |
498 | 584 | ||||||
| Other assets |
24,694 | 22,712 | ||||||
| Net deferred tax assets |
41,803 | 31,097 | ||||||
| Investment in subsidiaries |
8,241,843 | 7,471,271 | ||||||
|
|
|
|
|
|||||
| Total assets |
$ | 8,593,010 | $ | 7,734,388 | ||||
|
|
|
|
|
|||||
| Liabilities and Stockholders’ Equity |
||||||||
| Senior Notes |
$ | 997,025 | $ | 698,910 | ||||
| Other liabilities |
101,081 | 78,825 | ||||||
| Current taxes payable |
12,860 | 9,132 | ||||||
|
|
|
|
|
|||||
| Total liabilities |
1,110,966 | 786,867 | ||||||
| Stockholders’ equity attributable to Alleghany stockholders |
7,473,428 | 6,923,757 | ||||||
| Noncontrolling interest |
8,616 | 23,764 | ||||||
|
|
|
|
|
|||||
| Stockholders’ equity |
7,482,044 | 6,947,521 | ||||||
|
|
|
|
|
|||||
| Total liabilities and stockholders’ equity |
$ | 8,593,010 | $ | 7,734,388 | ||||
|
|
|
|
|
|||||
See accompanying Notes to Condensed Financial Statements
170
Table of Contents
Schedule II – Condensed Financial Information of Registrant (continued)
Condensed Statements of Earnings
ALLEGHANY CORPORATION
Year ended December 31,
| 2014 | 2013 | 2012 | ||||||||||
| (in thousands) | ||||||||||||
| Revenues |
||||||||||||
| Net investment income |
$ | 8,169 | $ | 7,540 | $ | 10,702 | ||||||
| Net realized capital gains |
14,349 | (4,769) | 39,966 | |||||||||
| Other than temporary impairment losses |
— | — | — | |||||||||
| Gain on bargain purchase |
— | — | 494,940 | |||||||||
| Other income |
265 | 188 | 193 | |||||||||
|
|
|
|
|
|
|
|||||||
| Total revenues |
22,783 | 2,959 | 545,801 | |||||||||
|
|
|
|
|
|
|
|||||||
| Costs and Expenses |
||||||||||||
| Interest expense |
42,310 | 37,302 | 27,635 | |||||||||
| Corporate administration |
45,741 | 36,111 | 75,806 | |||||||||
|
|
|
|
|
|
|
|||||||
| Total costs and expenses |
88,051 | 73,413 | 103,441 | |||||||||
|
|
|
|
|
|
|
|||||||
| Operating (losses) profit |
(65,268) | (70,454) | 442,360 | |||||||||
| Equity in earnings of consolidated subsidiaries |
997,177 | 925,690 | 276,916 | |||||||||
|
|
|
|
|
|
|
|||||||
| Earnings before income taxes |
931,909 | 855,236 | 719,276 | |||||||||
| Income taxes |
251,777 | 225,882 | 17,032 | |||||||||
|
|
|
|
|
|
|
|||||||
| Net earnings |
680,132 | 629,354 | 702,244 | |||||||||
| Net earnings attributable to noncontrolling interest |
893 | 933 | — | |||||||||
|
|
|
|
|
|
|
|||||||
| Net earnings attributable to Alleghany stockholders |
$ | 679,239 | $ | 628,421 | $ | 702,244 | ||||||
|
|
|
|
|
|
|
|||||||
See accompanying Notes to Condensed Financial Statements
171
Table of Contents
Schedule II – Condensed Financial Information of Registrant (continued)
Condensed Statements of Cash Flows
ALLEGHANY CORPORATION
Year ended December 31,
| 2014 | 2013 | 2012 | ||||||||||
| (in thousands) | ||||||||||||
| Cash flows from operating activities |
||||||||||||
| Net earnings |
$ | 680,132 | $ | 629,354 | $ | 702,244 | ||||||
| Adjustments to reconcile net earnings to net cash provided by (used in) operating activities: |
||||||||||||
| Equity in undistributed net (earnings) losses of consolidated subsidiaries |
(722,445) | (674,337) | (246,566) | |||||||||
| Depreciation and amortization |
1,845 | 1,920 | 2,216 | |||||||||
| Net realized capital (gains) losses |
(14,349) | 4,769 | (39,966) | |||||||||
| Gain on bargain purchase |
— | — | (494,940) | |||||||||
| Increase (decrease) in other liabilities and taxes payable |
22,654 | 11,737 | (32,261) | |||||||||
|
|
|
|
|
|
|
|||||||
| Net adjustments |
(712,295) | (655,911) | (811,517) | |||||||||
|
|
|
|
|
|
|
|||||||
| Net cash (used in) provided by operating activities |
(32,163) | (26,557) | (109,273) | |||||||||
|
|
|
|
|
|
|
|||||||
| Cash flows from investing activities |
||||||||||||
| Purchases of debt securities |
— | — | (363,718) | |||||||||
| Purchases of equity securities |
(226,418) | — | (155,441) | |||||||||
| Sales of debt securities |
— | 218,657 | 72,027 | |||||||||
| Maturities and redemptions of debt securities |
121 | 1,078 | 2,312 | |||||||||
| Sales of equity securities |
216,951 | 125,724 | 168,525 | |||||||||
| Net (purchase) sale in short-term investments |
(74,842) | (59,247) | 342,418 | |||||||||
| Purchases of property and equipment |
(158) | (243) | (29) | |||||||||
| Purchase of subsidiary, net of cash acquired |
— | — | (828,222) | |||||||||
| Other, net |
383 | 15,910 | (14,995) | |||||||||
|
|
|
|
|
|
|
|||||||
| Net cash (used in) provided by investing activities |
(83,963) | 301,879 | (777,123) | |||||||||
|
|
|
|
|
|
|
|||||||
| Cash flows from financing activities |
||||||||||||
| Proceeds from issuance of Senior Notes |
297,942 | — | 399,592 | |||||||||
| Debt issue costs paid |
(3,625) | — | (3,470) | |||||||||
| Treasury stock acquisitions |
(300,478) | (40,389) | (17,768) | |||||||||
| Tax benefit on stock based compensation |
— | — | 295 | |||||||||
| Capital contributions to consolidated subsidiaries |
(453,551) | (429,371) | (165,479) | |||||||||
| Distributions from consolidated subsidiaries |
566,723 | 218,800 | 661,500 | |||||||||
| Other, net |
2,294 | (8,385) | 9,279 | |||||||||
|
|
|
|
|
|
|
|||||||
| Net cash provided by (used in) financing activities |
109,305 | (259,345) | 883,949 | |||||||||
|
|
|
|
|
|
|
|||||||
| Effect of exchange rate changes on cash |
— | — | — | |||||||||
|
|
|
|
|
|
|
|||||||
| Net (decrease) increase in cash |
(6,821) | 15,977 | (2,447) | |||||||||
| Cash at beginning of period |
17,356 | 1,379 | 3,826 | |||||||||
|
|
|
|
|
|
|
|||||||
| Cash at end of period |
$ | 10,535 | $ | 17,356 | $ | 1,379 | ||||||
|
|
|
|
|
|
|
|||||||
| Supplemental disclosures of cash flow information |
||||||||||||
| Cash paid during the period for: |
||||||||||||
| Interest paid |
$ | 36,675 | $ | 36,675 | $ | 26,830 | ||||||
| Income taxes paid (refunds received) |
221,309 | 78,293 | 136,015 | |||||||||
See accompanying Notes to Condensed Financial Statements
172
Table of Contents
Schedule II – Condensed Financial Information of Registrant (continued)
Notes to Condensed Financial Statements
ALLEGHANY CORPORATION
1. Investment in Consolidated Subsidiaries. Reference is made to Notes 1 and 2 to the Consolidated Financial Statements set forth in Part II, Item 8, “Financial Statements and Supplementary Data” of this Form 10-K.
2. Income Taxes. Reference is made to Note 9 to the Consolidated Financial Statements set forth in Part II, Item 8, “Financial Statements and Supplementary Data” of this Form 10-K.
3. Commitments and Contingencies. Reference is made to Note 12 to the Consolidated Financial Statements set forth in Part II, Item 8, “Financial Statements and Supplementary Data” of this Form 10-K.
4. Stockholders’ Equity. Reference is made to Note 10 to the Consolidated Financial Statements set forth in Part II, Item 8, “Financial Statements and Supplementary Data” of this Form 10-K with respect to stockholders’ equity and surplus available for dividend payments to Alleghany from its subsidiaries.
5. Senior Notes. Reference is made to Note 8 to the Consolidated Financial Statements set forth in Part II, Item 8, “Financial Statements and Supplementary Data” of this Form 10-K.
6. Gain on bargain purchase in 2012. Reference is made to Note 2 to the Consolidated Financial Statements set forth in Part II, Item 8, “Financial Statements and Supplementary Data” of this Form 10-K.
173
Table of Contents
Schedule III – Supplemental Insurance Information
ALLEGHANY CORPORATION AND SUBSIDIARIES
| At December 31, | For the Year Ended December 31, | |||||||||||||||||||||||||||||||||||||||||
| Year |
Line of Business |
Deferred Policy Acquisition Cost |
Future Policy Benefits, Losses, Claims and Loss Expenses |
Unearned Premiums |
Other Policy Claims and Benefits Payable |
Premium Revenue |
Net Investment Income |
Benefits, Claims, Losses and Settlement Expenses |
Amortization of Deferred Policy Acquisition Costs |
Other Operating Expenses |
Premiums Written |
|||||||||||||||||||||||||||||||
| (in millions) | ||||||||||||||||||||||||||||||||||||||||||
| 2014 |
Property and Casualty Insurance |
$ | 353.2 | $ | 11,597.2 | $ | 1,834.2 | $ | — | $ | 4,410.6 | $ | 448.9 | $ | 2,494.5 | $ | 1,042.0 | $ | 379.3 | $ | 4,497.5 | |||||||||||||||||||||
|
|
|
|
|
|
|
|
|
|
|
|
|
|
|
|
|
|
|
|
|
|||||||||||||||||||||||
| 2013 |
Property and Casualty Insurance |
$ | 334.7 | $ | 11,952.5 | $ | 1,765.6 | $ | — | $ | 4,239.2 | $ | 415.2 | $ | 2,479.3 | $ | 973.5 | $ | 365.7 | $ | 4,287.4 | |||||||||||||||||||||
|
|
|
|
|
|
|
|
|
|
|
|
|
|
|
|
|
|
|
|
|
|||||||||||||||||||||||
| 2012 |
Property and Casualty Insurance |
$ | 303.5 | $ | 12,239.8 | $ | 1,705.3 | $ | — | $ | 3,733.0 | $ | 317.5 | $ | 2,630.3 | $ | 578.1 | $ | 304.3 | $ | 3,723.9 | |||||||||||||||||||||
|
|
|
|
|
|
|
|
|
|
|
|
|
|
|
|
|
|
|
|
|
|||||||||||||||||||||||
174
Table of Contents
ALLEGHANY CORPORATION AND SUBSIDIARIES
Year ended December 31,
| Year |
Line of Business |
Gross Amount | Ceded to Other Companies |
Assumed from Other Companies |
Net Amount | Percentage of Amount Assumed to Net |
||||||||||||||||
| (in millions) | ||||||||||||||||||||||
| 2014 |
Property and casualty | $ | 1,517.0 | $ | 646.9 | $ | 3,540.5 | $ | 4,410.6 | 80.3% | ||||||||||||
|
|
|
|
|
|
|
|
|
|
|
|||||||||||||
| 2013 |
Property and casualty | $ | 1,372.2 | $ | 592.6 | $ | 3,459.6 | $ | 4,239.2 | 81.6% | ||||||||||||
|
|
|
|
|
|
|
|
|
|
|
|||||||||||||
| 2012 |
Property and casualty | $ | 1,161.5 | $ | 522.0 | $ | 3,093.5 | $ | 3,733.0 | 82.9% | ||||||||||||
|
|
|
|
|
|
|
|
|
|
|
|||||||||||||
175
Table of Contents
Schedule V – Valuation and Qualifying Accounts
ALLEGHANY CORPORATION AND SUBSIDIARIES
| Year |
Description |
Balance at January 1, |
Charged to Costs and Expenses |
Charged to Other Accounts |
Deductions | Balance at December 31, |
||||||||||||||||
| (in millions) | ||||||||||||||||||||||
| 2014 |
Allowance for uncollectible reinsurance recoverables | $ | — | $ | — | $ | — | $ | — | $ | — | |||||||||||
|
|
|
|
|
|
|
|
|
|
|
|||||||||||||
| Allowance for uncollectible premiums receivable | $ | 0.5 | $ | 0.6 | $ | — | $ | 0.7 | $ | 0.4 | ||||||||||||
|
|
|
|
|
|
|
|
|
|
|
|||||||||||||
| 2013 |
Allowance for uncollectible reinsurance recoverables | $ | — | $ | — | $ | — | $ | — | $ | — | |||||||||||
|
|
|
|
|
|
|
|
|
|
|
|||||||||||||
| Allowance for uncollectible premiums receivable | $ | 0.4 | $ | 0.6 | $ | — | $ | 0.5 | $ | 0.5 | ||||||||||||
|
|
|
|
|
|
|
|
|
|
|
|||||||||||||
| 2012 |
Allowance for uncollectible reinsurance recoverables | $ | — | $ | — | $ | — | $ | — | $ | — | |||||||||||
|
|
|
|
|
|
|
|
|
|
|
|||||||||||||
| Allowance for uncollectible premiums receivable | $ | 1.4 | $ | (0.3) | $ | — | $ | 0.7 | $ | 0.4 | ||||||||||||
|
|
|
|
|
|
|
|
|
|
|
|||||||||||||
176
Table of Contents
SCHEDULE VI – Supplemental Information Concerning Insurance Operations
ALLEGHANY CORPORATION AND SUBSIDIARIES
| At December 31, | For the Year Ended December 31, | |||||||||||||||||||||||||||||||||||||||||||||
| Deferred Policy Acquisition Cost |
Reserves for Unpaid Claims and Claim Adjustment Expenses |
Discount if Any Deducted, in Reserves for Unpaid Claims and Claim Adjustment Expenses |
Unearned Premiums |
Earned Premiums |
Net Investment Income |
Claims and Claim Adjustment Expenses Incurred Related to |
Amortization of Deferred Policy Acquisition Costs |
Paid Claims and Claim Adjustment Expenses |
Premiums Written |
|||||||||||||||||||||||||||||||||||||
| Year |
Line of Business |
Current Year |
Prior Year | |||||||||||||||||||||||||||||||||||||||||||
| (in millions) | ||||||||||||||||||||||||||||||||||||||||||||||
| 2014 |
Property and Casualty Insurance | $ | 353.2 | $ | 11,597.2 | $ | — | $ | 1,834.2 | $ | 4,410.6 | $ | 448.9 | $ | 2,709.7 | $ | (215.2) | $ | 1,042.0 | $ | 2,698.9 | $ | 4,497.5 | |||||||||||||||||||||||
|
|
|
|
|
|
|
|
|
|
|
|
|
|
|
|
|
|
|
|
|
|
|
|||||||||||||||||||||||||
| 2013 |
Property and Casualty Insurance | $ | 334.7 | $ | 11,952.5 | $ | — | $ | 1,765.6 | $ | 4,239.2 | $ | 415.2 | $ | 2,682.3 | $ | (203.0) | $ | 973.5 | $ | 2,755.3 | $ | 4,287.4 | |||||||||||||||||||||||
|
|
|
|
|
|
|
|
|
|
|
|
|
|
|
|
|
|
|
|
|
|
|
|||||||||||||||||||||||||
| 2012 |
Property and Casualty Insurance | $ | 303.5 | $ | 12,239.8 | $ | — | $ | 1,705.3 | $ | 3,733.0 | $ | 317.5 | $ | 2,642.6 | $ | (12.3) | $ | 578.1 | $ | 2,320.0 | $ | 3,723.9 | |||||||||||||||||||||||
|
|
|
|
|
|
|
|
|
|
|
|
|
|
|
|
|
|
|
|
|
|
|
|||||||||||||||||||||||||
177
Table of Contents
EXHIBIT INDEX
| Exhibit Number |
Description | |
| 2.01 | Agreement and Plan of Merger, dated as of November 20, 2011, by and among Alleghany, Transatlantic Holdings, Inc. and Shoreline Merger Sub, LLC filed as Exhibit 2.1 to Alleghany’s Current Report on Form 8-K filed on November 21, 2011, is incorporated herein by reference. | |
| 3.01 | Restated Certificate of Incorporation of Alleghany, as amended by Amendment accepted and received for filing by the Secretary of State of the State of Delaware on June 23, 1988, filed as Exhibit 3.1 to Alleghany’s Registration Statement on Form S-3 (No. 333-134996) filed on June 14, 2006, is incorporated herein by reference. | |
| 3.02 | By-laws of Alleghany, as amended December 18, 2007, filed as Exhibit 3.2 to Alleghany’s Current Report on Form 8-K filed on December 20, 2007, is incorporated herein by reference. | |
| 3.03 | Certificate of Elimination of 5.75% Mandatory Convertible Preferred Stock of Alleghany filed as Exhibit 3.1 to Alleghany’s Current Report on Form 8-K filed on July 22, 2009, is incorporated herein by reference. | |
| 4.01† | Specimen certificates representing shares of common stock, par value $1.00 per share, of Alleghany, filed as Exhibit 4.1 to Alleghany’s Quarterly Report on Form 10-Q for the quarter ended June 30, 2006, is incorporated herein by reference. | |
| 4.02 | Indenture, dated as of September 20, 2010, by and between Alleghany and The Bank of New York Mellon, as Trustee, filed as Exhibit 4.1 to Alleghany’s Current Report on Form 8-K filed on September 20, 2010, is incorporated herein by reference. | |
| 4.03 | First Supplemental Indenture, dated as of September 20, 2010, by and between Alleghany and The Bank of New York Mellon, as Trustee, including the form of the Senior Notes attached as Exhibit A thereto, filed as Exhibit 4.2 to Alleghany’s Current Report on Form 8-K filed on September 20, 2010, is incorporated herein by reference. | |
| 4.04 | Second Supplemental Indenture, dated as of June 26, 2012, by and between Alleghany and The Bank of New York Mellon, as Trustee, including the form of the Senior Notes attached as Exhibit A thereto, filed as Exhibit 4.1 to Alleghany’s Current Report on Form 8-K filed on June 26, 2012, is incorporated herein by reference. | |
| 4.05 | Third Supplemental Indenture, dated as of September 9, 2014, by and between Alleghany Corporation and the Bank of New York Mellon, as Trustee, including the form of the Senior Notes attached as Exhibit A thereto, filed as Exhibit 4.1 to Alleghany’s Current Report on Form 8-K filed on September 9, 2014, is incorporated therein by reference. | |
| *10.01 | Alleghany 2010 Management Incentive Plan, filed as Exhibit 10.3 to Alleghany’s Current Report on Form 8-K filed on April 26, 2010, is incorporated herein by reference. | |
| *10.02 | Alleghany Officers and Highly Compensated Employees Deferred Compensation Plan, as amended and restated as of January 1, 2011, filed as Exhibit 10.1 to Alleghany’s Current Report on Form 8-K filed on January 20, 2011, is incorporated herein by reference. | |
| *10.03 | Alleghany 2002 Long-Term Incentive Plan, adopted and effective April 26, 2002, as amended, filed as Exhibit 10.2 to Alleghany’s Current Report on Form 8-K filed on December 18, 2008, is incorporated herein by reference. | |
| *10.04 | Alleghany 2007 Long-Term Incentive Plan, adopted and effective April 27, 2007, as amended, filed as Exhibit 10.3 to Alleghany’s Current Report on Form 8-K filed on December 18, 2008, is incorporated herein by reference. | |
178
Table of Contents
| Exhibit Number |
Description | |
| *10.05(a) | Alleghany 2012 Long-Term Incentive Plan, adopted and effective April 27, 2012, filed as an appendix to Alleghany’s Definitive Proxy Statement dated March 16, 2012 is incorporated herein by reference. | |
| *10.05(b) | Form of Performance Share Award Agreement under the 2012 Long-Term Incentive Plan, filed as Exhibit 10.06(b) to Alleghany’s Annual Report on Form 10-K for the year ended December 31, 2012, is incorporated herein by reference. | |
| *10.05(c) | Form of Restricted Stock Unit Award Agreement under the 2012 Long-Term Incentive Plan, filed as Exhibit 10.06(c) to Allegheny’s Annual Report on Form 10-K for the year ended December 31, 2012, is incorporated herein by reference. | |
| *10.06 | Alleghany Retirement Plan, amended and restated effective January 1, 2011, filed as Exhibit 10.1 to Alleghany’s Current Report on Form 8-K filed on December 17, 2010, is incorporated herein by reference. | |
| *10.07 | Description of Alleghany Group Long Term Disability Plan effective as of July 1, 1995, filed as Exhibit 10.10 to Alleghany’s Annual Report on Form 10-K for the year ended December 31, 1995, is incorporated herein by reference. | |
| *10.08 | Alleghany 2000 Directors’ Stock Option Plan effective April 28, 2000, filed as Exhibit A to Alleghany’s Proxy Statement, filed in connection with its Annual Meeting of Stockholders held on April 28, 2000, is incorporated herein by reference. | |
| *10.09 | Alleghany Non-Employee Directors’ Retirement Plan, as amended, effective December 19, 2006, filed as Exhibit 10.1 to Alleghany’s Current Report on Form 8-K filed on December 22, 2006, is incorporated herein by reference. | |
| *10.10(a) | Alleghany 2005 Directors’ Stock Plan, as amended as of December 31, 2008, filed as Exhibit 10.12(a) to Alleghany’s Annual Report on Form 10-K for the year ended December 31, 2008, is incorporated herein by reference. | |
| *10.10(b) | Form of Option Agreement under the Alleghany 2005 Directors’ Stock Plan, as amended as of December 16, 2008, filed as Exhibit 10.12(a) to Alleghany’s Annual Report on Form 10-K for the year ended December 31, 2008, is incorporated herein by reference. | |
| *10.10(c) | Amended and Restated Stock Unit Supplement to the Alleghany 2005 Directors’ Stock Plan, as amended as of December 16, 2008, filed as Exhibit 10.12(c) to Alleghany’s Annual Report on Form 10-K for the year ended December 31, 2008, is incorporated herein by reference. | |
| *10.11 | Alleghany Amended and Restated 2010 Directors’ Stock Plan, filed as Exhibit 10.1 to Alleghany’s Quarterly Report on Form 10-Q for the quarter ended March 31, 2013, is incorporated herein by reference. | |
| *10.12 | Terms and Provisions Governing 2011 ACP Incentive Awards, filed as Exhibit 10.2 to Alleghany’s Current Report on Form 8-K filed on January 20, 2011, is incorporated herein by reference. | |
| *10.13(a) | Employment Agreement, dated October 7, 2002, between Alleghany and Weston M. Hicks, filed as Exhibit 10.1 to Alleghany’s Quarterly Report on Form 10-Q for the quarter ended September 30, 2002, is incorporated herein by reference. | |
| *10.13(b) | Restricted Stock Unit Matching Grant Agreement, dated October 7, 2002, between Alleghany and Weston M. Hicks, filed as Exhibit 10.3 to Alleghany’s Quarterly Report on Form 10-Q for the quarter ended September 30, 2002, is incorporated herein by reference. | |
179
Table of Contents
| Exhibit Number |
Description | |
| *10.13(c) | Restricted Stock Award Agreement, dated December 31, 2004, between Alleghany and Weston M. Hicks, filed as Exhibit 10.11(d) to Alleghany’s Annual Report on Form 10-K for the year ended December 31, 2004, is incorporated herein by reference. | |
| *10.13(d) | Letter Agreement, dated April 15, 2008, between Alleghany and Weston M. Hicks, filed as Exhibit 10.1 to Alleghany’s Current Report on Form 8-K filed on April 21, 2008, is incorporated herein by reference. | |
| *10.14 | Restricted Stock Award Agreement, dated as of December 21, 2004 between Alleghany and Roger B. Gorham, filed as Exhibit 10.1 to Alleghany’s Current Report on Form 8-K filed on April 21, 2005, is incorporated herein by reference. | |
| *10.15 | Letter Agreement, dated as of November 20, 2011, by and between Alleghany and Joseph P. Brandon, filed as Exhibit 10.2 to Alleghany’s Quarterly Report on Form 10-Q for the quarter ended March 31, 2012, is incorporated herein by reference. | |
| *10.16 | Restricted Stock Unit Matching Grant Agreement dated as of March 6, 2012, by and between Alleghany and Joseph P. Brandon, filed as Exhibit 10.3 to Alleghany’s Quarterly Report on Form 10-Q for the quarter ended March 31, 2012, is incorporated herein by reference. | |
| *10.17 | Success Shares Award Agreement, dated as of March 6, 2012, by and between Alleghany and Joseph P. Brandon, filed as Exhibit 10.4 to Alleghany’s Quarterly Report on Form 10-Q for the quarter ended March 31, 2012, is incorporated herein by reference. | |
| *10.18 | Letter Agreement, dated as of February 21, 2013, between Alleghany Corporation and Roger B. Gorham, filed as Exhibit 10.1 to Alleghany’s Current Report on Form 8-K filed on February 26, 2013, is incorporated herein by reference. | |
| *10.19 | Letter Agreement, dated as of April 8, 2013, between Alleghany Corporation and John L. Sennott, Jr., filed as Exhibit 10.1 to Alleghany’s Current Report on Form 8-K filed on April 15, 2013, is incorporated herein by reference. | |
| 10.20(a) | Asset Purchase Agreement dated as of July 1, 1991 among Celite Holdings Corporation, Celite Corporation and Manville Sales Corporation (the “Celite Asset Purchase Agreement”), filed as Exhibit 10.1 to Alleghany’s Current Report on Form 8-K filed on June 20, 2006, is incorporated herein by reference. | |
| 10.20(b) | List of Contents of Exhibits and Schedules to the Celite Asset Purchase Agreement, filed as Exhibit 10.2 to Alleghany’s Current Report on Form 8-K filed on June 20, 2006, is incorporated herein by reference. Alleghany agrees to furnish supplementally a copy of any omitted exhibit or schedule to the Securities and Exchange Commission upon request. | |
| 10.20(c) | Amendment No. 1 dated as of July 31, 1991 to the Celite Asset Purchase Agreement, filed as Exhibit 10.3 to Alleghany’s Current Report on Form 8-K filed on June 20, 2006, is incorporated herein by reference. | |
| 10.20(d) | Amendment No. 2 dated as of May 11, 2006 to the Celite Asset Purchase Agreement, filed as Exhibit 10.4 to Alleghany’s Current Report on Form 8-K filed on June 20, 2006, is incorporated herein by reference. | |
| 10.21(a) | Acquisition Agreement, dated as of June 6, 2003, by and between Royal Group, Inc. and AIHL (the “Resurgens Specialty Acquisition Agreement”), filed as Exhibit 10.1 to Alleghany’s Quarterly Report on Form 10-Q for the quarter ended June 30, 2003, is incorporated herein by reference. | |
180
Table of Contents
| Exhibit Number |
Description | |
| 10.21(b) | List of Contents of Exhibits and Schedules to the Resurgens Specialty Acquisition Agreement, filed as Exhibit 10.2 to Alleghany’s Quarterly Report on Form 10-Q for the quarter ended June 30, 2003, is incorporated herein by reference. Alleghany agrees to furnish supplementally a copy of any omitted exhibit or schedule to the Securities and Exchange Commission upon request. | |
| 10.22(a) | Quota Share Reinsurance Agreement, dated as of July 1, 2003, by and between Royal Indemnity Company and RIC (the “Royal Indemnity Company Quota Share Reinsurance Agreement”), filed as Exhibit 10.4 to Alleghany’s Quarterly Report on Form 10-Q for the quarter ended June 30, 2003, is incorporated herein by reference. | |
| 10.22(b) | List of Contents of Exhibits and Schedules to the Royal Indemnity Company Quota Share Reinsurance Agreement, filed as Exhibit 10.5 to Alleghany’s Quarterly Report on Form 10-Q for the quarter ended June 30, 2003, is incorporated herein by reference. Alleghany agrees to furnish supplementally a copy of any omitted exhibit or schedule to the Securities and Exchange Commission upon request. | |
| 10.23(a) | Quota Share Reinsurance Agreement, dated as of July 1, 2003, by and between Royal Surplus Lines Insurance Company and RIC (the “Royal Surplus Lines Insurance Company Quota Share Reinsurance Agreement”), filed as Exhibit 10.6 to Alleghany’s Quarterly Report on Form 10-Q for the quarter ended June 30, 2003, is incorporated herein by reference. | |
| 10.23(b) | List of Contents of Exhibits and Schedules to the Royal Surplus Lines Insurance Company Quota Share Reinsurance Agreement, filed as Exhibit 10.7 to Alleghany’s Quarterly Report on Form 10-Q for the quarter ended June 30, 2003, is incorporated herein by reference. Alleghany agrees to furnish supplementally a copy of any omitted exhibit or schedule to the Securities and Exchange Commission upon request. | |
| 10.24(a) | Quota Share Reinsurance Agreement, dated as of July 1, 2003, by and between Landmark and RIC (the “Landmark Quota Share Reinsurance Agreement”), filed as Exhibit 10.8 to Alleghany’s Quarterly Report on Form 10-Q for the quarter ended June 30, 2003, is incorporated herein by reference. | |
| 10.24(b) | List of Contents of Exhibits and Schedules to the Landmark Quota Share Reinsurance Agreement, filed as Exhibit 10.9 to Alleghany’s Quarterly Report on Form 10-Q for the quarter ended June 30, 2003, is incorporated herein by reference. Alleghany agrees to furnish supplementally a copy of any omitted exhibit or schedule to the Securities and Exchange Commission upon request. | |
| 10.25(a) | Administrative Services Agreement, dated as of July 1, 2003, by and among Royal Indemnity Company, Resurgens Specialty and RIC (the “Royal Indemnity Company Administrative Services Agreement”), filed as Exhibit 10.10 to Alleghany’s Quarterly Report on Form 10-Q for the quarter ended June 30, 2003, is incorporated herein by reference. | |
| 10.25(b) | List of Contents of Exhibits and Schedules to the Royal Indemnity Company Administrative Services Agreement, filed as Exhibit 10.11 to Alleghany’s Quarterly Report on Form 10-Q for the quarter ended June 30, 2003, is incorporated herein by reference. Alleghany agrees to furnish supplementally a copy of any omitted exhibit or schedule to the Securities and Exchange Commission upon request. | |
| 10.26(a) | Administrative Services Agreement, dated as of July 1, 2003, by and among Royal Surplus Lines Insurance Company, Resurgens Specialty and RIC (the “Royal Surplus Lines Insurance Company Administrative Services Agreement”), filed as Exhibit 10.12 to Alleghany’s Quarterly Report on Form 10-Q for the quarter ended June 30, 2003, is incorporated herein by reference. | |
181
Table of Contents
| Exhibit Number |
Description | |
| 10.26(b) | List of Contents of Exhibits and Schedules to the Royal Surplus Lines Insurance Company Administrative Services Agreement, filed as Exhibit 10.13 to Alleghany’s Quarterly Report on Form 10-Q for the quarter ended June 30, 2003, is incorporated herein by reference. Alleghany agrees to furnish supplementally a copy of any omitted exhibit or schedule to the Securities and Exchange Commission upon request. | |
| 10.27(a) | Administrative Services Agreement, dated as of July 1, 2003, by and among Royal Insurance Company of America, Resurgens Specialty and RIC (the “Royal Insurance Company of America Administrative Services Agreement”), filed as Exhibit 10.14 to Alleghany’s Quarterly Report on Form 10-Q for the quarter ended June 30, 2003, is incorporated herein by reference. | |
| 10.27(b) | List of Contents of Exhibits and Schedules to the Royal Insurance Company of America Administrative Services Agreement, filed as Exhibit 10.15 to Alleghany’s Quarterly Report on Form 10-Q for the quarter ended June 30, 2003, is incorporated herein by reference. Alleghany agrees to furnish supplementally a copy of any omitted exhibit or schedule to the Securities and Exchange Commission upon request. | |
| 10.28(a) | Administrative Services Agreement, dated as of July 1, 2003, by and among Landmark, Resurgens Specialty and RIC (the “Landmark Administrative Services Agreement”), filed as Exhibit 10.16 to Alleghany’s Quarterly Report on Form 10-Q for the quarter ended June 30, 2003, is incorporated herein by reference. | |
| 10.28(b) | List of Contents of Exhibits and Schedules to the Landmark Administrative Services Agreement, filed as Exhibit 10.17 to Alleghany’s Quarterly Report on Form 10-Q for the quarter ended June 30, 2003, is incorporated herein by reference. Alleghany agrees to furnish supplementally a copy of any omitted exhibit or schedule to the Securities and Exchange Commission upon request. | |
| 10.29(a) | Quota Share Reinsurance Agreement, dated as of September 2, 2003, by and between Landmark and Royal Indemnity Company (the “Royal Indemnity Company (Landmark) Quota Share Reinsurance Agreement”), filed as Exhibit 10.2 to Alleghany’s Quarterly Report on Form 10-Q for the quarter ended September 30, 2003, is incorporated herein by reference. | |
| 10.29(b) | List of Contents of Exhibits and Schedules to the Royal Indemnity Company (Landmark) Quota Share Reinsurance Agreement, filed as Exhibit 10.3 to Alleghany’s Quarterly Report on Form 10-Q for the quarter ended September 30, 2003, is incorporated herein by reference. Alleghany agrees to furnish supplementally a copy of any omitted exhibit or schedule to the Securities and Exchange Commission upon request. | |
| 10.30(a) | Administrative Services Agreement, dated as of September 2, 2003, by and between Royal Indemnity Company and Landmark (the “Royal Indemnity Company (Landmark) Administrative Services Agreement”), filed as Exhibit 10.4 to Alleghany’s Quarterly Report on Form 10-Q for the quarter ended September 30, 2003, is incorporated herein by reference. | |
| 10.30(b) | List of Contents of Exhibits and Schedules to the Royal Indemnity Company (Landmark) Administrative Services Agreement, filed as Exhibit 10.5 to Alleghany’s Quarterly Report on Form 10-Q for the quarter ended September 30, 2003, is incorporated herein by reference. Alleghany agrees to furnish supplementally a copy of any omitted exhibit or schedule to the Securities and Exchange Commission upon request. | |
| 10.31(a) | Stock Purchase Agreement, dated as of May 19, 2005, by and among Imerys USA, Inc., Imerys, S.A. and Alleghany (the “Imerys Stock Purchase Agreement”), filed as Exhibit 10.1(a) to Alleghany’s Current Report on Form 8-K filed on May 23, 2005, is incorporated herein by reference. | |
182
Table of Contents
| Exhibit Number |
Description | |
| 10.31(b) | List of Contents of Exhibits and Schedules to the Imerys Stock Purchase Agreement, filed as Exhibit 10.1(b) to Alleghany’s Current Report on Form 8-K filed on May 23, 2005, is incorporated herein by reference. Alleghany agrees to furnish supplementally a copy of any omitted exhibit or schedule to the Securities and Exchange Commission upon request. | |
| 10.32(a) | Agreement and Plan of Merger, dated as of June 27, 2008, by and among Darwin, Allied World Assurance Company Holdings, Ltd. and Allied World Merger Company, filed as Exhibit 2.1 to Alleghany’s Current Report on Form 8-K filed on June 30, 2008, is incorporated herein by reference. | |
| 10.32(b) | Voting Agreement, dated as of June 27, 2008, by and between AIHL and Allied World Assurance Company Holdings, Ltd., filed as Exhibit 10.1 to Alleghany’s Current Report on Form 8-K filed on June 30, 2008, is incorporated herein by reference. | |
| 10.33(a) | Credit Agreement, dated as of September 9, 2010, among Alleghany, the lenders which are signatories thereto and U.S. Bank National Association as administrative agent for the lenders (the “Credit Agreement”), filed as Exhibit 10.1(a) to Alleghany’s Current Report on Form 8-K filed on September 14, 2010, is incorporated herein by reference. | |
| 10.33(b) | List of Contents of Exhibits and Schedules to the Credit Agreement, filed as Exhibit 10.1(b) to Alleghany’s Current Report on Form 8-K filed on September 14, 2010, is incorporated herein by reference. Alleghany agrees to furnish supplementally a copy of any omitted exhibit or schedule to the Securities and Exchange Commission upon request. | |
| 10.34 | Security Agreement, dated as of September 9, 2010, by and among the Company and U.S. Bank National Association, as collateral agent, filed as Exhibit 10.2 to Alleghany’s Current Report on Form 8-K filed on September 14, 2010, is incorporated herein by reference. | |
| 10.35 | Voting Agreement, dated as of February 27, 2012, by and between Alleghany and Davis Selected Advisers, L.P., filed as Exhibit 10.1 to Alleghany’s Quarterly Report on Form 10-Q for the quarter ended March 31, 2012, is incorporated herein by reference. | |
| 10.36(a) | Credit Agreement, dated as of October 15, 2013, among the Company, the lenders which are signatories thereto and U.S. Bank National Association, as administrative agent for the Lenders (the “Second Credit Agreement”), filed as Exhibit 10.1(a) to Alleghany’s Current Report on Form 8-K filed on October 21, 2013, is incorporated herein by reference. | |
| 10.36(b) | List of Contents of Exhibits and Schedules to the Second Credit Agreement, filed as Exhibit 10.1(b) to Alleghany’s Current Report on Form 8-K filed on October 21, 2013, is incorporated herein by reference. Alleghany agrees to furnish supplementally a copy of any omitted exhibit or schedule to the Securities and Exchange Commission upon request. | |
| 12.1 | Statement regarding Calculation of Ratio of Earnings to Fixed Charges. | |
| 21 | List of subsidiaries of Alleghany. | |
| 23.1 | Consent of Ernst & Young LLP, independent registered public accounting firm, to the incorporation by reference of its reports relating to the financial statements, the related schedules of Alleghany and subsidiaries and its attestation report. | |
| 31.1 | Certification of the Chief Executive Officer of the Company pursuant to Rule 13a-14(a) or Rule 15(d)-14(a) of the Exchange Act. | |
| 31.2 | Certification of the Chief Financial Officer of the Company pursuant to Rule 13a-14(a) or Rule 15(d)-14(a) of the Exchange Act. | |
183
Table of Contents
| Exhibit Number |
Description | |
| 32.1 | Certification of the Chief Executive Officer pursuant to 18 U.S.C. Section 1350, as adopted pursuant to Section 906 of the Sarbanes-Oxley Act of 2002. This exhibit shall not be deemed “filed” as a part of this Form 10-K. | |
| 32.2 | Certification of the Chief Financial Officer pursuant to 18 U.S.C. Section 1350, as adopted pursuant to Section 906 of the Sarbanes-Oxley Act of 2002. This exhibit shall not be deemed “filed” as a part of this Form 10-K. | |
| 95 | Mine Safety Disclosure required under Regulation 104 of Item S-K. | |
| 101.1 | Interactive Data Files formatted in XBRL (Extensible Business Reporting Language): (i) Consolidated Balance Sheets as of December 31, 2014 and 2013; (ii) Consolidated Statements of Earnings and Comprehensive Income for the years ended December 31, 2014, 2013 and 2012; (iii) Consolidated Statements of Changes in Stockholders’ Equity for the years ended December 31, 2014, 2013 and 2012; (iv) Consolidated Statements of Cash Flows for the years ended December 31, 2014, 2013 and 2012; and (v) Notes to Consolidated Financial Statements. | |
| * | Management contract or a compensatory plan or arrangement. |
| † | Pursuant to Item 601(b)(4)(iii) of Regulation S-K, certain instruments defining the rights of holders of long-term debt securities of Alleghany and its consolidated subsidiaries are not filed because the total amount of securities authorized under such instruments does not exceed 10 percent of the total assets of Alleghany and its subsidiaries on a consolidated basis. A copy of such instruments will be furnished to the Securities and Exchange Commission upon request. |
184