Attached files
| file | filename |
|---|---|
| 8-K - 8-K - Walter Energy, Inc. | a14-14763_18k.htm |
Exhibit 99.1
|
|
Clarkson Capital Markets Coal Roundtable Investor Presentation June 5, 2014 |
|
|
Forward-Looking & Non-GAAP Statements 1 Except for historical information contained herein, the statements in this document are forward-looking and made pursuant to the safe harbor provisions of the Private Securities Litigation Reform Act of 1995 and may involve a number of risks and uncertainties. Forward-looking statements are based on information available to management at the time, and they involve judgments and estimates. Forward-looking statements include expressions such as “believe,” “anticipate,” “expect,” “estimate,” “intend,” “may,” “plan,” “predict,” “will,” and similar terms and expressions. These forward-looking statements are made based on expectations and beliefs concerning future events affecting Walter Energy and are subject to various risks, uncertainties and factors relating to Walter Energy’s operations and business environment, all of which are difficult to predict and many of which are beyond Walter Energy’s control, which could cause Walter Energy’s actual results to differ materially from those matters expressed in or implied by these forward-looking statements. The following factors are among those that may cause actual results to differ materially from Walter Energy’s forward-looking statements: unfavorable economic, financial and business conditions; a substantial or extended decline in pricing, demand, and other factors beyond Walter Energy’s control; failure of Walter Energy’s customers to honor or renew contracts; Walter Energy’s ability to collect payments from its customers; inherent risks in coal mining that are beyond Walter Energy’s control; title defects preventing us from (or resulting in additional costs for) mining Walter Energy’s mineral interests; concentration of Walter Energy’s mining operations in a limited number of areas; a significant reduction of or loss of purchases by Walter Energy’s largest customers; unavailability or uneconomical transportation for Walter Energy’s coal; significant competition and foreign currency fluctuation; significant cost increases and fluctuations, and delay in the delivery of raw materials, mining equipment and purchased components; work stoppages, labor shortages and other labor relations matters; Walter Energy’s ability to hire and retain a skilled labor force; risks associated with Walter Energy’s reclamation and mine closure obligations; inaccuracies in Walter Energy’s estimates of coal reserves; Walter Energy’s ability to develop or acquire coal reserves in an economically feasible manner; challenges to Walter Energy’s licenses, permits and other authorizations; failure to meet project development and expansion targets; risks associated with operating in foreign jurisdictions; risks associated with environmental, health and safety laws and regulations; risks associated with federal, state and provincial regulatory agencies’ authority to order temporary or permanent closure of Walter Energy’s mines; increased focus by regulatory authorities on the effects of surface coal mining on the environment; risks related to climate change concerns; risks related to Walter Energy’s operations’ impact on the environment; risks related to Walter Energy’s indebtedness; Walter Energy’s ability to generate cash for its financial obligations, to refinance its indebtedness or to obtain additional financing; Walter Energy’s ability to incur additional indebtedness; restrictions in Walter Energy’s existing and future debt agreements; events beyond Walter Energy’s control may result in an event of default under one or more of its debt instruments; downgrades in Walter Energy’s credit ratings; failure to obtain or renew surety bonds on acceptable terms could affect Walter Energy’s ability to secure reclamation and coal lease obligations; costs associated with Walter Energy’s pension and benefits, including post-retirement benefits; costs associated with Walter Energy’s workers’ compensation and certain medical and disability benefits; adverse rulings in current or future litigation; Walter Energy’s ability to attract and retain key personnel; Walter Energy’s ability to identify or integrate suitable acquisition candidates to promote growth; volatility in the price of Walter Energy’s common stock; Walter Energy’s ability to pay regular dividends to stockholders; Walter Energy’s exposure to indemnification obligations; risks associated with terrorist attacks and threats and escalation of military activity in response to such attacks; risks associated with cyber-attacks or other security breaches; and other risks and uncertainties including those described in Walter Energy’s filings with the SEC. Forward-looking statements made by Walter Energy in this document, or elsewhere, speak only as of the date on which the statements were made. You are advised to read the risk factors in Walter Energy’s most recently filed Annual Report on Form 10-K and subsequent filings with the SEC, which are available on Walter Energy’s website at www.walterenergy.com and on the SEC’s website at www.sec.gov. New risks and uncertainties arise from time to time, and it is impossible for Walter Energy to predict these events or how they may affect it or its anticipated results. Walter Energy has no duty to, and does not intend to, update or revise the forward-looking statements in this document, except as may be required by law. In light of these risks and uncertainties, readers should keep in mind that any forward-looking statement made in this document may not occur. All data presented herein is as of the date of this document unless otherwise noted. We use a number of different financial measures in assessing the overall performance of our business, including measures calculated in accordance with United States generally accepted accounting principles (“GAAP”) and non-GAAP numbers. EBITDA from Continuing Operations, EBITDA, Adjusted EBITDA and Adjusted Net Income (Loss) are financial measures that are calculated in conformity with GAAP and should be considered supplemental to, and not as a substitute or superior to, financial measures calculated in conformity with GAAP. We believe that EBITDA from Continuing Operations, EBITDA, Adjusted EBITDA and Adjusted Net Income (Loss) are useful measures as some investors and analysts use EBITDA from Continuing Operations, EBITDA, Adjusted EBITDA and Adjusted Net Income (Loss) to compare us against other companies and to help analyze our ability to satisfy principal and interest obligations and capital expenditure needs. EBITDA from Continuing Operations, EBITDA, Adjusted EBITDA and Adjusted Net Income (Loss) may not be comparable to similarly titled measures used by other companies. A reconciliation of these non-GAAP measures is included in the Appendix hereto. |

|
|
Agenda Walter Overview Met Coal Market Update Business Update Appendix 2 |

|
|
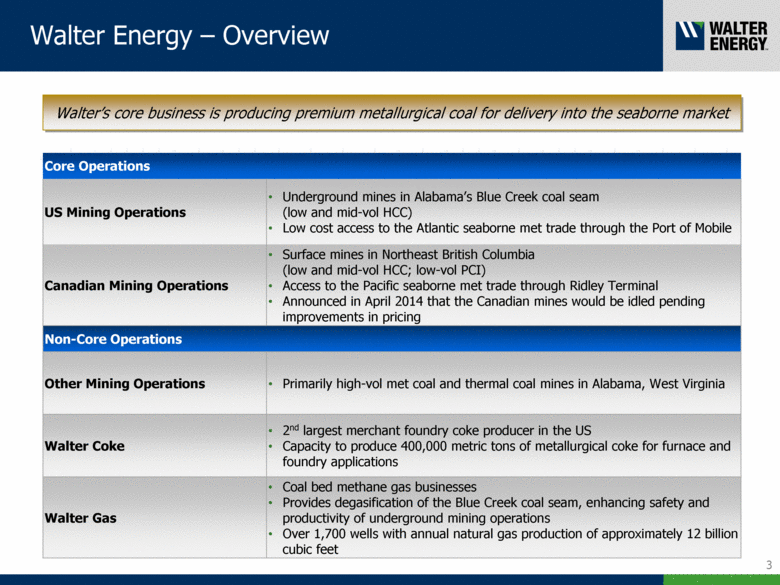
Walter’s core business is producing premium metallurgical coal for delivery into the seaborne market Walter Energy – Overview 3 Core Operations US Mining Operations Underground mines in Alabama’s Blue Creek coal seam (low and mid-vol HCC) Low cost access to the Atlantic seaborne met trade through the Port of Mobile Canadian Mining Operations Surface mines in Northeast British Columbia (low and mid-vol HCC; low-vol PCI) Access to the Pacific seaborne met trade through Ridley Terminal Announced in April 2014 that the Canadian mines would be idled pending improvements in pricing Non-Core Operations Other Mining Operations Primarily high-vol met coal and thermal coal mines in Alabama, West Virginia Walter Coke 2nd largest merchant foundry coke producer in the US Capacity to produce 400,000 metric tons of metallurgical coke for furnace and foundry applications Walter Gas Coal bed methane gas businesses Provides degasification of the Blue Creek coal seam, enhancing safety and productivity of underground mining operations Over 1,700 wells with annual natural gas production of approximately 12 billion cubic feet |
|
|
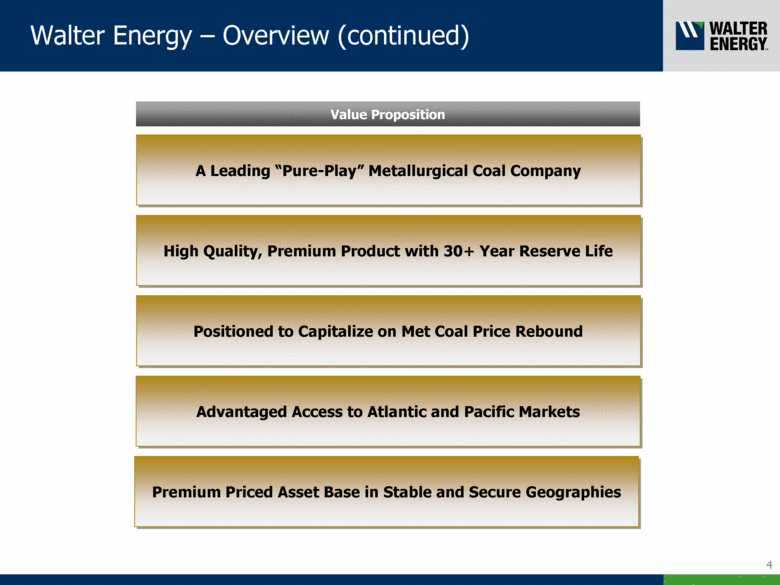
Walter Energy – Overview (continued) 4 Value Proposition A Leading “Pure-Play” Metallurgical Coal Company High Quality, Premium Product with 30+ Year Reserve Life Positioned to Capitalize on Met Coal Price Rebound Advantaged Access to Atlantic and Pacific Markets Premium Priced Asset Base in Stable and Secure Geographies |
|
|
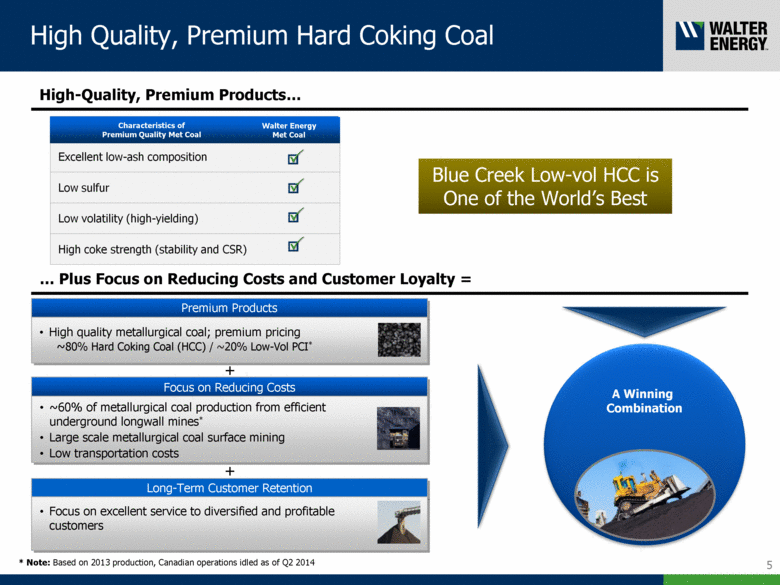
High Quality, Premium Hard Coking Coal 5 Blue Creek Low-vol HCC is One of the World’s Best Plus Focus on Reducing Costs and Customer Loyalty = Premium Products High quality metallurgical coal; premium pricing ~80% Hard Coking Coal (HCC) / ~20% Low-Vol PCI* + Focus on Reducing Costs ~60% of metallurgical coal production from efficient underground longwall mines* Large scale metallurgical coal surface mining Low transportation costs Long-Term Customer Retention Focus on excellent service to diversified and profitable customers A Winning Combination + High-Quality, Premium Products Characteristics of Premium Quality Met Coal Walter Energy Met Coal * Note: Based on 2013 production, Canadian operations idled as of Q2 2014 |
|
|
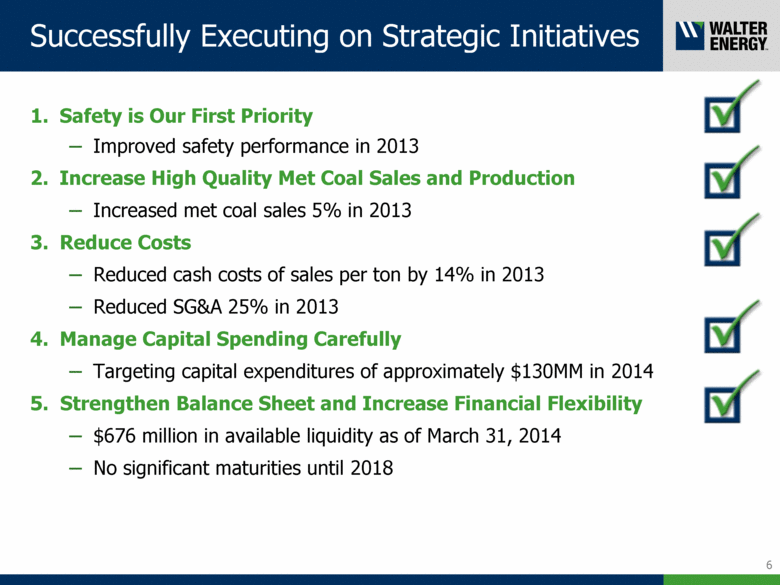
Successfully Executing on Strategic Initiatives Safety is Our First Priority Improved safety performance in 2013 Increase High Quality Met Coal Sales and Production Increased met coal sales 5% in 2013 Reduce Costs Reduced cash costs of sales per ton by 14% in 2013 Reduced SG&A 25% in 2013 Manage Capital Spending Carefully Targeting capital expenditures of approximately $130MM in 2014 5. Strengthen Balance Sheet and Increase Financial Flexibility $676 million in available liquidity as of March 31, 2014 No significant maturities until 2018 6 |
|
|
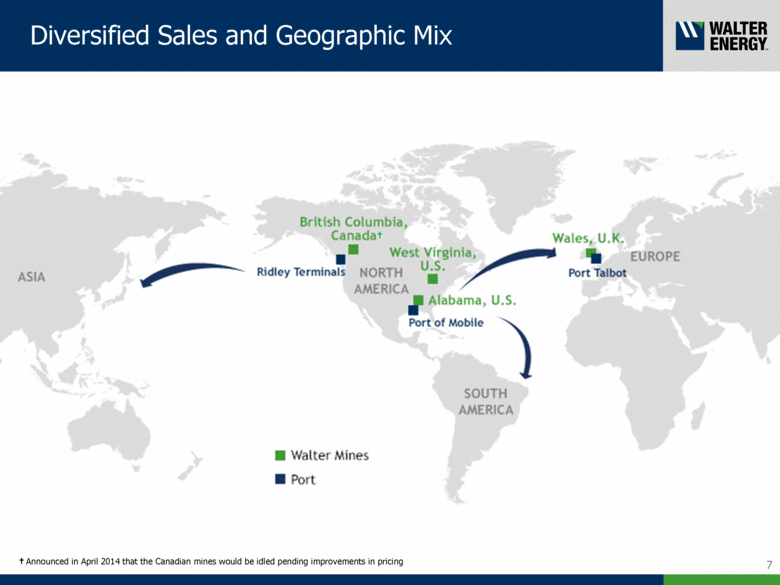
Diversified Sales and Geographic Mix 7 † Announced in April 2014 that the Canadian mines would be idled pending improvements in pricing † |
|
|
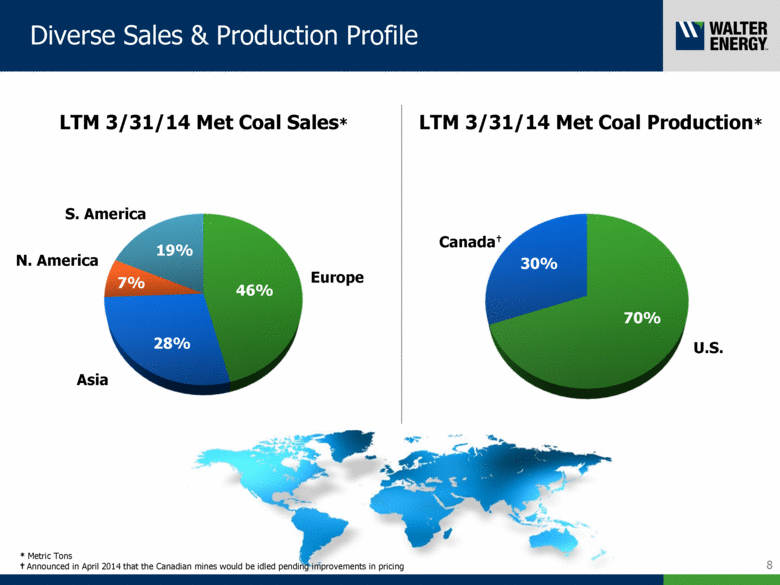
Diverse Sales & Production Profile 8 LTM 3/31/14 Met Coal Sales* Europe Asia S. America N. America 70% 30% 46% 19% 7% 28% U.S. LTM 3/31/14 Met Coal Production* * Metric Tons † Announced in April 2014 that the Canadian mines would be idled pending improvements in pricing Canada† |
|
|
Agenda Walter Overview Met Coal Market Update Business Update Appendix 9 |

|
|
10 Seaborne Met Coal Market Update Metallurgical coal prices at cyclical low Q2 2014 HCC benchmark coal priced at $120/MT, down from Q1 2014 benchmark price of $143/MT Current prices unsustainable Met coal prices have stabilized Demand in Walter Energy’s primary markets has continued to grow Steel production grew almost 7% in Europe in Q1 and South America was up slightly Steel production in Korea and Japan grew 5% and 3.5%, respectively in Q1 Market is oversupplied Increase in Australian production during 2013 Production cuts taking place (appr. 15 MMTs in announced cuts in 2014) >50% of seaborne met coal supply is generating negative cash margins at current prices* * Note: Based on Wood Mackenzie 2013 data @$120/t benchmark hard coking coal |
|
|
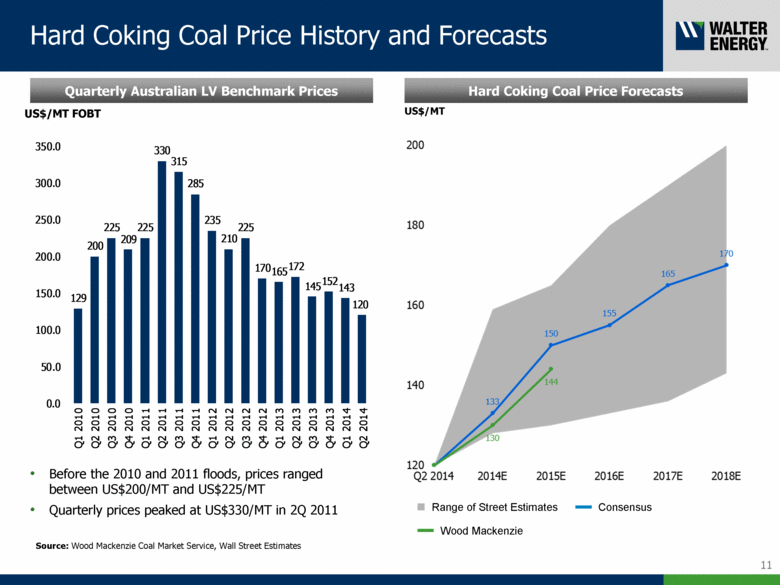
Hard Coking Coal Price History and Forecasts 11 0 47 95 0 98 214 63 156 53 121 121 121 152 52 9 35 91 110 82 71 0 181 181 181 Quarterly Australian LV Benchmark Prices Before the 2010 and 2011 floods, prices ranged between US$200/MT and US$225/MT Quarterly prices peaked at US$330/MT in 2Q 2011 Source: Wood Mackenzie Coal Market Service, Wall Street Estimates US$/MT FOBT Hard Coking Coal Price Forecasts Range of Street Estimates Consensus Wood Mackenzie US$/MT 129 200 225 209 225 330 315 285 235 210 225 170 165 172 145 152 143 120 0.0 50.0 100.0 150.0 200.0 250.0 300.0 350.0 Q1 2010 Q2 2010 Q3 2010 Q4 2010 Q1 2011 Q2 2011 Q3 2011 Q4 2011 Q1 2012 Q2 2012 Q3 2012 Q4 2012 Q1 2013 Q2 2013 Q3 2013 Q4 2013 Q1 2014 Q2 2014 |
|
|
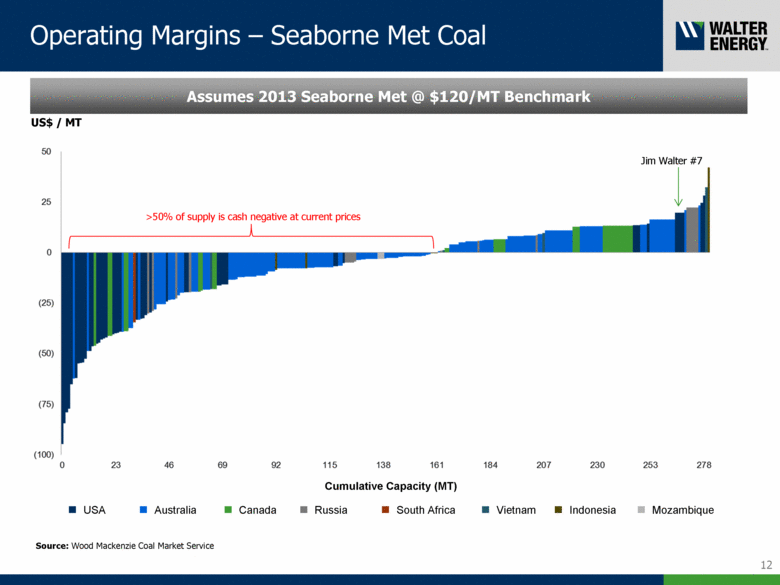
Operating Margins – Seaborne Met Coal 12 US$ / MT 0 47 95 0 98 214 63 156 53 121 121 121 152 52 9 35 91 110 82 71 0 181 181 181 Source: Wood Mackenzie Coal Market Service Canada Vietnam USA South Africa Australia Indonesia Mozambique Jim Walter #7 Cumulative Capacity (MT) Assumes 2013 Seaborne Met @ $120/MT Benchmark >50% of supply is cash negative at current prices Russia |
|
|
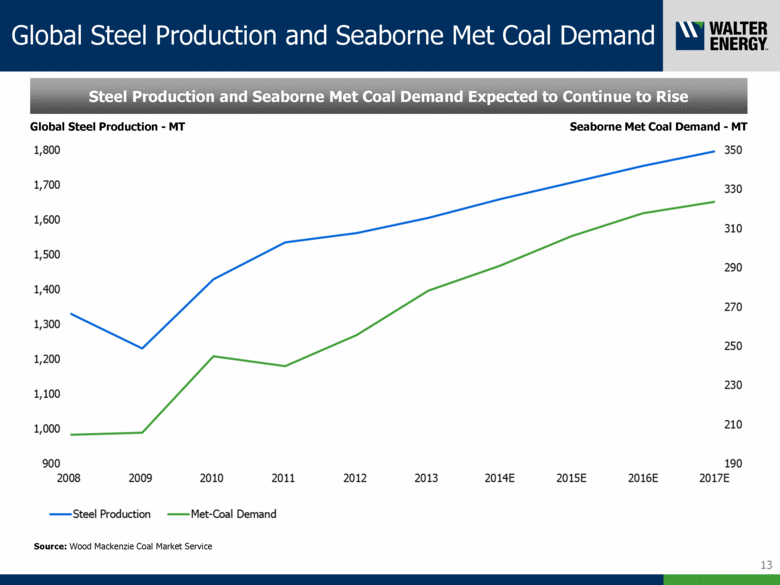
Global Steel Production and Seaborne Met Coal Demand 13 Steel Production and Seaborne Met Coal Demand Expected to Continue to Rise 0 47 95 0 98 214 63 156 53 121 121 121 152 52 9 35 91 110 82 71 0 181 181 181 Source: Wood Mackenzie Coal Market Service Global Steel Production - MT Seaborne Met Coal Demand - MT |
|
|
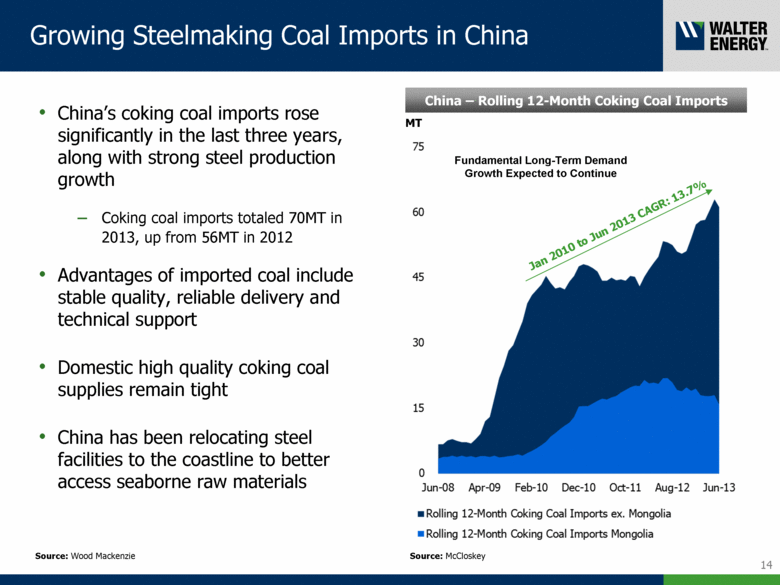
14 Growing Steelmaking Coal Imports in China China’s coking coal imports rose significantly in the last three years, along with strong steel production growth Coking coal imports totaled 70MT in 2013, up from 56MT in 2012 Advantages of imported coal include stable quality, reliable delivery and technical support Domestic high quality coking coal supplies remain tight China has been relocating steel facilities to the coastline to better access seaborne raw materials China – Rolling 12-Month Coking Coal Imports Source: McCloskey MT Jan 2010 to Jun 2013 CAGR: 13.7% Fundamental Long-Term Demand Growth Expected to Continue Source: Wood Mackenzie |
|
|
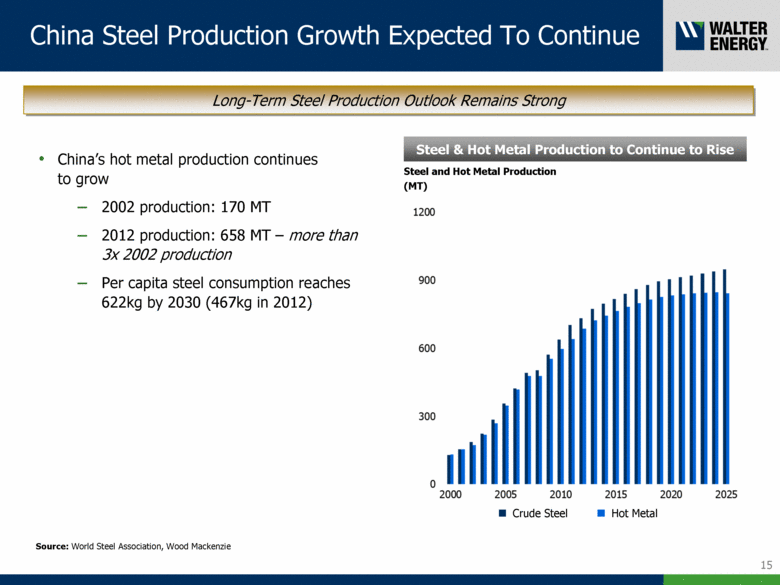
15 China Steel Production Growth Expected To Continue Steel & Hot Metal Production to Continue to Rise Steel and Hot Metal Production (MT) Hot Metal Long-Term Steel Production Outlook Remains Strong China’s hot metal production continues to grow 2002 production: 170 MT 2012 production: 658 MT – more than 3x 2002 production Per capita steel consumption reaches 622kg by 2030 (467kg in 2012) Source: World Steel Association, Wood Mackenzie Crude Steel |
|
|
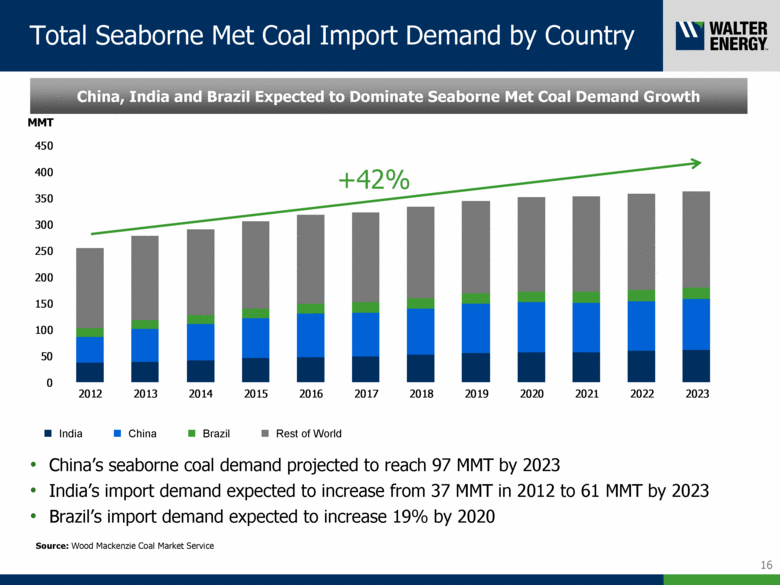
Total Seaborne Met Coal Import Demand by Country 16 0 47 95 0 98 214 63 156 53 121 121 121 152 52 9 35 91 110 82 71 0 181 181 181 China, India and Brazil Expected to Dominate Seaborne Met Coal Demand Growth China’s seaborne coal demand projected to reach 97 MMT by 2023 India’s import demand expected to increase from 37 MMT in 2012 to 61 MMT by 2023 Brazil’s import demand expected to increase 19% by 2020 Source: Wood Mackenzie Coal Market Service MMT India China Brazil Rest of World +42% 0 50 100 150 200 250 300 350 400 450 2012 2013 2014 2015 2016 2017 2018 2019 2020 2021 2022 2023 |
|
|
Agenda Walter Overview Met Coal Market Update Business Update Appendix 17 |

|
|
18 Walter Energy Q1 2014 and Full-Year 2013 Highlights Met coal cash costs of production decreased 23% in Q1 2014 year over year SG&A expenses were 32% lower than in the same period last year Capital expenditures declined by 64% year over year and by 73% from Q4 2013 Operating loss decreased by 26% year over year Q1 2014 Highlights 2013 met coal cash costs of production declined by 18% from 2012 Met coal sales volumes increased by 5% year over year SG&A expenses declined from 2012 by 25% 2013 Capex totaled $154MM compared with $392MM in 2012 Refinanced debt and improved financial flexibility Full-Year 2013 Highlights |
|
|
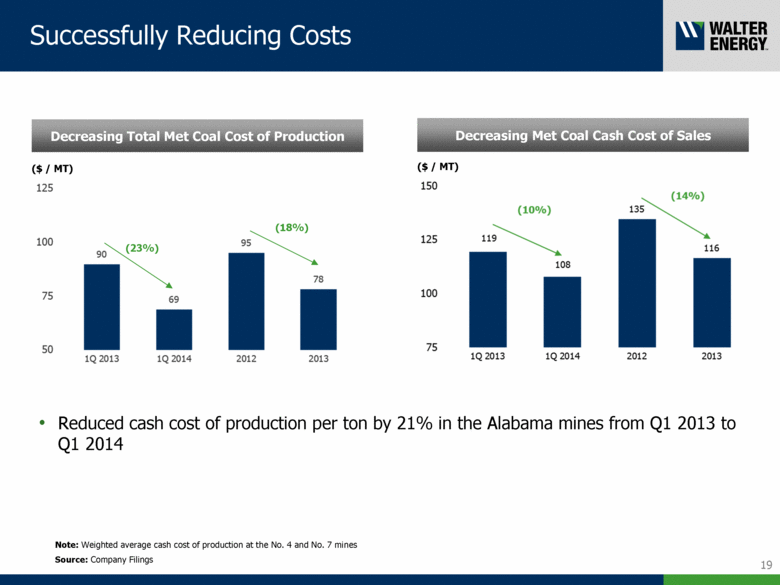
Decreasing Total Met Coal Cost of Production 19 ($ / MT) (23%) Successfully Reducing Costs Reduced cash cost of production per ton by 21% in the Alabama mines from Q1 2013 to Q1 2014 Decreasing Met Coal Cash Cost of Sales ($ / MT) Source: Company Filings (18%) Note: Weighted average cash cost of production at the No. 4 and No. 7 mines |
|
|
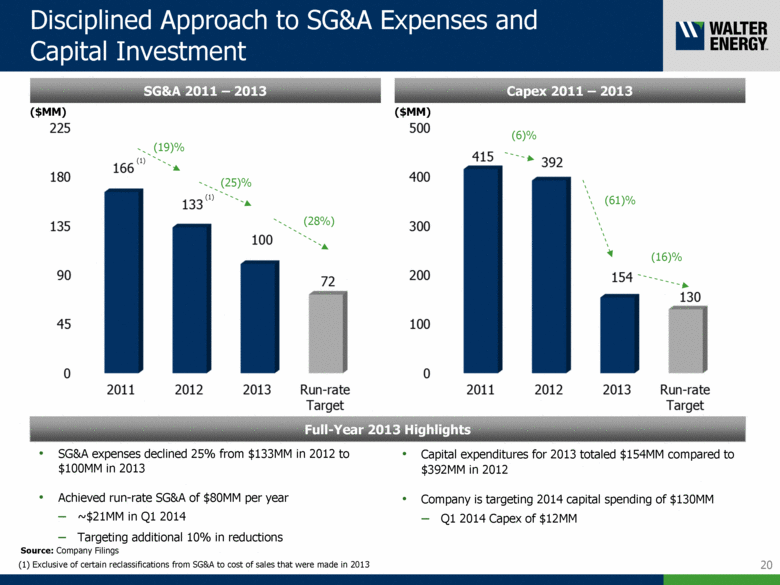
Disciplined Approach to SG&A Expenses and Capital Investment 20 Full-Year 2013 Highlights SG&A 2011 – 2013 ($MM) SG&A expenses declined 25% from $133MM in 2012 to $100MM in 2013 Achieved run-rate SG&A of $80MM per year ~$21MM in Q1 2014 Targeting additional 10% in reductions (19)% (25)% Capex 2011 – 2013 ($MM) (61)% (6)% Capital expenditures for 2013 totaled $154MM compared to $392MM in 2012 Company is targeting 2014 capital spending of $130MM Q1 2014 Capex of $12MM (28%) (1) (1) Exclusive of certain reclassifications from SG&A to cost of sales that were made in 2013 (1) Source: Company Filings (16)% |
|
|
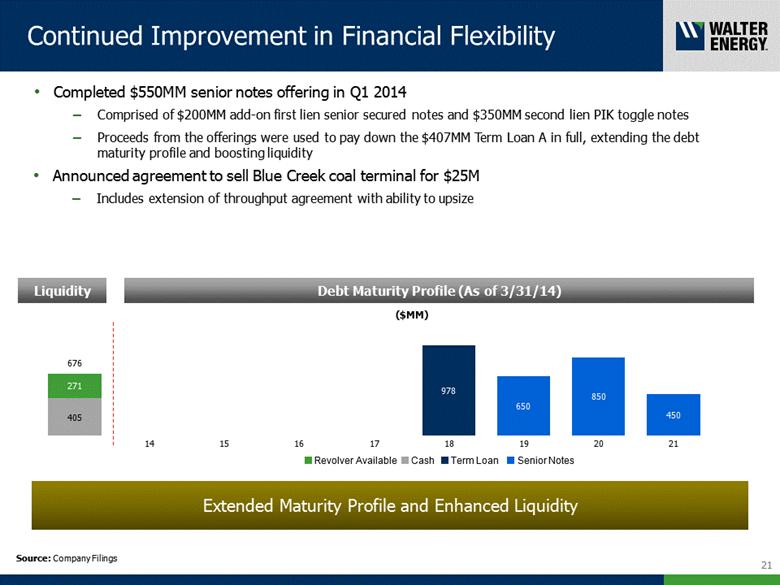
Debt Maturity Profile (As of 3/31/14) 21 Continued Improvement in Financial Flexibility ($MM) Completed $550MM senior notes offering in Q1 2014 Comprised of $200MM add-on first lien senior secured notes and $350MM second lien PIK toggle notes Proceeds from the offerings were used to pay down the $407MM Term Loan A in full, extending the debt maturity profile and boosting liquidity Extended Maturity Profile and Enhanced Liquidity Liquidity Revolver Available Source: Company Filings Announced agreement to sell Blue Creek coal terminal for $25M Includes extension of throughput agreement with ability to upsize |
|
|
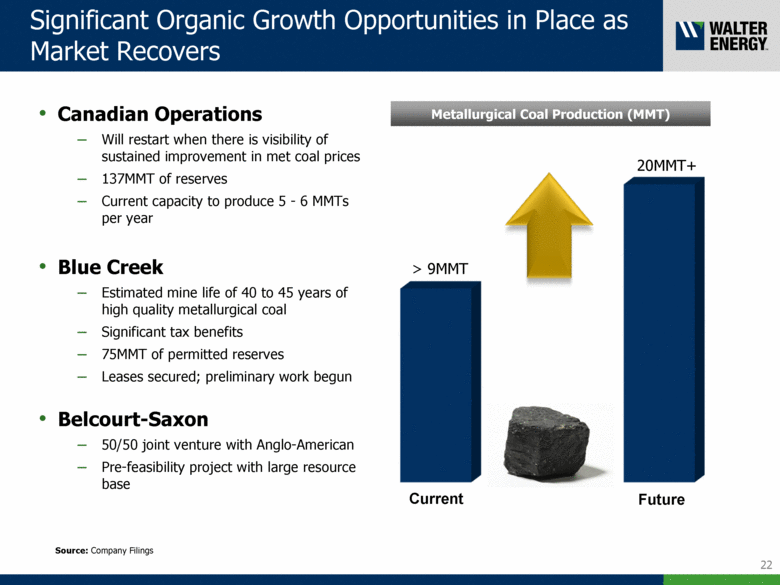
22 > 9MMT Significant Organic Growth Opportunities in Place as Market Recovers 20MMT+ Canadian Operations Will restart when there is visibility of sustained improvement in met coal prices 137MMT of reserves Current capacity to produce 5 - 6 MMTs per year Blue Creek Estimated mine life of 40 to 45 years of high quality metallurgical coal Significant tax benefits 75MMT of permitted reserves Leases secured; preliminary work begun Belcourt-Saxon 50/50 joint venture with Anglo-American Pre-feasibility project with large resource base Metallurgical Coal Production (MMT) Source: Company Filings Current Future |
|
|
Agenda Walter Overview Met Coal Market Update Business Update Appendix 23 |
|
|
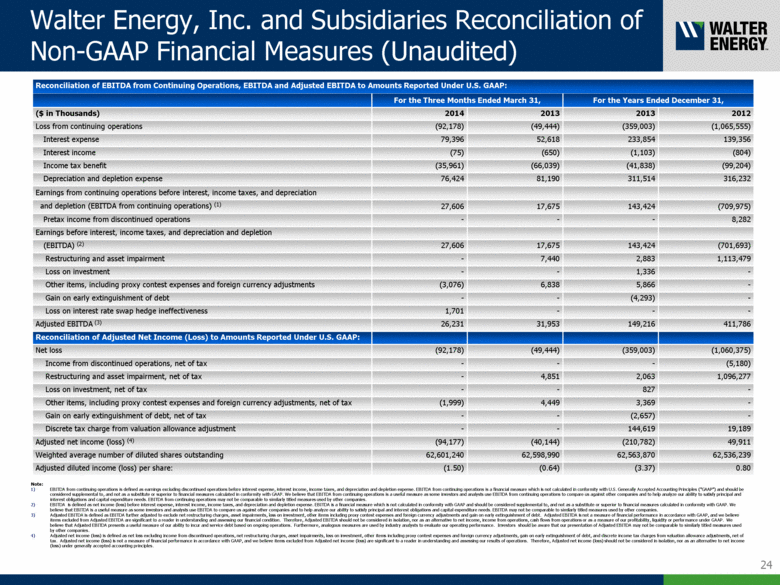
Walter Energy, Inc. and Subsidiaries Reconciliation of Non-GAAP Financial Measures (Unaudited) Note: EBITDA from continuing operations is defined as earnings excluding discontinued operations before interest expense, interest income, income taxes, and depreciation and depletion expense. EBITDA from continuing operations is a financial measure which is not calculated in conformity with U.S. Generally Accepted Accounting Principles ("GAAP") and should be considered supplemental to, and not as a substitute or superior to financial measures calculated in conformity with GAAP. We believe that EBITDA from continuing operations is a useful measure as some investors and analysts use EBITDA from continuing operations to compare us against other companies and to help analyze our ability to satisfy principal and interest obligations and capital expenditure needs. EBITDA from continuing operations may not be comparable to similarly titled measures used by other companies. EBITDA is defined as net income (loss) before interest expense, interest income, income taxes, and depreciation and depletion expense. EBITDA is a financial measure which is not calculated in conformity with GAAP and should be considered supplemental to, and not as a substitute or superior to financial measures calculated in conformity with GAAP. We believe that EBITDA is a useful measure as some investors and analysts use EBITDA to compare us against other companies and to help analyze our ability to satisfy principal and interest obligations and capital expenditure needs. EBITDA may not be comparable to similarly titled measures used by other companies. Adjusted EBITDA is defined as EBITDA further adjusted to exclude net restructuring charges, asset impairments, loss on investment, other items including proxy contest expenses and foreign currency adjustments and gain on early extinguishment of debt. Adjusted EBITDA is not a measure of financial performance in accordance with GAAP, and we believe items excluded from Adjusted EBITDA are significant to a reader in understanding and assessing our financial condition. Therefore, Adjusted EBITDA should not be considered in isolation, nor as an alternative to net income, income from operations, cash flows from operations or as a measure of our profitability, liquidity or performance under GAAP. We believe that Adjusted EBITDA presents a useful measure of our ability to incur and service debt based on ongoing operations. Furthermore, analogous measures are used by industry analysts to evaluate our operating performance. Investors should be aware that our presentation of Adjusted EBITDA may not be comparable to similarly titled measures used by other companies. Adjusted net income (loss) is defined as net loss excluding income from discontinued operations, net restructuring charges, asset impairments, loss on investment, other items including proxy contest expenses and foreign currency adjustments, gain on early extinguishment of debt, and discrete income tax charges from valuation allowance adjustments, net of tax. Adjusted net income (loss) is not a measure of financial performance in accordance with GAAP, and we believe items excluded from Adjusted net income (loss) are significant to a reader in understanding and assessing our results of operations. Therefore, Adjusted net income (loss) should not be considered in isolation, nor as an alternative to net income (loss) under generally accepted accounting principles. 24 Reconciliation of EBITDA from Continuing Operations, EBITDA and Adjusted EBITDA to Amounts Reported Under U.S. GAAP: For the Three Months Ended March 31, For the Years Ended December 31, ($ in Thousands) 2014 2013 2013 2012 Loss from continuing operations (92,178) (49,444) (359,003) (1,065,555) Interest expense 79,396 52,618 233,854 139,356 Interest income (75) (650) (1,103) (804) Income tax benefit (35,961) (66,039) (41,838) (99,204) Depreciation and depletion expense 76,424 81,190 311,514 316,232 Earnings from continuing operations before interest, income taxes, and depreciation and depletion (EBITDA from continuing operations) (1) 27,606 17,675 143,424 (709,975) Pretax income from discontinued operations - - - 8,282 Earnings before interest, income taxes, and depreciation and depletion (EBITDA) (2) 27,606 17,675 143,424 (701,693) Restructuring and asset impairment - 7,440 2,883 1,113,479 Loss on investment - - 1,336 - Other items, including proxy contest expenses and foreign currency adjustments (3,076) 6,838 5,866 - Gain on early extinguishment of debt - - (4,293) - Loss on interest rate swap hedge ineffectiveness 1,701 - - - Adjusted EBITDA (3) 26,231 31,953 149,216 411,786 Reconciliation of Adjusted Net Income (Loss) to Amounts Reported Under U.S. GAAP: Net loss (92,178) (49,444) (359,003) (1,060,375) Income from discontinued operations, net of tax - - - (5,180) Restructuring and asset impairment, net of tax - 4,851 2,063 1,096,277 Loss on investment, net of tax - - 827 - Other items, including proxy contest expenses and foreign currency adjustments, net of tax (1,999) 4,449 3,369 - Gain on early extinguishment of debt, net of tax - - (2,657) - Discrete tax charge from valuation allowance adjustment - - 144,619 19,189 Adjusted net income (loss) (4) (94,177) (40,144) (210,782) 49,911 Weighted average number of diluted shares outstanding 62,601,240 62,598,990 62,563,870 62,536,239 Adjusted diluted income (loss) per share: (1.50) (0.64) (3.37) 0.80 |