Attached files
| file | filename |
|---|---|
| 8-K - 8-K - Diversicare Healthcare Services, Inc. | a8k-6514annualshareholderm.htm |

Annual Meeting of Shareholders June 5, 2014

Forward-Looking Statements Forward-looking statements made in this presentation involve a number of risks and uncertainties, but not limited to, our ability to successfully operate the new nursing centers in Alabama, Kansas, Kentucky, Ohio, and Indiana, our ability to increase patients served at our renovated centers, changes in governmental reimbursement, government regulation, the impact of the recently adopted federal health care reform or any future health care reform, any increases in the cost of borrowing under our credit agreements, our ability to comply with covenants contained in those credit agreements, the outcome of professional liability lawsuits and claims, our ability to control ultimate professional liability costs, the accuracy of our estimate of our anticipated professional liability expense, the impact of future licensing surveys, the outcome of proceedings alleging violations of state or Federal False Claims Acts, laws and regulations governing quality of care or other laws and regulations applicable to our business including laws governing reimbursement from government payers, impacts associated with the implementation of our electronic medical records plan, the costs of investing in our business initiatives and development, our ability to control costs, changes to our valuation of deferred tax assets, changes in occupancy rates in our centers, changing economic and competitive conditions, changes in anticipated revenue and cost growth, changes in the anticipated results of operations, the effect of changes in accounting policies as well as other risk factors detailed in the Company's Securities and Exchange Commission filings. The Company has provided additional information in its Annual Report on Form 10-K for the fiscal year ended December 31, 2013, as well as in other filings with the Securities and Exchange Commission, which readers are encouraged to review for further disclosure of other factors that could cause actual results to differ materially from those indicated in the forward-looking statements. 2

• Joined Diversicare in 2013 as COO • 20+ years of experience in the LTC industry • Previous senior leadership positions at: ‒ Golden Living Senior Leadership 3 • Joined Diversicare In 2012 As CFO • 10 Years Of Senior Finance Positions In The Healthcare Industry • Previous Senior Leadership Positions At: ‒ NuscriptRX ‒ Take Care Health Systems ‒ I-TRAX, Inc. (CHD Meridian) • Joined Diversicare In 2010 • 25 Years+ Of Experience In The LTC Industry • Previous Senior Leadership Positions At: ‒ Beverly ‒ Living Centers Of America ‒ Skilled Healthcare • SNF – Rehab - Hospice Jay McKnight Chief Financial Officer Kelly Gill CEO, President & Director Leslie Campbell Chief Operating Officer

• Member Of The Board Of Directors Of The Company Since Inception In 1994. • Audit, Governance And Nominating Committees Board Of Directors 4 • Member Of The Board Of Directors Of The Company Since March 2002. • Compensation, Governance And Nominating Committees • Member Of The Board Of Directors Of The Company Since March 2008 • Audit, Compensation, And Risk Management Committees Wallace E. Olson Vice Chairman Chad A. McCurdy Chairman William C. O’Neil, Jr. Director • Member Of The Board Of Directors Of The Company Since July 2005. • Audit, Governance, Nominating And Risk Management Committees • Member Of The Board Of Directors Of The Company Since December 2002. • Audit And Risk Management Committees Robert Z. Hensley Director Richard M. Brame Director

Investment Highlights Leading Skilled Nursing Provider Compelling Demographic Trends Management’s Strategic Vision Yielding Results Improving Patient Quality Measures, Census And Skilled Mix Demonstrated Ability To Grow And Enhance Portfolio Positively Trending Financial Results 5

Diversicare At A Glance 2013 Revenue $282M - Q1 2014 Run Rate Revenue $334M 49 SNF’s - 5,522 Licensed Beds - 9 States Headquartered In Brentwood, TN 6 NE CO OK LA FL (1) IA IL KS (5) OH (4) IN (1) MO AR KY (10) TN (5) PA MS AL (6) SC NC GA VA WV (3) * Diversicare plans to exit West Virginia TX (13)

Compelling Industry Demographics 7 • SNF’s - The Low Cost Provider Of Institutional Post-acute Care • Long Term Care Spending Continues To Increase ‒ Medicare And Medicaid Expenditures For SNF’s Expected To Grow 84% From 2011 To 2021 ‒ Annual Spending On Older Adults Is Expected To Increase By 250% By 2040 0.0% 5.0% 10.0% 15.0% 20.0% 25.0% 30.0% 1980 1990 2000 2010 2020 2030 2040 2050 Age 85 and older Age 60 and older Age 65 and older Rising Demand Seniors As A Percentage Of Total US Population Stable Supply Number Of Certified Nursing Facilities 0 2,000 4,000 6,000 8,000 10,000 12,000 14,000 16,000 2003 2004 2005 2006 2007 2008 2009 2010 2011 Source: Kaiser Family Foundation Source: Department of Health and Human Services Between 2010 – 2050 US Population Over 65 Is Projected To Double From 40.2 To 88.5 Million

Core Foundation Activities Investments Made In Internal Improvements And Scalability Position Diversicare For External Growth 8 2010 Today Expanded Focus Now On Portfolio Growth Phase 1 & Ongoing Phase 2 Platform Development Operational Improvement Facility Renovations
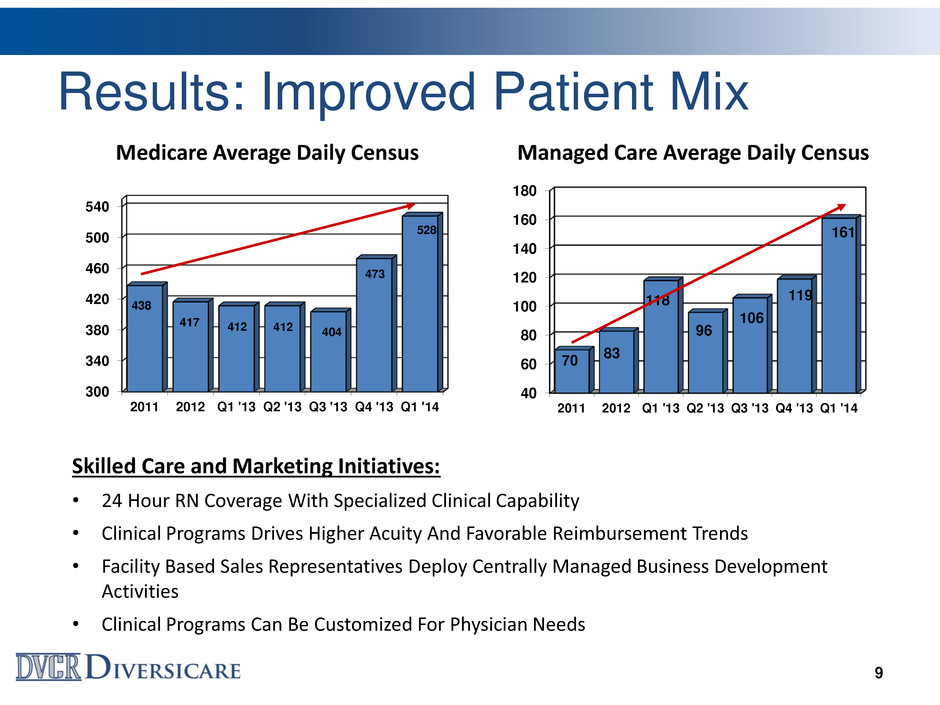
Results: Improved Patient Mix Medicare Average Daily Census Managed Care Average Daily Census 9 300 340 380 420 460 500 540 2011 2012 Q1 '13 Q2 '13 Q3 '13 Q4 '13 Q1 '14 438 417 412 412 404 473 528 40 60 80 100 120 140 160 180 2011 2012 Q1 '13 Q2 '13 Q3 '13 Q4 '13 Q1 '14 70 83 118 96 106 119 161 Skilled Care and Marketing Initiatives: • 24 Hour RN Coverage With Specialized Clinical Capability • Clinical Programs Drives Higher Acuity And Favorable Reimbursement Trends • Facility Based Sales Representatives Deploy Centrally Managed Business Development Activities • Clinical Programs Can Be Customized For Physician Needs

$145 $150 $155 $160 $165 Q3 '10 Q4 '10 Q1 '11 Q2 '11 Q3 '11 Q4 '11 Q1 '12 Q2 '12 Q3 '12 Q4 '12 Q1 '13 Q2 '13 Q3 '13 Q4 '13 Q1 '14 147.93 161.98 $380 $400 $420 $440 $460 $480 $500 Q3 '10 Q4 '10 Q1 '11 Q2 '11 Q3 '11 Q4 '11 Q1 '12 Q2 '12 Q3 '12 Q4 '12 Q1 '13 Q2 '13 Q3 '13 Q4 '13 Q1 '14 394.23 438.91 Results: Rate Increases Driven By Higher Acuity Medicare Rate Per Day Medicaid Rate Per Day Medicare Rate Growth Driven By Acuity 11.3% Increase From Q3 ‘10 To Q1 ‘14 Medicaid Rates Driven By Acuity 9.3% Increase From Q3 ‘10 To Q1 ‘14 10

Results: G&A Leverage 11 5.0% 6.0% 7.0% 8.0% 9.0% 10.0% Q1 '12 Q2 '12 Q3 '12 Q4 '12 Q1 '13 Q2 '13 Q3 '13 Q4 '13 Q1 '14 G&A Expense As A % Of Revenue G&A Reduction Efforts Enacted In Q1 ’12 Right Sized Overhead Structure For New Portfolio Centralized Core Functions To Leverage Skilled Teams Savings From G&A Reductions Funded Strategic Investments G&A Increased In First Half ‘13 Due To Acquisition Activity

Revenue Growth and Cost Management Revenue Growth Through Acquisitions Facility-Level Margins Improving G&A Growth In Early ‘13 Due To Acquisition Scalability: Downward Trend Despite M&A Costs 12

Results: Improved Quality Measures 13 12.5% 18.8% 31.3% 16.7% 12.5% 0% 10% 20% 30% 40% 50% 60% 70% 1 Star 2 Star 3 Star 4 Star 5 Star Five Star Ratings – Quality Measures December 2008 0.0% 2.1% 4.2% 27.1% 64.6% 0% 10% 20% 30% 40% 50% 60% 70% 1 Star 2 Star 3 Star 4 Star 5 Star Five Star Ratings – Quality Measures April 2014 91.7% Of Diversicare Centers Were Rated 4 Or 5 Star In Terms Of Quality Measures Compared To 29.2% As Of December 2008
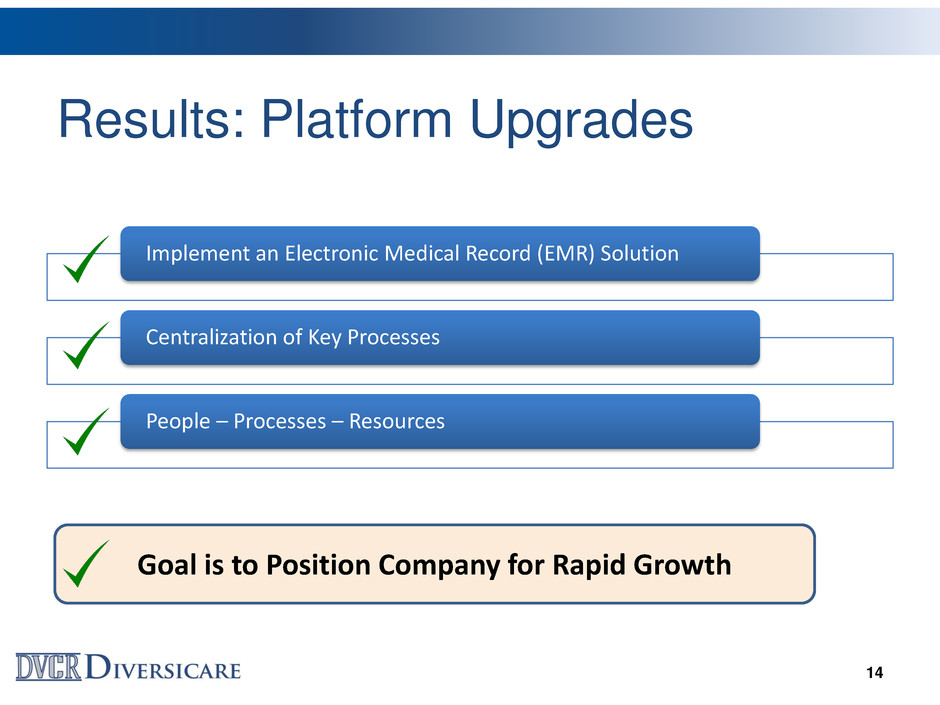
Results: Platform Upgrades Implement an Electronic Medical Record (EMR) Solution Centralization of Key Processes People – Processes – Resources 14 Goal is to Position Company for Rapid Growth

Results: Facility Renovations Initiative $29.1 Million Invested Since 2010 Renovations Completed At 17 Facilities 2 Facilities In Progress Others In Development Average Occupancy Improvement: 328 BPS Combined Medicare Utilization Improvement: 267 BPS 15
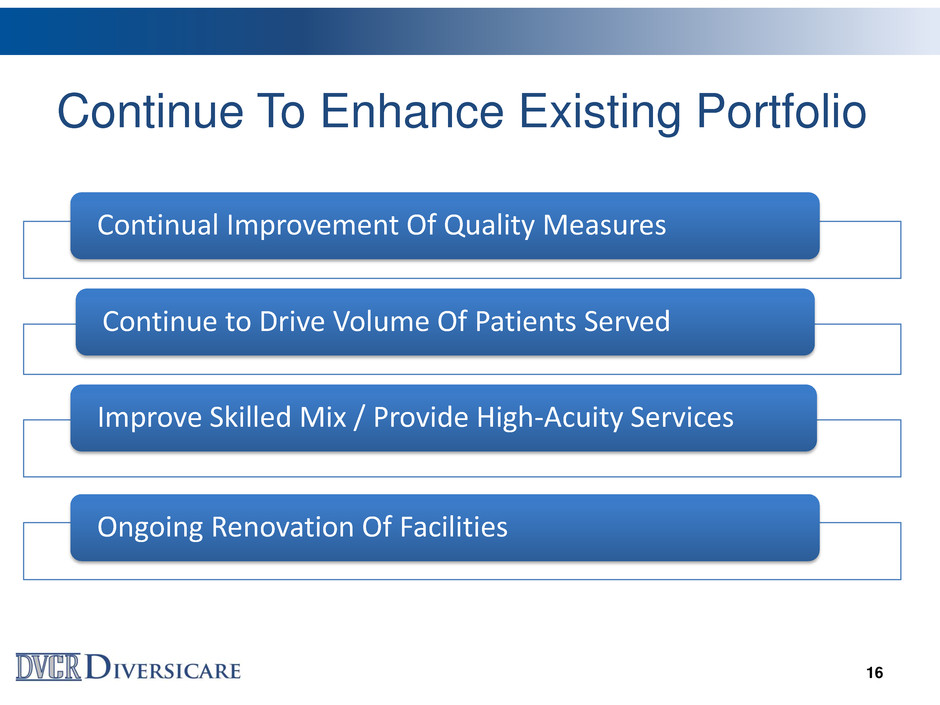
Continue To Enhance Existing Portfolio 16 Continual Improvement Of Quality Measures Continue to Drive Volume Of Patients Served Improve Skilled Mix / Provide High-Acuity Services Ongoing Renovation Of Facilities

Portfolio Growth Is Now Added Focus Active Pipeline And Buyer-Friendly Market Target 5-10 New Facilities Per Year Expanded Operating Infrastructure = Scalability Flexibility On Structure = Several Sources Of Financial Capacity 17

Results: Quarterly Revenue Trends 18 * Same-store Group Represents All Centers Not Included In Respective Acquisition Groups Above. Does Not Include New Acquisitions Finalized Subsequent To Q1 2014. Qu ar terly R ev en u e (milli o n s)
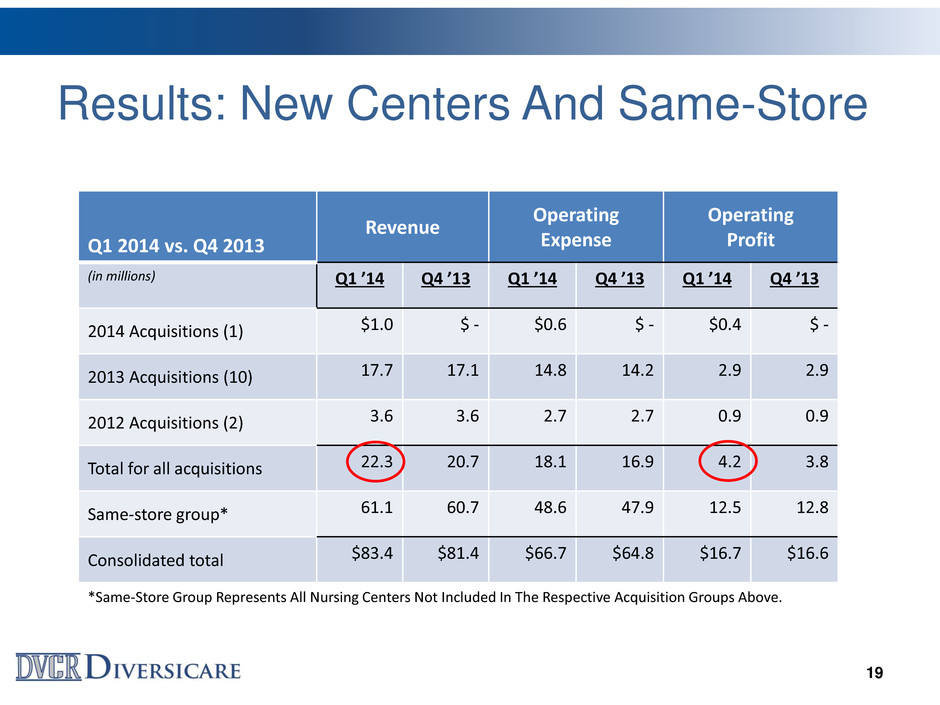
Results: New Centers And Same-Store 19 Q1 2014 vs. Q4 2013 Revenue Operating Expense Operating Profit (in millions) Q1 ’14 Q4 ’13 Q1 ’14 Q4 ’13 Q1 ’14 Q4 ’13 2014 Acquisitions (1) $1.0 $ - $0.6 $ - $0.4 $ - 2013 Acquisitions (10) 17.7 17.1 14.8 14.2 2.9 2.9 2012 Acquisitions (2) 3.6 3.6 2.7 2.7 0.9 0.9 Total for all acquisitions 22.3 20.7 18.1 16.9 4.2 3.8 Same-store group* 61.1 60.7 48.6 47.9 12.5 12.8 Consolidated total $83.4 $81.4 $66.7 $64.8 $16.7 $16.6 *Same-Store Group Represents All Nursing Centers Not Included In The Respective Acquisition Groups Above.

Results: Impact Of New Centers 20 Most Acquisitions Are Accretive To Earnings Within A Quarter Of Acquisitions Date – The Exceptions Being Development Opportunities Like Rose Terrace & Clinton, KY Demonstrated Platform Scalability By Increasing Revenues With A Resulting Reduction in G&A Expense As Percentage Of Revenue New Facility Integration, Including EMR, Implemented During The First Quarter Of Operations At New Facilities
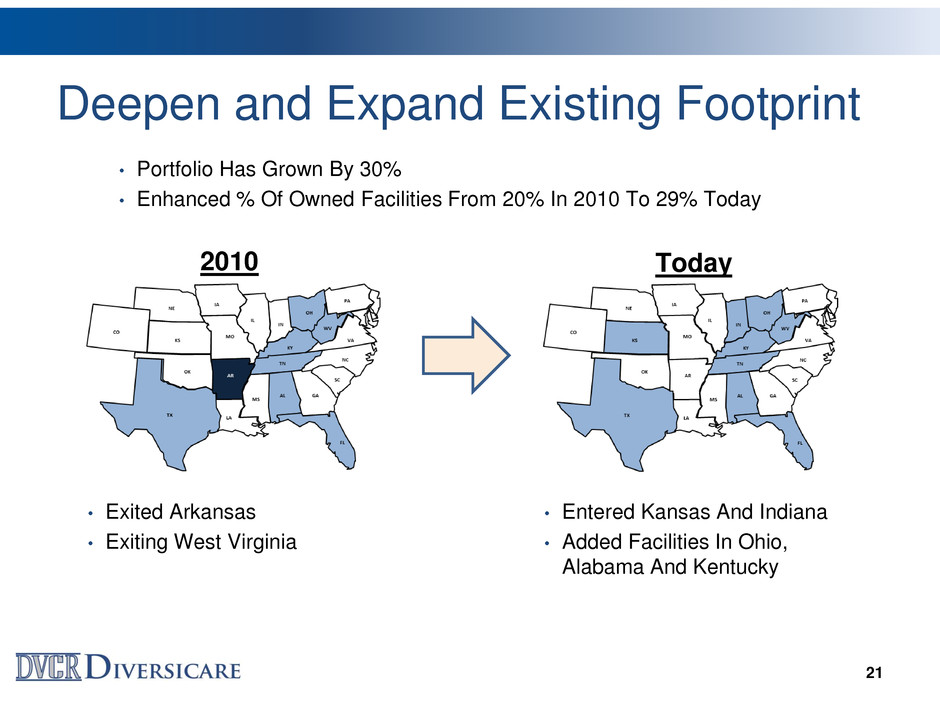
Deepen and Expand Existing Footprint 21 Today 2010 • Portfolio Has Grown By 30% • Enhanced % Of Owned Facilities From 20% In 2010 To 29% Today • Exited Arkansas • Exiting West Virginia • Entered Kansas And Indiana • Added Facilities In Ohio, Alabama And Kentucky

Flexible Acquisition Structures Broaden Pipeline • Full Ownership Of Assets • Participate In Value Appreciation • Enhance Facility Ownership Fee-Simple Acquisition • Minimal Capital Required • Leverage Turnaround Capabilities • Leverage Strong REIT Relationships Assumption Of Leases 22 2010 Today 20% 29% 80% 71%
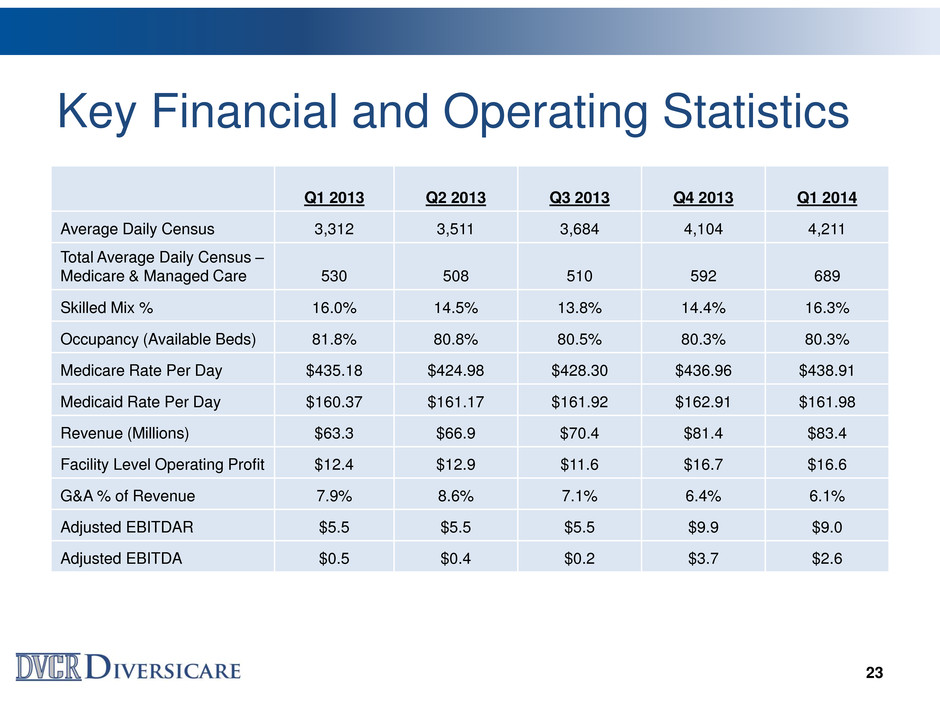
Key Financial and Operating Statistics Q1 2013 Q2 2013 Q3 2013 Q4 2013 Q1 2014 Average Daily Census 3,312 3,511 3,684 4,104 4,211 Total Average Daily Census – Medicare & Managed Care 530 508 510 592 689 Skilled Mix % 16.0% 14.5% 13.8% 14.4% 16.3% Occupancy (Available Beds) 81.8% 80.8% 80.5% 80.3% 80.3% Medicare Rate Per Day $435.18 $424.98 $428.30 $436.96 $438.91 Medicaid Rate Per Day $160.37 $161.17 $161.92 $162.91 $161.98 Revenue (Millions) $63.3 $66.9 $70.4 $81.4 $83.4 Facility Level Operating Profit $12.4 $12.9 $11.6 $16.7 $16.6 G&A % of Revenue 7.9% 8.6% 7.1% 6.4% 6.1% Adjusted EBITDAR $5.5 $5.5 $5.5 $9.9 $9.0 Adjusted EBITDA $0.5 $0.4 $0.2 $3.7 $2.6 23
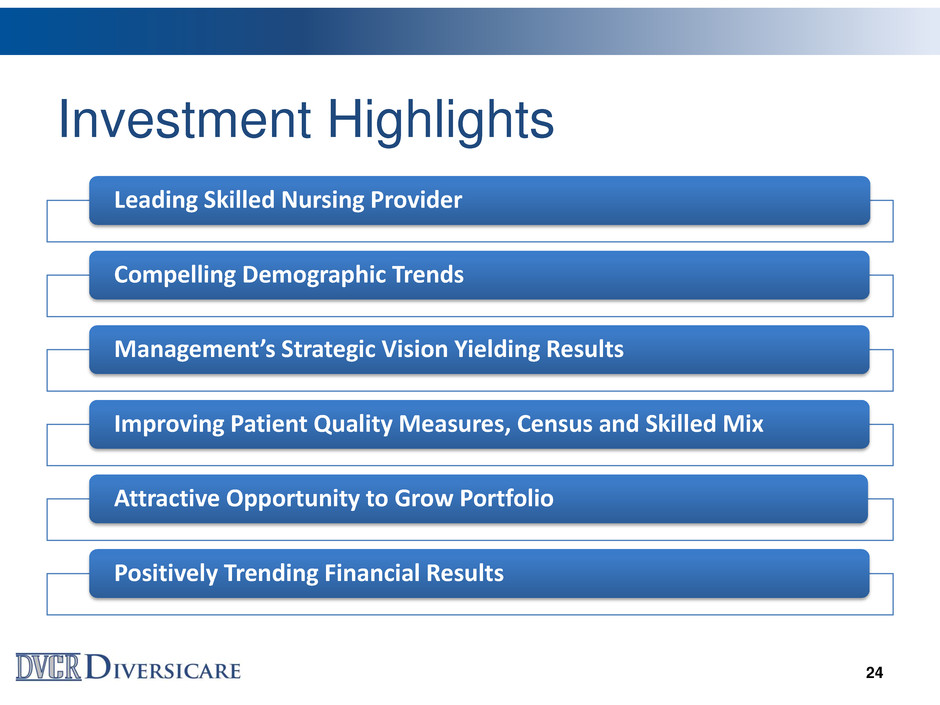
Investment Highlights Leading Skilled Nursing Provider Compelling Demographic Trends Management’s Strategic Vision Yielding Results Improving Patient Quality Measures, Census and Skilled Mix Attractive Opportunity to Grow Portfolio Positively Trending Financial Results 24
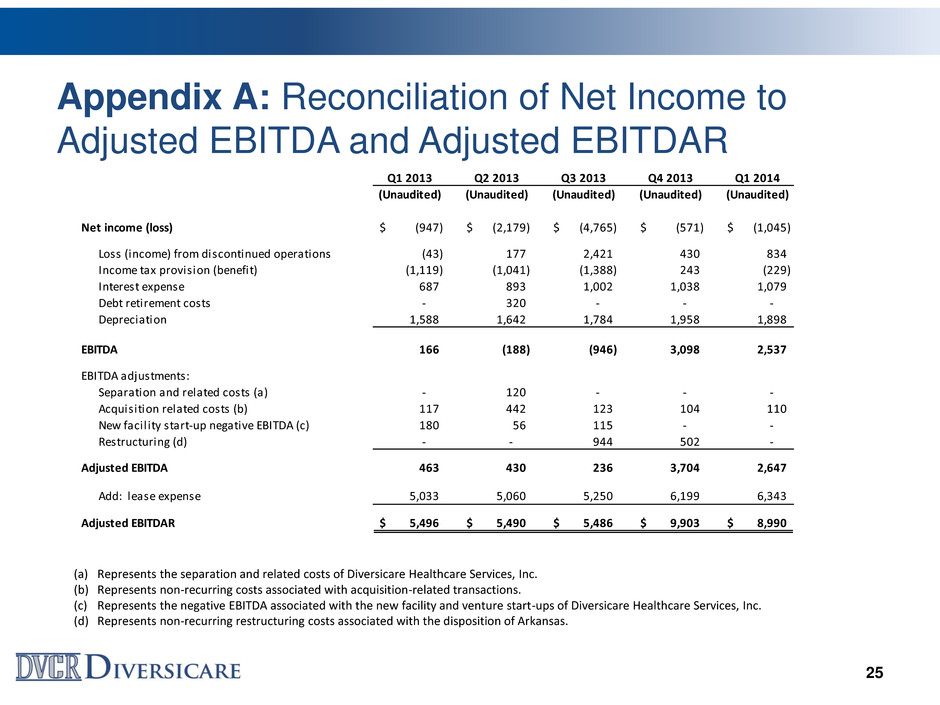
Appendix A: Reconciliation of Net Income to Adjusted EBITDA and Adjusted EBITDAR 25 (a) Represents the separation and related costs of Diversicare Healthcare Services, Inc. (b) Represents non-recurring costs associated with acquisition-related transactions. (c) Represents the negative EBITDA associated with the new facility and venture start-ups of Diversicare Healthcare Services, Inc. (d) Represents non-recurring restructuring costs associated with the disposition of Arkansas. Q1 2013 Q2 2013 Q3 2013 Q4 2013 Q1 2014 (Unaudited) (Unaudited) (Unaudited) (Unaudited) (Unaudited) Net income (loss) (947)$ (2,179)$ (4,765)$ (571)$ (1,045)$ Loss (income) from discontinued operations (43) 177 2,421 430 834 Income tax provision (benefit) (1,119) (1,041) (1,388) 243 (229) Interest expense 687 893 1,002 1,038 1,079 Debt retirement costs - 320 - - - Depreciation 1,588 1,642 1,784 1,958 1,898 EBITDA 166 (188) (946) 3,098 2,537 EBITDA adjustments: Separation and related costs (a) - 120 - - - Acquisition related costs (b) 117 442 123 104 110 New facility start-up negative EBITDA (c) 180 56 115 - - Restructuring (d) - - 944 502 - Adjusted EBITDA 463 430 236 3,704 2,647 Add: lease expense 5,033 5,060 5,250 6,199 6,343 Adjusted EBITDAR 5,496$ 5,490$ 5,486$ 9,903$ 8,990$
